
A three-dimensional microfluidic model based on dielectrophoresis for the separation of blood cells
Hongyang
Xu
 ,
Tao
He
,
Yonghui
Yang
and
Xue-Bo
Chen
*
,
Tao
He
,
Yonghui
Yang
and
Xue-Bo
Chen
*
School of Electronic and Information Engineering, University of Science and Technology Liaoning, Anshan 114051, China. E-mail: xuebochen@126.com
First published on 21st May 2025
Abstract
In recent years, cell-based micro-robots have shown great potential in the biomedical field due to their excellent biocompatibility and precise targeting ability. The primary task for in-depth research on micro-robots based on different cell types is to effectively separate them from the blood. This paper proposes a microfluidic model based on dielectrophoresis for cell separation to achieve the separation of platelets, red blood cells, and white blood cells in the blood. Firstly, a three-dimensional microfluidic model was established using COMSOL Multiphysics software, with electrodes arranged alternately positive and negative to construct the model, and the grid independence was tested to ensure the accuracy and reliability of the proposed model. Secondly, using the dielectric properties of blood cells, an effective separation of various blood cells in the blood was achieved through a size-based hierarchical method. The simulation results showed that blood cells of different sizes had different responses to negative dielectrophoretic forces, causing them to flow out from different exits, thus achieving efficient cell separation. Finally, to further optimize the model, different electrode shapes were designed, and their respective electric field distributions and particle trajectories in the microfluidic channels were calculated. Through quantitative comparative analysis, the separation efficiency and purity of different models were compared, and an effective microfluidic model for separating blood cells was selected, which could further improve the separation efficiency of platelets.
1 Introduction
With the rapid development of micro–nano technology, micro-machines, as a hot field in interdisciplinary subjects, have achieved remarkable results. As a new type of intelligent microsystem, after decades of development, micro-robots have a broad application prospect in the fields of targeted therapy,1,2 minimally invasive surgery,3,4 and fine manipulation5 in biomedicine. Compared to traditional medical robot systems, micro-robots may be able to reach narrower and more vulnerable areas of the human body with minimal damage. Due to the small size of micro-robots, traditional methods are greatly limited and hindered in terms of power, actuation, and communication.6 The free movement of micro-robots can be powered by various sources, such as photothermal driving,7 magnetic driving,8 chemical driving,9 and biological driving.10 Although driving methods such as magnetic, photothermal, and chemical driving have precise targeting ability, strong driving force, non-contact control, and high penetration into tissues and the body, they also have some drawbacks, such as irreversible physical damage to organisms or poor biocompatibility. However, cell-based micro-robots driven by biological forces exhibit excellent biocompatibility and precise targeting ability, and the advantages of using human cells are very obvious. Firstly, micro-robots composed of the human body's own cells do not trigger an immune rejection response during the treatment process because they originate from the human body. Secondly, these micro-robots naturally decompose after completing their mission, lasting only a few weeks, and can be easily absorbed and metabolized by the body. These micro-robots are made from biological cells or microorganisms and synthetic materials,11 such as platelets,12 red blood cells,13 white blood cells,14 sperm,10 and others. The combination of synthetic nanomaterials and natural cells endows microrobots with the ability to move efficiently in complex biological fluid environments, and simultaneously exhibits diverse biological functions based on the different origins of the cells. Cell-based micro-robots usually require specific types of cells as carriers or construction units. Isolating target cells with high purity and activity from complex biological samples, such as blood, is a key prerequisite for preparing micro-robots with precise functions. For example, in cell-based micro-robots for targeted drug delivery, platelets are often used as ideal carrier cells due to their rich receptors on the surface and natural clotting properties. Red blood cells (RBCs) are protected from macrophage immune attacks due to the expression of self-markers (such as CD47) on the cell membrane.10 White blood cells can clear foreign substances in the blood and other tissues, such as bacteria, viruses, parasites, and other pathogens, as well as debris from necrotic tissues. Additionally, white blood cells can actively navigate to inflammatory sites, penetrate biological barriers, and infiltrate tissues. Accurately and efficiently separating these blood cells from the blood is the basis for ensuring the subsequent construction and functional realization of micro-robots. Based on these characteristics, robots loaded with various therapeutic agents and nanoparticles can be developed using various surface functionalization methods.11To independently develop these micro-robots, the first step is to efficiently isolate them from the complex blood environment. High-purity target cells can significantly enhance the performance stability and functional accuracy of micro-robots. For instance, in tumor-targeted therapy, if the isolated cells are impure, it might affect the micro-robots’ ability to identify and target tumor cells, reducing the therapeutic effectiveness and potentially causing side effects. This is where cell separation techniques come into play. The cultivation and separation of blood cells play a crucial role in cell biology research and various diagnostic and therapeutic processes. For cell separation, the most direct method is to classify them based on their physical properties such as size, density, and shape. In addition to this, precise and controllable external energy sources such as electric fields or magnetic fields are required, including techniques like dielectrophoresis,15–17 magnetophoresis,18,19 and acoustophoresis.20 Dielectrophoresis-based separation technology has become an important means of particle manipulation and separation due to its low cost and rapid separation advantages.21 Dielectrophoresis (DEP) is a phenomenon where a force is applied to a particle in an uneven electric field, causing the particle to move. The resulting dielectrophoretic force selectively separates blood cells from a heterogeneous population by utilizing their size and electrical properties. When particles are exposed to an electric field, particles of different sizes and electrical properties experience different electric fields on each particle. If the dielectric constant of the medium is higher than that of the particle, the particle is repelled from the high-field strength area. Conversely, it will aggregate towards the high-field strength area. The former phenomenon is called negative DEP (nDEP), and the latter is called positive DEP (pDEP). Typically, DEP is used to separate cells flowing through a channel by carefully designing the electrode configuration, channel design, applied potential, and flow rate. This paper uses negative dielectrophoresis to separate blood cells. Zhang and Chen,21 Aliverdinia et al.22 proposed a dielectrophoretic microfluidic device for particle separation that utilizes dielectric properties to separate red blood cells and platelets based on size. They also studied the effects of different wake channel shapes and electrode shapes on the efficiency of blood cell separation. Ali and Park23 designed a microfluidic device with three outlets for the continuous separation of blood cells and investigated the effects of different outlet designs, the number of inlet units (population ratio), and buffer flow rate on the efficiency of blood cell separation. BI et al.24 used negative dielectrophoresis technology to establish a multi-particle separation simulation model with a novel electrode structure that can simultaneously separate multiple types of cells, and verified the separation efficiency of microscale particle mixtures (3 μm, 7 μm, 15 μm, 20 μm, 25 μm) under different electrode shapes, electrode potentials, inlet velocities, and channel widths. Tada et al.25 has introduced a cutting-edge dielectrophoresis (DEP) cell separation system featuring a parallel plate channel design. This innovative system enhances cell separation by generating a non-uniform alternating current electric field within the flow chamber, achieving an impressive separation efficiency of about 98%. Derakhshan et al.26 has developed a novel separation channel model with two distinct sections, specifically designed for the effective isolation of red blood cells (RBCs), white blood cells (WBCs), and MCF-7 breast cancer cells. Through systematic parameter adjustment, the optimal settings for efficient separation have been identified. Nguyen et al.27 has designed an advanced dielectrophoresis-based microchip, capable of continuously separating circulating tumor cells (CTCs) from a complex blood cell milieu, including white blood cells (WBCs), red blood cells (RBCs), and platelets (PLTs), while maintaining recovery and purity factors at 100%. Nguyen et al.28 have developed a novel microfluidic device that integrates a specialized dielectrophoresis setup. This setup, known as FEC-DEP, is designed to effectively isolate circulating tumor cells (CTCs) from various components of blood, achieving an impressive separation efficiency of nearly 80%. In a separate study, Neogi et al.29 designed a grooved microchannel that can fully separate CTCs from red blood cells (RBCs), white blood cells (WBCs), and platelets (PLTs) in blood. Through experimental analysis, they determined the optimal voltage and electrode count for maximum separation efficiency. Additionally, Ruyssen et al.30 have proposed a groundbreaking concept for a membrane-free dielectrophoresis (DEP) micro-separation technique suitable for large-scale micro–nano processing. They placed two pairs of crossed electrodes at the top and bottom of a microfluidic channel, successfully demonstrating the technique's effectiveness by separating a mixture of polystyrene particles of varying sizes using dielectrophoretic forces.
Two-dimensional and three-dimensional microfluidic models have gained significant attention in the field of cell separation simulations. While 2D models are popular for their simplicity and efficiency, 3D models are becoming more prevalent. The challenge of enhancing cell separation efficiency remains a pressing issue. This study leverages the distinct dielectric constants and conductivity of various blood cells, utilizing dielectrophoresis to separate different blood cells based on size in a 3D microfluidic model, thereby improving separation efficiency. The research steps include: constructing a microfluidic vascular model with multiple bifurcations using COMSOL multi-physics software, designing the model's electrodes with alternating positive and negative poles, using dielectrophoretic forces to guide blood cells to different exits for separation based on the boundary element method, and discussing the impact of electrode shapes on separation efficiency and purity in the microfluidic model.
2 Theoretical concepts
This paper explores how particles behave when an electric field is applied. COMSOL Multiphysics, with its finite element method(FEM), is great at dealing with intricate shapes and boundary conditions. It breaks down the area of study into tiny pieces and makes educated guesses to solve the problem. The boundary element method (BEM), on the other hand, simplifies things by focusing on the edges, which is especially useful when looking at how cells interact with their surroundings in an electric field. It's also more precise for certain tricky scenarios and can be faster and less demanding in terms of computer power. In our study, we've combined these two methods to get the best of both worlds: using FEM for the tricky parts and BEM for areas that go on forever or are the same everywhere. With BEM, we can figure out what's happening with the flow and the electric field at the same time, especially where there are solid particles involved.This paper uses creeping flow with a small Reynolds number (Re < 1) to simulate the flow of human blood. In this hydrodynamic environment, the flow characteristics of blood are mainly influenced by viscous forces, while the effect of inertial forces is relatively weak and can be neglected. This feature results in a significant reduction in the impact of the inertial term on blood flow simulation in the Navier–Stokes equations, with the viscous term becoming the dominant factor. The Navier–Stokes equations are one of the fundamental equations in fluid mechanics that describe fluid motion, incorporating principles of conservation of momentum and energy. In the creeping flow model, the main focus is on the conservation of momentum, which allows for the simplification of the Navier–Stokes equations by neglecting the inertial term. Based on this, the following governing equation applicable to Stokes flow can be obtained:31
| ▽[−pI + μ(▽ν + (▽ν)T)] = 0 | (1) |
This equation mainly describes the motion state of a fluid when subjected to external forces, where p represents the pressure of the fluid, ν is the velocity of the fluid, and μ is the dynamic viscosity of the fluid. At the same time, to ensure mass conservation, it is also necessary to consider the continuity equation:32
| ρ▽(ν) = 0 | (2) |
| ▽J = Qj,v | (3) |
| J = σE + Je | (4) |
| E = −▽V | (5) |
 | (6) |
| Fd = 6πμR(ν − νe) | (7) |
 | (8) |
| FDEP = 2πR3ε0εmRe[K(ω)]▽|E|2 | (9) |
 | (10) |
In this equation, ε0 and εm are the vacuum permittivity and the dielectric constant of the suspension medium, respectively. E represents the root mean square electric field strength, and Re[K(ω)] denotes the real part of the Clausius–Mossotti (CM) factor. ω is the frequency of the applied electric field. ε and σ are the dielectric constant and electrical conductivity of the material.  and
and  are the complex dielectric constants of the suspension medium and the particle, respectively. When a particle is placed in a medium with a different dielectric constant, the presence of an electric field causes charge separation on the particle's surface, resulting in dielectrophoretic force. The magnitude and direction of this force depend on the particle's dielectric properties, the strength and distribution of the electric field, as well as the particle's shape and size. The sign of the CM factor represents the polarizability between the particle and the carrier liquid, and Re[K(ω)] varies from −0.5 to 1.16 When εp > εm, Re[K(ω)] is positive, and the particle moves towards areas of high electric field strength, influenced by positive dielectrophoresis (pDEP). When εp < εm, Re[K(ω)] is negative, and the particle moves towards areas of low electric field strength, influenced by negative dielectrophoresis (nDEP). The separation efficiency and purity are important indicators for evaluating the performance of microfluidic models, and the specific formulas for the separation efficiency Se(c) and purity Sp(c) of cells can be expressed as:
 | (11) |
 | (12) |
In these formulas, C1 represents the number of the target cells in the particle counter of the fluid particle tracking physical field at the target outlet, A1 denotes the total number of the cells of this type flowing in from the inlet, and A2 represents the total number of cells at the target outlet for this cell type.
3 Model design
This paper uses COMSOL Multiphysics 6.2, a multi-physics software, to establish a microfluidic separation model for isolating cells in blood through a three-dimensional model design. Three physical fields—electric current, peristaltic flow, and particle tracking in fluid flow—are used to construct the model. The flow field and electric field distributions within the channel are solved in the laminar flow module and the AC/DC module, respectively, with the Navier–Stokes equation and the Laplace equation as the control equations. It is assumed that the fluid is both incompressible and non-turbulent. The solution steps of the model are shown in Fig. 1. | ||
| Fig. 1 Model solution steps. | ||
3.1 Microfluidic separation model
The basic three-dimensional geometric shape of the microfluidic separation model established in this paper is shown in Fig. 2(a). The model is made up of three components: two inlets, a parallel separation channel equipped with electrodes, and three outlets. The inlets are positioned at a 60-degree angle to each other, and the circular channel measures 40 micrometers in diameter. Inlet 1 is used for the input of blood cells and fluid, and the fluid velocity is set to 100 μm s−1; Inlet 2 is only for the input of the fluid, and the fluid velocity is set to 900 μm s−1. Under this configuration, due to the significantly higher flow rate at Inlet 2 compared to Inlet 1, the blood cells introduced through Inlet 1 are directed to the upper part of the microfluidic channel, namely the region near the chip electrodes. This design allows for a more pronounced observation of the separation effects of different types of cells when dielectrophoretic force is applied, thereby enhancing the accuracy and observability of the experiment. For the electrode setup in the separation channel, electrodes are alternately arranged with a spacing of 60 μm to ensure a uniform distribution of dielectrophoretic forces. The surface potential of the electrodes is configured alternately as +10 V and −10 V. The electric field frequency and fluid conductivity are set according to the ideal negative dielectrophoresis parameters described by Zhang and Chen,21 with a frequency of 100 kHz and a fluid conductivity of 55 ms m−1. Finally, platelets, red blood cells, and white blood cells will flow out sequentially from the upper, middle, and lower outlets of the model. Based on the designed model, mesh generation is performed, as shown in Fig. 2(b), and the mesh parameters are listed in Table 1.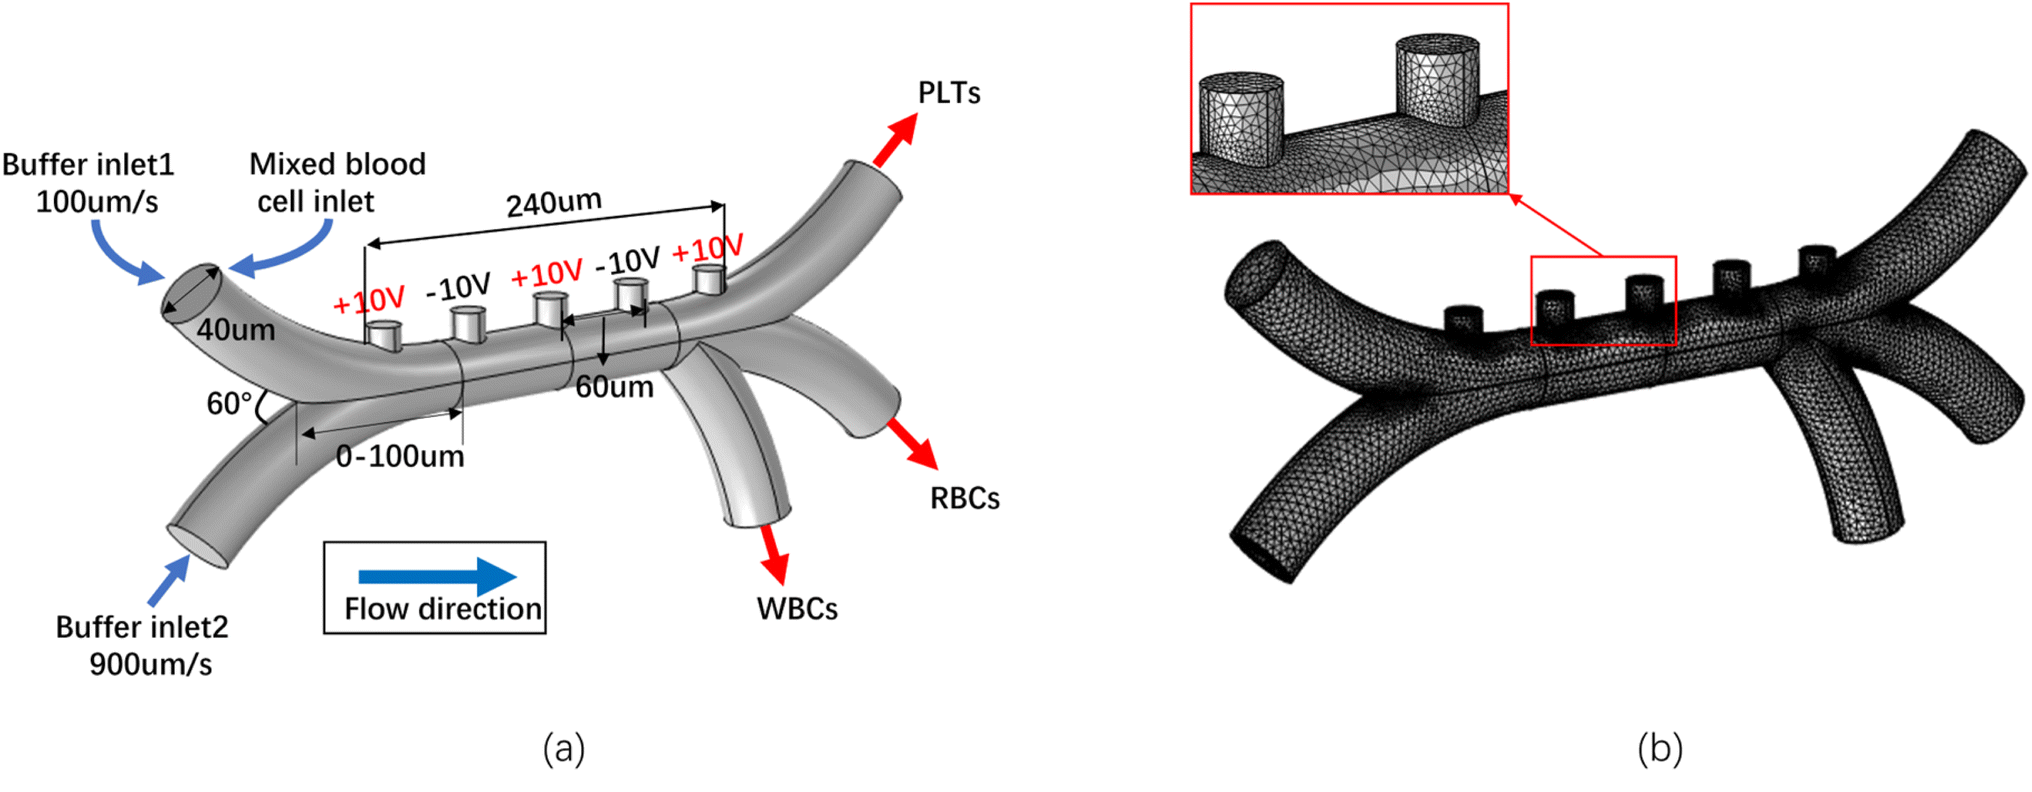 | ||
| Fig. 2 Microfluidic separation model. (a) 3D model, (b) model mesh. | ||
| Number of elements | Minimum element quality | Average element quality | Element volume ratio |
|---|---|---|---|
235![[thin space (1/6-em)]](https://www.rsc.org/images/entities/char_2009.gif) 270 270 |
0.1148 | 0.6875 | 7.872 × 10⁻⁴ |
To verify whether the number of grids has an impact on the distribution of the external field, a grid independence test must be conducted before numerical simulations of cell separation. This paper discretizes the microfluidic separation model using triangular, tetrahedral, and boundary layer grid cells. The focus of the numerical simulation of cell separation is on the separation effect of particles, which is closely related to the electric field distribution and fluid velocity in the microchannel. Therefore, this paper performs grid independence verification by analyzing the electric field distribution and velocity distribution at specified positions of the model within the range of 0–100 μm under four different grid numbers, and the results are shown in Fig. 3. As shown in Fig. 3(a), the number of meshes has a minor effect on the simulation results of the electric field distribution within the channel. However, the number of meshes does have some effect on fluid velocity. As depicted in Fig. 3(b), there are significant differences in the flow field distribution with different mesh numbers. However, the growth trends of the velocity fields corresponding to different grid numbers are consistent. Moreover, as the number of grids increases, the velocity fields corresponding to different grid numbers gradually converge. Therefore, considering the computational capability of the computer, as well as time and simulation errors, this study ultimately decided to use a grid division with 235270 units for the simulation. This choice strikes a balance between computational efficiency and accuracy, ensuring reliable results while optimizing resource utilization.
 | ||
| Fig. 3 The results of the grid independence test. (a) The influence of grid density on the electric field, (b) the influence of grid density on the flow field. | ||
3.2 Fluid environment and blood cell modeling
Regarding the parameter settings for the fluid environment, the density and dynamic viscosity are set to ρ = 1000 kg m−3 and μ = 0.001 Pa s, respectively, to simulate the human blood environment through peristaltic flow. The parameters for establishing the blood cell model refer to the cell parameters set in Zhang and Chen,21 as shown in Table 2, including the radius of the cell, conductivity, relative permittivity, and the thickness of the cell membrane, conductivity, and relative permittivity.| Cell | Radius (μm) | Conductivity (ms m−1) | Relative permittivity | Conductivity of the shell (ms m−1) | Shell's relative permittivity | Shell thickness (nm) |
|---|---|---|---|---|---|---|
| PLTs | 0.9 | 0.31 | 50 | 1 × 10⁻⁶ | 6 | 8 |
| RBCs | 2.5 | 0.38 | 59 | 1 × 10⁻⁶ | 4.44 | 9 |
| WBCs | 4.7 | 0.487 | 136 | 7.25 × 10⁻⁶ | 10.3 | 6.5 |
3.3 Boundary conditions
In this study, we utilized COMSOL's laminar flow module and AC/DC module to calculate the distribution of flow and electric fields within the channel. We also simulated the trajectory of blood cells by incorporating a fluid particle tracking feature. Here's how we set up the boundary conditions for the flow field:(1) The microchannel walls are designated as non-slip boundaries.
(2) The inlet flow rates are managed separately through the left and right inlets, at 100 μm s−1 and 900 μm s−1, respectively.
(3) The outlet fluid pressure is controlled and set to atmospheric pressure, which is P = 0.
For the electric field, the boundary conditions are:
(1) The microchannel's walls, inlet, and outlet all use adiabatic boundary conditions.
(2) The electrode surface potential is maintained at a constant, alternating between +10 V and −10 V.
As for the fluid particle tracking, the boundary conditions include:
(1) The microfluidic channel wall condition is set to a frozen state.
(2) The initial velocity of the inlet fluid is based on the velocity field of the creeping flow.
(3) The resistance adheres to Stokes' law.
(4) Considering that the shape of the cell will have a certain effect on the trajectory in practice, a non-slip boundary condition is set for the particles.
4 Analysis of simulation results
Based on the established microfluidic separation model, this paper treats the cells to be separated as particles for numerical simulation, verifies the correctness of the model, and deeply analyzes the values of physical fields such as electric and flow fields and the offset trajectory of cell particles. At the same time, for microfluidic models with different electrode shapes (including cylindrical, conical, spherical, and rectangular), the separation efficiency and purity of human blood cells are discussed. This research on cell separation integrates laminar flow and electric field interface theory, aiming to explore the motion trajectories of particles with different sizes in microchannels. The study uses steady-state solvers, frequency-domain solvers, and time-domain solvers to solve the flow field, electric field solutions, and particle trajectories, respectively. Finally, the motion of PLT, RBC, and WBC in microchannels is tracked and calculated through particle tracking interface.4.1 Model validation
In order to verify the accuracy of the numerical model used in this paper, the trajectory results of platelets, red blood cells and white blood cells obtained by numerical simulation were compared with the numerical simulation results of Zhang and Chen,35 and the separation efficiency of platelets was emphatically studied. In this paper, the current and voltage parameters used by Piacentini et al.36 in cell isolation experiments, AC frequency of 100 kHz and electrode voltage of 10 V, are used in this paper, and the final numerical simulation results are compared as shown in Fig. 4. The comparison results show that the particle trajectories obtained from numerical calculations are highly consistent with those observed in experiments, thus confirming the accuracy of the numerical method used in this study. The close overlap between the simulated trajectories (dashed lines) and the actual flow trajectories of the cells (dots) further indicates a high degree of consistency between theoretical simulations and experimental data.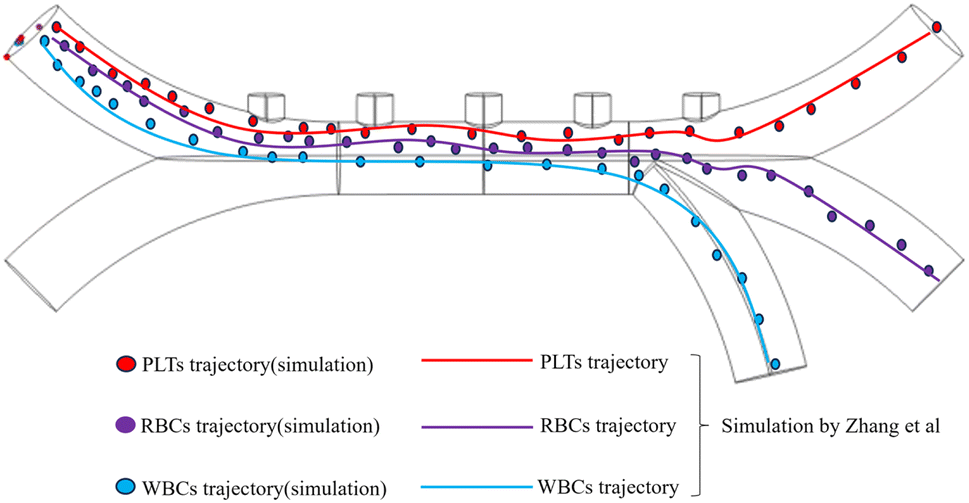 | ||
| Fig. 4 Comparison of the movement trajectories of blood cells. | ||
4.2 Analysis of flow field and electric field
Considering that different blood vessel diameters correspond to different blood flow rates, the flow rate at inlet one is set to 100 μm s−1, and the flow rate at inlet two is set to 900 μm s−1. This difference in flow rates helps blood cells form specific flow patterns during movement, and also pushes different types of blood cells towards the upper wall of the tube. This way, when dielectrophoretic forces are applied, the separation effect of different cells can be more clearly observed. The numerical values of fluid velocity and pressure within the microfluidic model are shown in Fig. 5. In Fig. 5(a), the flow velocity is highest at entrance two, slower near the walls of the main vessel, and faster in the center. Fig. 5(b) indicates that higher flow velocities correlate with greater pressure, this may be due to the fact that in low Reynolds number flows, viscous forces dominate and the high-pressure region pushes the fluid through viscous resistance, resulting in a high-velocity region spatially overlapping with the high-pressure region. Which will cause cells to stagnate due to excessive pressure when flowing through these positions. | ||
| Fig. 5 Simulation of flow field and pressure. (a) Velocity distribution, (b) pressure distribution. | ||
The simulation results of the potential and electric field magnitude in the corresponding microfluidic model are shown in Fig. 6. In Fig. 6(a), we can clearly observe that the potential distribution shows significant changes near the +10 V and −10 V electrodes, reaching maximum and minimum values respectively.
 | ||
| Fig. 6 Simulation of electric potential and electric field magnitude. (a) Distribution of electric potential, (b) distribution of electric field strength. | ||
This non-uniformity of the potential distribution is a direct manifestation of charge separation and migration phenomena in microfluidic systems. Fig. 6(b) reveals the detailed distribution of the electric field. The electric field strength peaks near the electrodes, indicating a strong attraction or repulsion of charges by the electrode surface. As the distance from the electrodes increases, the electric field strength gradually weakens. Moreover, the distribution of electric field lines visually presents the direction and intensity changes of the electric field.
4.3 Particle trajectory analysis
When analyzing the trajectory of cells, they are assumed to be point masses, particles without volume or internal structure. This method is suitable not only for studying the behavior of individual small particles but also for investigating the behavior of multiple small particles in the system. In this approach, particles are described by their position, momentum, and other attributes such as mass and charge. The advantage of this method is that it can accurately describe the trajectory of individual particles and effectively simulate the interaction and movement patterns of multiple particles under the action of an electric field. In the absence of dielectrophoretic forces, the three types of blood cells are completely under the influence of fluid drag. Due to the larger fluid flow rate at inlet two, most of the cell particles are pushed out through outlet one by drag, a few cell particles flow into other outlets, and no separation phenomenon occurs between them. This phenomenon indicates that under natural flow conditions, the movement trajectory of cell particles in the fluid is mainly affected by hydrodynamic factors, making it difficult to achieve effective separation.To achieve precise separation of different cells, dielectrophoretic forces are applied in the microfluidic channel to make the mixed cells deviate along different trajectories, thus separating cells that were originally mixed together according to their physical properties. Using the particle tracking module in COMSOL, it is possible to predict the trajectory of particles in the channel. By solving for the electric and flow fields, the dielectrophoretic and Stokes forces applied to the particles are obtained to control the trajectory deviation of blood cell particles, and a slip-free boundary condition is added to these cell particles. Cells of different sizes have different response characteristics in the electric field, allowing them to be effectively guided to their respective channels under the combined action of fluid drag and dielectrophoretic forces. The particle trajectories before and after the application of dielectrophoretic forces are shown in Fig. 7. At the entrance 1, three types of mixed cell particles are injected. When dielectrophoretic force is applied, WBC, due to its larger particle size, is separated from the exit 3 under the action of dielectrophoretic force. While the relatively smaller PLT and RBC particles flow out from exits 1 and 2, respectively. In this way, different blood cells in the microfluid can flow out from different channels, achieving the purpose of cell separation. Considering the differential response of cells of different sizes to dielectrophoretic force, this paper analyzes the magnitude of the dielectrophoretic force exerted on the three types of blood cells in the X, Y, and Z directions in the microfluidic channel, with relevant data shown in Fig. 8. The X-axis direction corresponds to the top and bottom of the model, the Y-axis direction corresponds to the main channel direction of the model, and the Z-axis direction corresponds to the lateral cross-section direction of the model.
 | ||
| Fig. 7 Cell trajectory shifts (a) without dielectrophoretic force (b) after applying dielectrophoretic force. | ||
 | ||
| Fig. 8 Dielectrophoretic forces exerted on different cells in the X, Y, and Z directions. (a) Dielectrophoretic forces on PLT, (b) dielectrophoretic forces on RBC, (c) dielectrophoretic forces on WBC. | ||
From Fig. 8(c), it can be observed that the larger particle-sized WBC experiences greater dielectrophoretic forces in the X-axis and Y-axis directions when flowing into the main channel, causing its trajectory to shift downwards and ultimately leading it to flow out from exit three. From Fig. 8(a) and (b), it can be deduced that the smaller particle-sized PLT and RBC experience smaller dielectrophoretic forces in the X-axis direction, with fluctuating changes in the middle part of the channel. This results in their trajectory deviation angles not being significant, causing them to be separated from exits one and two. This outcome further indicates that the combination of the boundary element method and dielectrophoretic forces can not only effectively handle cells with large particle size differences but also achieve precise separation of smaller particle-sized cell particles.
4.4 Electrode shape influence analysis
The research of Zhang and Chen21 indicates that in two-dimensional numerical simulations, the separation efficiency of cells using dielectrophoresis is not only related to the magnitude of the voltage applied to the electrodes and the size of the particles themselves, but also significantly to the shape of the electrodes, because the inhomogeneous electric field on a microfluidic chip is mainly generated by the electrodes, so the shape and distribution of the electrodes have a decisive influence on the distribution of the dielectrophoretic force. However, this has not been verified in three-dimensional microfluidic separation models. While the manufacturing process demands advanced shaping techniques to create various electrode shapes, its successful execution promises microfluidic separation technology that surpasses traditional methods hindered by inefficiency and low purity. This advancement could revolutionize the medical field by offering a more dependable and efficient way to separate cells. Therefore, additional conical, spherical, and cuboidal electrodes were designed to compare the separation efficiency under different electrode conditions. Cell separation was performed under different electrode shapes, and the comparison of cell separation trajectories is shown in Fig. 9. It is clearly visible from the Fig. 9 that the cell deviation trajectories under the conical, spherical, and cuboidal electrodes are not as ideal as those under the cylindrical electrode. To more clearly compare the advantages and disadvantages of different electrode shapes in terms of separation efficiency and purity, 600 of each cell type were injected at the inlet, and the particle counter at the three outlets of the microfluidic separation model separately counted the number of separated cells. By substituting these values into eqn (11) and (12), the separation efficiency and purity of various cells were calculated. Based on the particle data tracked at each outlet in the fluid flow particle tracking physics field, a histogram was drawn as shown in Fig. 10. | ||
| Fig. 9 Separation trajectories of cell particles under different electrode shapes. (a) Cylindrical electrode, (b) conical electrode, (c) spherical electrode, (d) cuboidal electrode. | ||
 | ||
| Fig. 10 Comparison of separation efficiency and purity of microfluidic separation models with different electrode shapes. (a) Separation efficiency, (b) separation purity. | ||
The results indicate that among the tested electrode shapes, the cylindrical electrode microfluidic model performs the best in terms of cell separation efficiency and purity. The other three electrode shapes show relatively poorer separation effects. This is because different electrode shapes generate different electric fields, resulting in different distribution of dielectrophoretic forces, which affects the separation efficiency of individual cells. Additionally, to highlight the effectiveness of the microfluidic separation model designed in this paper for blood cell separation, the simulation results of the cylindrical electrode microfluidic model for cell separation were compared with the experimental results of Piacentini et al.36. Piacentini's microfluidic separation model achieved a separation efficiency of 98.9% for platelets, while the conical electrode microfluidic model designed in this paper achieved a separation efficiency as high as 99.2% for platelets, which also verifies the correctness of the model and the research methods adopted in this paper.
5 Conclusions
This paper first theoretically analyzes the fundamental principles of dielectrophoresis (DEP) in cell separation. Building on this, combined with the point particle method and DEP theory, this study designs a microfluidic model with alternately arranged positive and negative electrodes, and performs size-based separation of platelets, red blood cells, and spherical white blood cells in blood. Through numerical simulation analysis, this paper elaborates on the flow field, electric field, and particle trajectories within the microfluidic channel, thereby revealing the microscopic mechanism of cell separation and the necessary external field conditions. To further optimize the microfluidic model, the effects of four different three-dimensional shapes—cylindrical, conical, spherical, and cuboidal electrodes—on the separation efficiency and purity of blood cells are compared. The research results show that the cylindrical 3D microfluidic model designed in this paper performs well in cell separation, further improving the separation efficiency and purity of platelets. However, in the 3D microfluidic model, some cells may aggregate during the separation process, which could affect cell separation. Future research will investigate whether the aggregation of these cells affects their separation effectiveness.Data availability
The data that support the findings of this study are available in the manuscript. Additional data are available from the corresponding author on reasonable request.Author contributions
Hongyang Xu: formal analysis (lead); data curation (lead); methodology (lead); validation (lead); visualization (lead); writing – original draft (lead); writing – review & editing (supporting); Tao He: conceptualization (supporting); methodology (supporting); writing – review & editing (supporting); Yonghui Yang: resources (supporting); writing – review & editing (supporting); Xuebo Chen: writing – review & editing (lead); supervision (lead).Conflicts of interest
The authors have no conflicts to disclose.Acknowledgements
This work was supported by the National Natural Science Foundation of China, under grant number 71571091 and 71771112.Notes and references
- H. Zhou, C. C. Mayorga-Martinez, S. Pané, L. Zhang and M. Pumera, Chem. Rev., 2021, 121, 4999–5041 CrossRef CAS PubMed
.
- G. Go, S.-G. Jeong, A. Yoo, J. Han, B. Kang, S. Kim and K. T. Nguyen,
et al.
, Sci. Robot., 2020, 5, eaay6626 CrossRef PubMed
- S. Lee, S. Lee, S. Kim, C.-H. Yoon, H.-J. Park, J.-Y. Kim and H. Choi, Sci. Rep., 2018, 8, 3691 CrossRef PubMed
- J. Vyskočil, C. Mayorga-Martinez, E. Jablonská, F. Novotný, T. Ruml and M. Pumera, ACS Nano, 2020, 14, 8247–8256 CrossRef PubMed
- D. Loganathan, C.-L. Hsieh, B.-E. Shi, Y.-H. Lu and C.-Y. Chen, Adv. Mater. Technol., 2022, 2201073 Search PubMed
- S. Chowdhury, W. Jing and D. J. Cappelleri, J. Micro-Bio Robot., 2015, 10, 1–11 CrossRef
- Y. Hou, H. Wang, R. Fu, X. Wang, J. Yu, S. Zhang, Q. Huang, Y. Sun and T. Fukuda, Lab Chip, 2023, 23, 848–868 RSC
- H. Shen, S. Cai, Z. Wang, Z. Ge and W. Yang, Mater. Des., 2023, 227, 111735 CrossRef CAS
- F. Mou, C. Chen, H. Ma, Y. Yin, Q. Wu and J. Guan, Angew. Chem., Int. Ed., 2013, 52, 7208–7212 CrossRef CAS PubMed
- C. K. Schmidt,
et al.
, Nat. Commun., 2020, 11, 5618 Search PubMed
- B. Chen,
et al.
, Small, 2024, 20, 2304607 CrossRef CAS PubMed
- S. Tang,
et al.
, Sci. Robot., 2020, 5, eaba6137 CrossRef PubMed
- T. Li,
et al.
, Sci. Adv., 2023, 9, eadg4501 CrossRef CAS PubMed
- Y. Dai,
et al.
, Small, 2021, 17, 2103986 CrossRef CAS PubMed
- H. A. Pohl, J. Appl. Phys., 1951, 22, 869–871 CrossRef CAS
- H. A. Pohl and J. S. Crane, Biophys. J., 1971, 11, 711–727 CrossRef CAS PubMed
- R. Oladokun,
et al.
, Phys. Fluids, 2024, 36, 121914 CrossRef CAS
- M. K. Baek,
et al.
, IEEE Trans. Appl. Supercond., 2011, 22, 4401604 Search PubMed
- R. Dezhkam,
et al.
, Phys. Fluids, 2024, 36, 102022 Search PubMed
- M. Wu,
et al.
, Microsyst. Nanoeng., 2019, 5, 32 CrossRef PubMed
- Y. Zhang and X. Chen, J. Braz. Soc. Mech. Sci. Eng., 2020, 42, 89 CrossRef CAS
- M. Aliverdinia,
et al.
, AUT J. Electr. Eng., 2024, 56, 377–388 Search PubMed
- H. Ali and C. W. Park, Korea Aust. Rheol. J., 2016, 28, 327–339 CrossRef
- M. Z. A. BI,
et al.
, BioChip J., 2020, 14, 390–404 CrossRef
- S. Tada,
et al.
, Biomicrofluidics, 2017, 11, 064110 Search PubMed
- R. Derakhshan, A. Mahboubidoust and A. Ramiar, Chem. Eng. Process., 2021, 167, 108544 CrossRef CAS
- N.-V. Nguyen, H. V. Manh and N. V. Hieu, Korea Aust. Rheol. J., 2022, 34, 335–347 CrossRef
- T. H. Nguyen,
et al.
, Sci. Rep., 2024, 14, 27627 CrossRef CAS PubMed
- A. Neogi,
et al.
, Phys. Fluids, 2025, 37, 051901 Search PubMed
- N. Ruyssen,
et al.
, J. Phys. D: Appl. Phys., 2025, 58, 185309 CrossRef CAS
- M. Maghazeh,
et al.
, Phys. Fluids, 2022, 34, 082001 Search PubMed
-
G. K. Batchelor, An Introduction to Fluid Dynamics, Cambridge University Press, Cambridge, 2000 Search PubMed
- M. Olfat and E. Kadivar, Microfluid. Nanofluid., 2023, 27, 83 CrossRef CAS
- H. A. Kramers, Physica, 1940, 7, 284–304 Search PubMed
- Y. Zhang and X. Chen, J. Braz. Soc. Mech. Sci. Eng., 2020, 42, 1–11 CrossRef
- N. Piacentini,
et al.
, Biomicrofluidics, 2011, 5, 034122 CrossRef PubMed
| This journal is © The Royal Society of Chemistry 2025 |