
 Open Access Article
 This Open Access Article is licensed under a Creative Commons Attribution-Non Commercial 3.0 Unported Licence
Catalytic glycerol hydrogenolysis to 1,3-propanediol in a gas–solid fluidized bed
Mahesh Edake *a,
Marjan Dalila,
Mohammad Jaber Darabi Mahbouba,
Jean-Luc Duboisb and
Gregory S. Patiencea
*a,
Marjan Dalila,
Mohammad Jaber Darabi Mahbouba,
Jean-Luc Duboisb and
Gregory S. Patiencea
aDepartment of Chemical Engineering, Polytechnique Montréal, Succ. CV Montréal, H3C 3A7 Québec, Canada. E-mail: maheshedake1@gmail.com; Tel: +1 514 243 4062
bARKEMA, 420 Rue d’Estienne d’Orves, 92705 Colombes, France
First published on 13th January 2017
Abstract
Glycerol is a potential feedstock to produce 1,3-propanediol (1,3-PDO), which is a valuable commercial polyester monomer. Here, we report the gas-phase glycerol hydrogenolysis to 1,3-propanediol over Pt/WO3/Al2O3 in a fluidized bed operating above 240 °C and at ambient pressure. Fluidized beds are ideal contactors for this reaction because the heat transfer rates are sufficiently high to vaporize glycerol thereby minimizing its combustion and thermal degradation. The yield of 1,3-PDO approached 14% after 2 h at 260 °C. The major co-products were 1,2-PDO (18%), 1-propanol (28%) and 2-propanol (15%). In the first step, glycerol may dehydrate to acrolein, followed by rehydration to 3-hydroxypropanal and then hydrogenation to 1,3-PDO. The concentrations of the by-products including acrolein, ethylene glycol, propane, and acetone increased with increasing temperature.
1 Introduction
Substituting fossil resources with renewable biomass to produce biofuels, chemicals, and bioplastics remains a priority for many countries.1,2 Glycerol is a by-product of the transesterification of vegetable oils and animal fats to biodiesel.3 As a consequence of government mandates to blend biodiesel with petro-diesel, glycerol has flooded traditional markets. These markets are incapable of absorbing the increased availability, so the price of glycerol has dropped.4 The lower price makes it an attractive feedstock for other chemicals such as 1,2-propanediol (1,2-PDO) and 1,3-propanediol (1,3-PDO).4,51,3-PDO is a monomer for polytrimethylene terephthalate (PTT) together with terephthalic acid, that has unique properties for a wide range of end-uses; it has superior stretching and elastic recovery compared to nylon and that is difficult to achieve with other glycol based polyesters. The global value of the 1,3-PDO market was USD 310 million in 2014 and it is likely to reach USD 620 million by 2021 with a compound annual growth rate of 10.4% between 2014 and 2021.6 Growing demand for PTT for end-uses in polyurethane, cosmetics, personal care and cleaning products7 and increasing consumer preference for bio-based chemicals is expected to drive 1,3-PDO growth.8 It can also be used as a constituent of engine coolants, food and beverages, de-icing fluids, heat-transfer fluids, and unsaturated polyester resins.
In 1990, Shell developed catalytic technology to convert ethylene oxide to PDO, which led to the Corterra® brand of thermoplastic polyesters. DuPont produces Sorona® brand polymers from PDO and terephthalic acid and they also partnered with Tate and Lyle to produce PDO from corn (via a fermentation process) and captured 89% of the total market in 2014.9 Asia Pacific will be the fastest growing market, as many Chinese manufacturers will begin commercial production of 1,3-PDO in the coming years.
Yields of 1,2-PDO from glycerol hydrogenolysis are highest with bifunctional catalysts including a hydrogenation metal and an acid co-catalyst.10–12 Producing 1,3-PDO is more challenging. The ratio of 1,2-PDO/1,3-PDO can be controlled by selectively cleaving the C–O bond of the primary or secondary hydroxyl groups of glycerol, which mostly depend on the type of catalyst. Chaminand13 improved the 1,3-PDO yield at 200 °C and 80 bar adding H2WO4 to Rh/SiO2 in a sulfolane medium. A Pt/WO3/ZrO2 catalyst achieved a 24% yield of 1,3-PDO in 1,3-dimethyl-2-imidazolidinone (DMI) as a solvent at 170 °C and 80 bar.14 A Cu–H4SiW12O40/SiO2 catalyst reached a 27% yield of 1,3-PDO in the vapor phase and aqueous media at 5 bar and 210 °C. The 1,3-PDO yield over Pt deposited on a super-acid sulfated ZrO2 support was 56% at 170 °C and 73 bar.15 Environmental and economic concerns limit the use of organic solvents for a commercially viable process. Water is the ideal solvent for the process as glycerol is obtained in the aqueous phase after the transesterification reaction.16
Heterogeneous noble metals (Ir, Rh, or Pt) combined with oxophilic metals such as Mo, Re, and W catalyse glycerol hydrogenolysis in the aqueous phase.17 Tomishige’s group studied Rh–ReOx/SiO2![[thin space (1/6-em)]](https://www.rsc.org/images/entities/char_2009.gif) 18 and Ir/SiO219 catalytic systems for glycerol hydrogenolysis. H2SO4 modified the structure of the catalyst. The authors reported 38% 1,3-PDO selectivity at 120 °C and 80 bar over Ir/SiO2. However, Re leached. More robust and stable Pt–WO3 based catalytic systems are options to avoid the leaching problems associated with Re. Recently, Priya et al. studied the hydrogenolysis of glycerol to 1,3-PDO over bimetallic catalysts supported on mordenite in the liquid phase. The maximum 1,3-PDO selectivity was 58.5%.20,21 Selectivity of 1,3-PDO reached 32% with Pt/WO3/ZrO2 at 130 °C and 40 bar16 but the highest selectivity to date was 66% (Table 1) with a Pt/WO3/AlOOH catalyst.22 Recent studies show that acrolein in an aqueous solution reacts to form 3-hydroxypropanal in a yield of 20%. Subsequently, hydrogen reacts with this intermediate to form 1,3-PDO.23,24
18 and Ir/SiO219 catalytic systems for glycerol hydrogenolysis. H2SO4 modified the structure of the catalyst. The authors reported 38% 1,3-PDO selectivity at 120 °C and 80 bar over Ir/SiO2. However, Re leached. More robust and stable Pt–WO3 based catalytic systems are options to avoid the leaching problems associated with Re. Recently, Priya et al. studied the hydrogenolysis of glycerol to 1,3-PDO over bimetallic catalysts supported on mordenite in the liquid phase. The maximum 1,3-PDO selectivity was 58.5%.20,21 Selectivity of 1,3-PDO reached 32% with Pt/WO3/ZrO2 at 130 °C and 40 bar16 but the highest selectivity to date was 66% (Table 1) with a Pt/WO3/AlOOH catalyst.22 Recent studies show that acrolein in an aqueous solution reacts to form 3-hydroxypropanal in a yield of 20%. Subsequently, hydrogen reacts with this intermediate to form 1,3-PDO.23,24
| Catalyst | P (bar) | T (°C) | Conv. gly (%) | Yield (%) |
|---|---|---|---|---|
| (Batch mode) | ||||
| Pt/sulfated-ZrO215 |
73 | 170 | 67 | 56 |
| Ir/ReOx–SiO219 |
80 | 120 | 50 | 25 |
| Pt/WO3/ZrO214 |
80 | 170 | 86 | 24 |
| Pt/WO3/ZrO225 |
55 | 170 | 46 | 13 |
| Pt–Re/C26 | 40 | 170 | 45 | 13 |
| Rh–ReOx/SiO210 |
80 | 120 | 79 | 11 |
| Pt/WO3/ZrO2/SiO227 |
55 | 180 | 15 | 7 |
| Rh/C13 | 80 | 180 | 32 | 4 |
| Rh/SiO228 |
80 | 120 | 14 | 1 |
| Pt–Re/C29 | 40 | 170 | 45 | 29 |
| Pt/Al2O330 |
40 | 200 | 49 | 28 |
| Pt/WO3/AlOx22 | 50 | 180 | 100 | 66 |
| Pt/m-WO331 |
55 | 180 | 18 | 39 |
|
||||
| (Fixed bed-continuous) | ||||
| Pt/WO3/ZrO229 |
40 | 130 | 70 | 32 |
| Cu/STA/SiO216 |
50 | 210 | 83 | 27 |
| Pt–STA/ZrO232 |
50 | 180 | 24 | 48 |
| Pt/WO3/Zro216 |
40 | 130 | 70 | 46 |
| Pt/WOx/ZrO28 |
50 | 180 | 54 | 52 |
| Pt/AlPO433 |
1 | 260 | 100 | 35 |
| Ru/MCM34 | 1 | 280 | 62 | 20 |
| Pt/Cu/Mor20 | 1 | 210 | 90 | 58.5 |
| Pt/H-mordenite21 | 1 | 225 | 94.9 | 48.6 |
Homogeneous catalytic processes suffered from a catalyst separation problem and liquid phase heterogeneous catalytic processes need high pressure. We report the gas phase glycerol hydrogenolysis over a Pt/WO3/Al2O3 catalyst in a fluidized bed at 260 °C and at atmospheric pressure, producing 14% 1,3-PDO. Glycerol conversion and PDOs’ selectivity over the Pt/WO3/Al2O3 catalyst are related to the physicochemical properties of the catalyst.
2 Experimental
2.1 Catalyst preparation
We prepared the Pt/WO3/Al2O3 catalyst by an incipient wetness impregnation method. The support was Al2O3 with a particle size ranging from 100 μm to 150 μm, which is suitable to achieve uniform fluidization. Al2O3 (10 g) was impregnated with 20 wt% ammonium metatungstate ((NH4)6(H2W12O40)·nH2O) dissolved in 120 mL deionized water at 25 °C. The paste was dried at 120 °C overnight and then calcined in air at 550 °C at a heating rate of 2 °C min−1 for 4 h. In the second step, we loaded a mass fraction of 2% platinum on a supported tungsten oxide catalyst. The precursor was chloroplatinic acid hydrate, H2PtCl6·xH2O (Sigma Aldrich 99.99%). The catalyst was dried and calcined under the same conditions as during the first step.2.2 Catalyst characterization
An Autosorb-1 system (Quantachrome Instruments) recorded the N2 adsorption/desorption isotherms to give textural properties (surface area, pore volume, and pore size distributions). The samples were degassed at T = 200 °C under vacuum for 3 h. We calculated the specific surface area (SSA) following the multipoint Brunauer–Emmett–Teller (BET) procedure. A Philips Xpert diffractometer measured the X-ray diffraction pattern and crystallinity at room temperature (Cu anode (K = 0.15406 nm) at 50 kV voltage and 40 mA current). It scanned 2θ with a 0.020 step size. We identified the catalyst phases with JCPDS files. A JEOL JSM-7600TFE instrument scanned the surface of the catalysts and produced field emission scanning electron micrographs. We mounted the samples on an aluminum support covered with double-sided adhesive tape. A laser scattering PSD analyzer (LA-950, Horiba) measured the particle size distribution of the catalyst.A TA-Q50 instrument recorded the thermogravimetric curves for the used catalysts. 20 mg samples of the catalysts were loaded onto a 10 μm aluminium crucible. The resolution of the balance was 0.1 μg. Prior to each experiment, we purged the samples with a 40 mL min−1 stream of nitrogen to remove volatiles adsorbed on the catalyst. Simultaneously, the furnace ramped the temperature at 10 °C min−1 up to 300 °C and remained constant for 15 min. We substituted nitrogen with oxygen while heating to 550 °C with the same ramp conditions. A Platinel II thermocouple placed 2 mm above the sample pan monitored the temperature.
We evaluated the catalyst surface acidity by Fourier transform infrared spectroscopy with pyridine as the probe molecule. We placed samples in an infrared quartz cell, with CaF2 windows and evacuated the chamber. Thereafter, we ramped the temperature in air to 150 °C. We degassed the cell at the same temperature for 1 h then introduced pyridine into the cell after returning to ambient temperature. All reported spectra were obtained by subtracting the spectrum of the activated catalyst (after pretreatment but before pyridine adsorption) from those after pyridine adsorption. We characterized the used catalyst after 2 h reaction time to evaluate the effect of time on stream. In this case, we took out the used catalyst from the reactor without regeneration.
2.3 Experimental set-up
An ideal fluidized bed operates isothermally and its radial concentration gradients are smaller than in packed beds. Mixing in micro-fluidized beds is inferior to larger reactors, since the bubbles are smaller, but we consider that the temperature and concentration gradients of these beds are smaller than in comparable fixed bed reactors. Whilst the smaller bubbles in micro-fluidized beds reduce the overall mixing, they also reduce bypassing and for this reason conversion approaches 100% even in shallow beds of 10 mm. Atomizing gases and liquids into fluidized beds increases the heat transfer rates by orders of magnitude in comparison with fixed beds to derive the kinetics.35,36We loaded 2.8 g of the catalyst into a 30 mm long quartz tube with a 7 mm inner diameter housed in a stainless steel tube to operate at high pressure (Fig. 1). A ceramic distributer in the middle of the tube distributed the gas uniformly across the diameter. A furnace heated the reactor to the set point (mostly 260 °C for the initial catalyst reduction with H2). A type-K thermocouple inside the bed monitored its temperature. Bronkhorst mass flow controllers (from 200 mL min−1 to 1000 mL min−1) maintained the gas flow rates. A syringe pump injected the aqueous glycerol solution (from 10% to 50%) via a 1/16′′ tube from the bottom of the reactor. The injector passed through the gas distributor and entered the catalyst bed at a height of 10 mm. Prior to the activity test, pure H2 reduced the catalyst with a flow of 50 mL min−1 at 350 °C for 1 h.
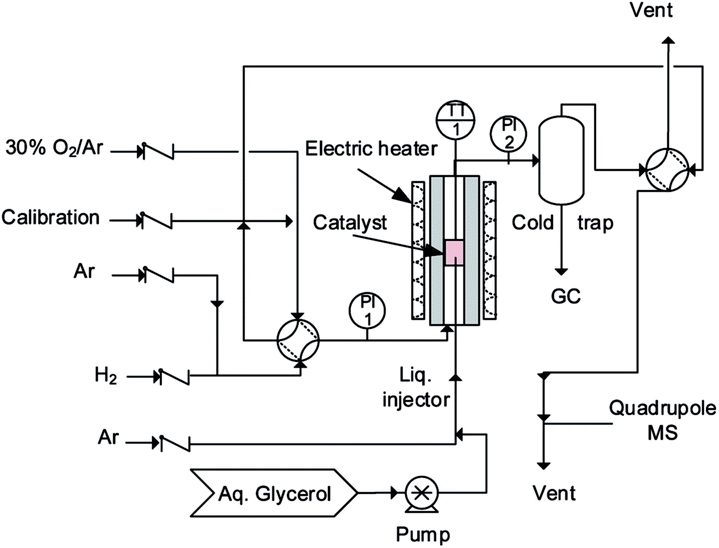 | ||
| Fig. 1 Schematic of the experimental set-up. | ||
80 mL min−1 of H2 fluidized the Pt/WO3/Al2O3 catalyst (2.8 g for each test), while argon atomized the feed solution into the catalyst bed. All experiments lasted for 2 h. 30% oxygen in argon regenerated the catalyst at 550 °C.
Atomizing the liquid into uniform drops is important for operating the fluidized bed: large droplets cause the catalyst to agglomerate and block the injector and/or accumulate on top of the grid.35,37 We examined several gas and liquid flow rates and glycerol concentrations to identify the optimum conditions. The total flow rate (QAr + QH2 + Qglycerol) changed from 140 mL min−1 to 210 mL min−1, which corresponds to a velocity 3 or 5 times that of the minimum fluidization velocity (Umf). To change the feed composition, we manipulated the feed rates of glycerol, hydrogen and Ar (the inert gas).
Therefore to reach the desired H2/glycerol ratio, the mole fractions of the gases were modified according to the following:
– Ar/H2/glycerol/water (%) = 3.2/81/9/1.8 to reach H2/gly = 9.
– Ar/H2/glycerol/water (%) = 3.8/84/6/1.2 to reach H2/gly = 14.
– Ar/H2/glycerol/water (%) = 4/90/5/1 to reach H2/gly = 18.
– Ar/H2/glycerol/water (%) = 3.6/92.4/3.3/0.7 to reach H2/gly = 28.
A quench trapped all the condensables and the mist coming from the effluent gas and these were analyzed off-line using GC, GC-MS and HPLC. The gas products were monitored on-line using MS.
2.4 Product analysis
A Hiden QIC-200 quadrupole mass spectrometer monitored the partial pressure of the reaction products in real time. The mass spectrometer was calibrated before and after the experiment with a mix of Ar, CO, CO2, H2O, CH4 and H2 at two concentrations close to the concentration of the reactor effluent.A Bruker GC (equipped with Hyesep Q, Molsieve 5A with FFAP columns) and a Varian HPLC (Metacarb 87H column) analysed the glycerol, 1,3-PDO, 1,2-PDO, 1-PrOH, 2-PrOH as well as other degradation products.
The conversion of glycerol (Xgly.) as well as selectivities toward products (Sp) were calculated as follows;
 | (1) |
 | (2) |
Where: ningly. and noutgly. are the molar flow rates of glycerol at the reactor’s entrance and exit. In eqn (2), np is the molar stream of each product. zp and zgly. represent the number of carbon atoms of the products and glycerol.
3 Results and discussion
3.1 Physicochemical properties
The surface area of the Al2O3 support was 131 m2 g−1, with an average pore diameter of 56 Å, and total pore volume of 0.27 cm3 g−1. The surface area of the Al2O3 support was the same after Pt impregnation (Table 2). It dropped by 10% after we added WO3 and another 10% after the reaction. The bulk support pore volume dropped from 0.27 cm3 g−1 to 0.20 cm3 g−1 due to tungsten oxide and platinum oxide species and/or coke blocking the Al2O3 pores.| Catalyst | SA, m2 g−1 | PV, cm3 g−1 | Pd, Å |
|---|---|---|---|
| Al2O3 | 131 | 0.27 | 56 |
| Pt/Al2O3 | 130 | 0.25 | 56 |
| Pt/WO3/Al2O3 (fresh) | 120 | 0.22 | 48 |
| Pt/WO3/Al2O3 (used) | 108 | 0.20 | 48 |
The X-ray diffraction patterns of fresh and used Pt/WO3/Al2O3 suggest that the synthesized catalyst is crystalline (Fig. 2). Both samples exhibit characteristic peaks of alumina. Peaks at 37.5°, 45.4°, 66.9° for 2θ values were attributed to crystalline Al2O3. Diffraction peaks attributable to crystalline WO3 were absent indicating that the tungsten species are uniformly distributed. Diffraction peaks of metallic or oxidized Pt phases were absent, indicating that the metal was well dispersed across the surface of the support, which agrees with the literature studies.22 After the reaction, the XRD diffraction pattern was unchanged.
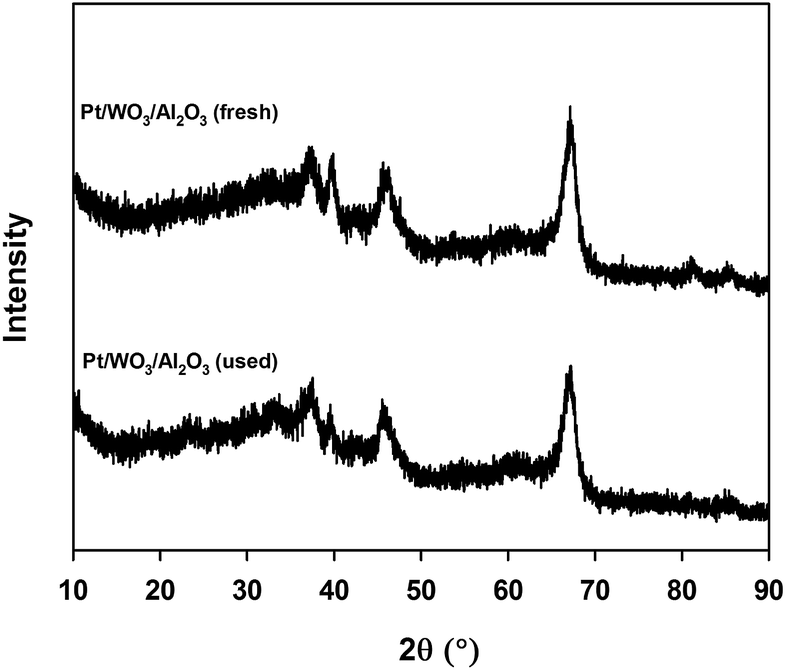 | ||
| Fig. 2 XRD pattern for fresh and used Pt/WO3/Al2O3. | ||
The surface morphology of the calcined Pt/WO3/Al2O3 was examined using FE-SEM (Fig. 3). A high magnification view of the catalyst shows that the particles were spheroidal. The surface was rough and the particles had a uniform diameter of approximately 80–120 μm. Catalyst assemblies were closely packed and no cracks were apparent on the grain surfaces.
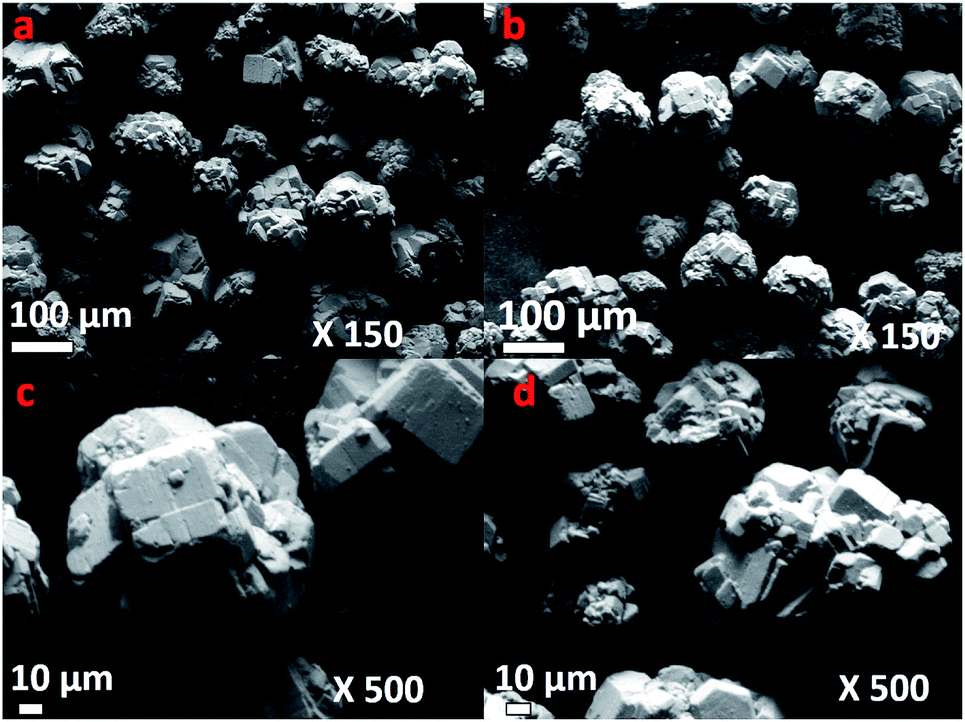 | ||
| Fig. 3 FE-SEM micrographs of (a) fresh catalyst at ×150, (b) used catalyst after reaction ×150 (c) fresh catalyst at ×500, (d) used catalyst after reaction at ×500. | ||
Pyridine-IR analysis compared the strengths of the Lewis and Brønsted acid sites in PtWO3//Al2O3. Liquid pyridine was adsorbed on the catalyst at room temperature and desorbed at 150 °C in a vacuum. The FT-IR spectra of the pyridine adsorbed catalysts were analyzed in the region of 1700 cm−1 to 1400 cm−1. Bronsted (B) acid sites exhibited typical bands centered at 1640 cm−1 and 1540 cm−1, and Lewis (L) acid sites at 1460 cm−1. The fresh catalyst showed bands at 1454 cm−1 corresponding to Lewis acid sites and the other band observed at 1640 cm−1 is attributed to Brønsted acid sites. Although the total surface acidity is low, the Brønsted acid sites were the most apparent on Pt/WO3/Al2O3.
3.2 Hydrogenolysis
Glycerol hydrogenolysis is a multi-step process in which an acid dehydrates glycerol, and a heterogeneous catalyst hydrogenates the intermediates to 1,2-PDO and 1,3-PDO. Generally, the 1,2-PDO yield is higher than that of 1,3-PDO. Maximizing 1,3-PDO selectivity requires Brønsted acid sites to selectively dehydrate the secondary carbon hydroxyl bond. The acid plays a decisive role in eliminating a hydroxyl group, and a fast sequential hydrogenation prevents further dehydration. In this study, we tested three catalysts while varying the feed composition and temperature to identify the optimum selectivity. We analyzed the product stream after a reaction time of 2 h. Here, we react glycerol in the vapour phase at 240 °C to 300 °C, at a hydrogen to glycerol ratio of 9 to 28, and WHSV between 0.09 and 0.14 h−1 and at ambient pressure (Table 3). Before atomizing the glycerol–water solution (a mass fraction of 20%), the catalyst was activated in a stream of H2 at 350 °C for 2 h.| Expt. no. | T, °C | H2/gly ratio | WHSV, h−1 | Conversion% | Selectivity% | ||||
|---|---|---|---|---|---|---|---|---|---|
| 1,3-PD | 1,2-PD | 1-PrOH | 2-PrOH | Othera | |||||
| a Other: CO, CO2, propane, acetone, methanol, propanal, acrolein, ethylene glycol, hydroxyacetone etc. | |||||||||
| 1 | 240 | 18 | 0.09 | 76 | 6 | 5 | 16 | 14 | 59 |
| 2 | 240 | 28 | 0.14 | 78 | 7 | 6 | 18 | 13 | 56 |
| 3 | 240 | 14 | 0.14 | 78 | 7 | 5 | 19 | 13 | 56 |
| 4 | 260 | 9 | 0.09 | 98 | 12 | 13 | 23 | 15 | 37 |
| 5 | 260 | 14 | 0.14 | 98 | 13 | 11 | 25 | 16 | 35 |
| 6 | 260 | 18 | 0.09 | 99 | 13 | 12 | 26 | 15 | 34 |
| 7 | 260 | 28 | 0.14 | 99+ | 14 | 9 | 28 | 17 | 32 |
| 8 | 280 | 14 | 0.12 | 99+ | 6 | 5 | 36 | 13 | 40 |
| 9 | 280 | 18 | 0.09 | 99+ | 4 | 7 | 34 | 15 | 40 |
| 10 | 280 | 28 | 0.14 | 99+ | 4 | 4 | 37 | 13 | 42 |
| 11 | 280 | 14 | 0.14 | 99+ | 3 | 4 | 36 | 15 | 41 |
| 12 | 300 | 18 | 0.09 | 99+ | 4 | 3 | 36 | 15 | 42 |
| 13 | 300 | 9 | 0.09 | 99+ | 3 | 4 | 35 | 14 | 44 |
| 14 | 300 | 14 | 0.14 | 99+ | 4 | 3 | 37 | 13 | 43 |
| 15 | 300 | 28 | 0.14 | 99+ | 5 | 4 | 38 | 13 | 40 |
The catalyst produced the most 1,3-PDO at 260 °C. Both glycerol conversion and 1,3-PDO selectivity over the Pt/WO3/Al2O3 catalyst depend on temperature,16,25,32 (Fig. 4). Glycerol conversion was generally very high and exceeded 98% above 260 °C whereas 1,3-PDO selectivity reached a maximum at 260 °C. 1,3-PDO product selectivity doubled from 6% to over 14% when we increased the temperature from 240 to 260 °C. However, it decreased at higher temperatures presumably due to subsequent hydrogenation to 1-PrOH and 2-PrOH. Further increasing the temperature to 300 °C reduced the 1,3-PDO selectivity and increased by-products like 1,2-PDO, 1-PrOH and 2-PrOH. Similar results published over a bi-functional Pt/WO3/TiO2/SiO2 catalyst in a batch reactor, explain how the increased temperature activates the terminal hydroxyl groups of glycerol.25
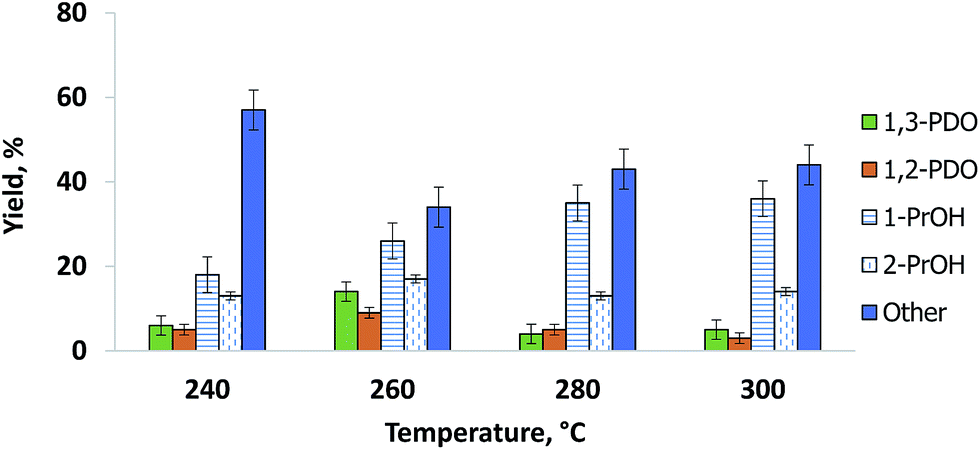 | ||
| Fig. 4 Glycerol hydrogenolysis product distribution. | ||
1,2-PDO formed in parallel with 1,3-PDO and its selectivity was lower at all temperatures except 280 °C (Fig. 4). As with 1,3-PDO, it reached a maximum selectivity of 13% at 260 °C. Other byproducts were 1-propanol and 2-propanol. We confirmed that these two compounds form directly from the hydrogenolysis of 1,3-PDO and 1,2-PDO. At 260 °C, 1-propanol selectivity was 25% and it increased with temperature to reach 38% at 300 °C. 2-Propanol selectivity increased less and reached a maximum of 17% at 260 °C.
The residence time varied from 0.43 s to 0.65 s (due to the change of total flow rate). However, in this study we conducted all experiments with a very high hydrogen flow, which is used as reactant as well as for fluidization purposes. Therefore the results of selectivity show that the products were independent of residence time changes.
Other by-products including propane, propanal, acrolein, ethylene glycerol, acetone, methanol and hydroxyacetone were also detected. The hydroxyacetone, acetone, methanol and propane concentrations were highest at 240 °C. CO and CO2 formation increased with temperature from 240 °C to 300 °C.
Both glycerol conversion and product selectivities are independent of the H2/glycerol ratio over the Pt/WO3/Al2O3 (Fig. 5). Under each of the conditions, the selectivity to the diols and mono-alcohols were in the margin of error of the experimental data (Fig. 6). We varied the H2/glycerol ratio from 9 to 29. We tested a WHSV of 0.09 h−1 and 0.14 h−1.
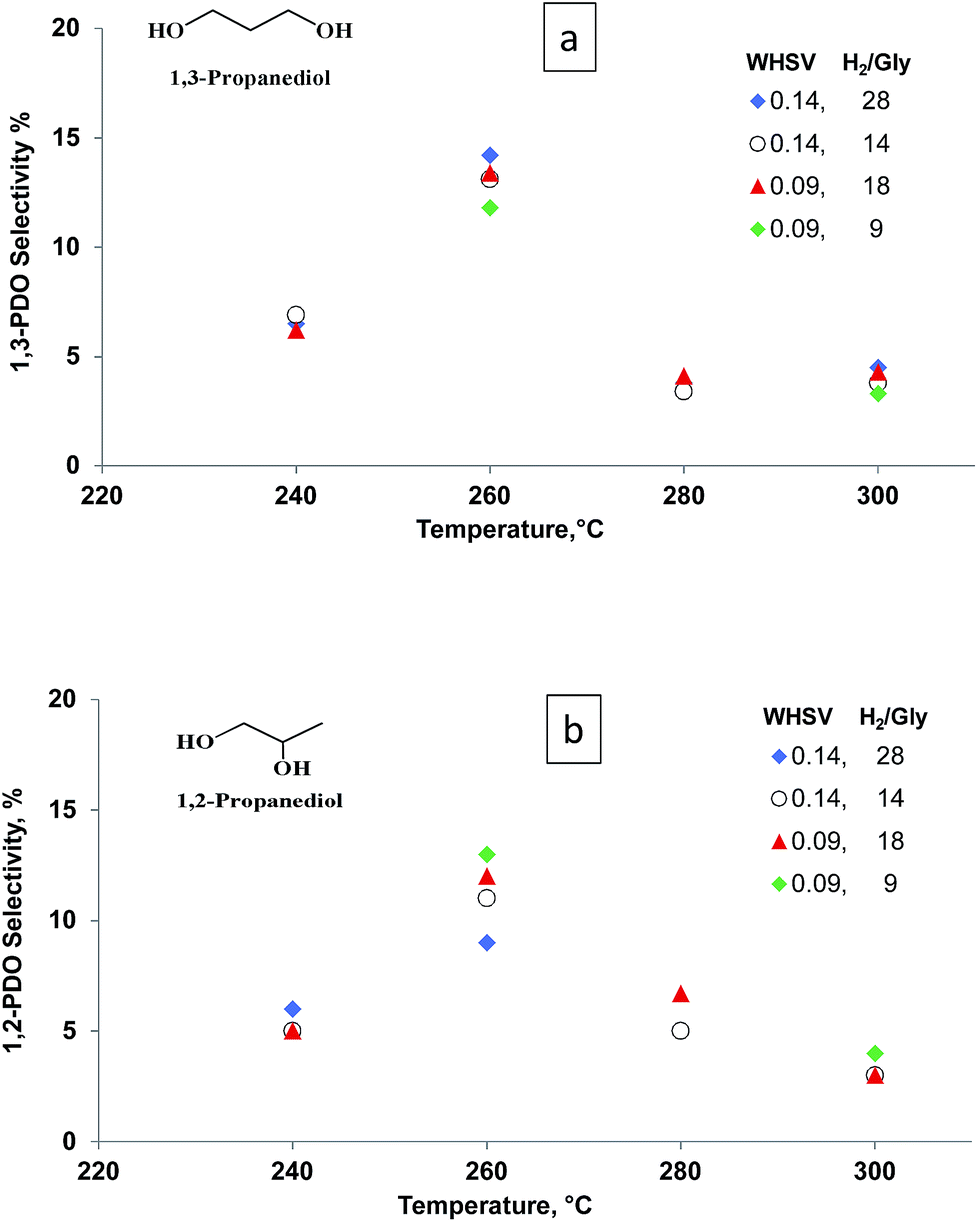 | ||
| Fig. 5 Selectivity vs. temperature for (a) 1,3-PDO and (b) 1,2-PDO at WHSV = 0.09 to 0.14 h−1, residence time = 0.43 s and 0.65 s and H2/glycerol ratio = 9, 14, 18 and 28. | ||
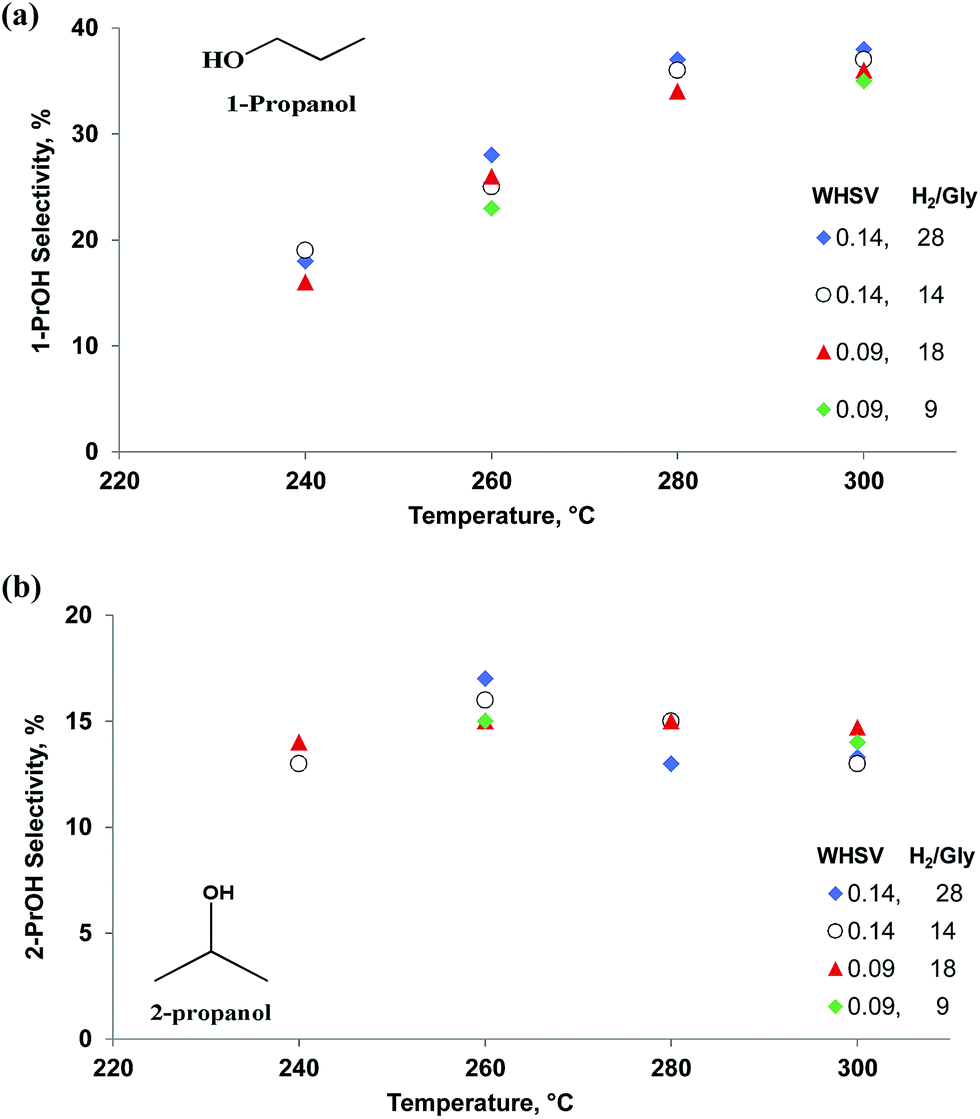 | ||
| Fig. 6 Selectivity vs. temperature for (a) 1-PrOH and (b) 2-PrOH at WHSV = 0.09 to 0.14 h−1, residence time = 0.43 s and 0.65 s and H2/glycerol ratio = 9, 14, 18 and 28. | ||
3.3 Analysis of the used catalyst
The XRD patterns of the catalyst remained the same after the reaction as did the morphology and the crystalline size (Fig. 2). Crystalline Pt phases were absent after the reaction, which suggests that the Pt species were well dispersed while reacting (Fig. 2). The BET surface area of the catalyst decreased after the reaction from 120 m2 g−1 to 107 m2 g−1. The total pore volume dropped from 0.22 cm3 g−1 to 0.20 cm3 g−1 (Table 2).Based on FT-IR pyridine analysis both the concentration of the Lewis and Brønsted acid sites decreased after the reaction (Fig. 7). The ratio of Brønsted sites to Lewis acid cites was 1.18 after the reaction. Future work will examine more closely the change in acidity with time on-stream as well as during the reoxidation process. Dalil et al.38 have already demonstrated by FT-IR pyridine analysis on a WO3/TiO2 catalyst that the strong acid sites were changing for up to 14 h during for the dehydration of glycerol to acrolein. During this time the selectivity to acrolein increased while the by-products decreased and the medium acidic and basic sites decreased.
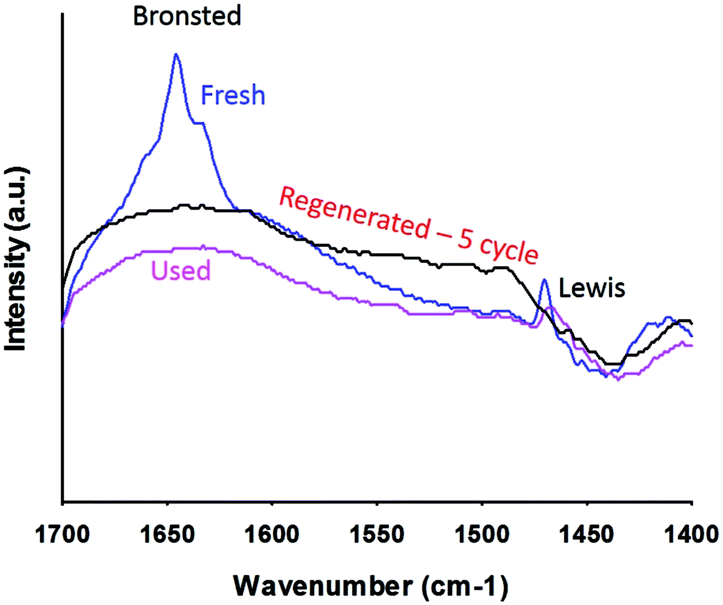 | ||
| Fig. 7 Pyridine FTIR analysis of the fresh and used Pt/WO3/Al2O3 catalyst. | ||
Air regenerated the used catalyst in a TGA from which we derived the mass loss due to carbon that accumulated during the reaction (Table 4). It was relatively insensitive to H2/gly: the ratio changed by a factor of 3 but only 25% more carbon evolved from the catalyst. The catalyst has a small proportion of basic sites that became coked with time but the catalyst was stable over all of the conditions. The pore volume and surface area changed slightly, which confirms that the catalyst is stable and carbon builds up on a small fraction of the catalyst.
| Temp (°C) | H2/gly | WHSV, h−1 | Wt. loss (%) |
|---|---|---|---|
| 260 | 28 | 0.14 | 0.45 |
| 260 | 14 | 0.14 | 0.46 |
| 260 | 9 | 0.09 | 0.6 |
3.4 Reaction mechanism
The two step dehydration–hydrogenation pathway to convert glycerol to 1,3-PDO is widely accepted.22 In the first step, glycerol dehydrates to 3-hydroxypropanal (3-HPA) and then hydrogenates in a second step to 1,3-PDO (Fig. 8, Path 2). Over acidic catalysts, the double dehydration of glycerol gives acrolein, which could be the precursor for 3-hydroxypropanaldehyde (3-HPA) after rehydration (Fig. 8, Path 1). The second dehydration to acrolein and the rehydration would be an equilibrium, which depends on water partial pressure and temperature. This equilibrium stage is important: PDO selectivity increases with higher H2O partial pressure, and lower temperature (to limit the second dehydration) but this will also affect the first dehydration. A detailed mechanism of acrolein formation with 3-HPA as an intermediate has been stated in our recently published work on glycerol dehydration over a WO3–TiO2 catalyst.37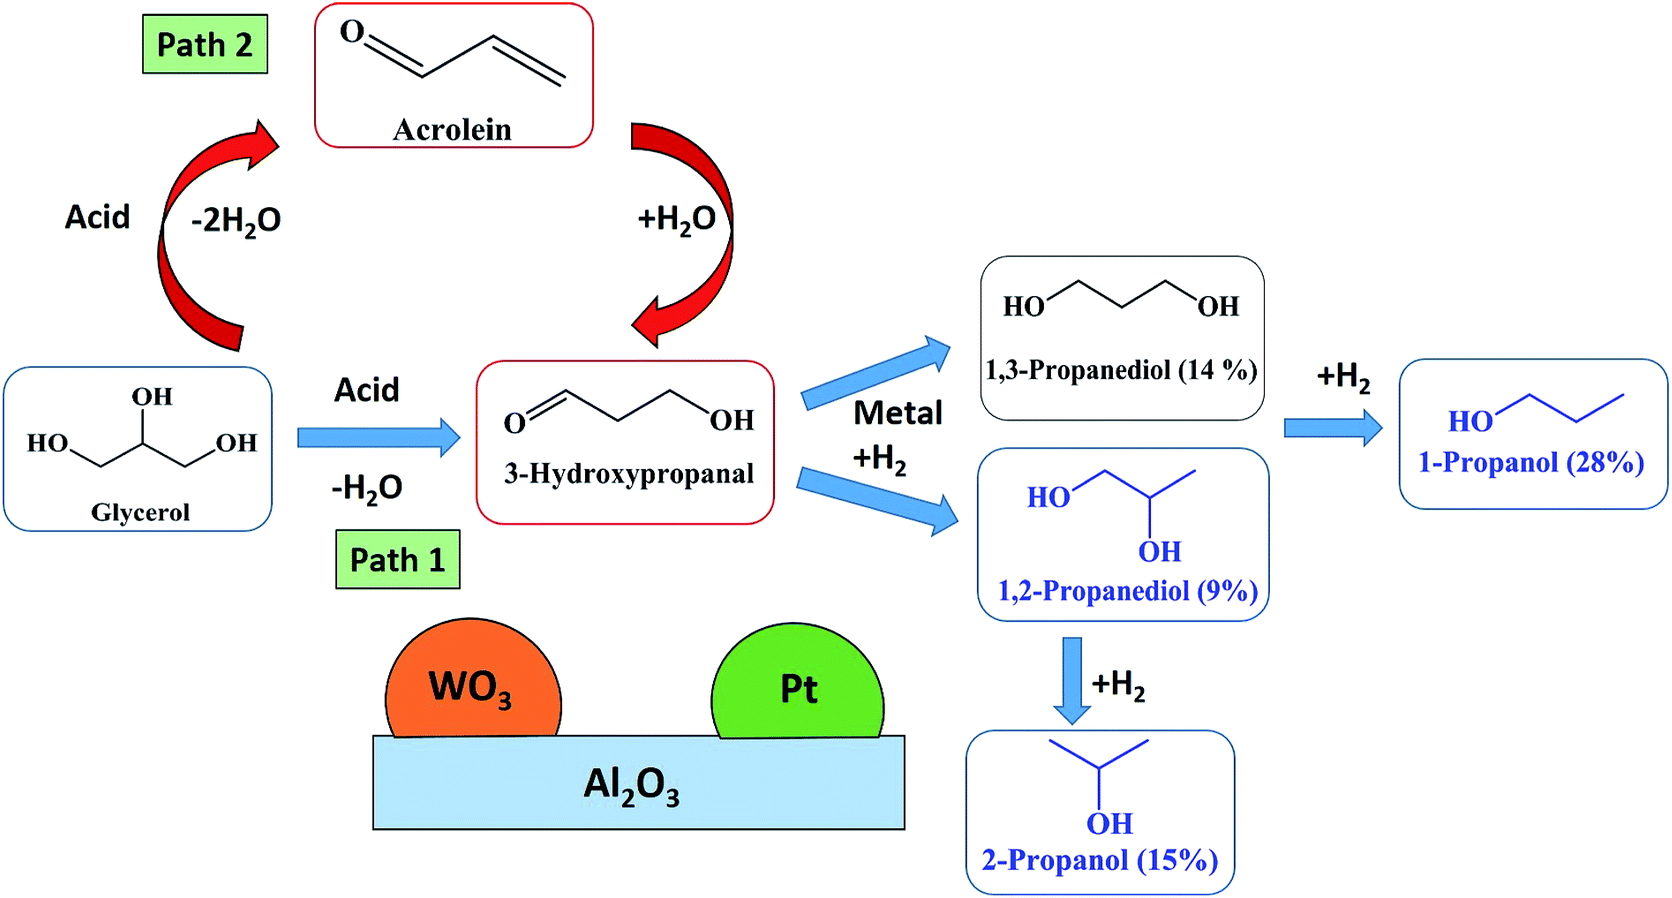 | ||
| Fig. 8 Proposed reaction mechanism for glycerol hydrogenolysis to 1,3-PDO in a catalytic fluidized bed reactor at atmospheric pressure. | ||
The reaction mechanism includes 3-steps: (1) double dehydration of glycerol to acrolein, (2) rehydration of acrolein to 3-HPA, (3) hydrogenation of 3-HPA to 1,3-PDO (Fig. 8, Path 1).
We validated this mechanism by feeding intermediate products—1,3-PDO, 1,2-PDO, 1-PrOH, 2-PrOH, and acrolein—to the Pt/WO3/Al2O3 catalyst under the same reaction conditions (Table 5). 1,3-PDO was less active than 1,2-PDO, the propanols, and glycerol but its selectivity to 1-PrOH was 62% versus 54%. This result accounts for the yield of 1,3-PDO being higher versus 1,2-PDO during glycerol hydrogenolysis. The selectivity of 1-PrOH from 1,2-PDO was higher than for 2-PrOH. During glycerol hydrogenolysis, the 1-PrOH yield continued to increase with temperature while the 2-PrOH reached a maximum selectivity of 17% at 260 °C and dropped slightly to 15% at 280 °C and 300 °C (Fig. 6). These experiments demonstrate that glycerol hydrogenolysis follows a consecutive reaction pathway. To achieve high 1,3-PDO selectivity, we must suppress the consecutive reaction to 1-PrOH but more importantly the parallel reaction to 1,2-PDO. Also, 2-PrOH, propanal, acetone and ethylene glycol were produced in lower quantities from 1,3-PDO versus 1,2-PDO.
| Expt. no. | Reactant | Conversion% | Selectivity% | ||||||
|---|---|---|---|---|---|---|---|---|---|
| 1,3-PDO | 1,2-PDO | 1-PrOH | 2-PrOH | C3H8 | Acrolein | Othera | |||
| a Other: CO, CO2, propanaldehyde, ethylene glycol, acetone etc. | |||||||||
| 1 | 1,3-PDO | 11 | — | 2 | 62 | 3 | 19 | 1 | 8 |
| 2 | 1,2-PDO | 42 | 1 | — | 54 | 14 | 8 | 1 | 6 |
| 3 | 1-PrOH | 32 | 0 | 2 | — | 2 | 23 | 2 | 8 |
| 4 | 2-PrOH | 36 | 0 | 2 | 3 | — | 12 | 3 | 15 |
| 5 | Acrolein | 49 | 9 | 0 | 8 | 3 | 11 | — | 20 |
| 6 | 3-HPA | 80 | 20 | 3 | 14 | 4 | 14 | — | 29 |
Acrolein hydrogenolysis produced 9% 1,3-PDO, which confirms that 3-HPA is the probable intermediate for the diols. We observed the same products during the hydrogenolysis experiments with glycerol by GC and GC-MS: 1-PrOH, propane and CO, CO2, propanal, ethylene glycol and acetone.
4 Conclusions
We demonstrate a catalyst system—Pt/WO3/Al2O3—that converts glycerol to 1,3-PDO and 1,2-PDO in the gas phase at ambient pressure and elevated temperatures in a fluidized bed reactor. The maximum yield of 1,3-PDO, the desired product, was 14%. It decreased with increasing temperature and produced more 1-PrOH. The other by-products were 2-PrOH, propanal, methanol, ethylene glycol, acetone, CO and CO2. The consecutive reaction rate of 1,3-PDO to 1-PrOH is low; the most important factor for increasing selectivity is to reduce the parallel reaction to 1,2-PDO. A proposed mechanism pathway shows that the reaction occurs via a double dehydration of glycerol – rehydration of acrolein – followed by metal supported hydrogenation to give 1,3-PDO.Acknowledgements
The authors would like to acknowledge CRIBIQ and MITACS (Canada) for their partial financial support of this study.References
- P. Gallezot, Chem. Soc. Rev., 2012, 41, 1538–1558 RSC.
- C. O. Tuck, E. Perez, I. Horvath, R. Sheldon and M. Poliakoff, Science, 2012, 337, 695–699 CrossRef CAS PubMed.
- D. Boffito, C. Neagoe, M. Edake, B. Pastor-Ramirez and G. Patience, Catal. Today, 2014, 237, 13–17 CrossRef CAS.
- I. Gandarias, J. Requies, P. Arias, U. Armbruster and A. Martin, J. Catal., 2012, 290, 79–89 CrossRef CAS.
- A. Ruppert, K. Weinberg and R. Palkovits, Angew. Chem., Int. Ed., 2012, 51, 2564–2601 CrossRef CAS PubMed.
- PRNewswire, 1,3-propanediol market worth $621.2 million by 2021, http://www.prnewswire.com/news-releases/13-propanediol-market-worth-6212-million-by-2021-287634261.html, 2015.
- C. Zhou, J. Beltramini, Y. X. Fan and G. Q. Lu, Chem. Soc. Rev., 2008, 37, 527–549 RSC.
- D. T. U. Hanefeld, ChemSusChem, 2011, 4, 1017–1034 CrossRef PubMed.
- G. Kraus, Clean: Soil, Air, Water, 2008, 36, 648–651 CrossRef CAS.
- Y. Shinmi, S. Koso, T. Kubota, Y. Nakagawa and K. Tomishige, Appl. Catal., B, 2010, 94, 318–326 CrossRef CAS.
- M. Akiyama, S. Sato, R. Takahashi, K. Inui and M. Yokota, Appl. Catal., A, 2009, 371, 60–66 CrossRef CAS.
- Z. Yuan, L. Wang, J. Wang, S. Xia, P. Chen, Z. Hou and X. Zheng, Appl. Catal., B, 2011, 101, 431–440 CrossRef CAS.
- J. Chaminand, L. Djakovitch, P. Gallezot, P. Marion, C. Pinel and C. Rosier, Green Chem., 2004, 6, 359–361 RSC.
- T. Kurosaka, H. Maruyama and Y. Sasaki, Catal. Commun., 2008, 9, 1360–1363 CrossRef CAS.
- J. Oh, S. Dash and H. Lee, Green Chem., 2011, 13, 2004–2007 RSC.
- L. Qin, M. J. Song and C. Chen, Green Chem., 2010, 12, 1466–1472 RSC.
- M. Chiaand, T. Pagan, D. Hibbitts, Q. Tan, H. N. Pham, A. K. Datye, M. Neuroc, R. J. Davis and J. A. Dumesic, J. Am. Chem. Soc., 2011, 133, 12675–12689 CrossRef PubMed.
- S. Koso, H. Watanabe, K. Okumura, Y. Nakagawa and K. Tomishige, Appl. Catal., B, 2012, 111–112, 27–37 CrossRef CAS.
- Y. Nakagawa, X. Ning, Y. Amada and R. Tomishige, Appl. Catal., A, 2012, 433–434, 128–134 CrossRef CAS.
- S. S. Priya, P. Bhanuchander, V. P. Kumar, S. K. Bhargava and K. V. R. Chary, Ind. Eng. Chem. Res., 2016, 55, 4461–4472 CrossRef CAS.
- S. S. Priya, P. Bhanuchander, V. P. Kumar, D. K. Dumbre, S. R. Periasamy, S. K. Bhargava, M. L. Kantam and K. V. R. Chary, ACS Sustainable Chem. Eng., 2016, 4, 1212–1222 CrossRef CAS.
- R. Arundhathi, T. Mizugaki, T. Mitsudome, K. Jitsukawa and K. Kaneda, ChemSusChem, 2013, 6, 1345–1347 CrossRef CAS PubMed.
- V. Resch and U. Hanefeld, Catal. Sci. Technol., 2015, 5, 1385–1399 CAS.
- D. Arntz, A. Fischer, M. Hopp, S. Jacobi, J. Sauer, T. Ohara, T. Sato, N. Shimizu and H. Schwind, Ullmann’s Encyclopedia of Industrial Chemistry, 2007, vol. 1, pp. 329–342 Search PubMed.
- L. Gong, Y. Lu, Y. Ding, R. Lin, J. Li and W. Chen, Chin. J. Catal., 2009, 30, 1189–1191 CrossRef CAS.
- O. Daniel, A. DeLaRiva, E. L. Kunkes, A. K. Datye, J. A. Dumesic and R. J. Davis, ChemCatChem, 2010, 2, 1107–1114 CrossRef CAS.
- A. Shimao, S. Koso, N. Ueda, Y. Shinmi, I. Furikado and K. Tomishige, Chem. Lett., 2009, 38, 540–541 CrossRef CAS.
- I. Furikado, T. Miyazawa, S. Koso, A. Shimao, K. Kunimori and K. Tomishige, Green Chem., 2007, 9, 582–588 RSC.
- L. Huang, Y. Zhu, H. Zheng, G. Ding and Y. Li, Catal. Lett., 2009, 131, 312–320 CrossRef CAS.
- T. Dam, D. Kristina, K. Freek and U. Hanefeld, ChemCatChem, 2013, 5, 497–505 CrossRef.
- L. Liu, Y. Zhang, A. Wang and T. Zhang, Chin. J. Catal., 2012, 33, 1257–1261 CrossRef CAS.
- C. H. Zhou, H. Zhao, D. S. Tong, L. M. Wu and W. H. Yu, Catal. Rev., 2013, 55, 369–453 CAS.
- S. Priya, V. Kumar, M. Kantam, S. Bhargava and K. Chary, RSC Adv., 2014, 4, 51893–51903 RSC.
- P. Vanama, A. Kumar, S. Ginjupalli and K. Chary, Catal. Today, 2015, 250, 226–238 CrossRef CAS.
- M. J. D. Mahboub, S. Lotfi, J.-L. Dubois and G. S. Patience, Catal. Sci. Technol., 2016, 6, 6525–6535 Search PubMed.
- M. J. D. Mahboub, M. Rostamizadeh, J.-L. Dubois and G. S. Patience, RSC Adv., 2016, 6, 114–123 Search PubMed.
- M. Dalil, D. Carnevali, J. Dubois and G. Patience, Chem. Eng. J., 2015, 270, 557–563 CrossRef CAS.
- M. Dalil, D. Carnevali, M. Edake, A. Auroux, J.-L. Dubois and G. S. Patience, J. Mol. Catal. A: Chem., 2016, 421, 146–155 CrossRef CAS.
| This journal is © The Royal Society of Chemistry 2017 |