 Open Access Article
Creative Commons Attribution 3.0 Unported Licence
Controlling phase transition for single-layer MTe2 (M = Mo and W): modulation of the potential barrier under strain†
H. H.
Huang
a,
Xiaofeng
Fan
*a,
David J.
Singh
ab,
Hong
Chen
c,
Q.
Jiang
a and
W. T.
Zheng
*a
aCollege of Materials Science and Engineering, Jilin University, Changchun 130012, China. E-mail: xffan@jlu.edu.cn; wtzheng@jlu.edu.cn
bDepartment of Physics and Astronomy, University of Missouri, Columbia, Missouri 65211-7010, USA
cDepartment of Control Science & Engineering, Jilin University, Changchun 130012, China
First published on 12th January 2016
Abstract
Using first-principles DFT calculations, the pathway and the energy barrier of phase transition between 2H and 1T′ have been investigated for MoTe2 and WTe2 monolayers. The Phase transition is controlled by the simultaneous movement of metal atoms and Te atoms in their plane without the intermediate phase 1T. The energy barrier (less than 0.9 eV per formula cell) is not so high that the phase transition is dynamically possible. The relative stability of both 2H and 1T′ phases and the energy barrier for phase transition can be modulated by the biaxial and uniaxial strain. The dynamic energy barrier is decreased by applying the strain. The phase transition between 2H and 1T′ controlled by the strain can be used to modulate the electronic properties of MoTe2 and WTe2.
1. Introduction
Group VI transition metal dichalcogenides (VI TMDs) with the chemical formula MX2 have recently attracted much attention because of their superior physical properties and the unique layered structure for potential applications in electronic and optoelectronic devices.1–7 These materials consist of X–M–X sheets which are held together via van der Waals interaction and can be thinned into single or few layer two-dimensional (2D) structures using several methods,8–11 such as liquid exfoliation and mechanical exfoliation with high crystal quality. Due to the lack/change of the interaction of layers, the electronic properties can be appropriately modulated. For example, bulk MoS2 is an indirect band gap semiconductor with a band gap of 1.29 eV,12,13 while single-layer MoS2 is found to have a direct band gap of about 1.8 eV.14–16 With strong photoluminescence, and controllable valley and spin polarization, 2D TMDs have aroused interest in both the theoretical and experimental studies. Various studies, such as strain modulation and nanostructures, have addressed the tuning of band gaps and photoluminescence in MoS2 and the related TMDs.17–26Phase transitions can modulate the properties of materials without the change in materials' composition and therefore are of important technological value. Most studies are focused on the hexagonal (2H) phase with semiconducting characteristics, while an overlooked feature is that VI TMDs can exist in several polymorphs. Depending on the arrangement of X atoms,27 the other stable phase which is popular in VI TMDs is the distorted 1T phase (1T′).28–32 The 1T′ phase has semimetal characteristics. For example, bulk 1T′-MoTe2 is a semimetal with much high carrier mobility of 4000 cm2 V−1 s−1. The metallic 1T′-WS2 has improved electrocatalytic activity.33 The combination of 2H and 1T′ phases with their special electronic characteristics will result in potential applications in several areas, such as field effect transistors, batteries, photovoltaics and optoelectronics.2,34,35 Some studies on the structural transition between metallic 1T (or 1T′) and semiconducting 2H phases including bulk materials and single layers have been carried out.36–38 By the intercalation of Li and K, the 1T phase of MoS2 transformed from 2H-MoS2 with the contribution of electron donors was reported.8,39 However, bulk 1T-LiMoS2 is thermodynamically unstable and can be transformed back to the 2H phase, as observed in Raman spectra.40 Recently, in single-layer MoS2, the coexistence of two phases has been reported by Eda et al.10 Using scanning transmission electron microscopy, the structural transformation in single-layer MoS2 is observed with atomic resolution by Lin et al.41 Theoretically, it is found that mechanical deformations can switch the thermodynamic stability between the 2H phase and the 1T′ phase in the monolayer VI TMDs.42 In addition, using an electron beam, it is found that the 1T phase can be controllably grown in the 2H phase for MoS2. How about the dynamic barrier of phase transition between 2H and 1T′ in VI TMDs? As we all know, the related information on the dynamic processes of phase transition in these 2D materials is still limited.
In this work, we explored the mechanism of phase transition between 2H and 1T′ of MoTe2 and WTe2 monolayers using first-principles methods. Both phases were considered to convert with each other by intra-layer atomic plane gliding. We analyzed the atom moving mechanism in detail in order to obtain the information on the phase transition pathway. It is found that the phase transition from 2H to 1T′ does not occur simply through the intermediate 1T phase with the plane gliding of the X atom (Te) and the distortion of lattices. Actually, the mechanism is that the metal atom M (Mo or W) changes its position in the lattice of the 2H phase to that in the 1T′ phase, simultaneously accompanied by the gliding of X (Te) atoms. In addition, in order to engineer the dynamic barrier of phase transition, we also analyzed the change in the energy barrier under strains including uniaxial and biaxial strain. The analysis of the dynamic process with the energy barrier for phase transition in MoTe2 and WTe2 monolayers is expected to shed some light on the application of VI TMDs as 2D phase transition materials.
2. Calculation methods
MoTe2 and WTe2 are usually with the 2H phase.43 The 2H phase structure with space group P![[6 with combining macron]](https://www.rsc.org/images/entities/char_0036_0304.gif) m2 has hexagonal symmetry and the primitive unit cell of the single-layer has three atoms. The X (Te) atom is with trigonal prismatic coordination around M (Mo or W) atoms. The 1T phase is also with hexagonal symmetry and the primitive unit cell of the single-layer has three atoms. In the 1T phase with space group P
m2 has hexagonal symmetry and the primitive unit cell of the single-layer has three atoms. The X (Te) atom is with trigonal prismatic coordination around M (Mo or W) atoms. The 1T phase is also with hexagonal symmetry and the primitive unit cell of the single-layer has three atoms. In the 1T phase with space group P![[3 with combining macron]](https://www.rsc.org/images/entities/char_0033_0304.gif) m1, the X atom is with octahedral coordination around M atoms. With previous study, we can find that the high symmetry 1T structure of single-layer VI TMDs is thermodynamically unstable,44,45 while another phase 1T′, the distorted version of the 1T phase, is found to be thermodynamically stable. This lower-symmetry phase is with space group P21/M and the primitive cell in the x–y plane is rectangular.28 In order to compare the structural changes of the three phases and perform the pathway analysis of phase transition, the 2H and 1T phases are constructed with rectangular supercells, as shown in Fig. 1, as that of 1T′. In the supercells of these single-layer models, the vacuum separation in the z direction is set to be 18 Å in order to avoid the coupling of layers.
m1, the X atom is with octahedral coordination around M atoms. With previous study, we can find that the high symmetry 1T structure of single-layer VI TMDs is thermodynamically unstable,44,45 while another phase 1T′, the distorted version of the 1T phase, is found to be thermodynamically stable. This lower-symmetry phase is with space group P21/M and the primitive cell in the x–y plane is rectangular.28 In order to compare the structural changes of the three phases and perform the pathway analysis of phase transition, the 2H and 1T phases are constructed with rectangular supercells, as shown in Fig. 1, as that of 1T′. In the supercells of these single-layer models, the vacuum separation in the z direction is set to be 18 Å in order to avoid the coupling of layers.
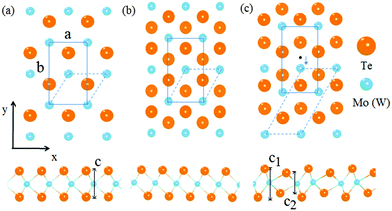 | ||
| Fig. 1 Schematic representation of the structures of different phases including 2H (a), 1T (b) and 1T′ (c) for MoTe2 and WTe2. | ||
In the present work, all the calculations were performed on the basis of density functional theory using accurate frozen-core full-potential projector augmented-wave pseudopotentials (PAW), as implemented in the VASP code.46 We use the generalized gradient approximation (GGA) with the parameterization of Perdew–Burke–Ernzerhof (PBE) for the exchange and correlation potential.47 In addition, we also consider the hybrid functional by using HSE06 to accurately estimate the band gaps. A kinetic energy cutoff of 500 eV for the plane wave expansion and a Monkhorst–Pack grid with a k-point spacing of 0.02 Å−1 are found to be sufficient to ensure that the total energy is converged at the 1 meV/atom level. The convergence criterion for the self-consistence field energy was set to be 10−6 eV. In order to enable the initial structure to attain the most stable conformation, all the atomic positions and the lattice constants in the x–y plane are fully relaxed.
3. Results and discussion
3.1 Pathway and barrier of phase transition
The lattice constants of MoTe2 and WTe2 monolayers with different phases, including 2H, 1T and 1T′ phases, are calculated and they agreed well with the reported values from experiments and other theoretical calculations42 as shown in Table 1. With our calculations, the ground states of MoTe2 and WTe2 are found to be in 2H and 1T′ phases, respectively. In addition, the energy of the 1T phase is much higher than those of 2H and 1T′ and the energy difference between 2H and 1T′ is relatively small. From the view of atomic arrangement in the lattice, Mo (W) is coordinated by six Te atoms in three phases. However, the coordinated structure is different. In the 2H, 1T and 1T′ phases, the six Te atoms around Mo (W) are arranged in the trigonal prismatic, octahedral and distorted octahedral structures, respectively.| Materials | Structures | a (Å) | b (Å) | c (Å) | ΔE (eV per atom) |
|---|---|---|---|---|---|
| MoTe2 | 2H | 3.548 | 6.146 | 3.595 | −3.14 |
| 3.519(ref. 28, 54) | |||||
| 3.550(ref. 55) | 6.149 | ||||
| 3.522(ref. 12) | |||||
| 1T | 3.493 | 6.048 | 3.730 | −2.97 | |
| 3.493(ref. 55) | 6.054 | ||||
| 1T′ | 3.454 | 6.365 | 2.956, 4.126 | −3.12 | |
| 3.469(ref. 30) | 6.330 | ||||
| 3.455(ref. 55) | 6.380 | ||||
| WTe2 | 2H | 3.554 | 6.152 | 3.621 | −3.27 |
| 3.600(ref. 28) | |||||
| 3.552(ref. 55) | 6.154 | ||||
| 1T | 3.517 | 6.091 | 3.740 | −3.09 | |
| 3.491(ref. 55) | 6.320 | ||||
| 1T′ | 3.496 | 6.311 | 2.951, 4.187 | −3.30 | |
| 3.496(ref. 30) | 6.282 | ||||
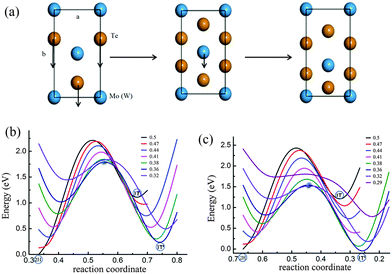
It is noticed that the 1T phase can convert into the octahedral-like 1T′ phase by symmetry distortion. In the rectangular unit cell, the main difference between the two phases lies in the position of the center metal atom as depicted in Fig. 1. Of course, the positions of Te atoms are modulated appropriately, by following the deviation of the metal atom to the high symmetry position. For the 1T structure, one of the metal atoms is located in the middle of the cell (its coordinate corresponding to 0.5 along the b-axis), while this metal atom is below the central position for the 1T′ structure (its coordinate corresponding to 0.36 along the b-axis) in Fig. 1. Therefore, the pathway from 1T to 1T′ is that the metal atom (Mo or W) moves from the high symmetry position to a position that deviated from the centre in 1T′ along the y axis of the x–y plane (Fig. 2a) with the relaxation of Te atoms in the cell. From the calculation, it is found that there is no energy barrier from 1T to 1T′. In addition, one soft phonon mode in the optical modes of VI TMD materials which has an imaginary vibrational frequency has been found theoretically.42 Is it possible that the phase transition from 2H to 1T′ is completed by the intermediate phase 1T?
The coordinated structure can change from a trigonal prismatic polytype to an octahedral coordinated structure through the plane gliding of the atomic layer of tellurium. This means that the phase transition from 2H to 1T can be achieved by the movement of two Te atoms of one plane along the y axis as shown in Fig. 2a. As the black lines in Fig. 2b and c show, there is an energy barrier for transition from 2H to 1T, since Te atoms need to go through the center between the two Mo (W) atoms. The energy barriers of MoTe2 and WTe2 are 1.1 eV and 1.2 eV per formula unit, respectively. However, is it possible that the phase transition from 2H to 1T′ occurs directly by the simultaneous movement of Mo (W) and Te with a relatively low energy barrier, but not via the 1T phase, as there is no barrier between 1T and 1T′ phases and the energy of the 1T phase is higher?
In order to obtain the transition pathway from 2H to 1T′ with a minimum energy barrier, we fix the metal atoms (Mo or W) at the special position (such as the center position of the cell in the 1T phase) and move the Te atom from one equilibrium position to another equilibrium position via the center of two metal atoms in the cell (Fig. 2a) as a special pathway. Then by shifting the position of the metal atom (Mo or W) to another special position along the y axis as indicated by the arrows in Fig. 2a and repeating the above process of moving Te atoms, we can obtain a series of energy curves. As shown in Fig. 2b and c which include the pathways of MoTe2 and WTe2, respectively, we can find the energy barriers for phase transition from 2H to 1T′. It should be noticed that the simultaneous displacement of Te atoms along the c-axis accompanied by the Te plane slide along the b-axis has been considered, since the coordinates of Te atoms on the c-axis are different for both phases 2H and 1T′. The energy of the 2H phase is taken as the zero point. For each curve with a fixed special position of the Mo (W) atom, the energy increases with the Te atom going down along the b-axis. When the Te atom arrives at the center of both the nearest-neighbor Mo (W) atoms, the energy reaches the maximum. Then the energy will decline after the Te atom goes across the center between Mo (W) atoms. The energy appears to be a minimum value when the Te atom is in a suitable position which is the local equilibrium point.
In the case of MoTe2, the barrier of the energy curve decreases gradually by following the shift of Mo along the b-axis. The barrier reaches the minimum when the Mo atom is shifted to the position in the 1T′ phase in which the corresponding coordinate is 0.36 along the b-axis as labeled in Fig. 2a. It is apparent that the 2H–1T phase transition might be unaccessible. For WTe2, similar results are obtained, as shown in Fig. 2c. The above calculations in Fig. 2b and c, in essence, are based on the analysis of a two-step method of phase transition 2H–1T′. In this method, for a fixed M atom position, we can obtain the Te atom position on the reaction coordinate. For a given Te plane displacement on the reaction coordinate, the M atom position is determined by the lowest energy. In this way, the minimum energy path can be obtained. In addition, we just perform the calculations of two curves where the M atom positions are fixed at the points 0.5 and 0.36 in the b-axis to obtain the energy barrier from 2H to 1T′. Therefore, we can conclude that 2H–1T′ phase transition is controlled by the simultaneous gliding of Mo and Te atoms without going through the intermediate phase 1T. For MoTe2 and WTe2, the energy barriers are about 0.89 and 0.77 eV per formula cell, respectively.
The lattice parameters a and b in both phases 2H and 1T′ are different and the difference is about 1–1.5%, as shown in Table 1. By comparing the energy barriers calculated using the fixed lattice parameters of 2H and 1T′, it is found that the difference is about 0.05 eV per formula cell as shown in Table S1 in the ESI.† To compare with the value of energy barrier itself, this error is small and the volume-fixed nudged elastic band in this work is enough to analyze this phase transition. From 2H to 1T′, the lattice parameters a and b are not obviously changed. Therefore, this continuous model about the displacements of the involved atoms with fixed lattice parameters a and b can be considered to be valid for this first order phase transition between 2H and 1T′. On the other hand, if the distance of the Te atoms (as shown in Fig. 1) is considered to be the reference of the lattice parameter in the c-axis, this parameter for both phases is obviously discontinuous. In the phase transition of both phases, the change in this parameter is obvious and can be captured by the two-step method as shown in Fig. S1 in the ESI.†
Experimentally, the electrically activated phase transitions between 1T′ and 2H have been demonstrated in multilayered TaS248 and TaSe2.49 In the monolayer VI TMD materials, the stress and strain could be applied via the deformation of a flexible substrate and large elastic deformations can be reached through tensile strain. Therefore, the structural stability may be transformed by the mechanical deformation.50 In order to realize the structural transition of monolayer telluride and gain a particular phase, we enable the independent control of lattice parameters to prove the structural transition and estimate the energy barrier.
3.2 Phase transition under biaxial strain
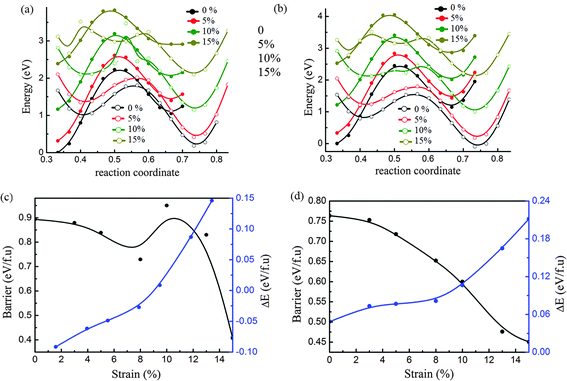
From the above analysis, we can extract the dynamic energy barrier between 2H and 1T′ from the curves of both initial and final states which corresponded to the fixed position of the metal atom at the points 0.5 and 0.36 in the b-axis. As shown in Fig. 3a and b, the curves of initial and final states under biaxial tensile strain of 5%, 10% and 15% are shown for phase transition between 2H and 1T′ of MoTe2 and WTe2, respectively. It is interesting that the curve of the final state becomes flat by following the increase of tensile strain. This implies that the energy barrier will decrease with the increase of tensile strain. In addition, it is noticed that the curve of the final state of MoTe2 (shown by the green open circle line in Fig. 3a) under strain of 10% has a barrier with a sharp peak and it implies that there may be a transition of structural stability.In Fig. 3c and d, the changes in energy barriers following the increase of tensile strain are shown for MoTe2 and WTe2. The changes in energy difference (ΔE) between 2H and 1T′ phases due to the strain are also analyzed. The energy difference is calculated by the formula, ΔE = E2H − E1T′, where E2H and E1T′ are the total energies of 2H and 1T′ phases, respectively. For MoTe2, the ground state is the 2H phase and the 1T′ phase becomes more stable after the tensile strain reaches 10%. When the strain is less than 10%, the energy barrier decreased following the increase of strain. The change in the relative stability of both phases under the strain of 10% results in the increase of the energy barrier. Following the increase of strain further, the energy barrier between both phases is decreased again. For WTe2, the energy difference between 2H and 1T′ is increased and the energy barrier of both phases is decreased by following the increase of tensile strain. This means the phase transition from 2H to 1T′ becomes easier with the increase of tensile strain. Here, it should be noticed that the 10% strain is possible to be near the upper boundary of MTe2, since the breaking strain of similar 2D materials, monolayer graphene and MoS2, is about 12% and 11%, respectively.51,52 This implies that the biaxial strain may not be an effective way since the mechanical strain more than 10% is not easily achievable.
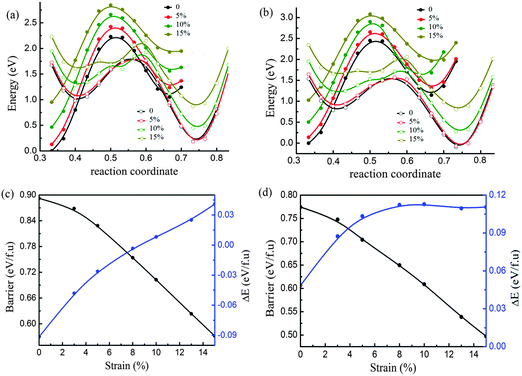
3.3 Phase transition under uniaxial strain
In the experiments, the lattice parameters of monolayer TMDs may be tuned independently by virtue of the substrate. Here we consider the effect of uniaxial strain on phase transition by tuning the lattice parameter b and fixing the lattice parameter a. The relative energy-coordinate curves of both MoTe2 and WTe2 are displayed in Fig. 4a and b for the case of uniaxial tensile strain. It is found that the stability of 2H and 1T′ is reversed for MoTe2 beyond the critical uniaxial strain of 8%, as manifested in Fig. 4a. When this phase transition occurs under the uniaxial strain of 8%, the energy barrier is about 0.78 eV per formula unit (illustrated in Fig. 4c). In addition, the energy barrier decreased continuously following the increase of the uniaxial tensile strain. Therefore, the phase transition between 2H and 1T′ is easier under uniaxial strain than under biaxial strain. In contrast to MoTe2, there is no transition of structural stability observed for WTe2 in Fig. 4d. Following the increase of the uniaxial tensile strain up to 8%, the 1T′ phase becomes more stable than 2H. After the strain increased to more than 8%, the energy difference between 1T′ and 2H does not change obviously, while the energy barrier decreased continuously following the increase of strain.It is noticed that the large uniaxial tensile strain along the b-axis will induce the compression in the a-axis. We considered the case of MoTe2 under the uniaxial tensile strain of the b-axis of about 8%. It is found that the compression of a-axis is different under the tensile strain of b-axis for both phases. The a-axis compression of 1T′ is larger than that of 2H. The tensile strain along the b-axis for the reversal of phase stability between 2H and 1T′ is reduced to about 6% with an energy barrier of 0.782 eV per formula unit as shown in Fig. S2 in the ESI.† The effect of the a-axis compression on the energy barrier of phase transition under the tensile strain of the b-axis is checked. It is found that this effect on the energy barrier is small and less than 0.03 eV per formula unit as shown in Fig. S2, S3 and Tables S2, S3 in the ESI.†
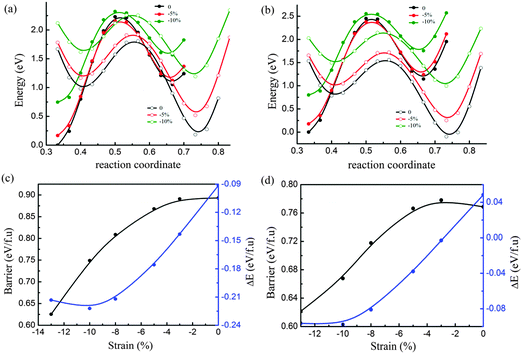
We also performed the calculations for MoTe2 and WTe2 under the uniaxial compressive strain along the b-axis with the fixed a-axis. As shown in Fig. 5a and c, the energy barrier between 2H and 1T′ of MoTe2 decreased following the increase of compressive strain, while the 2H phase is more stable under compressive strain. This makes the phase transition from 2H to 1T′ difficult under compressive strain. Interestingly, the uniaxial compressive strain along the b axis has an obvious impact on the phase transition of WTe2, as shown in Fig. 5b and d. When the uniaxial compressive strain is less than 3%, the 1T′ phase is more stable. After the compressive strain increased more than 3%, the 2H phase is more stable. When the phase transition from 1T′ to 2H happens, the energy barrier is about 0.78 eV per formula unit. With the increase of compressive strain, the barrier strain will be decreased further. At the same time the 2H phase is found to be more stable than the 1T′ phase.
We also considered the effect of a-axis expansion under the uniaxial compressive strain of the b-axis for WTe2. It is found that the a-axis expansion of 2H is smaller than that of 1T′ following the increase of b-axis compressive strain as shown in Fig. S5 and Table S4 in the ESI.† The effect of a-axis expansion on the energy barrier under the b-axis compressive strain is found to be small and can be ignored for WTe2 as shown in Fig. S6 and Table S5 in the ESI.†
3.4 Electronic properties of different phases
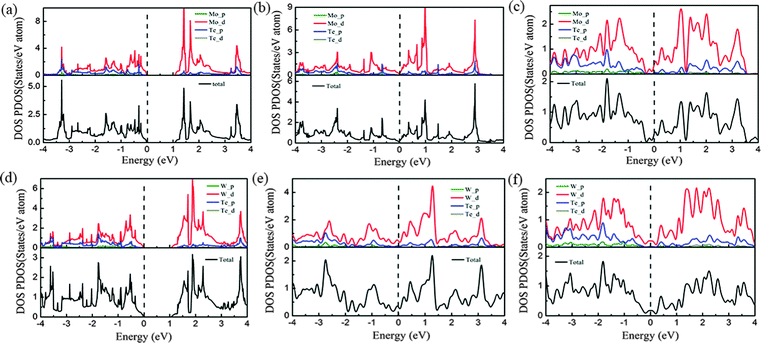
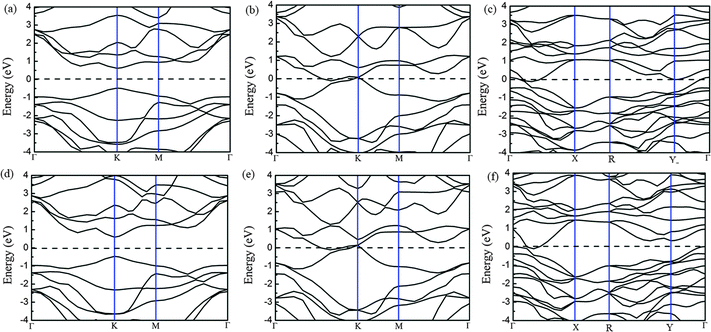
Because of the coordinate structure difference, from the trigonal prismatic structure to the distorted octahedral structure, both phases (2H and 1T′) exhibit completely different electronic structures. We calculated the density of states (DOS) and band structures of unstrained MoTe2 and WTe2 monolayers with different phases including 2H, 1T and 1T′ phases, as shown in Fig. 6 and 7. Using PBE/GGA without spin–orbit coupling, the 2H-MoTe2 and 2H-WTe2 monolayers are found to be semiconductors with direct band gaps of 1.11 eV and 1.08 eV, respectively. The valence band maximum (VBM) and the conduction band minimum (CBM) are located at the K-point of the Brillouin zone and contributed from the d orbitals of metal atoms (Mo and W). With consideration of the spin–orbit coupling, the bands near the valence band maximum at K are split obviously (Fig. S7 and S8 in the ESI†). By considering the underestimation of PBE/GGA to the band gaps of semiconductors, the functional HSE06 is employed and the calculated results are shown in Table 2.| Methods | MoTe2 | WTe2 | ||
|---|---|---|---|---|
| Gap (eV) | Δ SOC (eV) | Gap (eV) | Δ SOC (eV) | |
| PBE without SOC | 1.11 | − | 1.08 | − |
| PBE with SOC | 0.942 | 0.216 | 0.745 | 0.486 |
| HSE without SOC | 1.500 | − | 1.477 | − |
| HSE with SOC | 1.247 | 0.362 | 0.985 | 0.720 |
| Ref. 13 and 56 | 0.98, 1.18 | |||
For 1T-MoTe2 and 1T-WTe2, the band gaps of the monolayer are closed and the VBM and the CBM are overlapped. After the structural distortion from 1T to 1T′, the states near the VBM and the CBM changed to some extent (Fig. 6c and f) due to the low symmetry of the crystal field. The states of the valence band and the conduction band are not separated completely (Fig. 7c and f). Therefore, 1T′-MoTe2 and 1T′-WTe2 have semimetal characteristics. However, considering the spin–orbit coupling and the more accurate underestimation of the band gap using the HSE06 functional, both the valence band and the conduction band are separated for 1T′-MoTe2 and 1T′-WTe2 (Fig. S9 in the ESI†). It is consistent with the recent report on the band gap opening of monolayer 1T′-MoTe2 by spin–orbit coupling.53 This may make 1T′-MoTe2 and 1T′-WTe2 potential candidates for application in topological quantum devices.
4. Conclusion
In summary, the structural and electronic properties of the tellurides MoTe2 and WTe2 are studied using density functional theory calculations. It is found that phase transition between 2H and 1T′ is controlled by the simultaneous movement of metal atoms and Te atoms in their planes and does not go through the intermediate 1T phase. By the analysis of the pathway and dynamic energy barrier using the special two-step method, it is found that phase transition is possible since the energy barrier is not high. The energy barriers of MoTe2 and WTe2 are about 0.89 eV and 0.77 eV per formula cell.The relative stability of both 2H and 1T′ phases can be modulated by the biaxial and uniaxial strain. The dynamic energy barrier is found to be decreased by applying the stress and strain. For MoTe2, the phase transition from 2H to 1T′ can be controlled by biaxial or uniaxial tensile strain. Under the biaxial tensile strain of 10%, the 1T′ phase becomes more stable than the 2H phase and the energy barrier of both phases is 0.90 eV per formula unit. Under the b-axis tensile strain of about 6%, the 1T′ phase becomes more stable and the energy barrier is 0.782 eV per formula cell. In addition, the energy barrier decreased following the increase of tensile stain further. For WTe2, the phase transition from 1T′ to 2H can be controlled by the uniaxial compressive strain along the b axis. It is found that the 2H phase becomes more stable than the 1T′ phase and the energy barrier is 0.78 eV per formula unit under the uniaxial compressive strain of about 3%. In addition, the 2H–1T’ phase transition can induce changes in electronic properties. With MoTe2 and WTe2 as examples, it is expected that the phase transition between 2H and 1T′ of VI TMDs controlled by the strain can provide more applications in flexible, low-power and transparent electronic devices.
Acknowledgements
Support from the National Natural Science Foundation of China (No. 11504123) is highly appreciated.References
- B. E. Brown, The Crystal Structures of WTe2 and High-Temperature MoTe2, Acta Crystallogr., 1966, 20, 268 CrossRef CAS.
- H. Zeng, J. Dai, W. Yao, D. Xiao and X. Cui, Valley polarization in MoS2 monolayers by optical pumping, Nat. Nanotechnol., 2012, 7, 490 CrossRef CAS PubMed.
- Q. H. Wang, K. Kalantar-Zadeh, A. Kis, J. N. Coleman and M. S. Strano, Electronics and optoelectronics of two-dimensional transition metal dichalcogenides, Nat. Nanotechnol., 2012, 7, 699 CrossRef CAS PubMed.
- H. Terrones, F. Lopez-Urias and M. Terrones, Novel hetero-layered materials with tunable direct band gaps by sandwiching different metal disulfides and diselenides, Sci. Rep., 2013, 3, 1549 Search PubMed.
- B. Radisavljevic, A. Radenovic, J. Brivio and A. Kis, Single-layer MoS2 transistors, Nat. Nanotechnol., 2010, 6, 147 CrossRef PubMed.
- K. S. Novoselov, D. Jiang, F. Schedin, T. J. Booth, V. V. Khotkevich, S. V. Morozov and A. K. Geim, Two-dimensional atomic crystals, Proc. Natl. Acad. Sci. U. S. A., 2005, 102, 10451–10453 CrossRef CAS PubMed.
- R. Levi, O. Bitton, G. Leitus, R. Tenne and E. Joselevich, Field-effect transistors based on WS2 nanotubes with high current-carrying capacity, Nano Lett., 2013, 13, 3736 CrossRef CAS PubMed.
- M. A. Py and R. R. Haering, Structural destabilization induced by lithium intercalation in MoS2 and related compounds, Can. J. Phys., 1982, 61, 76–84 CrossRef.
- J. N. Coleman, M. Lotya, A. O'Neill, S. D. Bergin, P. J. King, U. Khan, K. Young, A. Gaucher, S. De and R. J. Smith, Two-Dimensional Nanosheets produced by liquid exfoliation of layered materials, Science, 2011, 331, 568 CrossRef CAS PubMed.
- G. Eda, H. Yamaguchi, D. Voiry, T. Fujita, M. Chen and M. Chhowalla, Photoluminescence from chemically exfoliated MoS2, Nano Lett., 2011, 11, 5111 CrossRef CAS PubMed.
- D. Yang and R. F. Frindt, Li-intercalation and exfoliation of WS2, J. Phys. Chem. Solids, 1995, 57, 1113 CrossRef.
- T. Böker, R. Severin, A. Müller, C. Janowitz, R. Manzke, D. Voß, P. Krüger, A. Mazur and J. Pollmann, Band structure of MoS2, MoSe2, and α–MoTe2:Angle-resolved photoelectron spectroscopy andab initiocalculations, Phys. Rev. B: Condens. Matter Mater. Phys., 2001, 64, 235305 CrossRef.
- A. Conan, A. Bonnet, A. Amrouche and M. Spiesser, Semiconducting properties and band structure of MoTe2 single crystals, J. Phys., 1984, 45, 459 CAS.
- G.-B. Liu, D. Xiao, Y. Yao, X. Xu and W. Yao, Electronic structures and theoretical modelling of two-dimensional group-VIB transition metal dichalcogenides, Chem. Soc. Rev., 2014, 44, 2643–2663 RSC.
- K. F. Mak, C. Lee, J. Hone, J. Shan and T. F. Heinz, Atomically Thin MoS2: A New Direct-Gap Semiconductor, Phys. Rev. Lett., 2010, 105, 136805 CrossRef PubMed.
- H. L. Zhuang, M. D. Johannes, M. N. Blonsky and R. G. Hennig, Computational prediction and characterization of single-layer CrS2, Appl. Phys. Lett., 2014, 104, 022116 CrossRef.
- B. Amin, T. P. Kaloni and U. Schwingenschlogl, Strain engineering of WS2, WSe2, and WTe2, RSC Adv., 2014, 4, 34561 RSC.
- L. Debbichi, O. Eriksson and S. Lebègue, Electronic structure of two-dimensional transition metal dichalcogenide bilayers from ab initio theory, Phys. Rev. B: Condens. Matter Mater. Phys., 2014, 89, 205311 CrossRef.
- F. Güller, A. M. Llois, J. Goniakowski and C. Noguera, Prediction of structural and metal-to-semiconductor phase transitions in nanoscale MoS2, WS2, and other transition metal dichalcogenide zigzag ribbons, Phys. Rev. B: Condens. Matter Mater. Phys., 2015, 91, 075407 CrossRef.
- W. S. Yun, S. W. Han, S. C. Hong, I. G. Kim and J. D. Lee, Thickness and strain effects on electronic structures of transition metal dichalcogenides: 2H-MX2 semiconductors (M = Mo, W;X = S, Se, Te), Phys. Rev. B: Condens. Matter Mater. Phys., 2012, 85, 033305 CrossRef.
- Y. Chen, J. Xi, D. O. Dumcenco, Z. Liu, K. Suenaga, D. Wang, Z. Shuai, Y.-S. Huang and L. Xie, Tunable Band Gap Photoluminescence from Atomically Thin Transition-Metal Dichalcogenide Alloys, ACS Nano, 2013, 7, 4610 CrossRef CAS PubMed.
- A. B. Kaul, Two-dimensional layered materials: Structure, properties, and prospects for device applications, J. Mater. Res., 2014, 29, 348 CrossRef CAS.
- X. Fan, C. H. Chang, W. T. Zheng, J.-L. Kuo and D. J. Singh, The electronic properties of single-layer and multilayer MoS2 under high pressure, J. Phys. Chem. C, 2015, 119, 10189–10196 CAS.
- J. Feng, X. Qian, C.-W. Huang and J. Li, Strain-engineered artificial atom as a broad-spectrum solar energy funnel, Nat. Photonics, 2012, 6, 866–872 CrossRef CAS.
- H. J. Conley, B. Wang, J. I. Ziegler, R. F. Haglund, S. T. Pantelides and K. I. Bolotin, Bandgap Engineering of Strained Monolayer and Bilayer MoS2, Nano Lett., 2013, 13, 3626–3630 CrossRef CAS PubMed.
- N. Lu, H. Guo, L. Li, J. Dai, L. Wang, W.-N. Mei, X. Wu and X. C. Zeng, MoS2/MX2 heterobilayers: bandgap engineering via tensile strain or external electrical field, Nanoscale, 2014, 6, 2879–2886 RSC.
- R. Clarke, E. Marseglia and H. P. Hughes, A low-temperature structural phase transition in β-MoTe2, Philos. Mag. B, 1978, 38, 121 CAS.
- W. G. Dawson and D. W. Bullett, Electronic structure and crystallography of MoTe2 and WTe2, J. Phys. C: Solid State Phys., 1987, 20, 6159 CrossRef CAS.
- J. Heising and M. G. Kanatzidis, Structure of Restacked MoS2 and WS2 Elucidated by Electron Crystallography, J. Am. Chem. Soc., 1999, 121, 638 CrossRef CAS.
- S. W. Hla, V. Marinkovic, A. Prodan and I. Musevic, STM/AFM investigations of β-MoTe2, a-MoTe2 and WTe2, Surf. Sci., 1996, 352, 105–111 CrossRef.
- F. Wypych, T. Weber and R. Prins, Scanning Tunneling Microscopic Investigation of 1T-MoS2, Chem. Mater., 1998, 10, 723 CrossRef CAS.
- E. Revolinsky and D. J. Bebrntsen, Electrical properties of a- and β- MoTe2 as affected by stoichiometry and preparation temperature, J. Phys. Chem. Solids, 1966, 27, 523–526 CrossRef CAS.
- D. Voiry, H. Yamaguchi, J. Li, R. Silva, D. C. B. Alves, T. Fujita, M. Chen, T. Asefa, V. B. Shenoy, G. Eda and M. Chhowalla, Enhanced catalytic activity in strained chemically exfoliated WS2 nanosheets for hydrogen evolution, Nat. Mater., 2013, 12, 850 CrossRef CAS PubMed.
- K. F. Mak, K. He, J. Shan and T. F. Heinz, Control of valley polarization in monolayer MoS2 by optical helicity, Nat. Nanotechnol., 2012, 7, 494 CrossRef CAS PubMed.
- D. Lembke, S. Bertolazzi and A. Kis, Single-layer MoS2 electronics, Acc. Chem. Res., 2015, 48, 100 CrossRef CAS PubMed.
- A. Ambrosi, Z. K. Sofer and M. Pumera, 2H - 1T phase transition and hydrogen evolution activity of MoS2, MoSe2, WS2 and WSe2 strongly depends on the MX2 composition†.pdf, Chem. Commun., 2015, 51, 8450–8453 RSC.
- S. Bhattacharyya and A. K. Singh, Semiconductor–metal transition in semiconducting bilayer sheets of transition-metal dichalcogenides, Phys. Rev. B: Condens. Matter Mater. Phys., 2012, 86, 075454 CrossRef.
- H. Wang, L. Yu, Y. H. Lee, Y. Shi, A. Hsu, M. L. Chin, L. J. Li, M. Dubey, J. Kong and T. Palacios, Integrated circuits based on bilayer MoS2 transistors, Nano Lett., 2012, 12, 4674–4680 CrossRef CAS PubMed.
- L. F. Mattheiss, Band Structures of Transition-Metal-Dichalcogenide Layer Compounds, Phys. Rev. B: Solid State, 1973, 8, 3719 CrossRef CAS.
- S. J. Sandoval, D. Yang, R. F. Frindt and J. C. Irwin, Raman study and lattice dynamics of single molecular layers of MoS2, Phys. Rev. B: Condens. Matter Mater. Phys., 1991, 44, 3955–3962 CrossRef.
- Y.-C. Lin, D. O. Dumcenco, Y.-S. Huang and K. Suenaga, Atomic mechanism of the semiconducting to metallic phase transition in single-layered MoS2, Nat. Nanotechnol., 2014, 9, 391 CrossRef CAS PubMed.
- K. A. Duerloo, Y. Li and E. J. Reed, Structural phase transitions in two-dimensional Mo- and W-dichalcogenide monolayers, Nat. Commun., 2014, 5, 4214 CAS.
- D. Yang, S. J. Sandoval, W. M. R. Divigalpitiya, J. C. Irwin and R. F. Frindt, Structure of single-molecular-layer MoS2, Phys. Rev. B: Condens. Matter Mater. Phys., 1991, 43, 12053 CrossRef CAS.
- R. A. Gordon, D. Yang, E. D. Crozier, D. T. Jiang and R. F. Frindt, Structures of exfoliated single layers of WS2, MoS2 and MoSe2 in aqueous suspension, Phys. Rev. B: Condens. Matter Mater. Phys., 2002, 65, 125407 CrossRef.
- A. P. Nayak, T. Pandey, D. Voiry, J. Liu, S. T. Moran, A. Sharma, C. Tan, C. H. Chen, L. J. Li, M. Chhowalla, J. F. Lin, A. K. Singh and D. Akinwande, Pressure-dependent optical and vibrational properties of monolayer molybdenum disulfide, Nano Lett., 2015, 15, 346 CrossRef CAS PubMed.
- G. Kresse and J. Furthmuller, Efficient iterative schemes for ab initio total-energy calculations using a plane-wave basis set, Phys. Rev. B: Condens. Matter Mater. Phys., 1996, 54, 11169 CrossRef CAS.
- J. P. Perdew, K. Burke and M. Ernzerhof, Generalized Gradient Approximation Made Simple, Phys. Rev. Lett., 1996, 77, 4 CrossRef PubMed.
- J.-J. Kim and C. Park, Observation of a phase transition from the T phase to the H phase induced by a STM tip in 1T-TaS2, Phys. Rev. B: Condens. Matter Mater. Phys., 1997, 56, R15573 CrossRef CAS.
- J. Zhang, J. Liu, J. L. Huang, P. Kim and C. M. Lieber, Creation of nanocrystals through a solid–solid phase transition induced by an STN tip, Science, 1996, 274, 757 CrossRef CAS.
- X. Fan, W. T. Zheng, J. L. Kuo and D. J. Singh, Structural stability of single-layer MoS2 under large strain, J. Phys.: Condens. Matter, 2015, 27, 105401 CrossRef PubMed.
- S. Bertolazzi, J. Brivio and A. Kis, Stretching and Breaking of Ultrathin MoS2, ACS Nano, 2011, 5, 9703–9709 CrossRef CAS PubMed.
- C. Lee, X. Wei, J. W. Kysar and J. Hone, Measurement of the Elastic Properties and Intrinsic Strength of Monolayer Graphene, Science, 2008, 321, 385–388 CrossRef CAS PubMed.
- D. H. Keum, S. Cho, J. H. Kim, D.-H. Choe, H.-J. Sung, M. Kan, H. Kang, J.-Y. Hwang, S. Kim, H. Yang, K. J. Chang and Y. H. Lee, Bandgap opening in few-layered monoclinic MoTe2, Nat. Phys., 2015, 11, 482 CrossRef CAS.
- D. Puotinen and R. E. Newnham, The crystal structure of MoTe2, Acta Crystallogr., 1961, 14, 691 CrossRef CAS.
- Y. L. Huang, Y. Chen, W. Zhang, S. Y. Quek, C.-H. Chen, L.-J. Li, W.-T. Hsu, W.-H. Chang, Y. J. Zheng, W. Chen and A. T. S. Wee, Bandgap tunability at single-layer molybdenum disulphide grain boundaries, Nat. Commun., 2015, 6, 6298 CrossRef PubMed.
- M. B. Vellinga, R. D. Jonge and C. Haas, Semiconductor to metal transition in MoTe2, J. Solid State Chem., 1970, 2, 299 CrossRef CAS.
Footnote |
| † Electronic supplementary information (ESI) available: Calculations of the effect of changes in lattice parameters on the energy barrier, changes in lattice parameters along the c-axis in the process of phase trantion from 2H to 1T′, the effect of a-axis compression under the b-axis tensile strain for MoTe2 and the effect of a-axis expansion under b-axis compressive strain for WTe2. See DOI: 10.1039/c5cp06706e |
| This journal is © the Owner Societies 2016 |

