Identification of optimally stable nanocluster geometries via mathematical optimization and density-functional theory†
Received
18th August 2019
, Accepted 25th September 2019
First published on 25th September 2019
Abstract
Small nanoparticles, a.k.a. nanoclusters, of transition metals have been studied extensively for a wide range of applications due to their highly tunable properties dependent on size, structure, and composition. For these small particles, there has been considerable effort towards theoretically predicting what is the most energetically favorable arrangement of atoms when forming a nanocluster. In this work, we develop a computational framework that couples density-functional theory calculations with mathematical optimization modeling to identify highly stable, mono-metallic transition metal nanoclusters of various sizes. This is accomplished by devising and solving a rigorous mathematical optimization model that maximizes a general cohesive energy function to obtain nanocluster structures of provably maximal cohesiveness. We then utilize density-functional theory calculations and error term regression to identify model corrections that are necessary to account with better accuracy for different transition metals. This allows us to encode metal-specific, analytical functions for cohesive energy into a mathematical optimization-based framework that can accurately predict which nanocluster geometries will be most cohesive according to density-functional theory calculations. We employ our framework in the context of Ag, Au, Cu, Pd and Pt, and we present sequences of highly cohesive nanoclusters for sizes up to 100 atoms, yielding insights into structures that might be experimentally accessible and/or structures that could be used as model nanoclusters for further study.
 Chrysanthos E. Gounaris | Chrysanthos Gounaris is an Associate Professor of Chemical Engineering at Carnegie Mellon University. He received a Dipl. in Chemical Engineering and an M.Sc. in Automation Systems from the National Technical University of Athens, as well as an M.A. and a Ph.D. in Chemical Engineering from Princeton University. Before joining Carnegie Mellon, he worked at McKinsey & Co. as an Associate. His research interests lie in the development of theory and quantitative methodologies for decision-making. He has published predominantly on the optimization of production and supply chain operations, having won a number of best paper awards, and he has worked extensively with industry to address real life problems in these fields. Part of his research currently aims to bring combinatorial optimization expertise to the realm of crystalline materials, where there exist opportunities for rigorous, mathematics-driven design at the nanoscale level. |
Design, System, Application
Due to their many tunable characteristics, including size, shape, and composition, small metallic nanoclusters are an important material class for a broad range of applications. To date, many approaches for identifying minimum energy, or ground-state, structures have been explored in the theoretical study of nanoclusters. In this work, we propose that the task of identifying a minimal energy nanocluster structure can be handled with design methods and optimization algorithms common in many other fields, notably including process design. Our approach constitutes a rigorous framework for casting the design of mono-metallic nanoclusters as a special class of optimization problems called mixed-integer linear programs, which can be solved readily and exactly using well-established numerical methods. By contrasting the results of our optimization model with density-functional theory calculations, we evaluate the accuracy of our solutions and regress corrective factors to improve energy predictions. This approach allows for the quick determination of unintuitive, energetically favorable structures that are amenable for synthesis and/or can be utilized for further scientific study. Although the focus in this work is on mono-metallic, face-centered cubic nanoclusters, the framework can be extended to accommodate multi-metallic systems and additional crystal geometries.
|
1 Introduction
Small transition metal nanoclusters possess properties that are highly dependent on size, shape, and composition. Optimizing these material parameters can lead to drastically improved material performance for application in catalysis,1–4 electronics,5 and biological systems.6 One key research question in the study of small transition metal nanoclusters is to identify the most stable morphology for a nanocluster of exactly N metal atoms.7 While it is possible to determine stable sizes of small nanoclusters experimentally by measuring the frequency in which those sizes appear during synthesis, morphological trends in small clusters are difficult to elucidate since small particles cannot be observed in high enough resolution to discern specific atomic arrangements.8 Therefore, understanding small nanocluster morphology requires complementary theoretical calculations and predictions.
In order to determine the most stable structure for a nanocluster, one must identify the configuration of atoms with the lowest total energy, as assessed with some empirical or semi-empirical function, or some ab initio calculation for the potential energy.9 However, determining the global minimum energy structure for a nanocluster of N atoms is a highly combinatorial problem that is a member of the NP-hard complexity class of computational problems.10 This means that, in principle, one might be required to evaluate the energy of each possible arrangement of atoms, which is generally an intractable task. Despite such challenges, sophisticated meta-heuristic search algorithms have been employed to search for minimum energy mono- and bi-metallic nanocluster morphologies.11,12 Approaches of this type include genetic algorithms,13 basin-hopping,14 and simulated annealing.15 While the reported structures are in general highly stable, and may indeed be ground state geometries, they are not provably optimal against the stability metric used because meta-heuristic search algorithms use arbitrary termination criteria that lack guarantees of searching the entire solution space. Without a proof of optimality upon completion, such algorithms might converge to a local minimum, as opposed to the true, global minimum. In this work, we propose a complementary approach that is based on a mathematical optimization-based framework, and we formulate a mixed-integer linear programming (MILP) model for determining minimum energy structures of three-dimensional, mono-metallic nanoclusters. The distinctive feature of our approach is that, when solved to algorithmic termination by an appropriate MILP numerical solver, the model returns a low energy nanocluster that is guaranteed to be globally optimal up to the accuracy of the energy functional used and the flexibility afforded by the explicitly encoded lattice.
The geometry of a minimum energy nanocluster of a given size is assumed in this work to be the one that attains the maximum cohesive energy (Ecoh). The cohesive energy is chosen as a good proxy for the particle's overall stability because it measures the cumulative strength of interatomic bonding between atoms. As a first pass, our mathematical model utilizes an analytical cohesive energy function first proposed by Tománek et al.,16 which stipulates that the contribution of each atom to the total cohesive energy of a particle depends only on its coordination number (CN), i.e., the number of neighbors surrounding this atom within the lattice. Previous work has successfully utilized the CN as a catalytic site descriptor to design transition metal surfaces via mixed-integer linear programming techniques.17 The work presented here extends such techniques towards the design of three-dimensional nanoclusters. Notably, the rigorous optimality guarantees afforded to us by the MILP-based approach often allow us to identify unintuitive and previously unconsidered designs that complement the breadth of existing results in the identification of low-energy small nanoclusters. It should be noted, however, that the new approach only seeks structures on a predefined, discrete lattice. This means that only structures that conform to the chosen lattice can be identified as optimal, highlighting the need for the user to provide a lattice input that can accommodate reasonable expectations about the geometry of highly cohesive structures.
The contributions of the present work are three-fold. First, we use rigorous mathematical modeling and optimization to identify highly cohesive nanocluster geometries. Next, we use high-accuracy, computational chemistry methods to regress metal-specific models for nanocluster cohesive energy. And finally, we conduct a comprehensive computational study to identify sequences of minimum energy structures unique to different metals and for a wide range of sizes (number of atoms). The remainder of the manuscript is structured as follows. In section 2, we discuss a model for cohesive energy that solely depends on the coordination number of a nanoparticle's atoms. In section 3, we utilize this cohesive energy function to derive and solve a mathematical optimization model for identifying highly cohesive mono-metallic nanoclusters at given sizes. Utilizing density-functional theory, in section 4 we calculate the exact cohesive energies of our nanocluster structures, and we use these results to regress more accurate, metal-specific models of cohesive energy. We then embed these more accurate functions within the optimization model and re-solve it to identify optimally cohesive structures for various metals of interest. Finally, we conclude with some final remarks in section 5.
2 Square root bond-cutting model of cohesive energy
The cohesive energy, Ecoh, of a material represents the energetic benefit imparted when neutral metal atoms come together from infinite separation to form a crystalline solid. It has been shown that the moment expansion method for determining the electron density-of-states can accurately describe cohesion in transition metals.18,19 Based on this result, a transition metal atom contributes to the cohesiveness of a nanocluster proportionally to the square root of its coordination number.16,18,19 Therefore, the average (per atom) cohesive energy of a transition metal nanocluster can be represented as a function of the coordination numbers of all its N atoms according to eqn (1).| |  | (1) |
In the above equation, CNi refers to the coordination number attained by the ith atom, CNmax is an integer parameter specifying the maximum attainable coordination number for a given crystal lattice, EBULKcoh is the cohesive energy of the bulk material, and ER is a residual energy term. The residual term ER represents repulsive interactions between atoms in a nanocluster at non-equilibrium interatomic distances. Whereas this term is especially prevalent at small sizes N,20 there generally exists no closed-form representation for it. Hence, we shall initially neglect it by assuming ER = 0. This model with no residual energy term is also referred to as the square root bond-cutting (SRB) model for cohesive energy.21 Importantly, the SRB model is MILP-representable via standard modeling methods described in the following sections, opening up interesting possibilities for its inclusion as the basis of a tractable optimization model for nanocluster design.
From this point onwards, when we refer to cohesive energy, we will be referring to its dimensionless form, which is the above defined quantity (Ecoh) normalized to (divided by) the value of EBULKcoh, and which can thus attain values between 0 and 1, irrespective of the identity of the material involved.
3 Mathematical optimization-based design
We shall now propose a mathematical optimization modeling framework for determining the minimum cohesive energy structures of three-dimensional, mono-metallic nanoclusters. In this framework, sites on a crystal lattice are indexed via the set i ∈ I. We refer to this set as a canvas, as it constitutes the space wherein an allotment of N atoms can be placed to design the nanoclusters. For each lattice site i, we introduce a binary design variable, Yi, to indicate the presence or not of an atom on this site. If Yi = 1, an atom exists at canvas location i, while if Yi = 0, the canvas site is devoid of an atom. Using this framework, it is possible to represent any nanocluster design as a collection of “0/1” values for all design variables in the canvas.
The size and shape of the canvas should be carefully selected by the modeler. For example, if one wishes to design a face-centered cubic (FCC) nanocluster with N = 100 atoms, a possible canvas to use would be a cuboctahedral geometry and 561 lattice sites (i.e., 5 shells of a perfect cuboctahedron). However, one should keep in mind that the difficulty of solving the nanocluster optimization model depends upon the size of the canvas (degrees of freedom) in relation to how much of the canvas should be occupied (size of the nanocluster), and that there exists a trade-off between numerical tractability and flexibility to accommodate any conceivable nanocluster design of a particular size N. Finally, it should be noted that, although we focus this study on FCC nanoclusters, the concept of a canvas, and thus our proposed optimization model, can be easily extended for the design of nanoclusters with any crystalline geometry.
3.1 Basic optimization model
Given the degrees of freedom Yi to indicate the placement of atoms as well as auxiliary variables CNi to encode the coordination number at every canvas location i ∈ I,‡ the basic optimization model to identify maximally cohesive transition-metal nanoclusters is given below in eqn (2) to (10).| |  | (2) |
| |  | (3) |
| |  | (4) |
| | | {Yi = 1} ⇒ {CNi ≥ CNmin} ∀ i ∈ I | (5) |
| | | {Yi = 0} ⇒ {CNi ≤ 0} ∀i ∈ I | (6) |
| | | 0 ≤ CNi ≤ CNmax ∀i ∈ I | (7) |
| | | All atoms are connected | (9) |
| | | Nanoclusters are non-hollow | (10) |
The model's objective function, eqn (2), consists of the (dimensionless) SRB cohesive energy function, which we seek to maximize. Eqn (3) defines the nanocluster's size (number of atoms), where N is an integer parameter of the model to be provided as a constant. For occupied canvas locations, eqn (4) sets the auxiliary variables CNi to their applicable values,§ where the sets Li have been defined to represent the neighboring sites to each location i. At the same time, eqn (5) ensures that all atoms adhere to some minimum value, CNmin, which is provided to avoid low-coordinated, unrealistic atom placement. Eqn (6) enforces that, if no atom is placed at location i, then the corresponding CNi variable attains the value of 0, hence, prohibiting unoccupied locations from contributing to the objective function. Note that the implication constraints 4 to 6 can be transformed to standard linear equations using well-known MILP modeling techniques, such as the so-called big-M reformulation, which is what we used in our implementation.
Eqn (7) declares the non-negativity of the coordination number variables, as well as enforces applicable upper bounds on their possible values. Here, the upper bound of CNmax is chosen as the maximum achievable coordination number in a given canvas, as determined by the applicable lattice. Finally, eqn (8) explicitly enforces the integrality constraint for the binary variables Yi.¶ We remark that, for the FCC geometry used in this study, we use constant values CNmin = 3 and CNmax = 12, meaning that any given atom is allowed to have at least three and at most twelve nearest neighbors. For other crystalline geometries, other appropriate values should be used (e.g., for body-centered cubic, CNmax = 8).
There also exist two additional requirements on our nanocluster designs, namely those of connectivity and non-hollowness. The purpose of requiring connectedness is to avoid presumed solutions where the N atoms have been divided into two or more smaller nanoclusters. The requirement for non-hollowness is imposed to avoid nanocluster designs that feature void enclosed volume. Because it is not straightforward to represent such requirements as explicit constraints on our model's decision variables, we only present them conceptually in eqn (9) and (10), respectively. These two constraints are enforced dynamically during the solution procedure via a lazy-constraint interface, which is available in modern MILP solvers. Omitting many details at the interest of brevity, the main idea is to inspect every design as soon as it is returned by the numerical solver, and if found to be either disconnected or hollow, to add an integer cut constraint to the model so as to explicitly render this specific design infeasible, eliminating the possibility that this design persists as the final optimal solution identified by the framework.
3.2 Concave objective function
We remark that the objective function is a non-linear, concave function in variables CNi. Whereas at first glance this equation appears incompatible with an MILP model, we can reformulate it into an MILP-representable form due to the special mathematical structure of the model, namely the integrality of variables CNi and the fact that we seek to maximize such a concave function. More specifically, we introduce a new set of auxiliary variables, CNRi, to represent the square root value of the coordination number at each canvas location i ∈ I, adding also the following bound definitions.| |  | (11) |
We can now choose to model the square root of the coordination number not as a smooth function, rather as a set of secant lines passing through points on the curve  at integer values of CNi, as shown in Fig. 1 for the case of an FCC lattice. Note how this approximation of the square root function is exact at all locations of interest, namely the integer values of CN. The secant-line definition of CNRi is then imposed in the model viaeqn (12), where α
![[small script l]](https://www.rsc.org/images/entities/char_e146.gif) and β
and β![[small script l]](https://www.rsc.org/images/entities/char_e146.gif) are appropriate constants to represent the slope and intercept, respectively, of each consecutive secant line
are appropriate constants to represent the slope and intercept, respectively, of each consecutive secant line ![[small script l]](https://www.rsc.org/images/entities/char_e146.gif) .
.
| | CNRi ≤ α![[small script l]](https://www.rsc.org/images/entities/char_e146.gif) CNi + β CNi + β![[small script l]](https://www.rsc.org/images/entities/char_e146.gif) ∀i ∈ I, ∀ ∀i ∈ I, ∀![[small script l]](https://www.rsc.org/images/entities/char_e146.gif) ∈ {1,2,…,CNmax} ∈ {1,2,…,CNmax} | (12) |
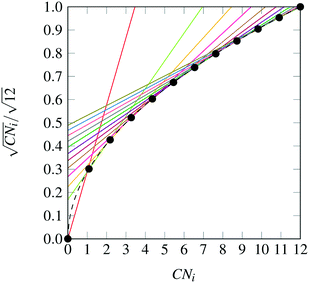 |
| | Fig. 1 Square root bond-cutting model for cohesive energy (dimensionless) of an FCC atom i, plotted against CNi. Also shown are the secant lines used to exactly represent the evaluations of cohesive energy at integral CNi values. | |
Finally, the objective function is then replaced with eqn (13). Note that, because we are maximizing the cohesive energy, the optimizer has the incentive to choose the exact value of the applicable (intersection of) secant lines, as it is the maximally attainable value permitted by the inequality in eqn (12). Hence, this substitution models the SRB cohesive energy not only in a linear form, but also exactly (i.e., without approximation error).
| |  | (13) |
3.3 Symmetry breaking
Due to the highly symmetric nature of crystallographic spaces, there exist many isomorphically equivalent ways to represent the same nanocluster in a canvas, by means of rotation, translation and reflection operations. More specifically, the FCC lattice is close-packed and has two-, three- and four-fold axes of symmetry. Symmetry of this form makes the MILP model more difficult to solve to optimality due to the large number of equivalent, feasible solutions. In order to mitigate this effect, eqn (14) and (15) were added to the model as symmetry-breaking constraints. These constraints aim to eliminate some isomorphic solutions from the design space, while guaranteeing that at least one representative solution remains feasible in the resulting model, and hence, that at least one isomorphic equivalent of the optimal nanocluster is accessible from the design space induced by the model.| |  | (14) |
| |  | (15) |
The sets Is+, Is− and Is0 in the symmetry-breaking constraints represent suitable partitions of the canvas, as dictated by three intersecting crystallographic planes, s. Any lattice site i in the canvas can be viewed as being “above” plane s, i ∈ Is+, “below” plane s, i ∈ Is−, or “on” plane s, i ∈ Is0. By restricting the distribution of atoms in the canvas to be approximately balanced, many isomorphically equivalent solutions are removed from the set of feasible solutions.
3.4 Improving numerical tractability
The mathematical optimization model presented in the previous section can be addressed by any off-the-shelf MILP solver. However, the latter being a form of numerical software, it is subject to numerical tractability issues when applied on models that feature large feasible spaces, such as those that arise when we use large values of N. In order to improve solution performance at all N values we wish to consider in this study, we choose to apply our model sequentially, increasing the value of N one at a time. As we do so, we adapt the canvas for optimizing the N-atom nanocluster based on the shape of the optimal (N − 1)-atom design. In addition, recognizing that in large clusters there is a significant amount of bulk atom sites, we fix certain binary variables in central locations of the canvas, again being informed by optimal solutions preceding in the sequence. Below we elaborate further on these algorithmic enhancements to our framework.
3.4.1 Adaptively selecting the canvas size and shape.
In order to ensure that the MILP solver has enough degrees of freedom to enumerate and identify the optimal nanocluster at a given size, a sufficiently large canvas must be used. Ideally, this size of the canvas should be as large as possible, so that the MILP solver has access to a design space that is guaranteed to include the optimal nanocluster geometry. However, the tractability of the problem scales inversely with the size of the canvas. In order to alleviate this issue, the shape and size of the canvas is determined by the optimal solution of the (N − 1)-atom nanocluster. Starting with N = 4, where the optimal solution is easily determined (e.g., using the unenhanced framework) to be a tetrahedron,|| all following canvases can be constructed by taking the (N − 1)-atom optimal nanocluster and expanding it by two complete shells around that particle. We have empirically determined that this procedure leads to sufficiently large design spaces, as maximizing cohesive energy will tend toward centralized, roughly spherical shapes. It also ensures that the canvas is not excessively large at smaller values of N.**
3.4.2 Simplifying by fixing select atom positions.
Another enhancement we have applied in order to improve our framework's numerical tractability is the fixing (to the value of 1) of certain Yi variables based on optimal solutions at smaller N values. This decreases the complexity of the optimization problem by decreasing its degrees of freedom (number of the unfixed binary decision variables). Physically, this forces some lattice positions to be occupied by an atom in all solutions considered in the design space.
The algorithm for selecting which atoms to fix is as follows. If N ≥ m, consider the set of the previous m optimal nanoclusters, O = {N – 1, N – 2,…, N – m}. Enumerate all rotations of each of the nanoclusters in O that satisfy the symmetry-breaking constraints of eqn (14) and (15), and denote the set of these transformed nanoclusters as O*. The atoms that will be fixed at lattice locations i are those that appear in all nanoclusters in the set O*. In other words, if a particular atom is present in the m previous optimal solutions, we expect it to arise again in the current solution. In this work, m = 6 was used at all N sizes, because this setting was found to provide sufficiently conservative sets of lattice locations to fix, while also significantly improving the tractability at all N.
4 Results and discussion
The nanocluster optimization model was solved with and without the numerical enhancements of canvas sizing and atom fixing. In the model instances solved without enhancements, the canvas was taken to be the 561 lattice site cuboctahedron. Resulting cohesive energies at consecutive sizes N are shown in Fig. 2a and b. Each model was solved using the MILP solver CPLEX 12.8,22 using a one hour time limit and four threads in parallel mode. Additionally, each run was provided with an initial solution via the MIP start feature of this solver. The initial solution used at a given N was generated by taking the (N − 1)-atom nanocluster solution and attaching on its surface a single atom in the most favorable (out of all feasible options) position.
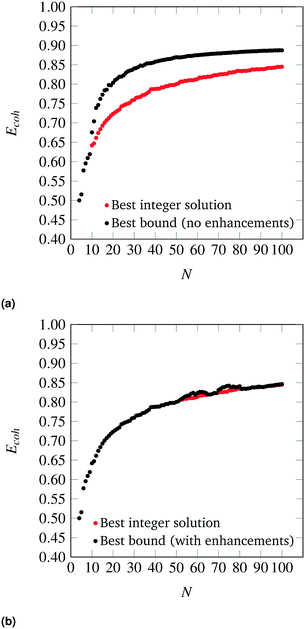 |
| | Fig. 2 Best solutions and best upper bounds at termination for N = 4–100, using the MILP model without (2a) and with (2b) algorithmic enhancements. | |
First, it should be noted that, as N increases, the best integer solutions asymptotically approach the value of 1, that is, the optimal cohesive energies approach the bulk cohesive energy of the material, which is consistent with the expected behavior of the SRB function. However, there are some instances where the cohesive energy does not trend monotonically as N increases. This has been observed in the literature and can be explained via the concept of magic number effects.23
It is also clear that, without enhancements, the solver fails to prove the optimality of its best identified designs (red dots) for cases as low as N = 10. This is likely due to poor LP relaxations that are observed while integrality is relaxed, as the mass of all N atoms is diffused across all sites in the canvas. It is also clear that, without enhancements, the solver fails to prove the optimality of its best identified designs (red dots) for cases as low as N = 10.
On the other hand, once the proposed enhancements are enabled, the performance of the MILP solver drastically improves, and the solver is able to close the optimality gap in all cases except the regimes N = 54–64 and N = 70–80, where some very small gaps remain. This can be explained by inspecting how the set of central fixed atoms evolves over N. In the ranges where the upper and lower bound are not equal at termination, there are approximately ten fewer fixed binary variables, when compared to the following and preceding sequences. This increase in free binary variables decreases the tractability of these instances, as compared to those with fewer degrees of freedom, leading to non-zero, yet small, gaps after the imposed time limit.
Table 1 shows some representative optimal solutions. We observe that these generally possess a somewhat octahedral shape, in accordance with empirical expectation. Furthermore, it is worthy to note that there was never a case when, by solver termination, the unenhanced framework had identified an integral solution that was better that the one having been identified by the enhanced framework. To this end, we believe that the algorithmic enhancements do not cause optimal solutions to be eliminated from the design spaces, and hence, they are welcome to adopt moving forward inasmuch as they improve tractability without any deterioration in solution optimality. The schematics of all optimal structures are plotted in the Appendix, while the exact atomic coordinates are provided as XYZ files in the ESI.†
Table 1 Representative optimally-cohesive nanocluster geometries, as predicted by the MILP-model maximizing the SRB cohesive energy
|
N = 10 |
N = 20 |
N = 30 |
N = 40 |
N = 50 |
N = 60 |
N = 70 |
N = 80 |
N = 90 |
N = 100 |

|

|

|

|

|

|

|

|

|

|
4.1 Metal-specific model corrections
The SRB model for cohesive energy is known to be an approximation for the true cohesive energy of small metallic clusters. Firstly, the SRB cohesive energy model neglects the residual energy term for non-ideal interatomic interactions proposed by Tománek et al.16 Secondly, the SRB cohesive energy model has no metal-specific considerations, essentially assuming that all metals will form bonds in the same way, which is a poor assumption for small nanoclusters where quantum effects are prominent. Thus, there exists a need to develop more accurate, metal-specific, yet still MILP-representable, formulas for cohesive energy that correct the SRB model.
4.1.1 Collection of nanocluster structures for comparison.
First, the enhanced optimization framework, in its original form using the SRB model as its objective, was utilized to identify a set of highly cohesive nanocluster geometries at a range of sizes. For this, we used the solution pool of the CPLEX solver, which allows us to identify the k-best integral solutions to an MILP model at a computational cost that is only marginally higher than that of a standard run to identify just the (one) optimal solution. More specifically, for sizes N = 13–25, the best k = 10 nanocluster geometries were collected, with an additional data point at N = 20 to include a perfect tetrahedron. For N = 26–40, we collected the best k = 3 nanocluster geometries, while for N = 41–100, only the optimal nanocluster was collected. This led to a total of 236 highly cohesive nanoclusters, with most of the data in the N = 13–40 size regime. With all values of N, a four hour time limit was imposed to collect such solution pools.
4.1.2 Comparison with DFT-predicted energies.
The identified optimal and near-optimal structures were then evaluated with density functional theory (DFT) for their “true” cohesive energies in the context of five transition metals of interest, namely silver (Ag), gold (Au), copper (Cu), palladium (Pd) and platinum (Pt). These metals were chosen due to their array of applications in catalysis and alternative energy applications.24–26 All DFT calculations were performed in the CP2K computational package27 with the PBE functional,28 DZVP basis set,29 and GTH pseudopotentials.30 These methods have been successfully used in the past to evaluate the energetics of metal clusters.21 Note that we used the MILP-predicted optimal clusters as input structures for the DFT calculations, with their interatomic distances being set to those in the bulk. The bulk cohesive energy, as calculated by PBE, was used as a consistent energy reference for our comparisons with DFT. Single-point energy evaluations were performed on the interatomic scaled monometallic clusters.31
The parity plots between the energies predicted by the SRB cohesive energy function and by DFT are shown in Fig. 3 (black dots). From the parity plots of Fig. 3, it is clear that the SRB cohesive energy is over-estimating the cohesive energy in all cases. This is likely due to (metal) group-dependent effects such as stresses and surface relaxations,32,33 which are not considered by the metal-agnostic SRB function and which may be the source of the prediction errors observed. We remark that, in our DFT calculations, metal-specific stresses are present because we do not relax the nanoclusters and rather constrain the atoms to sit on perfect lattices with set bulk interatomic spacings. The latter can deviate from DFT-calculated spacings and can also change in a metal-dependent fashion at the nanoscale.
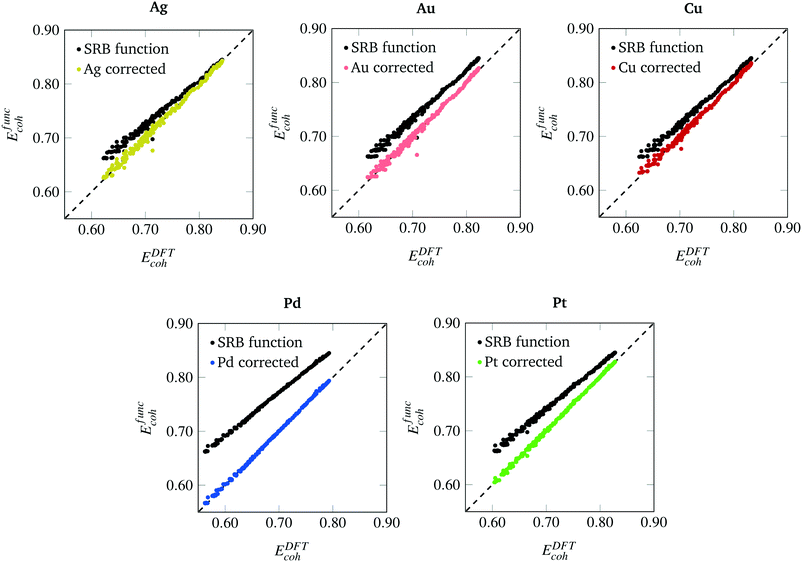 |
| | Fig. 3 Parity plots between cohesive energies calculated by the SRB model (y-axis), with and without metal-specific corrections, and by DFT (x-axis) for various metals. | |
The degree of error varies across metals. In fact, the SRB function estimates the cohesive energy of the group 11 metals (Au, Ag, Cu) significantly better than the group 10 metals (Pd, Pt). In general, the approximation is poorer at lower cluster sizes, and better at larger sizes. Indeed, the SRB approximation is known to increase in accuracy for all metals as nanoclusters approach bulk material size. Finally, it should be noted that the outlier in each plot of parity is the N = 20 tetrahedron. This structure is known to exhibit special quantum effects that enhance its stability in DFT calculations for group 10 metals like Au.34,35 Hence, it is not surprising that the SRB model, which ignores such effects, does a poor job at predicting its cohesive energy.
4.1.3 Regression of corrective terms.
Using the parity plots from the previous analysis as a guide, metal-specific corrective terms in the coordination-dependent function for cohesive energy can now be identified using a constrained regression process. The focus has been on deriving corrections that are MILP-representable, so that they can be embedded in our MILP-based nanocluster design framework. Furthermore, it is desirable for these corrections to reference quantities already encoded in our optimization formulation (e.g., the coordination numbers CNi), so as not to further increase its complexity. To achieve this, a linear regression was performed, the details of which are found in the Appendix. The general form for the corrected dimensionless cohesive energy models (Emcoh, where the superscript m stands for a specific metal) is shown in eqn (16). The basis functions - or features- we used to determine the regression coefficients γmk are the fractions, fCNk, of atoms in the nanocluster that attain a specific coordination number k (between the admissible values CNmin and CNmax), as per the definition of eqn (17). Conceptually, this selected functional form of Emcoh captures metal-specific cohesive energies via an “offset” from the SRB model prediction.| |  | (16) |
| |  | (17) |
After solving the regression model discussed in the Appendix, we obtain metal-specific variations of the cohesive energy from the SRB model, as shown in Fig. 4. The most dramatic shifts in the per-atom energy contributions are exhibited for the case of Pd, which reflects the fact that the SRB function over-estimates the DFT-predicted energies the most. Interestingly, for the cases of Pd, Cu and Au, there are consistent decreases in energetic contributions from all CN values, while the Pt and Ag models promote contributions (i.e., impart cohesive energy greater than the SRB model) from highly-coordinated atoms. We note that these results may, in part, be due to the fact that transition metals are well-known to possess metal-dependent nanoscale strain,9,32 which could be captured here through the metal-specific deviations from the SRB function.
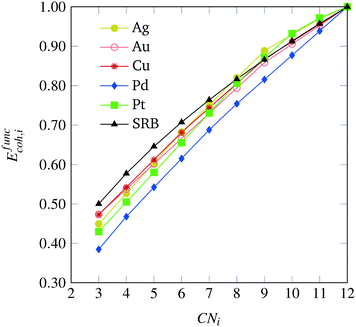 |
| | Fig. 4 Metal-specific corrections to the original SRB model for cohesive energy, identified via constrained regression based on DFT predicted values. | |
4.2 Metal-specific cohesive energy optimization
Using the collected DFT data and methods outlined previously, metal-specific functions for nanocluster cohesive energy were regressed to predict nanocluster cohesive energies with greater accuracy. The same set of highly cohesive nanoclusters is evaluated with the metal-specific cohesive energy models and plotted against the DFT predictions in Fig. 3. It is clear that the new cohesive energy function predicts the cohesive energies of these nanoclusters much better than the original SRB function.
In fact, because of the shifts in per-CN cohesive energy contributions in the surrogate models for each metal m, Emcoh, it is possible that the optimal, most cohesive structures at a certain size N might change from what was determined previously using merely the SRB function. In order to design transition metal nanoclusters that are guaranteed to possess maximal cohesive energies against the more accurate, DFT-based evaluation, the surrogate cohesive energy functions were embedded in the formulation of our mathematical optimization model. More specifically, the original objective function (eqn (2)) of the optimization model was replaced with the surrogate models by simply shifting the set-points of the secant lines (Fig. 1). Apart from this change in the objective function, the rest of the optimization model remained unchanged. The examples of new optima determined this way are shown in Table 2. The new optima identified for all sizes N and metals m we considered in this study are depicted in Fig. 7–11, and the corresponding structure files are provided in the ESI.†
Table 2 Comparison of a few optimal nanocluster structures as determined by the SRB function (first row) and the new optimal structures determined by the corrected models for different metals (second row)
|
|
N =19 |
N = 22 |
N = 36 |
N = 42 |
N = 83 |
| SRB |

|

|

|

|

|
| Metal-specific |
 Pd19 Pd19 |
 Ag22 Ag22 |
 Au36 Au36 |
 Cu42 Cu42 |
 Pt83 Pt83 |
It should be noted that the nature of the canvas used in this study (FCC lattice) means that only FCC structures are identified here as optimally cohesive. This can be a valid assumption for certain regimes, such as in the case of smaller Pd clusters that have been shown to trend toward FCC structures over non-crystalline alternatives.36 Furthermore, the modified octahedral shape of many of the optimal nanoclusters predicted by our framework at intermediate sizes is in agreement with some previously reported results.37–39 However, we should acknowledge that non-FCC structures featuring decahedral40 or icosahedral9,41 geometries can also arise in transition metal nanoclusters. This is due to the fact that such 5-fold symmetric structures maximize the coordination of surface atoms, which is especially favored at small N where the strain induced by this surface packing is not prohibitive. Whereas the current study did not search over the space of non-FCC geometries, and thus could not obtain results reflecting the above cases, our framework could be modified to do so via the use of appropriately defined canvases that can accommodate all reasonably expected possibilities regarding non-FCC placements, including 5-fold symmetric lattices. In addition, we could introduce additional terms to our objective function of cohesive energy so as to reproduce special cases of enhanced stability that arise due to magic number phenomena via electronic shell closures23 (e.g., the N = 20 Au tetrahedron33,34) or relativistic effects42 (e.g., planar Au nanoclusters41,43–45). In any case, it should be highlighted that, once optimal FCC structures are obtained under the current model setup, it is advisable to subject them to local energetic relaxation using any appropriate, sophisticated functional of choice, in order to determine the precise off-lattice placement, whenever applicable.
5 Conclusions
In this work, we developed a methodology that combines mathematical optimization with DFT calculations for designing highly cohesive transition metal nanoclusters (see Fig. 5). We first focused on using the SRB cohesive energy function and developed a mathematical optimization model to identify highly cohesive structures of small, mono-metallic nanoclusters ranging in sizes from 13 to 100 atoms. We showed that the tractability of this optimization model can be significantly improved with careful selection of the design canvas and a core part of the latter where the presence of atoms can be safely assumed. DFT calculations were then used in the context of constrained regression to quantify required corrections to the SRB function so that the true energetics of small nanoclusters can be satisfactorily captured. Embedding these corrections into the optimization model led to the identification of unintuitive, yet optimally cohesive (up to DFT accuracy), nanocluster designs of gold, silver, copper, palladium, and platinum. Moving forward, these designs can serve as model structures for a wide spectrum of computational chemistry studies involving nanoclusters in fields ranging from catalysis to targeted delivery.
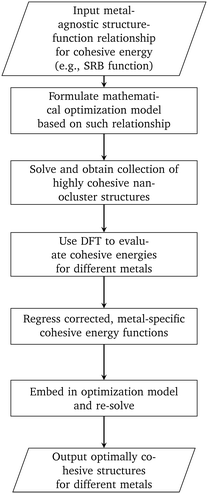 |
| | Fig. 5 Methodology for designing nanoclusters that are optimally cohesive under DFT accuracy. | |
Appendix
SRB function corrections via constrained regression
The constrained regression optimization model used to identify coefficients for the metal-specific cohesive energy functions is shown in eqn (18)–(21). This regression model, which is parameterized by the metal type m, was applied separately for each specific m investigated in this study. The objective function (eqn (18)) represents the sum of squared errors for each of the n = 236 nanocluster structures used as input data (see section 4.1.1 for further details as to the origin of these structures). The error for a particular nanocluster structure j is calculated as the difference between its DFT-predicted cohesive energy and its evaluation of energy Emcoh from eqn (16). In order to ensure that the same linearization methods can be used on the new objective function in the context of the MILP optimization model (see discussion in section 3.2), constraints for concavity of the new Emcoh functions are added to the regression viaeqn (19). Additionally, a set of hierarchical constraints (eqn (20)) is added to enforce that the cohesive energy functions increase monotonically with the CN, while the assertion in eqn (21) enforces that no correction is required for the contribution of bulk atoms, which always equals one (in dimensionless terms). Together, these constraints ensure that no individual atom's energy contribution surpasses that of the bulk.| |  | (18) |
| |  | (19) |
| |  | (20) |
Optimal nanoclusters
We present here the detailed list of nanocluster designs identified via our optimization framework. Fig. 6 shows the optimal clusters identified by maximizing the SRB function for cohesive energy. Fig. 7 to 11 show optima identified by maximizing the metal-specific functions (Emcoh) of cohesive energy. Note that, at the interest of space, we only present the structures that differ from the ones predicted by the SRB function.
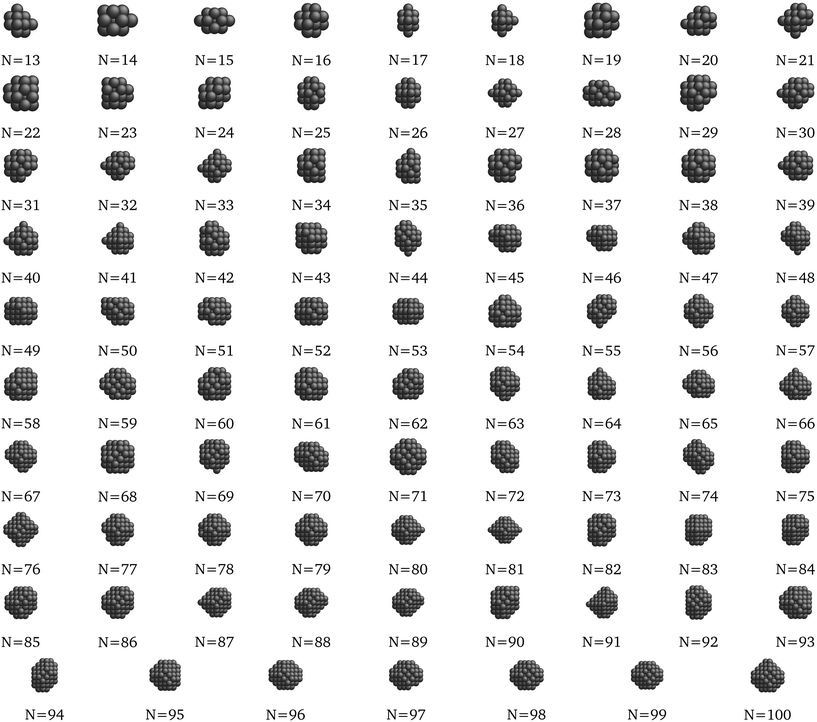 |
| | Fig. 6 Most cohesive structure according to the SRB cohesive energy function for every N. | |
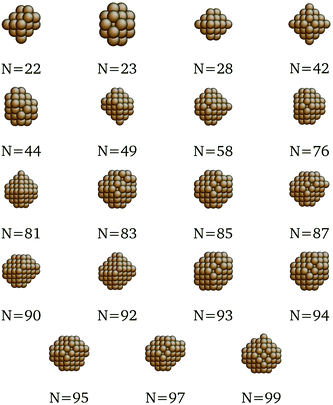 |
| | Fig. 7 New optima at various N, as determined by the Cu-corrected function for cohesive energy. | |
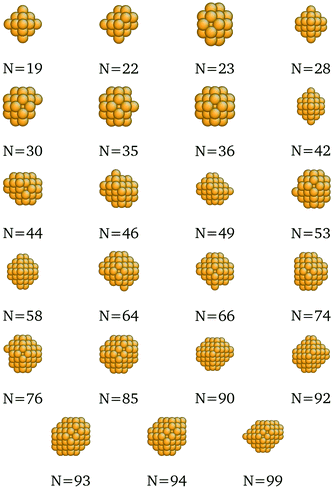 |
| | Fig. 8 New optima at various N, as determined by the Au-corrected function for cohesive energy. | |
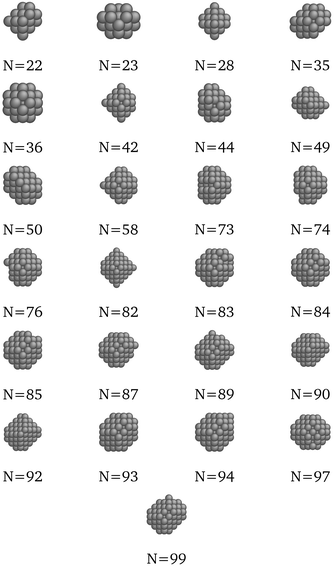 |
| | Fig. 9 New optima at various N, as determined by the Ag-corrected function for cohesive energy. | |
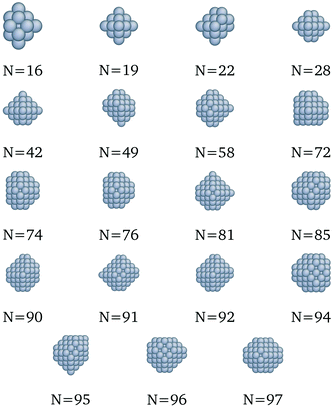 |
| | Fig. 10 New optima at various N, as determined by the Pd-corrected function for cohesive energy. | |
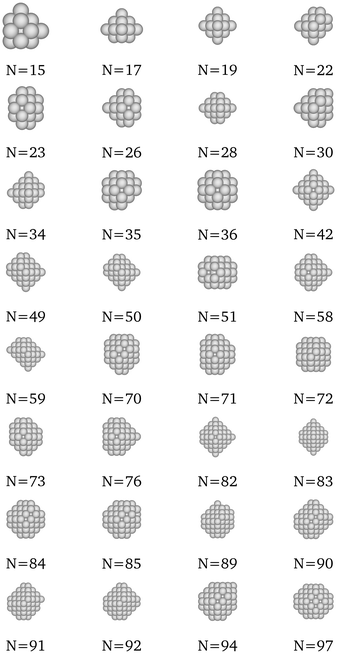 |
| | Fig. 11 New optima at various N, as determined by the Pt-corrected function for cohesive energy. | |
Conflicts of interest
There are no conflicts to declare.
Acknowledgements
This material is based upon work supported by the National Science Foundation (NSF) under grants CMMI 1634594 and 1634880. The authors acknowledge support from the Center for Advanced Process Decision-making at Carnegie Mellon University, and computational support from the Center for Research Computing at the University of Pittsburgh, as well as the Extreme Science and Engineering Discovery Environment, which is supported by the NSF (ACI-1548562).
Notes and references
- J. D. Aiken III and R. G. Finke, J. Mol. Catal. A: Chem., 1999, 145, 1–44 CrossRef.
- A. M. Karim, V. Prasad, G. Mpourmpakis, W. W. Lonergan, A. I. Frenkel, J. G. Chen and D. G. Vlachos, J. Am. Chem. Soc., 2009, 131, 12230–12239 CrossRef CAS PubMed.
- A. T. Bell, Science, 2003, 299, 1688–1691 CrossRef CAS PubMed.
- M. G. Taylor, N. Austin, C. E. Gounaris and G. Mpourmpakis, ACS Catal., 2015, 5, 6296–6301 CrossRef CAS.
- D. Huang, F. Liao, S. Molesa, D. Redinger and V. Subramanian, J. Electrochem. Soc., 2003, 150, G412–G417 CrossRef CAS.
- M. De, P. S. Ghosh and V. M. Rotello, Adv. Mater., 2008, 20, 4225–4241 CrossRef CAS.
- F. Baletto, J. Phys.: Condens. Matter, 2019, 31, 113001 CrossRef PubMed.
- Y. Lu and W. Chen, Anal. Chem., 2015, 87, 10659–10667 CrossRef CAS PubMed.
- F. Baletto and R. Ferrando, Rev. Mod. Phys., 2005, 77, 371 CrossRef CAS.
- L. T. Wille and J. Vennik, J. Phys. A: Math. Gen., 1985, 18, L419 CrossRef CAS.
- B. Hartke, J. Phys. Chem., 1993, 97, 9973–9976 CrossRef CAS.
- J. P. K. Doye and D. J. Wales, Phys. Rev. Lett., 1998, 80, 1357–1360 CrossRef CAS.
- S. Darby, T. V. Mortimer-Jones, R. L. Johnston and C. Roberts, J. Chem. Phys., 2002, 116, 1536–1550 CrossRef CAS.
- G. Barcaro, L. Sementa and A. Fortunelli, Phys. Chem. Chem. Phys., 2014, 16, 24256–24265 RSC.
- I. L. Garzón, K. Michaelian, M. R. Beltrán, A. Posada-Amarillas, P. Ordejón, E. Artacho, D. Sánchez-Portal and J. M. Soler, Phys. Rev. Lett., 1998, 81, 1600–1603 CrossRef.
- D. Tománek, S. Mukherjee and K. H. Bennemann, Phys. Rev. B: Condens. Matter Mater. Phys., 1983, 28, 665–673 CrossRef.
- C. L. Hanselman and C. E. Gounaris, AIChE J., 2016, 62, 3250–3263 CrossRef CAS.
-
A. P. Sutton, Electronic structure of materials, Clarendon Press, 1993 Search PubMed.
- F. Cleri and V. Rosato, Phys. Rev. B: Condens. Matter Mater. Phys., 1993, 48, 22 CrossRef CAS.
- R. Ferrando, A. Fortunelli and G. Rossi, Phys. Rev. B: Condens. Matter Mater. Phys., 2005, 72, 085449 CrossRef.
- Z. Yan, M. G. Taylor, A. Mascareno and G. Mpourmpakis, Nano Lett., 2018, 18, 2696–2704 CrossRef CAS.
-
I. Corp., IBM ILOG CPLEX Optimizer 12.8.0, 2017 Search PubMed.
-
R. Fournier and S. Bulusu, in Metal Clusters and Nanoalloys, Springer, 2013, pp. 81–103 Search PubMed.
- D. Kim, J. Resasco, Y. Yu, A. M. Asiri and P. Yang, Nat. Commun., 2014, 5, 4948 CrossRef CAS.
- G. Che, B. B. Lakshmi, C. R. Martin and E. R. Fisher, Langmuir, 1999, 15, 750–758 CrossRef CAS.
- E. Yoo, T. Okata, T. Akita, M. Kohyama, J. Nakamura and I. Honma, Nano Lett., 2009, 9, 2255–2259 CrossRef CAS PubMed.
- J. Hutter, M. Iannuzzi, F. Schiffmann and J. VandeVondele, Wiley Interdisciplinary
Reviews: Computational Molecular, Science, 2014, 4, 15–25 CAS.
- J. P. Perdew, K. Burke and M. Ernzerhof, Phys. Rev. Lett., 1996, 77, 3865–3868 CrossRef CAS PubMed.
- J. VandeVondele and J. Hutter, J. Chem. Phys., 2007, 127, 114105 CrossRef PubMed.
- S. Goedecker, M. Teter and J. Hutter, Phys. Rev. B: Condens. Matter Mater. Phys., 1996, 54, 1703–1710 CrossRef CAS PubMed.
- P. Janthon, S. A. Luo, S. M. Kozlov, F. Viñes, J. Limtrakul, D. G. Truhlar and F. Illas, J. Chem. Theory Comput., 2014, 10, 3832–3839 CrossRef CAS.
- M. Methfessel, D. Hennig and M. Scheffler, Phys. Rev. B: Condens. Matter Mater. Phys., 1992, 46, 4816–4829 CrossRef CAS.
- S. K. Kwon, Z. Nabi, K. Kádas, L. Vitos, J. Kollár, B. Johansson and R. Ahuja, Phys. Rev. B: Condens. Matter Mater. Phys., 2005, 72, 235423 CrossRef.
- J. Li, X. Li, H.-J. Zhai and L.-S. Wang, Science, 2003, 299, 864–867 CrossRef CAS PubMed.
- P. Pyykkö, Nat. Nanotechnol., 2007, 2, 273 CrossRef PubMed.
- T. Futschek, M. Marsman and J. Hafner, J. Phys.: Condens. Matter, 2005, 17, 5927 CrossRef CAS.
- H. Zhang, D. Tian and J. Zhao, J. Chem. Phys., 2008, 129, 114302 CrossRef PubMed.
- X. Xing, A. Hermann, X. Kuang, M. Ju, C. Lu, Y. Jin, X. Xia and G. Maroulis, Sci. Rep., 2016, 6, 19656 CrossRef CAS.
- O. D. Häberlen, S.-C. Chung, M. Stener and N. Rösch, J. Chem. Phys., 1997, 106, 5189–5201 CrossRef.
- A. Sebetci and Z. B. Güvenç, Modell. Simul. Mater. Sci. Eng., 2005, 13, 683 CrossRef CAS.
- I. A. Hijazi and Y. H. Park, Eur. Phys. J. D, 2010, 59, 215–221 CrossRef CAS.
- P. Pyykkö, Angew. Chem., Int. Ed., 2004, 43, 4412–4456 CrossRef PubMed.
- X. Xing, B. Yoon, U. Landman and J. H. Parks, Phys. Rev. B: Condens. Matter Mater. Phys., 2006, 74, 165423 CrossRef.
- L. Xiao and L. Wang, Chem. Phys. Lett., 2004, 392, 452–455 CrossRef CAS.
- N. Austin, J. Johnson and G. Mpourmpakis, J. Phys. Chem. C, 2015, 119, 18196–18202 CrossRef CAS.
Footnotes |
| † Electronic supplementary information (ESI) available: Atomic coordinates for all optimal nanocluster structures. See DOI: 10.1039/c9me00108e |
| ‡ In this context, the “coordination number of an unoccupied location is regarded to be equal to 0. |
| § We remark that coordination numbers are defined here via ≤ inequality constraints (as opposed to strict equalities) at the interest of yielding an MILP model with tighter LP relaxations. Due to the direct maximization of variables CNi in the objective function, the coordination number evaluations will be exact at any optimal solution. |
| ¶ Note how the integrality of variables CNi need not be explicitly declared, as it is implied by the integrality of variables Yi. |
| || The design problem is technically infeasible for values of N ≤ 3, due to the requirement for minimum coordination equal to 3 for all atoms. |
| ** In practice, canvases designed this way will not be regular cuboctahedra, though this poses no concern in terms of defining the optimization model, which can be cast for any irregularly shaped canvas I. |
|
| This journal is © The Royal Society of Chemistry 2020 |
 b and
Chrysanthos E.
Gounaris
 *a
*a


 at integer values of CNi, as shown in Fig. 1 for the case of an FCC lattice. Note how this approximation of the square root function is exact at all locations of interest, namely the integer values of CN. The secant-line definition of CNRi is then imposed in the model viaeqn (12), where α
![[small script l]](https://www.rsc.org/images/entities/char_e146.gif) and β
and β![[small script l]](https://www.rsc.org/images/entities/char_e146.gif) are appropriate constants to represent the slope and intercept, respectively, of each consecutive secant line
are appropriate constants to represent the slope and intercept, respectively, of each consecutive secant line ![[small script l]](https://www.rsc.org/images/entities/char_e146.gif) .
.![[small script l]](https://www.rsc.org/images/entities/char_e146.gif) CNi + β
CNi + β![[small script l]](https://www.rsc.org/images/entities/char_e146.gif) ∀i ∈ I, ∀
∀i ∈ I, ∀![[small script l]](https://www.rsc.org/images/entities/char_e146.gif) ∈ {1,2,…,CNmax}
∈ {1,2,…,CNmax}


