 Open Access Article
Creative Commons Attribution 3.0 Unported Licence
Fabrication and characterization of multi-biomarker optimized tissue-mimicking phantoms for multi-modal optical spectroscopy
Rekha
Gautam
 *a,
Danielle
Mac Mahon
b,
Gráinne
Eager
c,
Hui
Ma
a,
Claudia Nunzia
Guadagno
d,
Stefan
Andersson-Engels
 ab and
Sanathana
Konugolu Venkata Sekar
a
aBiophotonics@Tyndall, IPIC, Tyndall National Institute, T12 R5CP Cork, Ireland. E-mail: rekha.gautam@tyndall.ie
bDepartment of Physics, University College Cork, T12 K8AF Cork, Ireland
cSchool of Physics, Trinity College Dublin, Dublin 2, Ireland
dBioPixS Ltd, Tyndall National Institute, T12 R5CP Cork, Ireland
First published on 23rd August 2023
Abstract
Rapid advancement of novel optical spectroscopy and imaging systems relies on the availability of well-characterised and reproducible protocols for phantoms as a standard for the validation of the technique. The tissue-mimicking phantoms are also used to investigate photon transport in biological samples before clinical trials that require well-characterized phantoms with known optical properties (reduced scattering (μ′s) and absorption (μa) coefficients). However, at present, there is limited literature available providing well-characterized phantom recipes considering various biomarkers and tested over a wide range of optical properties covering most of the human organs and applicable to multimodal optical spectroscopy. In this study, gelatin-based phantoms were designed to simulate tissue optical properties where India ink and Intralipid were used as absorbing and scattering agents, respectively. Multiple biomarkers were simulated by varying the gelatin concentration to mimic the change in tissue hydration and hydroxyapatite concentration to mimic bone signature. The recipe along with biomarkers were optimized and characterised over a wide range of optical properties (μa from 0.1 to 0.5 cm−1; μ′s from 5 to 15 cm−1) relevant to human tissue using a broadband time-domain diffuse optical spectrometer. The data collected showed a linear relationship between the concentration of ink/lipids and μa/μ′s values with negligible coupling between μa and μ′s values. While being stored in a refrigerator post-fabrication, the μa and μ′s did not change significantly (<4% coefficient of variation, ‘CV’) over three weeks. The reproducibility in three different sets was validated experimentally and found to be strong with a variation of ≤6% CV in μa and ≤9% CV in μ′s. From the 3 × 3 data of μa and μ′s matrices, one can deduce the recipe for any target absorption or reduced scattering coefficient. The applicability of the phantoms was tested using diffuse reflectance and Raman spectrometers. A use case application was demonstrated for Raman spectroscopy where hydration and hydroxyapatite phantoms were designed to characterize the Raman instrument. The Raman instrument could detect the change in 1% of HA and 5% of hydration. This study presents a first-of-its-kind robust, well-characterized, multi-biomarker phantom recipe for calibration and benchmarking of multimodal spectroscopy devices assisting in their clinical translation.
Introduction
The advances in optical devices and sensors, and spectroscopic techniques have brought tremendous growth in biomedical applications.1,2 However, very limited optical spectroscopy devices have reached bedside. One of the key issues stems from the demonstration of the efficacy, accuracy, and utility of these techniques. In this context, the method for standardizing optical spectroscopy and imaging systems is an unmet need for comparing the performances of various optical systems.3,4 Many different phantom systems have been used for the development of such instruments, especially for instrument characterisation, calibration, optimisation, and quality control.5–9 These studies rely heavily on tissue-mimicking phantoms to speed up the process and reduce the cost by testing optical techniques on phantoms. Importantly, it is crucial to have the same referencing and characterization standard for multi-centre clinical trials to enable cross-comparison and validation. This will help in understanding and effectively reducing the variability caused by instruments. Additionally, the phantoms play a critical role in understanding light propagation through biological tissues. In general, tissue-mimicking phantoms are composed of the host matrix and scattering and absorption agents to mimic the optical properties of the target tissue. To date, several efforts have been made to describe the synthesis of such phantoms using polymer, agar, or other base matrices.5,8,10 In particular, polymer-based phantoms are beneficial due to their longer shelf-life and stability.6,7 However, the hydrophobic base material restricts the incorporation of water-soluble biochemicals into them. Some specific health conditions, such as inflammation and edema, involve the evaluation of the water fraction and are likely to benefit from the emerging optical techniques standardized against water-based reference phantoms.11 Liquid phantoms are hydrophilic and allow the investigation of dynamic changes such as tissue oxygenation although they can mimic only homogeneous structures and their stability is limited to several hours.5Water soluble base materials like agar and gelatin are widely used with different types of scatterers (TiO2/Al2O3, Intralipid) and absorbers (India ink, molecular dyes, and hemoglobin) to build solid tissue-mimicking phantoms.3,5,8 Such base materials also allow the control of the water fraction and can be cast in different shapes including thin sheets to mimic skin tissue.12,13 These phantoms can be refrigerated to maintain their optical properties and minimize the evaporation of water, increasing their shelf-life. The mechanical properties of these phantoms can also be tuned as desired for some specific applications.14 Most of these phantoms in the literature, however, provide a limited characterization of the optical properties in the presence of additional biomarkers and apply to a specific optical technique.3,5 In addition, there is a lack of recipe that is well tested and characterized over a wide range of optical properties with the host material supporting multiple biomarkers like hydration of tissue and hydroxyapatite (HA) to simulate bone signature. The availability of such a phantom recipe can enable the development of standardized and reproducible protocols for multimodal spectroscopic applications.
The current work provides a first-of-its-kind well characterized low-cost gelatin-based multi-biomarker phantom recipe and fabrication process for use in multimodal applications like Raman and diffuse reflectance spectroscopy. The phantom recipe is broadband characterized over a wide range of optical properties relevant to human tissue. To the best of our knowledge, this is the first report providing a method for the fabrication of a tissue phantom that mimics the spectral characteristics of Raman biomarkers like tissue hydration (water), hydrolyzed collagen (gelatin), and mineral density (HA) with pre-calibrated optical (reduced scattering μ′s and absorption μa coefficients) properties. The optical properties of the phantoms were characterised using a broadband time-resolved diffuse reflectance spectrometer. The phantom recipe was tested for linearity over a wide range of optical properties. In addition, the long-term stability and reproducibility of the phantom recipe were monitored and reported. Furthermore, the use of phantoms was demonstrated for hydration and bone mineral sensing applications.
Materials and methods
Chemicals
Gelatin (G2500, Sigma-Aldrich USA), Intralipid 20% w/v (Fresenius Kabi, Ltd), India ink (Higgins, 44201 Chartpak Inc., USA), and hydroxyapatite (677418, Sigma-Aldrich, USA) were used. All solutions were prepared using deionised water.Fabrication
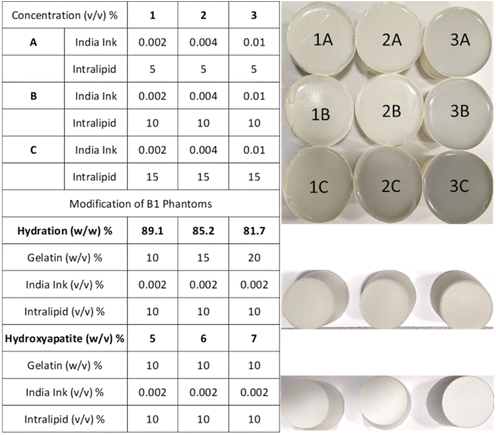
The tissue-mimicking phantoms were prepared by dissolving 10% (w/v) 300A powder gelatin (i.e. 20 g from the original pack) in a total volume of 200 ml water and adding varying concentrations of India ink and Intralipid (Fig. 1). Initially, a 5% India ink stock solution was prepared which was diluted to obtain 0.002%, 0.004%, and 0.01% (v/v) solutions in 200 ml by dissolving the desired volume in 2 ml of water for series 1, 2, and 3, respectively. The required amount of water (200 ml – diluted ink and Intralipid) for a phantom was measured and transferred into a 500 ml glass beaker. The beaker was placed on a hot plate with a magnetic stirrer (5 cm). Once the water temperature raised to 35 °C, 20 g of gelatin was added (all at once) to the beaker under constant stirring (600 rotations per minute ‘rpm’) for 10 s. The mixture was left on the hotplate until the gelatin powder was dissolved (∼3 minutes) under a reduced stirring speed of 300 rpm. The temperature was monitored using a digital thermometer and maintained below 37 °C all the time. Intralipid with required amounts of 10 ml, 20 ml, and 30 ml was added as a scatterer for series A, B, and C to obtain 5%, 10%, and 15% solutions in 200 ml, respectively. The blend was allowed to mix for 30 seconds at 300 rpm. Subsequently, 2 ml diluted India ink solution was vortexed for 30 seconds to ensure adequate mixing and added to the gelatin mixture as an absorber. The phantom mixture was left on the hot plate for 5 minutes under continuous stirring at 300 rpm. The beaker was removed from the hot plate and sonicated for 1 min to remove the bubbles. Then the mixture was transferred from the beaker to a paper cup, labelled, covered with a Parafilm, and placed in the freezer (at −20 °C) for 1 h to solidify. The phantoms were sealed with the Parafilm and stored in the refrigerator (at 4 °C) until further analysis. The phantoms were removed from the refrigerator and measured immediately at five day intervals for three weeks and transferred back to the refrigerator with a Parafilm seal after data acquisition.Hydration phantoms
The water concentration (hydration) of the phantoms was varied using different fractions of gelatin (w/v: 10, 15, and 20%) keeping the absorber and scatter content constant as used for the B1 phantom.Hydroxyapatite blends
HA (w/v) was added to the gelatin phantoms keeping the absorber and scatter content the same as those used for the B1 phantom. The HA was first dispersed in 5 ml of 0.1 M HCl using an ultrasonic bath (for 5 min) and vortexed for 30 seconds before adding it to the bulk gelatin matrix. The volume of HCl used to dissolve HA was corrected to keep the total volume of phantoms as 200 ml. The HA/HCl is added after the Intralipid and before the India ink and was allowed to mix in the gelatin solution for ∼30 seconds at 300 rpm.Time-domain diffuse optical spectrometer (TDDOS) for absorption and reduced scattering characterization
The system contains a broadband (450 to 2400 nm, 20 MHz repetition rate) pulsed supercontinuum fiber laser as the source. The wavelength tuning is achieved by using a Pellin Broca prism which couples the desired wavelength into a 50 μm core source fiber. The light reemitted from the phantom is collected in reflectance geometry at a 2 cm source–detector distance using a 200 μm core detection fiber. The signal from the detection fiber is coupled to a single photon avalanche photodiode (SPAD) detector which is connected to a time-to-digital converter (TDC) to obtain histogram temporal signals and create photon time of flight curves (pTOF). The instrument response function (IRF) of the system is around 100 ps. A detailed description of the system can be found in ref. 15 and 16.Dual wavelength Raman spectroscopy
Raman spectra were recorded using a dual-wavelength system equipped with a 830 nm and 730 nm dual excitation laser unit. The dual-wavelength allowed us to measure both the fingerprint and high wavenumber Raman spectra to characterize hydroxyapatite and water-based phantoms simultaneously. The system consisted of an imaging spectrograph (Acton LS785 f/2) coupled to a thermoelectrically cooled CCD camera (PIXIS: 400BR, Princeton Instruments, Princeton, NJ), the source is a dual wavelength diode laser (Innovative Photonic Solutions, Monmouth Junction, NJ) and a fiber optic probe was used for the collection of Raman signals. The laser power at the sample was set to 100 mW for an integration time of 15 s (5 s exposure × 3 accumulations) for HA phantoms using 830 nm excitation and 30 s (10 s exposure × 3 accumulations) for hydration phantoms using 730 nm excitation. During measurements, all room lights were turned off. The spectral axis of the system was calibrated using a NeAr lamp (IntelliCal, Teledyne Princeton Instruments) and then verified using a silicon reference with a 520.5 cm−1 (corresponding to 867.5 nm relative to 830 nm excitation) line before acquiring the sample spectra. The NeAr lamp and the sample data were recorded using the probe that included the lens assembly and the filter.Data analysis
The μa and μ′s of the phantoms at each wavelength were extracted by fitting the measured pTOF curves to a semi-infinite slab model of the diffusion equation with extrapolated boundary conditions as described by Konugolu Venkata Sekar et al.15,16 The fitting range for residual minimization between theoretical and measured curves extended from 80% of the rising edge to 1% of the falling edge of the temporal curves, effectively using the entire time window.Raman spectra were smoothed using a Savitzky–Golay filter with polynomial order = 2 and window = 5, and background baseline corrected using the asymmetric least squares method with lambda = 8 × 10⁴ and p = 5 × 10⁻³ for HA phantoms and lambda = 8 × 10⁵ and p = 8 × 10⁻⁵ for hydration phantoms, where lambda defines how closely the baseline fits to the data and p defines the asymmetry of positive versus negative residuals.17
Results and discussion
Broadband characterisation of phantoms
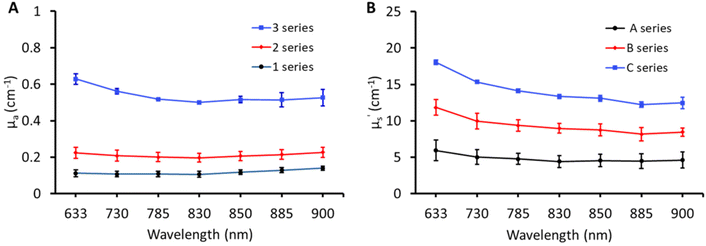
The broadband optical property (μa and μ′s) characterisation of the matrix containing three absorptions (1, 2, and 3) and three scatterings (A, B, and C) is shown in Fig. 2. The optical properties of matrix phantoms were chosen to test the recipe over wide variations seen in different types of human tissue.16 In total, 7 wavelengths were chosen in the range of 630–900 nm for TDDOS measurements. Specifically, the commonly used Raman excitation wavelengths (633, 785, and 830 nm) were used for characterization. The rest of the wavelengths (850, 885, and 900 nm) correspond to specific spectral signatures (proteins, hydroxyapatite, lipids, and hydration) when excited at 785 nm. From Fig. 2, the optical property scale with increasing ink and Intralipid concentration is evident. The phantoms exhibit a flat absorption in the characterized range. The rising absorption at 633 nm can be related to increasing gelatin and India ink absorption as seen in the literature.7,15 As expected, the reduced scattering of phantoms decreases with increasing wavelength.18Impact of lipid and India ink concentration on the optical properties of phantoms
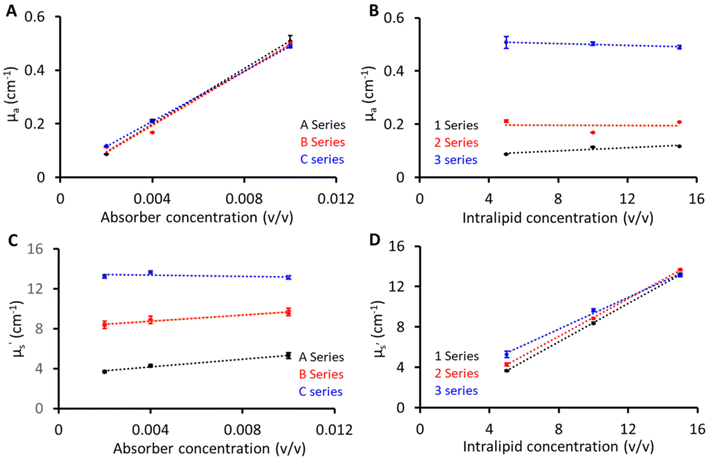
Fig. 3 shows the linearity plots of the phantom matrix. The absorption values were found to be linear over the explored concentration (Fig. 3A and B). The residual intercept in Fig. 3A could be attributed to background absorption from the gelatin base material.19 Similarly, the scattering values exhibit a linear relationship across the three absorption (1, 2, and 3) series. From Fig. 3D, a small deviation is seen for the absorption series at low scattering values, and this can be related to the limitation of the diffusion equation used for fitting pTOF curves where a slight overestimation is expected with increasing absorption values (series 3) at low reduced scattering. Overall, from Fig. 3, the proposed recipe was found to have good linearity over the wide range of absorber and scatterer concentrations. In addition, two phantoms were created for the purpose of investigating the interaction between the absorber and scatterer. Phantom 1 was composed of 10 (v/v)% Intralipid and 0 (v/v)% India ink, while Phantom 2 consisted of 0 (v/v)% Intralipid and 0.04 (v/v)% India ink. As anticipated, Phantom 1 demonstrated a reduced scattering of 8 cm−1 at 830 nm, similar to the B series phantoms and the absorption value at 830 nm was approximately 0.02 cm−1, indicating a negligible contribution to absorption from the base material and scatterer. In contrast, Phantom 2, which lacked Intralipid, exhibited transparency, suggesting a minimal scattering contribution from India ink and the base material.Reproducibility and stability of phantoms
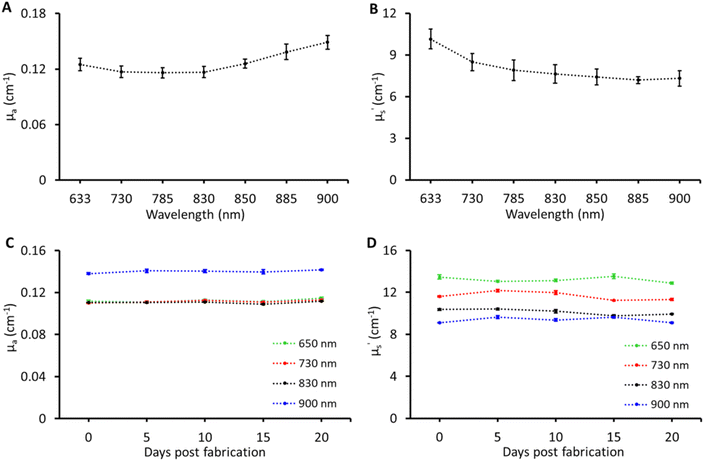
Tissue-mimicking phantoms are widely used in the development of optical equipment, novel techniques, and multi-laboratory validation, thus accelerating development and pushing the boundaries of biophotonic applications. To enable such applications the recipe was tested for reproducibility and stability. These tests were carried out on the B1 phantom. For reproducibility, the B1 phantom was fabricated three times. The results of optical property reproducibility are shown in Fig. 4A and B; the error bars represent the standard deviation for measurements on B1 phantoms fabricated on three different days by different individuals. The reproducibility was found to be within a CV of ≤6% in μa and ≤9% CV in μ′s over the entire band range of characterisation. For stability, the B1 phantom was measured over a period of three weeks and the changes in the optical properties of the B1 phantom over three weeks at four different wavelengths are shown in Fig. 4C and D. No significant changes were observed in μa and μ′s over a period of three weeks and the CV was under 4% which is the expected performance limit of the time domain instrument used in this study. Two main factors limiting the lifetime of these phantoms were loss of water and microbial growth. The Parafilm seal was quite effective in preserving the water content while being stored in the refrigerator at 4–6 °C. However, microbial growth was observed after three weeks. The addition of anti-microbial agents such as sodium azide, ethylenediaminetetraacetic acid, fluconazole, and penicillin along with the Parafilm seal can potentially extend the longevity of the phantom.3,20 To achieve this, the antimicrobial agents can be added directly to the water used for dissolving gelatin, with concentrations ranging from 1 to 3 mM.8,21,22 Although the required concentration is relatively low (in millimoles), it is advisable to utilize agents such as sodium azide in phantoms intended for Raman spectroscopy in order to minimize any interfering signals and alterations of optical properties.Following the rigorous characterisation, two use case applications were chosen to demonstrate the effectiveness of the multi-biomarker phantoms for multi-modal biophotonic applications.
Diffuse reflectance and Raman spectroscopic sensing of hydration
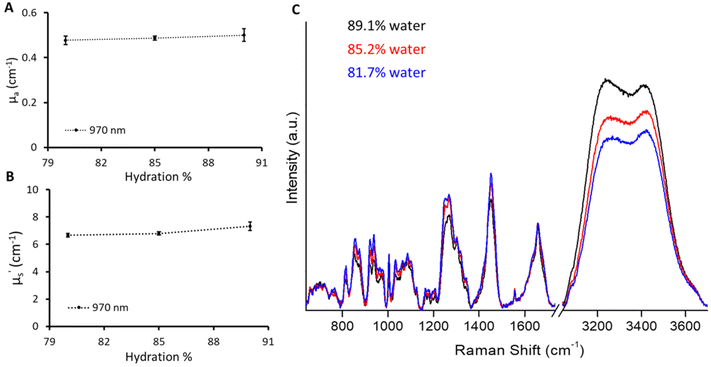
Raman spectroscopy analyses the inelastic scattering of light by the molecule and in turn provides the molecular fingerprint.23,24 Raman spectroscopy is specifically renowned for in vivo biomedical applications, as it can be easily coupled with fiber-optic probes, leading to an easy-to-use portable device.25,26 However, the development of in vivo Raman probes requires analytical standards to characterize the various parameters of different probe designs to improve sensitivity and depth of penetration. We employed the current phantom recipe to provide standard phantoms with different biomarkers for the Raman application. The fabrication of gelatin-based phantoms was done below the physiological temperature (37 °C) preventing any temperature-based changes in the biomolecules incorporated into the phantoms to mimic tissue. We fabricated phantoms with varying amounts of water in a given volume keeping the μa and μ′s values the same as for the B1 phantom. A slight influence of the amount of water on the phantom can be seen from the change in absorption at 970 nm (Fig. 5A). Phantoms with different absorption levels in the broad spectral range including 970 nm can indeed be created by adjusting the concentration of India ink. However, it should be noted that such phantoms will not show changes in the Raman scattering region that is specific to O–H vibrations and may not be adequate for Raman system calibration. There was a slight increase in μ′s with the increase in water content. This could be attributed to a decrease in gelatin content (refractive index close to that of Intralipid) in a given probed volume which enhances the refractive index mismatch with respect to Intralipid.19,27 However, it is hard to distinguish as the inherent CV of the time domain instrument used in this is around 4%. These phantoms were measured using the Raman instrument with 730 excitation to probe the O–H stretch vibrations in water molecules spanning from 3100 to 3700 cm−1.28,29 The percentage change in hydration can be visualized in Fig. 5C depicting the sensitivity of the Raman instrument towards a 5% change in water content. However, the increase in the Raman water signal was not scaled to increase in hydration linearly. The increase in Raman signals with a change in hydration from 85.2% to 89.1% was approximately double compared to the increase in signals from 81.7% to 85.2%. This could be attributed to the fact that the sampling volume changes across three phantoms due to varying optical properties (μa and μ′s) affecting the propagation of both excitation (730 nm) and Raman signals.30,31 This can be corrected using optical attenuation parameters (μa, μ′s) specified by diffuse reflectance providing quantitative Raman signals.30,31 We plan to implement optical attenuation correction in future studies to obtain quantitative Raman information; however, this is out of scope here.Diffuse reflectance and Raman spectroscopic sensing of bone minerals
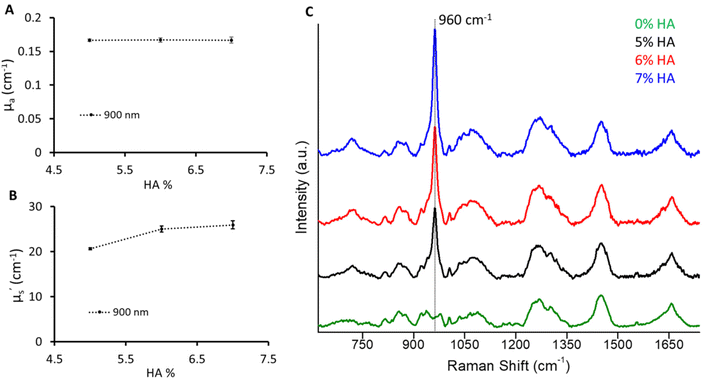
In this use case to mimic the bone, a varying amount of hydroxyapatite (5%, 6%, 7%) was dispersed keeping the absorber and scatterer content the same as for the B1 phantom. However, an increase in scattering values with an increase in HA was observed (Fig. 6). A significant increase in μ′s (>100%) was observed with the addition of 5% HA to the B1 phantom at 900 nm which corresponds to the 960 cm−1 Raman signature of HA relative to 830 nm excitation. This can be related to the highly scattering nature of HA. Furthermore, the μ′s values were found to increase with a 1% change in HA from 5% to 6%. However, the increase in μ′s from 6% to 7% HA phantom was subtle. This could be due to the reduced dispersion of HA particles at higher concentrations. The change in the mineral peak at 960 cm−1 illustrates a 1% change in HA.32 This recipe would provide a guiding approach to expand the recipe to other biomarkers based on the optical properties of the main matrix, hydration, and hydroxyapatite phantoms. It is relatively straightforward to add other chromophores such as melanin and haemoglobin to mimic other tissue types. Additionally, multilayer phantoms with layers of different optical properties are possible by stacking the slices of prepared phantoms.Conclusion
The study presented herein describes a recipe to fabricate low-cost, multi-biomarker gelatin-based solid tissue-mimicking phantoms with desired well-controlled optical properties. The recipe was found to be linear and covers the optical properties in the wavelength range (650–900 nm) relevant to in vivo human studies and provides a shelf-life of 1 month under ideal storage conditions. Notably, the optical parameters were found to be reproducible (CV of ≤6% in μa and ≤9% in μ′s) when the fabrication procedure was repeated on different days by different individuals. Based on the current findings, these phantoms are considered valuable tools for evaluating the sensitivity of the Raman system to different biomarkers and assessing the system's reproducibility in measuring them. To effectively carry out these evaluations, it is recommended to periodically fabricate these phantoms during the instrument's development or deployment phase. Such a phantom has the potential to be employed for multi-laboratory system validation and benchmarking to combat the challenge of successful clinical translation and used for referencing existing systems.Author contributions
RG: fabrication of phantoms, conceptualization, supervision, data acquisition, data analysis, writing, review, and editing; DMM: fabrication of phantoms, data acquisition, review, and editing; GE: fabrication of phantoms and data analysis; HM: data recording; CNG: data analysis; SAE: funding, conceptualization, supervision, review, and editing. SKVS: funding, conceptualization, supervision, data acquisition, data analysis, writing, and editing.Conflicts of interest
SKVS and SAE are shareholders of BioPixS Ltd with an interest in tissue optical phantoms.Acknowledgements
This study is funded by IPIC Emerge Starting Grant (Grant No. SFI-12/RC/2276_P2_IPIC). The research work was also supported by Science Foundation Ireland (SFI/15/RP/2828), IPIC Biomedical theme (Grant No. SFI-12/RC/2276_P2), European projects VASCOVID (Grant No. 101016087), and TinyBrains (Grant No. 101017113).References
- H. Ahn, H. Song, D.-M. Shin, K. Kim and J.-r. Choi, Appl. Spectrosc. Rev., 2018, 53, 264–278 CrossRef.
- M. Ochoa, J. F. Algorri, P. Roldán-Varona, L. Rodríguez-Cobo and J. M. López-Higuera, Sensors, 2021, 21, 6469 CrossRef CAS PubMed.
- J. Dinh, A. Yamashita, H. Kang, S. Gioux and H. S. Choi, Adv. Photonics Res., 2023, 4, 2200194 CrossRef CAS PubMed.
- L. Hacker, H. Wabnitz, A. Pifferi, T. J. Pfefer, B. W. Pogue and S. E. Bohndiek, Nat. Biomed. Eng., 2022, 6, 541–558 CrossRef PubMed.
- M. Z. Vardaki and N. Kourkoumelis, Biomed. Eng. Comput. Biol., 2020, 11, 1179597220948100 CrossRef PubMed.
- S. K. V. Sekar, A. Pacheco, P. Martella, H. Li, P. Lanka, A. Pifferi and S. Andersson-Engels, Biomed. Opt. Express, 2019, 10, 2090–2100 CrossRef CAS PubMed.
- A. B. Walter and E. D. Jansen, J. Biomed. Opt., 2023, 28, 025001 CAS.
- W. P. Brian and S. P. Michael, J. Biomed. Opt., 2006, 11, 041102 CrossRef PubMed.
- L. Ntombela, B. Adeleye and N. Chetty, Heliyon, 2020, 6, e03602 CrossRef CAS PubMed.
- P. Lai, X. Xu and L. V. Wang, J. Biomed. Opt., 2014, 19, 35002 CrossRef PubMed.
- G. S. Budylin, D. A. Davydov, N. V. Zlobina, A. V. Baev, V. G. Artyushenko, B. P. Yakimov and E. A. Shirshin, J. Biophotonics, 2022, 15, e202100268 CrossRef PubMed.
- G. T. Kennedy, G. R. Lentsch, B. Trieu, A. Ponticorvo, R. B. Saager and A. J. Durkin, J. Biomed. Opt., 2017, 22, 76013 CrossRef PubMed.
- V. N. D. Le, M. Manser, S. Gurm, B. Wagner, J. E. Hayward and Q. Fang, Front. Phys., 2019, 7, 192 CrossRef.
- A. I. Chen, M. L. Balter, M. I. Chen, D. Gross, S. K. Alam, T. J. Maguire and M. L. Yarmush, Med. Phys., 2016, 43, 3117–3131 CrossRef PubMed.
- S. Konugolu Venkata Sekar, I. Bargigia, A. Dalla Mora, P. Taroni, A. Ruggeri, A. Tosi, A. Pifferi and A. Farina, J. Biomed. Opt., 2017, 22, 015006 CrossRef PubMed.
- S. Konugolu Venkata Sekar, P. Lanka, A. Farina, A. Dalla Mora, S. Andersson-Engels, P. Taroni and A. Pifferi, Appl. Sci., 2019, 9, 5465 CrossRef.
- R. Gautam, D. Peoples, K. Jansen, M. O'Connor, G. Thomas, S. Vanga, I. J. Pence and A. Mahadevan-Jansen, Appl. Spectrosc., 2020, 74, 1238–1251 CrossRef CAS PubMed.
- S. Ali and B. Wesam, Polish J. Med. Phys. Eng., 2017, 23, 121–126 CrossRef.
- J. R. Cook, R. R. Bouchard and S. Y. Emelianov, Biomed. Opt. Express, 2011, 2, 3193–3206 CrossRef PubMed.
- F. W. L. Esmonde-White, K. A. Esmonde-White, M. R. Kole, S. A. Goldstein, B. J. Roessler and M. D. Morris, Analyst, 2011, 136, 4437–4446 RSC.
- G. Wagnières, S. Cheng, M. Zellweger, N. Utke, D. Braichotte, J. P. Ballini and H. van den Bergh, Phys. Med. Biol., 1997, 42, 1415–1426 CrossRef PubMed.
- E. L. Madsen, M. A. Hobson, H. Shi, T. Varghese and G. R. Frank, Phys. Med. Biol., 2005, 50, 5597–5618 CrossRef PubMed.
- S. Sil, R. Gautam and S. Umapathy, in Molecular and Laser Spectroscopy, Elsevier, 2018, pp. 117–146, DOI:10.1016/b978-0-12-849883-5.00006-1.
- S. Siddhanta, A. N. Kuzmin, A. Pliss, A. S. Baev, S. K. Khare, P. K. Chowdhury, A. K. Ganguli and P. N. Prasad, Adv. Opt. Photonics, 2023, 15, 318–384 CrossRef.
- I. P. Santos, E. M. Barroso, T. C. Bakker Schut, P. J. Caspers, C. G. F. van Lanschot, D.-H. Choi, M. F. van der Kamp, R. W. H. Smits, R. van Doorn, R. M. Verdijk, V. Noordhoek Hegt, J. H. von der Thusen, C. H. M. van Deurzen, L. B. Koppert, G. J. L. H. van Leenders, P. C. Ewing-Graham, H. C. van Doorn, C. M. F. Dirven, M. B. Busstra, J. Hardillo, A. Sewnaik, I. ten Hove, H. Mast, D. A. Monserez, C. Meeuwis, T. Nijsten, E. B. Wolvius, R. J. Baatenburg de Jong, G. J. Puppels and S. Koljenovic, Analyst, 2017, 142, 3025–3047 RSC.
- A. Pistiki, M. Salbreiter, S. Sultan, P. Rösch and J. Popp, Transl. Biophotonics, 2022, 4, e202200011 CrossRef CAS.
- S. Kim, K. M. Byun and S. Y. Lee, Biomed. Opt. Express, 2017, 8, 1130–1138 CrossRef PubMed.
- A. Ghita, T. Hubbard, P. Matousek and N. Stone, Anal. Chem., 2020, 92, 9449–9453 CrossRef CAS PubMed.
- R. Wolthuis, M. van Aken, K. Fountas, J. S. Robinson, H. A. Bruining and G. J. Puppels, Anal. Chem., 2001, 73, 3915–3920 CrossRef CAS PubMed.
- W.-C. Shih, K. L. Bechtel and M. S. Feld, Opt. Express, 2008, 16, 12726–12736 CrossRef CAS PubMed.
- R. Carina, H. G. Ingo, A. Stefan, E. Hans-Joachim and H. Jürgen, J. Biomed. Opt., 2010, 15, 037016 CrossRef PubMed.
- S. Maryam, S. Konugolu Venkata Sekar, M. D. Ghauri, E. Fahy, M. S. Nogueira, H. Lu, F. Beffara, G. Humbert, R. Ni Riordain, P. Sheahan, R. Burke, K. Wei Kho, R. Gautam and S. Andersson-Engels, Analyst, 2023, 148, 1514–1523 RSC.
| This journal is © The Royal Society of Chemistry 2023 |

