Bioresource-derived colloidal nitrogen-doped graphene quantum dots as ultrasensitive and stable nanosensors for detection of cancer and neurotransmitter biomarkers†
Yan-Yi
Chen
a,
Darwin
Kurniawan
 a,
Seyyed Mojtaba
Mousavi
 a,
Pavel V.
Fedotov
 bc,
Elena D.
Obraztsova
 bc and
Wei-Hung
Chiang
 *a
*a
aDepartment of Chemical Engineering, National Taiwan University of Science and Technology, Taipei, 10607, Taiwan. E-mail: whchiang@mail.ntust.edu.tw
bA.M. Prokhorov General Physics Institute, Russian Academy of Sciences, 38 Vavilov Str., Moscow, 119991, Russia
cMoscow Institute of Physics & Technology, 9 Institutskiy per., Dolgoprudny, Moscow Region 141701, Russia
First published on 1st November 2022
Abstract
Rapid and accurate detection of cancer and neurological diseases is a major issue that has received great attention recently to enable early therapy treatment. In this report, we utilize an atmospheric pressure microplasma system to convert a natural bioresource chitosan into nitrogen-doped graphene quantum dots (NGQDs) for photoluminescence (PL) based selective detection of cancer and neurotransmitter biomarkers. By adjusting the pH conditions during the detection, multiple biomolecules including uric acid (UA), folic acid (FA), epinephrine (EP), and dopamine (DA) can be simultaneously detected with high selectivity and sensitivity using a single material only. Linear relationships between the biomarker concentration and the PL intensity ratio are obtained starting from 0.8 to 100 μM with low limits of detection (LoDs) of 123.1, 157.9, 80.5, and 91.3 nM for UA, EP, FA, and DA, respectively. Our work provides an insight into the multiple biomarker detection using a single material only, which is beneficial for the early detection and diagnosis of cancer and neurological diseases, as well as the development of new drugs.
1. Introduction
Early detection and prevention of diseases are important to significantly improve the treatment effect and survival rate of patients. In recent years, the rapid screening of various indexes in the human body has become a necessary and urgent need. Tumors and multiple sclerosis have a slow onset during the initial stage, and the symptoms are not obvious and difficult to be detected.1 Fortunately, some biomolecules can serve as important biomarkers for the early diagnosis of cancer and neurological diseases. Cancer biomarkers (CBs) are biomolecules produced by tumor cells or other cells in the body in response to tumors; hence they can be used as early detection tools for cancer or even for predicting the overall outcomes. In terms of clinical efficacy, neurotransmitters (NTBs) can serve as biomarkers for treatment options and outcomes in psychiatric and inflammatory diseases and can regulate the functions of neuron systems.2Among these CBs and NTBs, continuous monitoring of uric acid (UA), folic acid (FA), epinephrine (EP), and dopamine (DA) are particularly important to avoid any physiological dysfunctions and central nervous system disorders. While UA is a very important antioxidant that helps maintaining the stability of blood pressure and antioxidant stress,3 its excess concentrations in the blood can lead to hyperuricemia,4 gout, cardiovascular disease, and even rectal, breast and prostate cancers.5–9 FA disorder may lead to cardiovascular disease, leukopenia, Alzheimer's disease, neural tube defects, and gastrointestinal diseases.10–13 On the other hand, EP and DA as NTBs play an important role in the nervous, cardiovascular, and renal systems by regulating various physiological activities of the human body.14–16 EP and DA disorders can cause pheochromocytoma, Parkinson's disease, and paragangliomas.16–18 Therefore, the detections of UA, FA, EP and DA are very important for neurological and clinical disease diagnoses, and they are also of great interests for the development of new drugs.
The current detection methods involve electrochemical analysis,19–21 high-performance liquid chromatography (HPLC),22–24 chemiluminescence,23,25 and enzyme-linked immunosorbent assay (ELISA).26,27 However, they suffer from cost and time inefficiencies, cumbersome procedures, low selectivity, and difficult to be applied for complex biological samples, hampering the practicality and analytical efficiency of these techniques in clinical applications. Recently, a fluorescence-based technique has attracted worldwide attention particularly for biosensing applications owing to its simplicity, high accuracy, and low limit of detection (LoD).28 Nonetheless, it is still a big challenge to simultaneously detect four distinct biomarkers with high selectivity and sensitivity using a single nanomaterial.
GQDs as 0-dimensional carbon nanomaterials offer unique tunable photoluminescence (PL) properties, high chemical and photostabilities, biocompatibility, and nontoxicity,29 rendering them useful for biosensing, bioimaging, drug delivery,29,30 energy storage and conversion, and catalysis.30–32 Moreover, the functionalization of GQDs via heteroatom doping, such as N, can induce new properties and enhance the PL quantum yield. As a result, compared with traditional toxic semiconductor QDs, organic fluorescent materials with short service life, and expensive precious metals, the nontoxicity and biocompatibility of nitrogen-doped GQDs (NGQDs), which also offer higher selectivity and sensitivity, are much more suitable for biosensing and other biomedical applications.33 However, the overall synthesis methods of NGQDs usually involve harsh reaction conditions, tedious preparation procedures, strong acids and reducing agents, and long reaction times. There is still a need for a rapid, simple, and environmentally friendly technique to synthesize NGQDs with a well-controlled structure usable not only for sensing, but also for other applications.
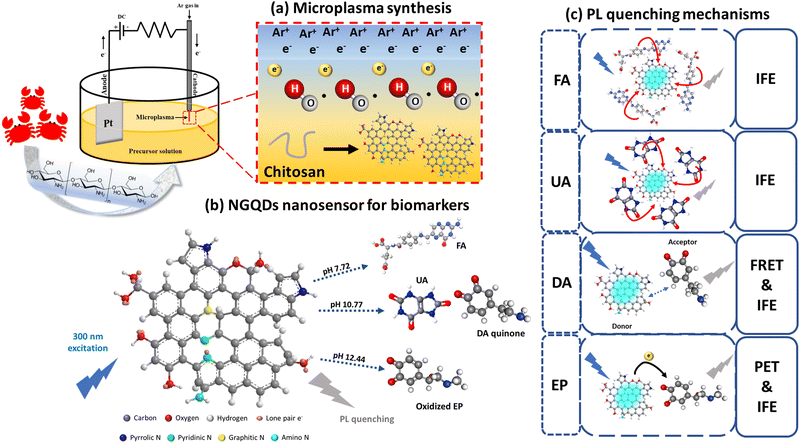
Here we use a convenient, fast, and environmentally friendly atmospheric pressure microplasma system to synthesize NGQDs in one-step from a bioresource chitosan under ambient conditions (Scheme 1a). Owing to the generated highly reactive species (e.g. electrons, ions, and radicals), microplasmas are very suitable for colloidal nanomaterial synthesis under ambient conditions.7,9 Moreover, it is also possible to scale up the process into an industrial scale by implementing a microplasma array complemented with microfluidic devices. The synthesized NGQDs show a narrow size distribution of 4.68 ± 0.83 nm with abundant N-dopants and oxygen-containing functional groups. These surface modifications lead to stable PL at 501 nm emission wavelength and at a 430 nm excitation wavelength. Most importantly, the synthesized NGQDs can be used for PL-based selective detection of UA, FA, EP, and DA by simply adjusting the pH value during the detection (Scheme 1b), yielding a linear detection range of 0.8–100 μM for UA, 0.6–100 μM for EP, as well as 0.8–100 μM for FA and DA with low LoDs of 123.1, 157.9, 80.5, and 91.3 nM, respectively. The selective detection of these biomarkers at different pH values is promoted by several unique PL quenching mechanisms (Scheme 1c). In addition, the produced NGQDs from a single microplasma process can be used for at least 100 PL detection. This work provides a rapid bioscreening system with high selectivity and sensitivity, making a major step toward the green and sustainable synthesis of NGQDs as effective and sensitive nanosensors for biomolecules.
2. Experimental
2.1. Materials and chemicals
Chitosan (low molecular weight, averaged 120![[thin space (1/6-em)]](https://www.rsc.org/images/entities/char_2009.gif) 000 Da, CAS: 9012-76-4) and sodium hydroxide (NaOH, ≥98%, CAS: 1310-73-2) were purchased from Sigma-Aldrich. DL-Lactic acid (90%, CAS: 50-21-5) was purchased from Acros Organics. Biomolecules such as FA (>98%, CAS: 59-30-3) and beta-nicotinamide mononucleotide (β-NMN, >98.0%, CAS: 1094-61-7) were received from Tokyo Chemical Industry. Glucose (99+%, CAS: 492-62-6), L-cysteine (98+%, CAS: 52-90-4), glycine (99+%, CAS: 56-40-6), and glutathione (GSH, 98%, CAS: 70-18-8) were purchased from ACROS Organics. L-tyrosine (99%, CAS: 60-18-4), L-phenylalanine (99%, CAS: 63-91-2), L-glutamic acid (99+%, CAS: 56-86-0), and beta-nicotinamide adenine dinucleotide reduced disodium salt (β-NADH, 97%, CAS: 606-68-8) were obtained from Alfa Aesar. DA (CAS: 62-31-7), ractopamine (Rac, CAS: 90274-24-1), fructose (≥99%, CAS: 57-48-7), DL-homocysteine (≥95%, CAS: 454-29-5), EP (CAS: 51-43-4), UA (≥99%, CAS: 69-93-2) and L-ascorbic acid (AsA, ≥98%, CAS: 50-81-7) were received from Sigma-Aldrich. Adenosine triphosphate (ATP, 98%, CAS: 56-65-5) was purchased from AK Scientific.
000 Da, CAS: 9012-76-4) and sodium hydroxide (NaOH, ≥98%, CAS: 1310-73-2) were purchased from Sigma-Aldrich. DL-Lactic acid (90%, CAS: 50-21-5) was purchased from Acros Organics. Biomolecules such as FA (>98%, CAS: 59-30-3) and beta-nicotinamide mononucleotide (β-NMN, >98.0%, CAS: 1094-61-7) were received from Tokyo Chemical Industry. Glucose (99+%, CAS: 492-62-6), L-cysteine (98+%, CAS: 52-90-4), glycine (99+%, CAS: 56-40-6), and glutathione (GSH, 98%, CAS: 70-18-8) were purchased from ACROS Organics. L-tyrosine (99%, CAS: 60-18-4), L-phenylalanine (99%, CAS: 63-91-2), L-glutamic acid (99+%, CAS: 56-86-0), and beta-nicotinamide adenine dinucleotide reduced disodium salt (β-NADH, 97%, CAS: 606-68-8) were obtained from Alfa Aesar. DA (CAS: 62-31-7), ractopamine (Rac, CAS: 90274-24-1), fructose (≥99%, CAS: 57-48-7), DL-homocysteine (≥95%, CAS: 454-29-5), EP (CAS: 51-43-4), UA (≥99%, CAS: 69-93-2) and L-ascorbic acid (AsA, ≥98%, CAS: 50-81-7) were received from Sigma-Aldrich. Adenosine triphosphate (ATP, 98%, CAS: 56-65-5) was purchased from AK Scientific.
2.2. NGQD synthesis
NGQDs were synthesized according to a previous report.34 300 mg of chitosan was dissolved in 20 mL of 0.1 M aqueous lactic acid solution. The mixture was further diluted twice with deionized (DI) water and used as a precursor solution. 10 mL of the precursor solution was taken and subjected to microplasma treatment at a fixed discharge current of 9.6 mA for 1 hour to synthesize NGQDs. For the purification step, see the ESI,† S1.2.3. Biomarker selectivity test
0.75 mL of 200 μM biomarkers, 0.3 mL of 0.1 M PBS buffer (pH values of 4.98, 7.72, and 9.68), and 0.3 mL of 1 mg mL−1 NGQD solution were mixed and the mixture was subjected to PL measurement at a 300 nm excitation wavelength. 2 M HCl or NaOH was used to adjust the pH value of the PBS buffer. All the experiments were conducted in triplicate and the PL measurements were performed at room temperature using a commercial high-throughput PL spectrofluorometer with a charge-coupled device (CCD) detector (Duetta, HORIBA Scientific, Japan) for the rapid screening of the selectivity test and parameter optimizations.2.4. Sensing of UA, FA, EP, and DA
0.3 mL of UA, FA, EP, and DA solutions with different concentrations were mixed with 0.3 mL of 0.1 M PBS (pH 7.58 for FA, pH 10.17 for UA and DA, and pH 12.44 for EP) and 0.3 mL of 1 mg mL−1 NGQD solution. The mixtures were incubated according to the corresponding incubation times (5 min for UA and FA and 10 min for EP and DA) before measuring the PL at an excitation wavelength of 300 nm. The experiment was conducted in triplicate and the PL measurements were performed at room temperature using a commercial highly sensitive PL spectrofluorometer with a photomultiplier (PMT) detector (Nanolog-3, HORIBA Scientific, Japan) to greatly improve the spectral resolution and reproducible results.2.5. Characterization
The absorption spectra were recorded using a JASCO V676 absorbance spectrophotometer. The PL measurements were performed using a PL spectrofluorometer with a PMT detector (Nanolog-3, HORIBA Scientific, Japan). Raman measurements were carried out using a JASCO 5100 spectrometer under a 532 nm laser excitation. Fourier transform infrared (FTIR) measurements were conducted in a liquid phase using a FTIR-iS10 spectrometer (NicoletTM). X-ray photoelectron spectroscopy (XPS) measurements were conducted using an ESCALAB Xi+ microprobe (Thermo Fisher Scientific, United Kingdom) with monochromatic Al Kα X-ray radiation as the source. Transmission electron microscopy (TEM) measurements were performed using a field emission gun TEM (JEOL JEM-2100F) with an accelerating voltage of 200 kV. The details can be found in the ESI.†3. Results and discussion
3.1. NGQD synthesis and characterization
The highly reactive species generated by the plasma are able to deconstruct the long chain chitosan molecule into smaller fragments to form NGQDs in one-step.35 The details about the synthesis can be seen in our previous reports.34 The optical properties of the synthesized NGQDs were investigated using absorption and PL measurements. As shown in Fig. 1a, an absorption peak at 277 nm represents the π–π* and n–π* transitions of sp2 carbon and C–N bonds, respectively. The absorption tail observed in the range of 300–400 nm corresponds to the n–π* transitions of the C![[double bond, length as m-dash]](https://www.rsc.org/images/entities/char_e001.gif) O or C–O functional group on NGQDs.34 The PL map depicted in Fig. 1b suggests that an excitation-dependent emission is exhibited by the NGQDs with a maximum PL intensity is located at the excitation and emission wavelengths of 340 and 424 nm, respectively. Additionally, the observed excitation-dependent emission can be attributed to the functionality distributions in NGQDs.36 The PL spectrum of NGQDs with the strongest emission intensity is shown in Fig. 1a. MicroRaman and FTIR spectroscopies can be used to study the vibrational structure of chitosan and NGQDs. The result in Fig. S1a (ESI†) shows no observable Raman peak of chitosan in NGQDs, indicating their high purity, while the existence of functional groups in NGQDs was also confirmed from the FTIR results (Fig. S1b, ESI†). Further details can be seen in the ESI,† S2.
O or C–O functional group on NGQDs.34 The PL map depicted in Fig. 1b suggests that an excitation-dependent emission is exhibited by the NGQDs with a maximum PL intensity is located at the excitation and emission wavelengths of 340 and 424 nm, respectively. Additionally, the observed excitation-dependent emission can be attributed to the functionality distributions in NGQDs.36 The PL spectrum of NGQDs with the strongest emission intensity is shown in Fig. 1a. MicroRaman and FTIR spectroscopies can be used to study the vibrational structure of chitosan and NGQDs. The result in Fig. S1a (ESI†) shows no observable Raman peak of chitosan in NGQDs, indicating their high purity, while the existence of functional groups in NGQDs was also confirmed from the FTIR results (Fig. S1b, ESI†). Further details can be seen in the ESI,† S2.
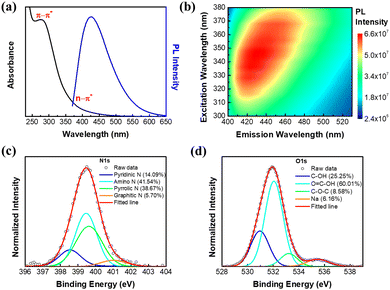 | ||
| Fig. 1 Spectroscopic characterization of NGQDs. (a) UV-Vis absorbance and PL emission spectra with the highest intensity. (b) PL map. XPS narrow scans on the (c) N 1s and (d) O 1s of NGQDs. | ||
X-ray photoelectron spectroscopy (XPS) measurements were performed to study the detailed functionalities on the synthesized NGQDs (Fig. S2a, ESI†). The existence of nitrogen doping can be confirmed in four different configurations (Fig. 1c), including pyridinic N (398.5 eV), amino N (399.4 eV), pyrrolic N (399.7 eV) and graphitic N (401.0 eV).5,34 On the other hand, the high resolution O 1s peak can be deconvoluted into three different peaks (Fig. 1d), including C–OH (530.9 eV), COOH (532.1 eV) and COC (533.2 eV).6,34 Through XPS analysis, it can be concluded that the synthesized NGQDs contain nitrogen doping in various configurations and rich in oxygen- and nitrogen-containing surface functional groups.
To visually observe the size and crystal morphology of NGQDs, transmission electron microscopy (TEM) measurements were performed. From Fig. 2a, the presence of NGQDs can be clearly observed as particle-like nanostructures. The crystal structure of NGQDs can be perceived from the Fast Fourier Transform (FFT) image shown in Fig. 2b. Through the combination of FFT and high-resolution TEM image in Fig. 2c, the lattice spacing is revealed to be 0.24 nm, which corresponds to the (1120) crystal plane of graphene.3 By fitting 40 different particles with a standard normal distribution, the corresponding size distribution histogram can be obtained (Fig. 2d), showing an average particle size of 4.7 ± 0.8 nm. In conclusion, the above detailed characterization results demonstrate that colloidal NGQDs with a narrow size distribution, stable PL, and abundant surface functional groups can be synthesized from chitosan in one-step using microplasma under ambient conditions.
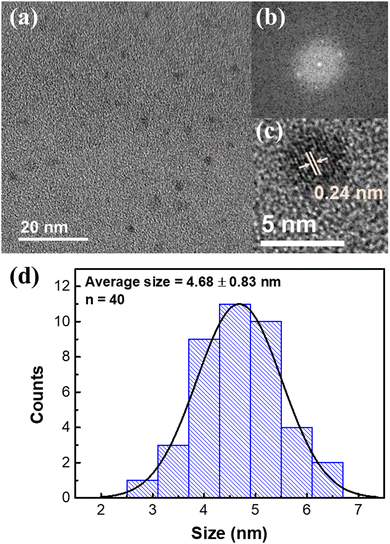 | ||
| Fig. 2 TEM measurements of NGQDs. (a) Low magnification TEM, (b) FFT, (c) high magnification TEM images and (d) the corresponding particle size distribution of NGQDs. | ||
3.2. Photoluminescence-based biomarker selectivity sensing with NGQDs
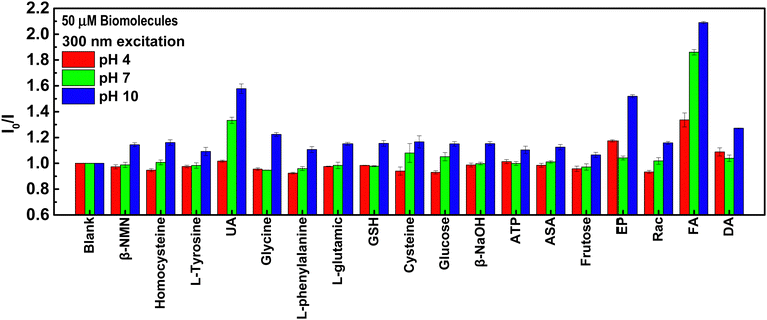
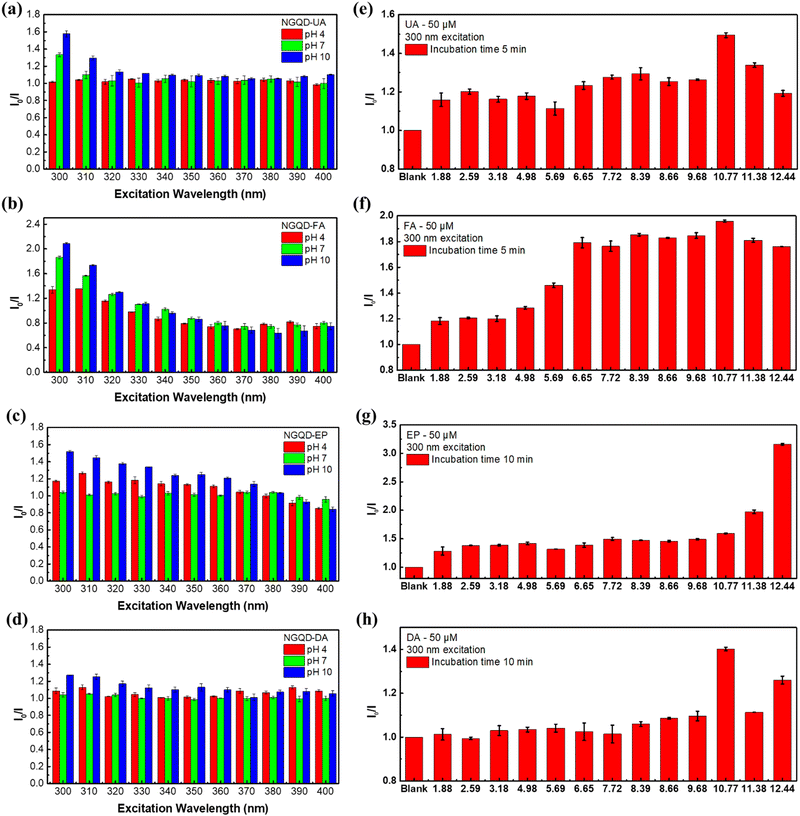
To test the sensing performance of the synthesized NGQDs, the selectivity test was conducted using 18 biomolecules that are important to the human body under different pH value conditions. Different biomarkers were mixed with NGQD solutions at different pH values (pH 4.98, 7.72, and 9.68) and the PL spectra of the excitation light at 300 nm were recorded. The results are shown in Fig. 3. The selectivity was evaluated by taking the PL intensity ratios of NGQDs in the absence (I0) and the presence of biomolecules (I). Based on the result, the NGQDs exhibit selectivity towards UA, FA, EP, and DA, indicated by their high I0/I values. Interestingly, UA and FA can be detected by NGQDs under both neutral and alkaline conditions, while EP and DA only show good selectivity under alkaline conditions. These results imply the possibility to establish a selective sensing platform based on NGQDs by adjusting the pH values.To further elucidate the influence of excitation wavelength on the sensing selectivity of NGQDs, the detection of UA, FA, EP and DA was carefully measured using PL maps with an excitation wavelength ranging from 300 to 400 nm at pH values of 4.98, 7.72 and 9.68. It can be observed that an excitation wavelength of 300 nm has the best quenching ratio for all four biomarkers (Fig. 4a–d). Hence, further studies were performed on many different pH values under a 300 nm excitation wavelength. NGQD-UA (Fig. 4e) has the best quenching ratio at pH 10.77, while NGQD-FA (Fig. 4f) shows good quenching ratios at pH 7.72 and 10.77. On the other hand, NGQD-EP shows a dramatic quenching ratio at pH 12.44 (Fig. 4g), while NGQD-DA only has the most significant quenching ratio at pH 10.77 (Fig. 4h). By following this result, the qualitative detection of UA, FA, EP and DA can be achieved through their corresponding optimum pH.
3.3. Controlling factors for quantitative detection and biosensing mechanisms
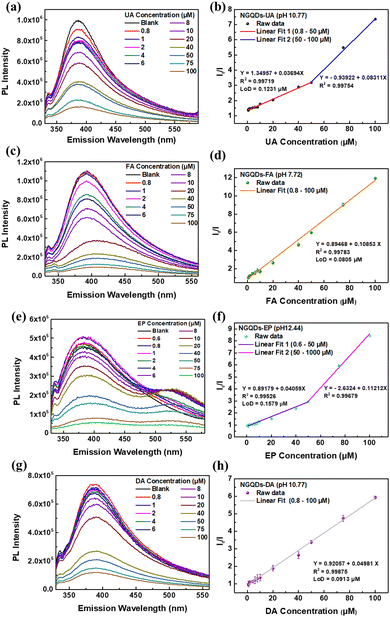
Different concentrations of UA, FA, EP, and DA were added into the NGQDs and the corresponding PL spectra under their optimum conditions were measured to study the sensing performances. It can be clearly observed from Fig. 5 that with the increased concentrations of UA, FA, EP and DA, the fluorescence quenching of NGQDs becomes more obvious.To understand the relationship between the concentrations of UA, FA, EP and DA and the PL quenching of NGQDs, the highest PL intensity of each spectrum was normalized to the highest PL intensity of the blank. Interestingly, a linear correlation line can be established between the analyte concentration versus quenching ratio with a high linearity (R2 > 0.99). UA and EP show two linear ranges starting from 0.8 to 50 μM (R2 = 0.997) and 50 to 100 μM (R2 = 0.998) for UA (Fig. 5b), 0.6 to 50 μM (R2 = 0.995) and 50 to 100 μM (R2 = 0.997) for EP (Fig. 5f). Whereas FA and DA show one linear range starting from 0.8 to 100 μM (R2 = 0.998) (Fig. 5d and h). Moreover, all four biomarker detections exhibit low LoD values of 123.1 nM, 157.9 nM, 80.5 nM, and 91.3 nM (based on the first correlation line) for UA, EP, FA, and DA, respectively. Table 1 summarizes the sensing performance of NGQDs.
| Biomarker | Linear range (μM) | R 2 | LoD (nM) | Incubation time (min) | Sensing mechanisms |
|---|---|---|---|---|---|
| UA | 0.8–50 | 0.9972 | 123.1 | 5 | IFE |
| 50–100 | 0.9975 | ||||
| FA | 0.8–100 | 0.9978 | 80.5 | 5 | IFE |
| EP | 0.6–50 | 0.9953 | 157.9 | 10 | PET & IFE |
| 50–100 | 0.9968 | ||||
| DA | 0.8–100 | 0.9979 | 91.3 | 10 | FRET & IFE |
To prove that the estimated LoDs are reliable, we also recorded the PL spectra of NGQDs in the presence of UA FA, EP, and DA at the corresponding LoD concentrations (Fig. S3, ESI†). Our sensing results are comparable with other reported works (Table S1, ESI†) and still robust even in the presence of several interferences (Table S2, ESI†). Several mixtures containing different biomolecules were added with different concentrations of UA, FA, EP, and DA. When only one targeted biomarker is present in the mixture, the accurate detection results can still be obtained, and the measurement results are similar to those without the addition of interfering substances (Table S2 mixtures A–D, ESI†). Noted that UA, FA, EP and DA usually exist in different parts in the human body with different concentrations; hence, the simulated mixture E–J contained these four biomarkers with the targeted biomarker possessed the highest concentration. All the measurements for the targeted biomarker yielded a low relative standard deviation (RSD) of ∼4%, indicating that our synthesized NGQDs can still be used for the detection of UA, FA, EP, and DA in complex systems with high accuracy (further details can be seen in the ESI,† S6). In addition, we investigated the stability of our NGQDs against different pH values to improve their practicality as biosensors. Fig. S4 (ESI†) shows that the PL intensities of NGQDs remain stable at pH 3.18–11.38 (details can be seen in the ESI,† S8).
The absorption spectra of the biomarkers were further recorded to understand the underlining sensing mechanisms (Fig. S5, ESI†), including Förster resonance energy transfer (FRET), inner filter effect (IFE), and photoinduced electron transfer (PET). In FRET, energy transfer generally occurs between the donor and acceptor separated about no more than 10 nm. This mechanism is usually accompanied by the spectral overlap between the PL and absorption spectra of the donor and acceptor, respectively.37 On the other hand, IFE is generated by the absorption of the photons used to excite the GQDs by the analyte.38 PET is a dynamic quenching process in which electrons from the donor are transferred to the acceptor, forming cation and anion radicals. The process is called oxidative PET when the GQD acts as the electron donor and the analyte acts as the electron acceptor; otherwise the process is called reductive PET when the GQD receives electron from the analyte.39
As shown in Fig. S5 (ESI†), when the pH is changed from neutral to alkaline conditions, the initial absorption peak of DA at 280 nm is shifted to 301 nm due to ionization of DA and a new absorption peak at 434 nm occurs due to the formation of DA quinone. These two peaks overlap very well with the PL excitation and emission spectra of NGQDs, indicating the occurrence of IFE and FRET between DA and NGQDs at an alkaline pH (Fig. 6a).40 In the FA case, the absorption spectrum of FA already overlaps with the excitation spectrum of NGQDs even under neutral conditions (Fig. S5b, ESI†); thus the sensing mechanism can also be due to IFE (Fig. 6b). There is also a possibility of complex formation between NGQDs and FA induced by the strong π–π interaction of aromatic rings, which assists the emission quenching of NGQDs.41 Similarly, the PL quenching of UA can also be attributed to IFE (see Fig. S5c and S6c, ESI†). Meanwhile, the PL quenching of NGQDs in the presence of EP can be plausibly regulated by the IFE and oxidative PET mechanism (Fig. 6d),42 in which the electron from NGQDs is transferred to the oxidized EP to form a radical anion, promoting the PL quenching of NGQDs (Fig. 6d).39,43 The occurrence of IFE in all cases causes some of the photons responsible to excite the ground state electrons of NGQDs to be absorbed by the biomarkers, consequently causing a gradual reduction in the PL emission intensity of NGQDs with the increasing biomarker concentration.44 Therefore, 300 nm excitation used coincides well with the absorption spectrum of each analyte, inducing the best sensing results compared with the other wavelengths. By exploiting the excitation-dependent behavior of NGQDs coupled under the pH conditions, the IFE mechanism can be maximized to yield the selective and sensitive detection of UA, FA, EP, and DA.
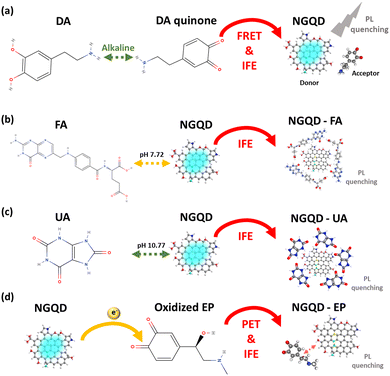 | ||
| Fig. 6 Proposed mechanism of pH-regulated NGQD-enabled sensing. The PL quenching mechanism of NGQDs in the presence of (a) DA quinone, (b) FA, (c) UA, and (d) oxidized EP. | ||
4. Conclusions
In conclusion, we have successfully utilized a low-cost, naturally available, and biocompatible chitosan as a precursor to synthesize NGQDs under ambient conditions using an atmospheric-pressure microplasma system that is easy to assemble and operate. Rapid synthesis without the need for strong acids and bases, toxic solvents and chemicals, as well as high temperature and vacuum conditions can be achieved. The synthesized NGQDs can be used for the detection of cancer CBs and NTBs, including UA, FA, EP, and DA with high selectivity, sensitivity, and low LoD. Effective detection can be achieved by adjusting the pH value during the detection process, thereby establishing a rapid screening system for biomarkers. The capability of NGQDs for FA detection at pH 7.72 is useful for in vivo studies, while the detection of UA, EP, and DA at an alkaline pH allows the possibilities for in vitro detection. Our work provides a new avenue in biomedical applications of NGQDs as well as in the early detection and diagnosis of cancer and neurological diseases and in the development of new drugs.Author contributions
Y. Y. C. conducted the formal analysis, validation, investigation, visualization, and writing – original draft. D. K. conducted the conceptualization, formal analysis, supervision, and writing – review and editing. S. M. M. and P. V. F. conducted the investigation. E. D. O. provided the resources and conducted the funding acquisition. W. H. C. conducted the formal analysis, supervision, project administration, funding acquisition, and writing – review and editing and provided the resources.Conflicts of interest
There are no conflicts to declare.Acknowledgements
This work was supported by the Ministry of Science and Technology of Taiwan (MOST grant no. MOST 111-2223-E-011-002-MY3, MOST 111-NU-E-011-001-NU, MOST 111-2628-E-011-002-MY2, MOST 109-2923-E-011-003-MY3, and MOST 111-2811-E-011-018), Russian Science Foundation (RSF) (grant no. RSF-20-42-08004) and the National Taiwan University of Science and Technology (NTUST). We also thank Ms. Chia-Ying Chien of National Science and Technology Council (National Taiwan University) for the assistance in the FE-TEM experiment.References
- N. Koch-Henriksen and M. Magyari, Nat. Rev. Neurol., 2021, 17, 676–688 CrossRef PubMed.
- G. Rajeev, B. Prieto Simon, L. F. Marsal and N. H. Voelcker, Adv. Healthcare Mater., 2018, 7, 1700904 CrossRef PubMed.
- Q. Wang, X. Wen and J. Kong, Crit. Rev. Anal. Chem., 2020, 50, 359–375 CrossRef CAS PubMed.
- M. A. Fini, A. Elias, R. J. Johnson and R. M. Wright, Clin. Transl. Med., 2012, 1, 16 Search PubMed.
- J. Hammarsten, J.-E. Damber, R. Peeker, D. Mellström and B. Högstedt, Cancer Epidemiol., 2010, 34, 574–579 CrossRef CAS PubMed.
- T. Bjørge, A. Lukanova, H. Jonsson, S. Tretli, H. Ulmer, J. Manjer, T. Stocks, R. Selmer, G. Nagel and M. Almquist, Cancer Epidemiol., Biomarkers Prev., 2010, 19, 1737–1745 CrossRef PubMed.
- D. P. Rose, S. M. Haffner and J. Baillargeon, Endocr. Rev., 2007, 28, 763–777 CrossRef CAS PubMed.
- E. Giovannucci, Am. J. Clin. Nutr., 2007, 86, 836S–842S CrossRef CAS PubMed.
- A. A. Siddiqui and B. F. Palmer, Am. J. Med. Sci., 2011, 341, 227–231 CrossRef PubMed.
- M. Wang, Y. Jiao, C. Cheng, J. Hua and Y. Yang, Anal. Bioanal. Chem., 2017, 409, 7063–7075 CrossRef CAS PubMed.
- Z. Zhu, H. Wu, S. Wu, Z. Huang, Y. Zhu and L. Xi, J. Chromatogr. A, 2013, 1283, 62–67 CrossRef CAS PubMed.
- W. Zhang, B. Wu, Z. Li, Y. Wang, J. Zhou and Y. Li, Spectrochim. Acta, Part A, 2020, 229, 117931 CrossRef CAS PubMed.
- K. Lyall, R. J. Schmidt and I. Hertz-Picciotto, Int. J. Epidemiol., 2014, 43, 443–464 CrossRef PubMed.
- A. Yildirim and M. Bayindir, Anal. Chem., 2014, 86, 5508–5512 CrossRef CAS PubMed.
- Y. Tao, Y. Lin, J. Ren and X. Qu, Biosens. Bioelectron., 2013, 42, 41–46 CrossRef CAS PubMed.
- B.-R. Li, Y.-J. Hsieh, Y.-X. Chen, Y.-T. Chung, C.-Y. Pan and Y.-T. Chen, J. Am. Chem. Soc., 2013, 135, 16034–16037 CrossRef CAS PubMed.
- S. S. Hassan and G. Rechnitz, Anal. Chem., 1986, 58, 1052–1054 CrossRef CAS PubMed.
- E. Wierzbicka, M. Szultka-Młyńska, B. Buszewski and G. D. Sulka, Sens. Actuators, B, 2016, 237, 206–215 CrossRef CAS.
- H. Xu, Z. Bai, G. Wang, K. P. O’halloran, L. Tan, H. Pang and H. Ma, Microchim. Acta, 2017, 184, 4295–4303 CrossRef CAS.
- T. Qian, S. Wu and J. Shen, Chem. Commun., 2013, 49, 4610–4612 RSC.
- A. Babaei, M. Sohrabi and M. Afrasiabi, Electroanalysis, 2012, 24, 2387–2394 CrossRef CAS.
- C. Wang, Q. Liu, G. Guo, W. Huo, L. Ma, Y. Zhang, C. Pei, S. Zhang and H. Wang, Arch. Anim. Nutr., 2016, 70, 441–454 CrossRef CAS PubMed.
- V. Carrera, E. Sabater, E. Vilanova and M. A. Sogorb, J. Chromatogr. B: Anal. Technol. Biomed. Life Sci., 2007, 847, 88–94 CrossRef CAS PubMed.
- Y. Ma, A. Chen, X. Xie, X. Wang, D. Wang, P. Wang, H. Li, J. Yang and Y. Li, Talanta, 2019, 196, 563–571 CrossRef CAS PubMed.
- B.-T. Zhang, L. Zhao and J.-M. Lin, Talanta, 2008, 74, 1154–1159 CrossRef CAS PubMed.
- T. Zhang, H. Xue, B. Zhang, Y. Zhang, P. Song, X. Tian, Y. Xing, P. Wang, M. Meng and R. Xi, J. Sci. Food Agric., 2012, 92, 2297–2304 CrossRef CAS PubMed.
- M. B. Fritzen-Garcia, F. F. Monteiro, T. Cristofolini, J. J. S. Acuña, B. G. Zanetti-Ramos, I. R. W. Oliveira, V. Soldi, A. A. Pasa and T. B. Creczynski-Pasa, Sens. Actuators, B, 2013, 182, 264–272 CrossRef CAS.
- X. Chen, N. zheng, S. Chen and Q. Ma, Anal. Methods, 2017, 9, 2246–2251 RSC.
- Y. Yan, J. Gong, J. Chen, Z. Zeng, W. Huang, K. Pu, J. Liu and P. Chen, Adv. Mater., 2019, 31, 1808283 CrossRef PubMed.
- X. T. Zheng, A. Ananthanarayanan, K. Q. Luo and P. Chen, Small, 2015, 11, 1620–1636 CrossRef CAS PubMed.
- X. Wang, G. Sun, N. Li and P. Chen, Chem. Soc. Rev., 2016, 45, 2239–2262 RSC.
- S. Ganguly, P. Das, S. Banerjee and N. C. Das, Funct. Compos. Struct., 2019, 1, 022001 CrossRef CAS.
- P. Yang, Z. Zhu, T. Zhang, W. Zhang, W. Chen, Y. Cao, M. Chen and X. Zhou, Small, 2019, 15, 1902823 CrossRef CAS PubMed.
- D. Kurniawan and W.-H. Chiang, Carbon, 2020, 167, 675–684 CrossRef CAS.
- F. J. Critzer, K. Kelly-Wintenberg, S. L. South and D. A. Golden, J. Food Prot., 2007, 70, 2290–2296 CrossRef PubMed.
- L. Shi, J. H. Yang, H. B. Zeng, Y. M. Chen, S. C. Yang, C. Wu, H. Zeng, O. Yoshihito and Q. Zhang, Nanoscale, 2016, 8, 14374–14378 RSC.
- M. J. Molaei, Anal. Methods, 2020, 12, 1266–1287 RSC.
- S. Chen, Y.-L. Yu and J.-H. Wang, Anal. Chim. Acta, 2018, 999, 13–26 CrossRef CAS PubMed.
- M. Bixon, J. Jortner and J. W. Verhoeven, J. Am. Chem. Soc., 1994, 116, 7349–7355 CrossRef CAS.
- A. Kumar, S. Asu, P. Mukherjee, P. Singh, A. Kumari and S. K. Sahu, J. Photochem. Photobiol., A, 2021, 406, 113019 CrossRef CAS.
- F. Zu, F. Yan, Z. Bai, J. Xu, Y. Wang, Y. Huang and X. Zhou, Microchim. Acta, 2017, 184, 1899–1914 CrossRef CAS.
- M. Wang, Y. Li, L. Wang and X. Su, Anal. Methods, 2017, 9, 4434–4438 RSC.
- R. M. Williams, J. M. Zwier and J. W. Verhoeven, J. Am. Chem. Soc., 1995, 117, 4093–4099 CrossRef CAS.
- Q. Long, A. Fang, Y. Wen, H. Li, Y. Zhang and S. Yao, Biosens. Bioelectron., 2016, 86, 109–114 CrossRef CAS PubMed.
Footnote |
| † Electronic supplementary information (ESI) available: Additional analyses: PL and interference sensing. See DOI: https://doi.org/10.1039/d2tb01833k |
| This journal is © The Royal Society of Chemistry 2022 |

