Terahertz Raman scattering as a probe for electron–phonon coupling, disorder and correlation length in molecular materials
Tommaso
Salzillo
 a,
Aldo
Brillante
 b and
Alberto
Girlando
 *c
*c
aDepartment of Chemical and Biological Physics, Weizmann Institute of Science, Herzl Street 234, 76100 Rehovot, Israel
bDipartimento di Chimica Industriale “Toso Montanari”, Università di Bologna, via del Risorgimento 4, 40136 Bologna, Italy
cMolecular Materials Group, Strada Fontanini 68, 43124 Parma, Italy. E-mail: girlando@momag.it; Tel: +39 0521 648042
First published on 5th July 2021
Abstract
Terahertz (or low-frequency) Raman spectroscopy has been shown to be a quite useful tool to infer important information on some key properties of molecular materials, like polymorphism, phase purity and phase transitions. Based on some of our recent studies, we present promising new directions and possible development of the technique for the characterization of electron–lattice phonon coupling, disorder and correlation length in systems of low-dimensionality. The relative strength of electron–lattice phonon coupling can be extracted from the intensities of the Raman bands in the pre-resonance Raman regime, as exemplified in the charge-transfer (CT) crystal N,N-dimethylphenazine-tetracyanoquinodimethane (M2P-TCNQ). Disorder is instead reflected in the Raman bandwidth, which we analyze with polarized light for systems of reduced dimensionality. The sample system studied for the one-dimensional case is the tetramethylbenzidine-tetrafluoroTCNQ CT crystal. As an example of a quasi two-dimensional (2D) system we address pentacene, the classical case of a monomolecular material widely studied for its application in organic electronics. Here the discussion is mostly related to the dispersion of the phonon branches, eventually leading to peculiar spectral profiles depending on the 2D or 3D regime of the films grown under different deposition conditions.
1 Introduction
Organic molecular solids represent a widespread class of multifunctional materials exhibiting a variety of physical and chemical properties with many technological applications. In particular, molecular crystals made up of conjugated molecules have been intensively studied since the discovery of their semiconducting and conducting properties, with the perspective of substituting silicon or metal-based materials. However, thanks to the long term dedications of several outstanding research groups, such as those lead by Conceptió Rovira and Jaume Veciana, it has become rapidly clear that these materials could also offer a number of new applications, ranging from organic field effect transistors (OFETs),1–3 light emitting diodes (OLEDs),4 solar cells,5 external stimuli sensors,6 and so on.In molecular materials the molecules are held together by forces which are much weaker than the chemical intra-molecular bonds, yielding the advantage of easy processability and tunability of material properties. On the other hand, the variety of weak, sometimes competing inter-molecular interactions such as π–π stacking interactions, non-directional van der Waals forces, hydrogen and halogen bonding make it difficult to control the molecular packing, with easy occurrence of polymorphism.7 The study of polymorphism is crucial for the field of molecular materials as the crystal structure determines the properties of a material and different packing can affect dramatically the functional properties, and thus its technological applications.8
The prediction and control of the crystal structures in materials are then challenging issues, which have become the realm of crystal engineering. A recent study reported several strategies in an attempt to control polymorphism although these methods are still imperfect.9 Metastable and concomitant phases are also crucial as they can affect the shelf stability or act as physical impurity breaking the extended π-conjugation and hence have a detrimental effect for example on charge transport for OFETs.10
The technique of choice for the study of polymorphism has been mostly X-ray diffraction (XRD) which is certainly very apt for determining the average crystal structure, whereas it has problems in the case of subtle structural differences, phase mixing and the characterization of thin films. In the last decade Raman spectroscopy in the low-frequency (5–150 cm−1) region of lattice phonons, or THz Raman spectroscopy (0.2–5 THz) for short,11,12 has been proposed as a complementary method in polymorph identification and mapping in molecular materials.13 For instance, THz Raman spectroscopy has been successfully used to control phase purity in organic semiconductors, notably pentacene,14 or to identify four different polymorphs of dibenzo-tetrathiafulvalene, even before the full XRD determination.15,16 Furthermore, characterization of lattice phonons, both from the experimental17–20 and computational points of view,21–23 has provided the necessary basis for the modeling of the complex charge transport mechanism in organic semiconductors.24–27
In this paper we will present new directions and challenges for THz Raman spectroscopy in the characterization of organic molecular materials. In fact, based on our recent results, we believe that the method can also be used to gain insight into what we call low-dimensional disorder, occurring in the absence of strong interactions between adjacent chains or layers inside the crystal.
Disorder is a complex issue, ubiquitous to a major or minor extent in all materials, often playing an important role in determining their properties. The simple classification and nomenclature present problems, as disorder has been studied in different materials and fields, so that as far back as four decades ago J. M. Ziman stated that it was “too late to capture the physics of disordered systems within a single book”.28
Low-dimensional disorder we shall limit to is typical of the generally highly anisotropic organic molecular crystals. As in XRD nomenclature,29 we distinguish between thermal, or dynamic, disorder, and displacement, or static, disorder. Thermal disorder is ubiquitous, in XRD it is reflected in the Debye–Waller factors, and in THz Raman in the band broadening. The disorder is called thermal because, due to phonon anharmonicity, its effects are temperature dependent, and are stronger when the phonon excited states are populated. In the next section, we shall examine a case in which the anharmonicity is particularly strong and anisotropic as a consequence of electron–phonon coupling, a quite important issue in the field of organic semiconductors. In the remaining two sections we shall instead focus on displacement disorder in low dimension, where a set of molecules are displaced from their theoretical position in a perfectly ordered crystal.29 At variance with the above-mentioned thermal disorder, where the motion of the molecules is completely uncorrelated, we consider displacement disorder in which the entire domains of the crystals are displaced with respect to the average lattice which is detected by conventional XRD. The crystal does not have long range order in one or two dimensions, bringing about the issue of the correlation length in an intermediate order regime.28
2 Thermal disorder and electron–lattice phonon coupling
In recent years, the mechanism of charge transport in organic semiconductors (OSC) has been the object of intense debate.24–27 Since OSC are narrow-band semiconductors, the importance of electron–phonon coupling has been recognized from the outset. However, the phonon structure of molecular crystals is fairly complex, making modeling a hard task. A quite useful and generally valid first approximation is to separate the phonons into intra-molecular phonons, those related to the isolated molecule, and inter-molecular or lattice phonons, corresponding to the relative oscillations of the molecules as rigid bodies inside the crystal. Accordingly, electron–phonon coupling can also be separated into Holstein, or local, or electron–molecular vibration (e–mv) coupling, and Peierls, or non-local, or electron–lattice phonon (e–lph) coupling. The corresponding coupling constants are given by the modulation of intra- and inter-molecular energy Eij:21,22 | (1) |
The role of e–mv coupling in the OSC transport mechanism is well established, giving rise to the Holstein polaron hopping mechanism.30 However, the polaron hopping mechanism alone is inadequate to explain the observed mobilities and their temperature dependence, and more complete models also taking into account the Peierls coupling have started to emerge.31 According to these models, charge transport is limited by dynamic disorder, namely fluctuations of hopping integrals t induced by thermally populated lattice phonons (<200 cm−1 or <6 THz) coupled to the electronic system. This dynamic, or thermal, disorder can be quite significant, so that the standard deviation of t is of the same order of the average t. As a result, charge carrier delocalization is hindered, and transient localization occurs.25,26,32
Fundamental importance for testing the validity of a theory is the assessment of the parameters involved, notably the hopping integrals and band structure on one hand, and both e–mv and e–lph coupling on the other. All these quantities can be estimated through semiempirical or DFT calculations.21,22,33,34 However, whereas angle resolved photoemission spectroscopy35 and polarized infrared (IR) spectroscopy36 have been successfully used to experimentally validate the calculated band structure and Holstein coupling strength, respectively, such testing is missing in the case of Peierls coupling.
Terahertz (THz) Raman spectroscopy is the most obvious method to think of to probe e–lph coupling, but analyzing Raman intensities is difficult. Moreover, in the case of one component OSC like pentacene, Raman intensities are connected to the exciton–phonon rather than to the electron–phonon coupling. As a matter of fact, only in the case of CT co-crystals and salts one can actually investigate the electron–phonon coupling through vibrational spectroscopy. The e–mv coupling constants are molecular parameters, hence transferable from CT co-crystals to one component OSC,36 but e–lph coupling constants are not, as lattice phonons strictly depend on the crystal packing. On the other hand, investigating the Peierls coupling in CT co-crystals is worthwhile as a first step to a deeper understanding and extension to one-component OSC. Moreover, CT co-crystals can act as semiconductors, and although their room temperature mobility is two or three order of magnitudes lower than those of the best one-component systems, they can exhibit other, even more interesting, physical properties.37–39 Indeed it was during a recent investigation of a polar CT co-crystal with relaxor ferroelectric properties40 that pre-Resonance Raman spectroscopy put in evidence for the importance of Peierls coupling in that system. Here we shall extend the analysis, focusing on the theoretical basis of the observed effects, and showing the advantages and limitations of the approach.
N,N-Dimethylphenazine-tetracyanoquinodimethane (M2P-TCNQ) is a mixed stack quasi one-dimensional (1D) CT crystal, with donor and acceptor (D, A) molecules alternating along the crystallographic c axis, as shown in Fig. 1. The structure is polar (space group Cm) and the stack is dimerized, i.e. with alternating long and short distances along the chain, justifying the treatment in terms of a collection of DA isolated pairs (dimer model).40
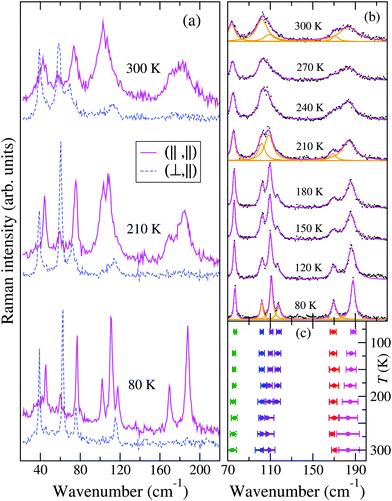
Fig. 2 reports the T evolution of the THz Raman spectra with polarization (c,c), i.e., incident and scattered radiation polarized parallel to the stack axis. At room T the spectra are dominated by two broad bands around 125 and 170 cm−1. By increasing the temperature these bands soften and become broader, whereas by lowering T they narrow considerably and between 200 and 150 K each one become clearly separated into two bands. This trend further proceeds down to 80 K. We then have two groups of bands with anomalous temperature broadening. Panel (b) of Fig. 2 shows that these bands also exhibit a considerable frequency softening (15–20 cm−1) by increasing T in the explored temperature range, a fact pointing to a strong degree of anharmonicity for the associated phonons. The bandwidth of the other low-frequency phonons is normal,40 and so is their softening (top and bottom right panels of the figure), which corresponds to what is generally expected due to thermal expansion.
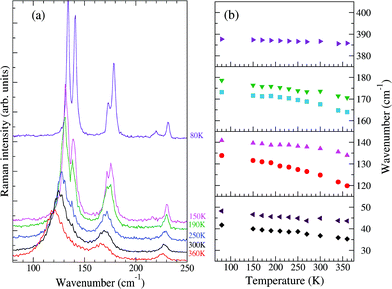 | ||
| Fig. 2 (a) Low-frequency Raman spectra of M2P-TCNQ, (c,c) polarization, as a function of T, exciting line: 752 nm. (b) Temperature evolution of the frequencies of selected bands. | ||
The left panels of Fig. 3 show that by shifting the Raman exciting line towards longer wavelengths, namely, by going closer to the CT transition (located at about 5000 cm−1), the intensity of the 125 and 170 cm−1 group of bands in the (c,c) polarization is strongly enhanced with respect to that of the other ones, also in the different polarization. Both the anomalous anharmonicity and the selective resonance intensity enhancement are connected to strong e–lph coupling, as explained below.
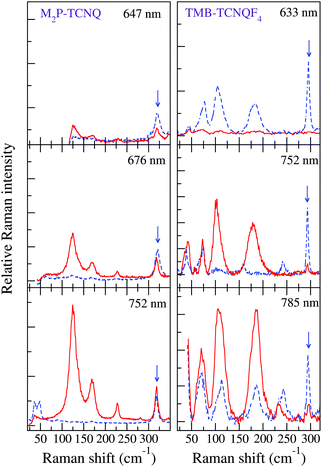 | ||
| Fig. 3 Left panels: M2P-TCNQ polarized THz Raman spectra as a function of excitation line, T = 300 K. Red line: incident and scattered radiation polarized parallel to the stack axis; blue dashed line, incident and scattered radiation polarized perpendicular to the stack. The blue arrow indicates the band in the (⊥,⊥) polarization taken as a reference for the intensity enhancement of the bands in the (‖,‖) polarization (adapted from ref. 40). Right panels: analogous data for TMB-TCNQF4 (adapted from ref. 41). | ||
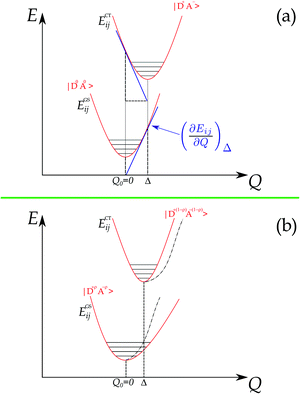
The foundations for Raman intensity go back to the early years of quantum mechanics, the basic equations bearing the names of Kramers, Heisenberg and Dirac, but reducing it to a manageable form progressed slowly, mainly because, also after several approximations, the intensity is proportional to the square of a summation over all the excited states. The expression simplifies considerably when the exciting line is in resonance or pre-resonance with one electronic transition (in our case, the CT transition) so that all the terms in the summation can be disregarded with respect to the resonant one. Both the expansion method of Tang and Albrecht42 and the time dependent formulation of Lee and Heller43 yield a particularly simple and illuminating description of the Resonant Raman cross section, as it turns out to be proportional, through the electronic susceptibility, to the square of displacement Δ of the minima of the harmonic potential curves of the ground and excited CT state, as pictorially illustrated in the (a) panel of Fig. 4.
In other words, the modes which undergo the larger geometry change upon electronic CT excitation are the ones exhibiting the larger relative Raman intensity. Absolute Raman intensities are very hard to evaluate, in particular for solids, but the relative intensities of the two bands are simply related by:44
 | (2) |
The shift of the harmonic potential minima Δ is another way to express the electron–phonon coupling constant. Always with reference to the schematics of the (a) panel of Fig. 4, the coupling constant is the tangent to the harmonic potential curve (indexes are omitted for simplicity):
 | (3) |
Therefore
 | (4) |
 | (5) |
In addition, panel (b) of Fig. 4 pictorially shows that when the electron–phonon interaction is switched on, the two parabolas are deformed following perturbation theory, hence the anharmonicity of the phonon in the ground state. Thus the above simple picture explains the intensity enhancements of some M2P-TCNQ lattice modes in approaching the CT transition, and the corresponding anharmonicity (Fig. 2 and 3).
As an exercise, we can apply eqn (5) to estimate the relative values of the Peierls coupling constants of M2P-TCNQ. We use the 80 K spectrum of Fig. 2, taking the coupling constant of the lowest intensity band as 1.0 meV. The results are given in Table 1.
| Frequency (cm−1) | Intensity (arb. units) | g P m (meV) | ε P m (meV) |
|---|---|---|---|
| 42 | 673.6 | 1.0 | 0.19 |
| 48 | 611.4 | 1.0 | 0.17 |
| 71 | 1598.3 | 2.0 | 0.45 |
| 134 | 16924.7 | 8.8 | 4.66 |
| 141 | 15380.0 | 8.6 | 4.23 |
| 173 | 3999.0 | 4.9 | 1.12 |
| 179 | 11029.6 | 8.2 | 3.03 |
| 220 | 1731.7 | 3.6 | 0.48 |
The lattice distortion energy for each phonon, εPm = gm2/ωm, is given in the rightmost column of Table 1. The reported values are only relative values, of course. However, the Peierls coupling constants in the table compare very well with those calculated for pentacene or rubrene, and the same is true for the total lattice distortion energy,  , which is the parameter generally involved in the theories of transport: we have about 15 meV vs. 15–20 meV for pentacene and rubrene.21,22
Although the results in the case of M2P-TCNQ are encouraging, we have to stress the limitation of the approach, and a perspective for further work. Although it may seem strange, a reliable comparison with calculations cannot be done, since for DA systems the calculation of the hopping (or CT) integrals strongly depends on the chosen basis set.40 In our experience even a comparison between the ts of different DA pairs calculated with the same basis cannot be trusted. A recent study trying to circumvent the problem of direct calculation has been only partially successful, as it works well for quasi-neutral CT crystals45 – not for M2P-TCNQ, for example. In view of the growing interest towards CT co-crystals, this is a direction certainly worth pursuing.
Another limitation of the approach through pre-Resonance THz Raman is that, at least for quasi 1D chains, the Raman active lattice phonons are coupled to the CT transition only in the case of dimerized mixed stack CT crystals,46 which are a minority. The success of this method, which came out as an unforeseen side-product of a differently oriented investigation, suggests extending the method also to one-component OSC. As we have stated above, in general one does not know where the CT transition is located in one-component OSC. It might be close to the lowest energy HOMO–LUMO type of transition, and is likely obscured by this one. And it is not guaranteed that the exciton–phonon coupling constants deriving from pre-resonance THz Raman have something to do with the electron–phonon coupling, since for the HOMO–LUMO type of transition the excited electron remains on the same molecule. However, as in the present case, the relative values of the exciton–phonon coupling constants might be related to the electron–phonon of interest. So, an extensive investigation of the THz Raman spectra as a function of the exciting line of well-known OSC like tetracene, pentacene or rubrene represents an urgently required and promising direction of investigation.
3 Static (displacement) disorder in low-dimension
We shall now address the question of static disorder, also called displacement disorder, as opposed to the dynamic, uncorrelated disorder discussed in the previous section. The kind of disorder we consider here is indeed distributed over the crystal (i.e. not localized at the grain boundaries) but retains some kind of order at the nanoscale, with a correlation length intermediate between that of long-range and short-range order.28 In other words, displacements of the molecules with respect to their equilibrium position produce a loss of correlation among different regions of the structure. When the absence of strong interactions is between adjacent layers or chains, the derived situation can be called low-dimensional disorder. Here the extent of static disorder is at its most extreme, in that an effective loss of periodicity is constrained to either one or two dimensions.47Such a kind of disorder often plays an important role in determining the physical properties of materials, like for instance transport.32 Displacement disorder is difficult to ascertain by standard XRD, which determines accurately the average structure of the crystals, so they appear more ordered then they are in reality.29 We shall see how THz polarized Raman spectroscopy can offer useful hints of the presence of static low-dimensional disorder.
3.1 One-dimensional systems
We now consider another quasi-1D mixed stack CT crystal, tetramethylbenzidine-tetrafluoroTCNQ (TMB-TCNQF4), whose THz Raman spectra signal the presence of disorder, like those of M2P-TCNQ above, but whose origin turns out to be different.According to the initially reported XRD crystal structure,48 at room temperature TMB-TCNQF4 crystallizes in the monoclinic system C2/m (C2h3), with two DA pairs per unit cell. In this structure, all the molecules reside on inversion centers, so that the stack appears to be regular, i.e., equal distances between the D and A molecules along the stack. On the other hand, Castagnetti et al.48 noted that the room temperature IR spectra polarized parallel to the stack are characterized by the presence of strong absorptions induced by the e-mv coupling at the same frequencies as the main Raman bands. This is an unquestionable indication of the loss of inversion center, i.e., that the stack appears to be dimerized, in contrast with the reported crystal structure.
There are several other cases of contrast between the indications of XRD and of vibrational spectroscopy, since the former probes the long-range order and the latter the local (DA pair) structure. All these discrepancies have been explained in terms of some kind of disorder, either static or dynamic,49–52 but the origin of the discrepancy between XRD and IR spectroscopy was not definitely assessed.
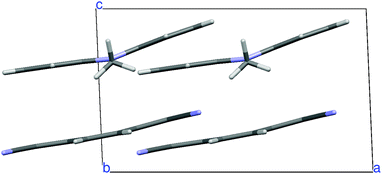
A new structural determination at low temperature (100, 150 and 200 K) with synchrotron radiation has been performed41 to detect the diffuse scattering signaling disorder and/or the insurgence of a Peierls-like transition.53,54 Evidence of diffuse scattering was not found, but the experiment provided evidence of weak spots which violated the systematic absences predicted by the C2/m space group. A much-improved convergence has been obtained with the lower symmetry space group P21/m. The unit cell contains two dimerized stacks with antiferroelectric arrangement, as shown in Fig. 5. Moreover, there is a network of hydrogen bonds between the methyl and the cyanide groups, the hydrogens being positioned so that they point to both the upper and lower TCNQF4 molecules. The new structure is perfectly consistent with the presence of e-mv induced bands in IR,48 since the center of inversion is between the stacks. On the other hand, the collection of polarized THz Raman spectra indicates that the disorder is present above 200 K.41
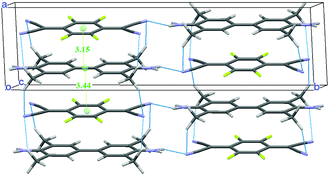 | ||
| Fig. 5 Crystal structure of TMB-TCNQF4 at 100 K. The network of hydrogen bonds and the intermolecular distances (in Å) along the stack are also shown. | ||
The temperature dependence of the TMB-TCNQF4 polarized THz Raman spectra is shown in Fig. 6. The number of bands is consistent with what is expected on the basis of the newly determined P21/m space group (they would be too many for C2/m). In addition, and similarly to the M2P-TCNQ case (Fig. 2), at room temperature the spectrum recorded with incident and scattered light polarized along the stack, labeled (‖,‖), show two rather broad bands around 100 and 180 cm−1, that by lowering T narrow and separate into more components, as detailed in panel (b) of the figure. Notice also that the bandwidths observed in the other polarization are normal. At variance with M2P-TCNQ, the frequency hardening by lowering T is normal for all the phonons – cf.Fig. 2 panel (b) with Fig. 6 panel (c). Both panels have been obtained by performing a deconvolution in terms of Lorentzians, as exemplified for three temperatures by the orange lines in panel Fig. 6(b).
Finally, the spectra recorded by moving the exciting line toward the CT transition display an intensity enhancement much less pronounced than in the case of M2P-TCNQ, as can be visually appreciated by comparing the right with the left panels of Fig. 3. A measure of the relative intensities of the bands with reference to one band in the (⊥,⊥) polarization (marked by an arrow in the figure) shows that with excitation in the red (∼1.6 eV) the enhancement for M2P-TCNQ is about five times as large as that of TMB-TCNQF4, although the excitation line is closer to the CT transition energy of the latter.41 Therefore in the case of TMB-TCNQF4 the phonon anharmonicity induced by electron–phonon coupling has only a marginal role in the remarkable band broadening and line merging observed by increasing temperature.
The structure remains the same up to room temperature. The room T XRD data have been collected with a conventional, not synchrotron, source, so the quality is not the same as at low T. Analysis of diffuse scattering has not been performed, and some clue about disorder along the stack may come only from the scrutiny of the anisotropic displacement parameters.55 On the other hand, disorder along the stack is suggested not only by the THz Raman spectra, but also by the relaxor ferrolectric behavior observed above ≈150 K, which incidentally contradicts the anti-ferrolectric dimerization of the P21/m structure.41
All the TMB-TCNQF4 available data can be consistently accounted for by the presence, above 150–200 K, of 1D nanodomains of opposite dimerization within each stack. These nanodomains are mobile under an oscillating electric field, as the inversion of dimerization is actuated by the movement of a spin soliton.41 However, such nanodomains move at a frequency of a few KHz, i.e., are practically static with respect to the phonons. It is well known that such mobile nanodomains survive only in 1D systems.56,57 By lowering T, their length increases, and they start to feel the presence of nearby nanodomains, until they become locked and establish a long-range 3D order.
To summarize, whereas the band broadening observed in M2P-TCNQ is mostly due to phonon anharmonicity, and is therefore ascribable to dynamic disorder, in the present case THz Raman suggests that the broadening is mainly due to disorder in the lattice structure along the stack axis, namely, to static, or displacement disorder.29 In fact, static disorder at the nanoscale implies at least partial breaking of the k ≃ 0 selection rule,58 hence the band broadening. We remark that the presence of the e–mv induced bands48 only signal symmetry breaking/disorder at the very local scale, i.e., a pair of molecules. On the other hand, lattice phonons, which strongly depend on the crystal packing, appear to also sense the loss of correlation between different regions in the one-dimensional direction. The questions which spontaneously arise at this point are: What is the correlation length sensed by THz Raman? Does anything analogous to the coherence length exist that can be estimated by the peak broadening in XRD?29 These questions require a parallel temperature dependent analysis of the disorder by diffuse scattering and/or neutron diffraction in view of the above evidenced importance of hydrogen bonding.59 Further work along the same line is highly desirable also on different systems,49–52 including the challenge posed by the development of a suitable computational approach. The latter, as we have already mentioned, presents problems also for perfectly ordered CT crystals, putting aside the disordered ones. For instance, attempts to calculate the electronic and vibrational structure of TMB-TCMQF4 failed, since standard DFT methods do not reproduce the observed charge separation of ρ ∼ 0.9.
3.2 Two-dimensional systems
There are several ways of defining the dimensionality of a system.60 In the case of 1D CT crystals we have dealt with in the previous sections, the definition is dictated by the large difference between the CT interaction energy along the stack and the van der Waals and other minor interactions perpendicular to the stack. Although CT crystals also present examples of quasi-two dimensional (2D) solids,61 here we shall address another type of molecular material, i.e., pentacene films grown to build OFETs, which in a sense are closer to truly 2D system like graphene.In particular, we shall consider the situation where pentacene molecules are deposited as one, or very few, monolayers (MLs) over a suitable substrate. Here, the difference between the intra- and inter-layer interaction energies is not so marked as in the case of CT crystals, and in fact, as we shall see below, different deposition procedures lead to different dimensionality. It is then better to define dimensionality in terms of the size dependence of a relevant physical property, for instance transport. The pentacene film is then considered to be 2D when the interlayer mean free path of the charge carrier is determined by the layer boundary scattering induced by disorder, and not by some other intrinsic mechanism.60 We are then led to consider the interlayer organization and correlation length. When the latter is short perpendicularly to the layer, collective excitations are strongly confined in 2D, determining the electronic and optical properties of the material.62 Shrinking the active layer thickness in organic devices to one or a few MLs is indeed an attractive strategy to improve charge transport in OFET's.63 The issue is important because systems with reduced dimensionality involve the thin film technology, where it has been proved that charge transport in the organic active semiconducting materials is dominated by the very first few layers next to the dielectric interface, irrespective of the total thickness of the molecular coverage.63–65 From this, the great importance of a description of both the structure and the dynamics of organic 2D systems.
It is not too difficult to describe the structure of the pentacene ML or multi-ML. It is less obvious how to describe the phonon dynamics of such a system. One way to proceed could be to classify the intermolecular vibrational modes of a molecular crystal (optical lattice phonons) according to their symmetry, starting from one of the five 2D Bravais lattices and keeping its component molecules as rigid bodies. The only lattice constraints will be the relative lengths of the cell axes (a and b) and the angle between them. However, the drawback is that it is hard to classify an ultra-thin film on a substrate, down to one ML or to a sub-ML, as a system completely lacking out-of-plane interactions.
An alternative way to tackle the problem is to gather information from the dispersion relation of the optical phonons of the system. Lattice phonons are indeed collective translational and librational motions of the molecules inside the unit cell, whose dynamics very much depends upon the periodicity of the lattice dictated by the crystal symmetry. The structure of the phonon branches can be calculated, or experimentally measured, by their dispersion relation ω(k).66,67 In the case of a 2D system, such as an ultra-thin multilayer on a substrate, the dispersion of the frequencies (ω) of the optical modes with the wavevector (k) encodes information on the directionality and the dimensionality of the correlation length: the dispersion in the direction perpendicular to the substrate probes the correlation between layers (inter-layer), whereas the correlation within the layers (intra-layer) are probed in the two main directions parallel to the substrate.
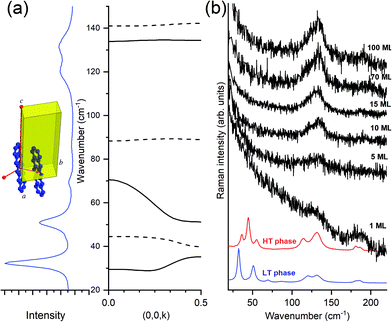
The Fig. 7, panel (a) indicates the correspondence between the experimental optical lattice phonons of the pentacene LT phase and those calculated, revealing that not all six Raman-active phonons show the same dispersion with the wavevector k parallel to c, with a general trend that the high wavenumber modes are virtually dispersionless, whereas the lower modes show a certain degree of dispersion. By looking at the spectra of the deposited films (TF phase), in panel (b) of the figure, we observe that only the high wavenumber dispersionless modes are those which survive, starting from one single ML and getting stronger upon increasing coverage. At the same time, no detection of a low wavenumber in more dispersed modes is observed at any coverage.
This makes sense because, as previously indicated, larger dispersion corresponds with larger interaction. Intra-layer molecular interactions are more important than the inter-layer ones, implying that modes weakly affected by interactions between layers will exhibit negligible dispersion and will show largely a 2D character. The opposite is true for low wavenumber modes which, showing larger dispersion, are sensitive to inter-layer interactions and will, consequently, have mostly a 3D character.
More information can be drawn by considering the structure of the layer-by-layer growth of the films of pentacene. In fact, the accurate method of deposition from vapor80 and the more sophisticated growth by SuMBD (Supersonic Molecular Beam Deposition)81 both show a high degree of lateral order, up to a coverage of several tens of ML. However, the inter-layer correlation is low, as shown by the lack of intensity of the three lowest frequency phonons. We believe that the experiments follow the expectations of the effect of the optical lattice phonons, and their dispersion, in producing the transition from a 3D to a 2D regime of pentacene: the loss of correlation among planes perpendicular to the substrate produces, as a consequence, the washing away of the highly dispersed modes. In other words, in a 2D model system the quasi-dispersionless modes will be the only ones surviving in the lattice phonon spectra. This is the experimental evidence of the close relationship between the dispersion of modes and lowering of the dimensionality. The equivalent for the electronic excitation (excitons) of a molecular crystal is the early example of a quasi-1D crystal of an anthracene derivative (9-cyano-anthracene), where a strong negative dispersion in the direction of the stack axis was calculated, contrary to the two perpendicular k vectors.82
From the point of view of the selection rules of the optical excitations in a 3D molecular crystal, the matching of photon and phonon (or exciton) momentum implies k ≈ 0.58 This obviously corresponds to all crystal cells moving in phase in all directions. When the dimensionality lowers from 3D to 2D, the phase matching is lost in one direction, as though, along that particular k, the selection rule of k = 0 is released. The unit cells do not move any longer in phase along that direction and this corresponds to what previously has been indicated as dimensional disorder. Spectroscopically this implies that all phonons in the branch become optically active, with the intensity smeared over the range of frequencies. The extreme band broadening yields to the “disappearance” of phonons in Fig. 7(b) when passing from the bulk crystal to the thin or ultrathin films, down to a single ML. The evidence of some phonons disappearing in 2D films becomes therefore a sort of rule of thumb to hint at the lowering of the dimensionality in the system.
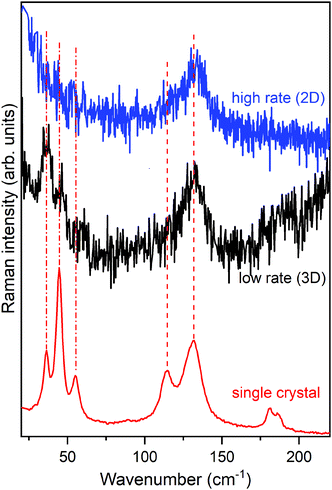
Fig. 8 shows the lattice phonon spectra of two films of pentacene deposited on a SiOx substrate at two different deposition rates: 2 nm min−1 (high rate) and 0.13 nm min−1 (low rate), respectively. The reference spectrum of the HT phase, the first bulk form to appear during the growing process,72,77,80,83 is reported at the bottom, for comparison. Full details of the experiment can be found in the literature.80 Remarkably, whereas the low rate spectrum shows the complete phonon spectrum, in the high rate specimen the low wavenumber structure is completely lost. By comparing film and single crystal phonon profiles and following the interpretation previously given, we ascertain that the low rate of growth leads to a 3D regime, opposite to the 2D regime revealed by the high rate film. Thus, the experimental growth conditions of the multilayer architecture not only strongly influence the geometry of the sample but, more importantly, determine the structure and the dynamical and transport properties of the film.
Indeed, a very recent paper that appeared in the literature has thoroughly studied the effect of film crystallinity and morphology on the charge carrier mobility in thin film transistors of pentacene.84 A good hole mobility is indeed obtained once the film is deposited at a high rate, an observation that fully agrees with our view of the actual formation of a 2D film with a corresponding low inter-layer correlation close to the dielectric interface, where charge transport is more efficient.64,65 It is quite sensible that the disorder introduced in the layer-by-layer growth at the higher rate produces a slight loss of correlation among the various MLs, sufficient to disrupt the phase matching in the direction perpendicular to the substrate. On the contrary, at a low rate the film has the time to organize with a perfect periodicity in all dimensions, increasing its crystallinity and moving to a 3D scenario, with an ordered structure with stronger inter-layer interactions perpendicular to the substrate.
In view of these observations, we should reconsider the concept of “thickness” of a film, independently of the actual coverage on the substrate. There is no doubt that, from a geometrical point of view, it is expressed by the amount of coverage in the vertical direction (nominal thickness). However, it is also necessary to explain why the same thickness of two pentacene films (Fig. 8) yields two different profiles of the optical scattering of phonons. We reckon that when we perform a spectroscopic experiment we need to consider the film thickness not simply as a morphological parameter related to its coverage, but rather as “the length of correlation” among layers, suitable to keep a periodic propagation of the excitation (phase matching) among the different MLs. When this correlation is partially lost, due to peculiar preparation conditions, the effective thickness is correspondingly lowered. A related example is that of α-sexythiophene (T6) which shows that the molecular structure of the individual layers is not homogeneous in the first few layers close to the substrate. The molecules, initially oriented perpendicularly to the substrate, slightly bend by increasing coverage, up to reaching the single crystal structure after further coverage.85 Strictly speaking, the periodic correlation among layers cannot correspond to the nominal thickness of the film.
To summarize, in this section we have shown how THz Raman spectroscopy can be fruitfully used to test the dimensionality of the pentacene films grown by vapor sublimation under different conditions. And since it has been shown that 2D films have a better performance than 3D ones,62 it will be interesting to test the method on other OSCs like thiophenes. We have to add that the dispersion curves in Fig. 7 have been calculated through atom–atom semiempirical methods, which are know to work well for hydrocarbons, less well when the molecules contain S or F atoms. On the other hand, a first principle DFT protocol has been recently devised able to reproduce the k = 0 frequencies and Raman intensities of the lattice modes of several molecular crystals.86,87 It will be then worthwhile, although computationally demanding, to calculate the dispersion curves for other structures of interest in the present context, starting from pentacene.
4 Conclusions
The sensitivity of THz Raman scattering to the packing motif of organic molecular materials has already provided extensive information on their structure and dynamics. The analysis, in many aspects complementary to XRD, has been so far mainly based on band frequency and intensity. In this paper we have presented examples of possible developments of the technique through the use of polarized light and a careful analysis of the bandshapes, and of the temperature and exciting light dependence.The combination of temperature and exciting light dependence that has been used to investigate two quasi-1D CT crystals, M2P-TCNQ40 and TMB-TCNQF4,41 has put in evidence the different weight of the dynamical and static disorder in the two cases. In both the crystals a remarkable temperature dependent band broadening along the 1D stack has been observed. However, in M2P-TCNQ the band broadening is mostly dynamic, or thermal, since it is associated with the strong anharmonicity due to electron–lattice phonon coupling, as evidenced by the remarkable frequency softening by increasing T (panel (b) of Fig. 2) and intensity enhancement in approaching the CT transition (left panel of Fig. 3). Thus, the relative intensities of the involved bands yield an estimate of the relative values of e–lph coupling constants. For TMB-TCNQF4 the effects of e–lph coupling are not remarkable, so the band broadening has been interpreted as due to static or displacement disorder along the stack, as suggested by the other physical measurements performed on the crystal.41 As a matter of fact disorder is a complex issue, ubiquitous to all the materials, though to a different extent. Displacement disorder may strongly affect the physical properties of the system, whereas thermal disorder is always present. Further experiments, also on different systems, coupled to other structural and theoretical analysis, are needed to investigate if THz Raman can offer more quantitative clues about the relative contributions of the two types of disorder, as has been proposed for XRD.55
It is well known that disordered, or amorphous, solids lacking long-range order do not exhibit a definite lattice phonon pattern. This fact has been used to investigate disorder to order phase transitions, and can provide particularly detailed information in the peculiar cases where only part of the long range order is lost, as in globular crystals like adamantanes.88 Here we have instead focused on 2D layered materials which, at variance with conventional bulk 3D materials, exhibit extraordinary physical properties owing to the reduced dimensionality.62 This is important in organic electronics, where charge transport occurs in a semiconductor thin film deposited on a substrate. Film growth on a substrate is subjected to a number of parameters which can strongly reduce its effective correlation thickness. The example of pentacene demonstrates that the same film thickness, but a different deposition rate, may yield to non-identical layer organizations, leading to sizable effects not only in the structure but also in the dynamics of the film.80,81 For the latter case the outcome is to produce distinct patterns in the optical lattice phonon spectra, which experimentally show up in a THz Raman experiment. The disappearance in the spectra of the bands related to a strongly dispersed mode may indeed reveal to be a simple way to spot the 2D behaviour of a multilayer structure.
Author contributions
All the three authors contributed equally to the conceptualization and writing of the paper.Conflicts of interest
There are no conflicts to declare.Acknowledgements
A. G. thanks Prof. Anna Painelli and Gabriele D'Avino for useful discussion and clarifications.Notes and references
- M. Mas-Torrent and C. Rovira, Chem. Soc. Rev., 2008, 37, 827 RSC.
- M. Mas-Torrent and C. Rovira, Chem. Rev., 2011, 111, 4833–4856 CrossRef CAS PubMed.
- Y. Wang, L. Sun, C. Wang, F. Yang, X. Ren, X. Zhang, H. Dong and W. Hu, Chem. Soc. Rev., 2019, 48, 1492–1530 RSC.
- S.-J. Zou, Y. Shen, F.-M. Xie, J.-D. Chen, Y.-Q. Li and J.-X. Tang, Mater. Chem. Front., 2020, 4, 788–820 RSC.
- L. Duan and A. Uddin, Adv. Sci., 2020, 7, 1903259 CrossRef CAS PubMed.
- M. Mas-Torrent, N. Crivillers, C. Rovira and J. Veciana, Chem. Rev., 2011, 112, 2506–2527 CrossRef PubMed.
- J. Bernstein, Polymorphism in Molecular Crystals, International Union of Crystallography, 2002 Search PubMed.
- D. Gentili, M. Gazzano, M. Melucci, D. Jonesb and M. Cavallini, Chem. Soc. Rev., 2019, 48, 2502 RSC.
- H. Chung and Y. Diao, J. Mater. Chem. C, 2016, 4, 3915 RSC.
- T. Salzillo, A. Campos, A. Babuji, R. Santiago, S. T. Bromley, C. Ocal, E. Barrena, R. Jouclas, C. Ruzie, G. Schweicher, Y. H. Geerts and M. Mas-Torrent, Adv. Funct. Mater., 2020, 30, 2006115 CrossRef CAS.
- E. P. Parrott and J. A. Zeitler, Appl. Spectrosc., 2015, 69, 1–25 CrossRef CAS PubMed.
- D. B. Menezes, A. Reyer, A. Yüksel, B. B. Oliveira and M. Musso, Spectrosc. Lett., 2018, 51, 438–445 CrossRef.
- A. Brillante, I. Bilotti, R. G. Della Valle, E. Venuti and A. Girlando, CrystEngComm, 2008, 10, 937–946 RSC.
- A. Brillante, I. Bilotti, R. G. Della Valle, E. Venuti, M. Masino and A. Girlando, Adv. Mater., 2005, 17, 2549–2553 CrossRef CAS.
- A. Brillante, I. Bilotti, R. G. D. Valle, E. Venuti, S. Milita, C. Dionigi, F. Borgatti, A. N. Lazar, F. Biscarini, M. Mas-Torrent, N. S. Oxtoby, N. Crivillers, J. Veciana, C. Rovira, M. Leufgen, G. Schmidt and L. W. Molenkamp, CrystEngComm, 2008, 10, 1899 RSC.
- A. Brillante, I. Bilotti, R. G. D. Valle, E. Venuti, M. Mas-Torrent, C. Rovira and Y. Yamashita, Chem. Phys. Lett., 2012, 523, 74–77 CrossRef CAS.
- A. Brillante, R. Della Valle, L. Farina, A. Girlando, M. Masino and E. Venuti, Chem. Phys. Lett., 2002, 357, 32–36 CrossRef CAS.
- E. Venuti, R. G. Della Valle, L. Farina, A. Brillante, M. Masino and A. Girlando, Phys. Rev. B: Condens. Matter Mater. Phys., 2004, 70, 1–8 CrossRef.
- E. Venuti, I. Bilotti, R. G. Della Valle, A. Brillante, P. Ranzieri, M. Masino and A. Girlando, J. Phys. Chem. C, 2008, 112, 17416–17422 CrossRef CAS.
- P. Ranzieri, A. Girlando, S. Tavazzi, M. Campione, L. Raimondo, I. Bilotti, A. Brillante, R. G. Della Valle and E. Venuti, ChemPhysChem, 2009, 10, 657–663 CrossRef CAS PubMed.
- A. Girlando, L. Grisanti, M. Masino, I. Bilotti, A. Brillante, R. G. Della Valle and E. Venuti, Phys. Rev. B: Condens. Matter Mater. Phys., 2010, 82, 1–8 CrossRef.
- A. Girlando, L. Grisanti, M. Masino, A. Brillante, R. G. D. Valle and E. Venuti, J. Chem. Phys., 2011, 135, 084701 CrossRef PubMed.
- A. Y. Sosorev, I. Y. Chernyshov, D. Y. Paraschuk and M. V. Vener, in Intra- and Intermolecular Vibrations of Organic Semiconductors and Their Role in Charge Transport, ed. Y. Ozaki, M. J. Wójcik and J. Popp, Wiley-VCH Verlag GmbH, 2019, ch. 15, pp. 425–458 Search PubMed.
- R. S. Sànchez-Carrera, P. Paramonov, G. M. Day, V. Coropceanu and J.-L. Brédas, J. Am. Chem. Soc., 2010, 132, 14437–14446 CrossRef PubMed.
- A. Troisi, Chem. Soc. Rev., 2011, 40, 2347 RSC.
- S. Fratini, D. Mayou and S. Ciuchi, Adv. Funct. Mater., 2016, 26, 2292–2315 CrossRef CAS.
- G. Schweicher, G. D'Avino, M. T. Ruggiero, D. J. Harkin, K. Broch, D. Venkateshvaran, G. Liu, A. Richard, C. Ruzié, J. Armstrong, A. R. Kennedy, K. Shankland, K. Takimiya, Y. H. Geerts, J. A. Zeitler, S. Fratini and H. Sirringhaus, Adv. Mater., 2019, 31, 1902407 CrossRef CAS PubMed.
- J. M. Ziman, Models of Disorder, Cambridge University Press, 1979 Search PubMed.
- A. Guinier, X-Ray Diffraction in Crystals, Imperfect Crystals, and Amorphous bodies, W.H. Freeman and Co., 1963 Search PubMed.
- T. Holstein, Ann. Phys., 1959, 8, 343–389 CAS.
- M. E. Gershenson, V. Podzorov and A. F. Morpurgo, Rev. Mod. Phys., 2006, 78, 973–989 CrossRef CAS.
- A. Troisi and D. L. Cheung, J. Chem. Phys., 2009, 131, 014703 CrossRef PubMed.
- V. Coropceanu, J. Cornil, D. A. da Silva Filho, Y. Olivier, R. Silbey and J.-L. Brédas, Chem. Rev., 2007, 107, 926–952 CrossRef CAS PubMed.
- V. Coropceanu, R. S. Sánchez-Carrera, P. Paramonov, G. M. Day and J.-L. Brédas, J. Phys. Chem. C, 2009, 113, 4679–4686 CrossRef CAS.
- R. C. Hatch, D. L. Huber and H. Höchst, Phys. Rev. Lett., 2010, 104, 047601 CrossRef PubMed.
- M. Masino, T. Salzillo, A. Brillante, R. G. D. Valle, E. Venuti and A. Girlando, Adv. Electron. Mater., 2020, 6, 2000208 CrossRef CAS.
- L. Sun, W. Zhu, F. Yang, B. Li, X. Ren, X. Zhang and W. Hu, Phys. Chem. Chem. Phys., 2018, 20, 6009–6023 RSC.
- L. Sun, Y. Wang, F. Yang, X. Zhang and W. Hu, Adv. Mater., 2019, 31, 1902328 CrossRef PubMed.
- W. Wang, L. Luo, P. Sheng, J. Zhang and Q. Zhang, Chem. – Eur. J., 2020, 27, 464–490 CrossRef PubMed.
- J. K. H. Fischer, G. D'Avino, M. Masino, F. Mezzadri, P. Lunkenheimer, Z. G. Soos and A. Girlando, Phys. Rev. B, 2021, 103, 115104 CrossRef CAS.
- S. Canossa, E. Ferrari, P. Sippel, J. K. H. Fischer, R. Pfattner, R. Frison, M. Masino, M. Mas-Torrent, P. Lunkenheimer, C. Rovira and A. Girlando, Tetramethylbenzidine-TetrafluoroTCNQ: A narrow-gap semiconducting salt with room temperature relaxor ferroelectric behavior, 2021, arXiv:2104.04454 Search PubMed.
- J. Tang and A. C. Albrecht, Developments in the Theories of Vibrational Raman Intensities, Springer US, 1970, pp. 33–68 Search PubMed.
- S.-Y. Lee and E. J. Heller, J. Chem. Phys., 1979, 71, 4777 CrossRef CAS.
- A. B. Myers, Chem. Rev., 1996, 96, 911–926 CrossRef CAS PubMed.
- F. Delchiaro, A. Girlando, A. Painelli, A. Bandyopadhyay, S. K. Pati and G. D'Avino, Phys. Rev. B, 2017, 95, 155125 CrossRef.
- C. Pecile, A. Painelli and A. Girlando, Mol. Cryst. Liq. Cryst. Incorporating Nonlinear Opt., 1989, 171, 69–87 CrossRef.
- A. Cairns and A. L. Goodwin, Chem. Soc. Rev., 2013, 42, 4881–4893 RSC.
- N. Castagnetti, M. Masino, C. Rizzoli, A. Girlando and C. Rovira, Phys. Rev. Mater., 2018, 2, 115104 Search PubMed.
- A. Girlando, A. Painelli and C. Pecile, Mol. Cryst. Liq. Cryst., 1984, 112, 325–343 CrossRef CAS.
- A. Girlando, A. Painelli and C. Pecile, J. Chem. Phys., 1988, 89, 494–503 CrossRef CAS.
- S. A. Bewick, R. A. Pascal, D. M. Ho, Z. G. Soos, M. Masino and A. Girlando, J. Chem. Phys., 2005, 122, 1–8 CrossRef PubMed.
- M. Kumar, B. J. Topham, R. Yu, Q. B. D. Ha and Z. G. Soos, J. Chem. Phys., 2011, 134, 234304 CrossRef PubMed.
- T. R. Welberry and B. D. Butler, Chem. Rev., 1995, 95, 2369–2403 CrossRef CAS.
- S. Ravy, P. Launois, R. Moret and J.-P. Pouget, Z. Kristallogr. – Cryst. Mater., 2005, 220, 1059–1065 CrossRef CAS.
- H. B. Bürgi and S. C. Capelli, Acta Crystallogr., Sect. A: Found. Crystallogr., 2000, 56, 403–412 CrossRef PubMed.
- P. Pincus, in Basic Principles and Concepts in the Physics of Low Dimensional Cooperative Systems, ed. H. J. Keller, Springer US, 1975, vol. 7, ch. 1 Search PubMed.
- A. J. Heeger, S. Kivelson, J. R. Schrieffer and W. P. Su, Rev. Mod. Phys., 1988, 60, 781–850 CrossRef CAS.
- G. Turrell, Infrared and Raman Spectra of Crystals, Academic Press, 1972 Search PubMed.
- M. A. Krivoglaz, X-Ray and Neutron Diffraction in Nonideal Crystals, Springer Berlin Heidelberg, 1996 Search PubMed.
- S. Elliot, The Physics and Chemistry of Solids, John Wiley & Sons Ltd, 1998 Search PubMed.
- M. Dressel and S. Tomić, Adv. Phys., 2020, 69, 1–120 CrossRef.
- Y. Cho, J. Huang and C. W. Wong, Appl. Phys. Lett., 2020, 116, 020501 CrossRef CAS.
- Y. Fan, J. Liu, W. Hu, Y. Liu and L. Jiang, J. Mater. Chem. C, 2020, 8, 13154–13168 RSC.
- F. Dinelli, M. Murgia, P. Levy, M. Cavallini, F. Biscarini and D. M. de Leeuw, Phys. Rev. Lett., 2004, 92, 116802 CrossRef PubMed.
- A. Shehu, S. Quiroga, P. DAngelo, C. Albonetti, F. Borgatti, M. Murgia, A. Scorzoni, P. Stoliar and F. Biscarini, Phys. Rev. Lett., 2010, 104, 246602 CrossRef PubMed.
- U. A. Lutz and W. Halg, Solid State Commun., 1970, 8, 165–166 CrossRef CAS.
- B. Dorner, E. F. Bokhenkov, E. L. Sheka, S. L. Chaplot, G. S. Pawley, J. Kalus, U. Schmelzer and I. Natkaniec, J. Phys., Colloq., 1981, 42, C6 Search PubMed.
- R. B. Campbell, J. M. Roberston and J. Trotter, Acta Crystallogr., 1962, 15, 289–290 CrossRef CAS.
- D. Holmes, S. Kumaraswamy, A. J. Matzger and K. P. Vollhardt, Chem. – Eur. J., 1999, 5, 3399–3412 CrossRef CAS.
- C. C. Mattheus, A. B. Dros, J. Baas, A. Meetsma, J. L. de Boer and T. T. M. Palstra, Acta Crystallogr., Sect. C: Struct. Chem., 2001, 57, 939–941 CrossRef CAS PubMed.
- T. Siegrist, C. Besnard, S. Haas, M. Schiltz, P. Pattison, D. Chernyshov, B. Batlogg and C. Kloc, Adv. Mater., 2007, 19, 2079–2082 CrossRef CAS.
- I. P. M. Bouchoms, W. A. Schoonveld, J. Vrijmoeth and T. M. Klapwijk, Synth. Met., 1999, 104, 175–178 CrossRef CAS.
- C. C. Mattheus, A. B. Dros, J. Baas, G. T. Ostergetel, A. Meetsma, J. L. de Boer and T. T. M. Palstra, Synth. Met., 2003, 138, 475–481 CrossRef CAS.
- E. S. Fritz, S. M. Martin, C. D. Frisbie, M. D. Ward and M. F. Toney, J. Am. Chem. Soc., 2004, 126, 4084–4085 CrossRef PubMed.
- R. Ruiz, D. Choudhary, B. Nickel, T. Toccoli, K. C. Chang, A. C. Mayer, P. Clancy, J. M. Blakely, R. L. Headrick, S. Iannotta and G. G. Malliaras, Chem. Mater., 2004, 23, 4497–4508 CrossRef.
- S. Schiefer, M. Huth, A. Dobrinevski and B. Nickel, J. Am. Chem. Soc., 2007, 129, 10316–10317 CrossRef CAS PubMed.
- H. Yoshida, K. Inaba and N. Sato, Appl. Phys. Lett., 2007, 90, 181930 CrossRef.
- D. Nabok, P. Puschnig, C. Ambrosch-Draxl, O. Werzer, R. Resel and D. M. Smilgies, Phys. Rev. B: Condens. Matter Mater. Phys., 2007, 76, 235322 CrossRef.
- L. Farina, A. A. Brillante, R. G. Della Valle, E. Venuti, M. Amboage and K. Syassen, Chem. Phys. Lett., 2003, 375, 490–494 CrossRef CAS.
- A. Brillante, I. Bilotti, R. G. Della Valle, E. Venuti, A. Girlando, M. Masino, F. Liscio, S. Milita, C. Albonetti, P. D'angelo, A. Shehu and F. Biscarini, Phys. Rev. B: Condens. Matter Mater. Phys., 2012, 85, 195308 CrossRef.
- A. Girlando, M. Masino, A. Brillante, T. Toccoli and S. Iannotta, Crystals, 2016, 6, 41 CrossRef.
- A. Brillante, M. R. Philpott and D. W. Schlosser, J. Chem. Phys., 1979, 71, 1050–1057 CrossRef CAS.
- S. Pachmajer, O. Werzer, C. Mennucci, F. Buatier and R. Resel, J. Cryst. Growth, 2019, 519, 69–76 CrossRef CAS.
- S. Jena and D. Ray, J. Phys. D: Appl. Phys., 2020, 54, 015104 CrossRef.
- J. F. Moulin, F. Dinelli, M. Massi, C. Albonetti, R. Kshirsagar and F. Biscarini, Nucl. Instrum. Methods Phys. Res., Sect. B, 2006, 246, 122–126 CrossRef CAS.
- N. Bedoya-Martínez, B. Schrode, A. O. F. Jones, T. Salzillo, C. Ruzié, N. Demitri, Y. H. Geerts, E. Venuti, R. G. D. Valle, E. Zojer and R. Resel, J. Phys. Chem. Lett., 2017, 8, 3690–3695 CrossRef PubMed.
- T. Salzillo, A. Giunchi, M. Masino, N. Bedoya-Martinez, R. G. Della Valle, A. Brillante, A. Girlando and E. Venuti, Cryst. Growth Des., 2018, 18, 4869–4873 CrossRef CAS.
- T. Salzillo, A. Girlando and A. Brillante, J. Phys. Chem. C, 2021, 125, 7384–7391 CrossRef CAS.
| This journal is © The Royal Society of Chemistry 2021 |


