 Open Access Article
A nano interlayer spacing and rich defect 1T-MoS2 as cathode for superior performance aqueous zinc-ion batteries†
Chengyan
Cai‡
,
Zengren
Tao‡
 ,
Yuanfei
Zhu
 ,
Yuanming
Tan
,
Anding
Wang
,
Haiyun
Zhou
* and
Yangyi
Yang
,
Yuanming
Tan
,
Anding
Wang
,
Haiyun
Zhou
* and
Yangyi
Yang
 *
*
School of Materials Science and Engineering, Sun Yat-sen University Test Center, Sun Yat-sen University, Guangzhou, 510275, China. E-mail: zhouhy@mail.sysu.edu.cn; cesyyy@mail.sysu.edu.cn
First published on 10th May 2021
Abstract
Aqueous Zn-ion batteries (ZIBs) are considered very promising alternatives to lithium-ion batteries. However, the low reversibility and slow diffusion of zinc ions in the positive electrode limit their commercial applications. Herein, we successfully prepared the metallic 1T phase of MoS2 (1T-MoS2) with a nano interlayer spacing of 1.025 nm through a simple one-step hydrothermal method, and used it as a cathode in ZIBs. By adjusting the hydrothermal temperature, the crystallinity and Zn2+ storage capacity of MoS2 as a cathode for ZIBs are effectively improved. MoS2 had the most favorable structure when the hydrothermal temperature was 200 °C, such as larger layer spacing and more lattice distortion. When employed as a cathode, 200-MoS2 exhibited a considerable specific capacity of 125 mA h g−1 at the current density of 2 A g−1 and high capacity retention of 100% after 500 cycles. This strategy provides a new option for improving the performance of the layered structure as an aqueous zinc ion battery.
1 Introduction
With environmental pollution, global warming, and continuous consumption of non-renewable energy sources such as coal and oil, human society has increasingly urgent requirements for the development of new energy sources.1–4 The search for new energy sources and the development of new energy devices have become the subject of interest for researchers from all over the world.5,6 It is essential to design new renewable storage materials with high energy density, environmental friendliness, safety and cost-effectiveness.7–9In the past decades, lithium-ion batteries (LIBs) have been widely studied because of their high energy density and have almost dominated the application of secondary batteries.10–12 However, the development of lithium-ion batteries is greatly limited owing to the scarcity of lithium resources, high price, and flammable and explosive nature of organic electrolytes. In these respects, rechargeable multivalent ion batteries based on Zn2+,13–15 Mg2+ (ref. 16) and Al3+ (ref. 17) are regarded as promising alternatives to LIBs. Owing to the unique properties of Zn, including the high natural abundance, low price, high theoretical capacity (gravimetric capacity of 820 mA h g−1 and volumetric capacity of 5855 mA h cm−3), and relatively low redox potential (−0.763 V),18–21 Zn-ion batteries (ZIBs) are deemed to have high application value and development prospects in large-scale energy storage.22–24 Nevertheless, with the large electrostatic repulsion of zinc ions, it is difficult to achieve reversible intercalation of zinc materials, resulting in the availability of few cathode materials for ZIBs.25,26 Therefore, it is very important to find high performance cathode materials for the development and application of zinc ion batteries.
At present, many types of intercalated cathodes have been explored, such as manganese-based27,28 and vanadium-based29,30 ones, Prussian blue derivatives,31 polyanionic compounds,32 chevrel phase compounds,33 organic cathode materials and others.34,35 Among all ZIBs, manganese shows high operating voltage and better rate performance. Unluckily, due to the Jahn–Teller effect during the intercalation of zinc ions in the phase transition process, Mn2+ dissolves during the cycle, so the cycle life of the manganese oxide cathode is limited. Vanadium-based cathodes have high rate performance and long cycle life. However, the average working voltage in the aqueous solution is only about 0.8 V, which severely restricts its practical application. Prussian blue analogues (PBAs) can support an average working voltage of up to 1.5 V, but have a low specific capacity (50–80 mA h g−1) and poor cycle life. In this regard, we had recently made efforts to develop high performance cathode materials. Specifically, introducing Fe(CN)64− into the positive electrode of a quasi-solid zinc-ion battery greatly improves the rate performance and cycle stability of the electrode.36 What's more, an easy one-step liquid co-precipitation method is used to introduce heteroatoms (La3+, Ca2+), which significantly improves the stability of ε-MnO, thereby increasing the capacity of zinc-ion batteries.37
Molybdenum disulfide (MoS2), a typical transition metal layered binary compound, is widely used in the fields of reaction catalysis and electrode materials.38,39 Significantly, MoS2 has two common phases:40,41 metal 1T-MoS2 and semiconductor 2H–MoS2. In the 2H phase, each Mo center is prismatically coordinated by six surrounding S atoms, while in the 1T phase, the Mo atoms are coordinated by six adjacent S atoms in an octahedron.42 Compared with the semiconducting 2H phase, the metal 1T phase has a completely different electronic structure, because of its reduced charge transfer resistance, unique metal electronic characteristics and greater interlayer distance, so it has higher chemical activity.43,44 Besides, the Zn2+ diffusion barrier of 1T phase MoS2 is much lower than that of its 2H phase.45 Therefore, 1T-MoS2 as a cathode material for zinc-ion batteries may manifest superior specific capacity and decent cycle performance. Most of the reports on MoS2 as a ZIB cathode use modification strategies (such as interlayer engineering, defect engineering) to enhance Zn2+ storage. For instance, Liang et al. converted inactive MoS2 into an effective Zn2+ storage material by tuning the intercalation energy.46 Impressively, the activated MoS2 can achieve high capacity, which is a 10-fold increase in capacity over the unmodified counterpart. Xu et al. reported the preparation of defect-rich MoS2 by a hydrothermal method and subsequent heat treatment.47 The interlayer spacing of defect-rich MoS2 accelerated the diffusion kinetics of Zn2+ to the active center. However, the MoS2 layer spacing obtained by the above strategy is less than 0.7 nm, which greatly affects the storage capacity of zinc ions. In addition, the preparation method is relatively complicated and requires subsequent processing. Therefore, it is very meaningful to produce 1T-MoS2 with enlarged interlayer spacing through a simple method.
In this research, we present a high specific capacity Zn–MoS2 cell based on a flower-like 1T-MoS2 cathode. The 1T-MoS2 with nano-sized layer spacing was prepared via a facile hydrothermal reaction, and used as a cathode in ZIBs. The hydrothermal temperature was varied (160, 180, 200 and 220 °C) to obtain 1T-MoS2 with different crystallinities. We also systematically explored their properties as cathode materials for rechargeable ZIBs. The results showed that 200-MoS2 has a large interlayer spacing of 1.025 nm and a flower-like nanosphere (∼500 nm) architecture. The unique structure greatly shortens the zinc ion diffusion distance and enlarges the space for zinc ion intercalation. In addition, the higher lattice distortion in 200-MoS2 resulted in significant activity for the insertion/extraction of Zn2+ ions. 200-MoS2 cathode displayed excellent specific capacity and decent long-term cycle stability. Especially, the capacity of 200-MoS2 was as high as 125 mA h g−1 at a current density of 2 A g−1, and the capacity retention rate was 100% after 500 cycles.
2 Materials and methods
2.1 Synthesis of MoS2
MoS2 was prepared by a typical hydrothermal method with slight modifications.48 First, 0.151 g (2 mmol) thiocetamide (TAA, AR), 0.242 g (1 mmol) sodium molybdate (Na2MoO4, AR) and 0.05 g (0.14 mmol) cetyltrimethyl ammonium bromide (CTAB, AR) were dissolved in 20 mL DI water, and then magnetically stirred for 10 minutes, until completely dissolved to obtain a uniform solution. The homogeneous solution was transferred to a 50 mL polytetrafluoroethylene autoclave and kept at a certain temperature for 24 hours. After the autoclave cooled to room temperature, the product was washed three times with deionized water and absolute ethanol. For convenience, the obtained products (at 160/180/200/220 °C) are denoted as 160-MoS2, 180-MoS2, 200-MoS2 and 220-MoS2, respectively. They were further characterized and used as battery cathode materials after drying for 12 hours in an oven at 60 °C.2.2 Electrochemical characterization
The prepared molybdenum disulfide (MoS2), Ketjen black (KB) and polyvinylidene fluoride (PVDF) were mixed and ground in a weight ratio of 7![[thin space (1/6-em)]](https://www.rsc.org/images/entities/char_2009.gif) :
:![[thin space (1/6-em)]](https://www.rsc.org/images/entities/char_2009.gif) 2
2![[thin space (1/6-em)]](https://www.rsc.org/images/entities/char_2009.gif) :
:![[thin space (1/6-em)]](https://www.rsc.org/images/entities/char_2009.gif) 1, and then a certain amount of N-methyl-2-pyrrolidone (NMP) was added, and then ground for a certain period of time until a uniform slurry was obtained. On this basis, the slurry was evenly coated on a stainless steel foil current collector and dried in an oven at 60 °C for 12 hours. Finally, the stainless steel foil was cut into Φ 10 mm electrodes, and 1.0–2.0 mg of active material was loaded. The prepared stainless steel foil was used as the cathode and the zinc foil was used as the anode. Medium-speed qualitative filter paper was used as the separator. According to the reported research,49–51 a 3 M Zn(CF3SO3)2 aqueous solution was used as the electrolyte. The CR 2025 coin cell was prepared in an air atmosphere, and the electrochemical performance was evaluated with the Neware battery test system. The cyclic voltammogram (CV) was evaluated with a CHI 760E electrochemical workstation. All tests were performed at room temperature.
1, and then a certain amount of N-methyl-2-pyrrolidone (NMP) was added, and then ground for a certain period of time until a uniform slurry was obtained. On this basis, the slurry was evenly coated on a stainless steel foil current collector and dried in an oven at 60 °C for 12 hours. Finally, the stainless steel foil was cut into Φ 10 mm electrodes, and 1.0–2.0 mg of active material was loaded. The prepared stainless steel foil was used as the cathode and the zinc foil was used as the anode. Medium-speed qualitative filter paper was used as the separator. According to the reported research,49–51 a 3 M Zn(CF3SO3)2 aqueous solution was used as the electrolyte. The CR 2025 coin cell was prepared in an air atmosphere, and the electrochemical performance was evaluated with the Neware battery test system. The cyclic voltammogram (CV) was evaluated with a CHI 760E electrochemical workstation. All tests were performed at room temperature.
2.3 Material characterization
The crystallographic structure of the samples was determined by X-ray diffraction (XRD, D8 ADVANCE) measurement with Cu Kα radiation (λ = 1.5405 Å) in the 2θ range from 5° to 70° with a scanning rate of 10° min−1. The morphology and structural characteristics of the samples were observed with a cold field emission scanning electron microscope (FESEM, Hitachi Regulus 8230) at an accelerating voltage of 10 kV, while the microstructure was investigated using a JEOL-2001FTEM. The chemical states of the products were studied by using an Axis Ultra X-ray photoelectron spectrometer (XPS, Kratos Analytical Ltd, UK) with Al Kα radiation (hv = 1486.6 eV). Raman spectra were obtained on an inVia Qontor, RENISHAW.3 Results and discussion
3.1 Structure and morphology
The illustration of the synthesis process of MoS2 is shown in Fig. 1a. Na2MoO4, TAA and CTAB were reacted under hydrothermal conditions to generate flower-like MoS2 assembled from nanosheets. First, the phase and structural characteristics of the prepared product were studied by X-ray diffraction (XRD). As shown in Fig. 1b, there is no obvious shift in the diffraction peak position. The (002) crystal plane and the second (004) diffraction peaks of the synthesized 200-MoS2 are located at 8.62° and 17.46°, respectively.52,53 According to the Bragg equation, the lattice spacing of the (002) crystal plane is calculated to be 1.025 nm. It showed that the synthesized MoS2 has a large layer spacing. The two diffraction peaks at 32.06° and 56.8° represent the (100) and (110) planes, respectively. According to previous reports,53 the prepared MoS2 is a metal 1T phase, and all samples show the characteristic diffraction peaks of 1T-MoS2. Obviously, the diffraction peak of 160-MoS2 is different from that of MoS2 obtained at other preparation temperatures, indicating that the synthesis failed (Fig. S1†). It is worth noting that when the synthesis temperature is 200 °C, the diffraction peak of the MoS2 (002) crystal plane is narrow and strong, indicating the highest crystallinity and the best purity.54 In addition, compared with 200-MoS2, the MoS2 diffraction peaks at other synthesis temperatures broadened significantly, indicating that the crystallinity is lower. This can be attributed to the kinetics of crystal nucleation; the crystallinity will be affected if the temperature is too high or too low. Fig. 1c depicts the Raman spectra of samples excited using a 532 nm laser line at room temperature. Except for 160-MoS2, two distinct MoS2 characteristic vibration peaks can be observed in all the prepared samples, which correspond to the A1g and vibration modes of MoS2 crystals. The vibration mode is caused by the displacement of Mo and S atoms in the layer, and the A1g mode corresponds to the symmetrical displacement of S atoms outside the layer.55 The peak intensity is lower than that of the A1g peak, indicating that there are a certain number of crystal defects in the crystal structure. Interestingly, 200-MoS2 has the strongest Raman peak compared to samples at other preparation temperatures, indicating that MoS2 at this temperature has better crystallinity, which is consistent with the XRD results. Fig. S2† shows that there are three typical J1, J2 and J3 peaks at 198, 225, and 355 cm−1, which are related to the superlattice structure of 1T-MoS2, indicating that a pure 1T phase is formed in 200-MoS2.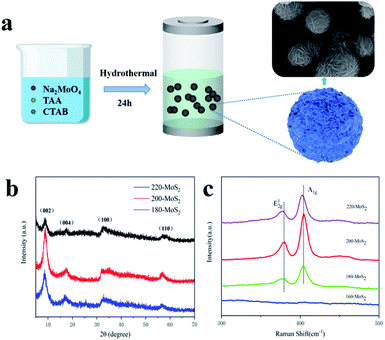 | ||
| Fig. 1 (a) Schematic illustration of the preparation process of MoS2, (b) XRD of MoS2 synthesized at different temperatures, (c) Raman spectra of MoS2 synthesized at different temperatures. | ||
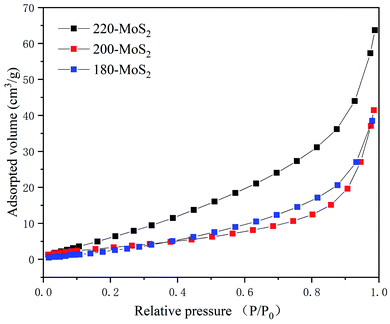
The overall morphologies and crystal phases of the as-prepared MoS2 are characterized using scanning electron microscopy (SEM). As shown in Fig. 2, except for 160-MoS2 (Fig. 2d and h), all the prepared samples have a flower-like structure of nanosheet-like accumulation. It is confirmed that MoS2 was not successfully synthesized when the synthesis temperature was low. Obviously, the morphology of MoS2 is a flower-like structure assembled from nanosheets of different sizes. While the temperature changes, the distance between nanosheets and the stacking method changes. In particular, 200-MoS2 is assembled from fewer irregular nanosheets and shows a loosely assembled structure (Fig. 2b and f). In 180/220-MoS2 (Fig. 2a, e, c and g), nanosheets become more aggregated. Hence, it can be easily inferred that 200-MoS2 has a more uniform and advantageous structure. The 200-MoS2 nano-flower-like structure is smaller in size and has a smoother and more uniform shape. More importantly, the distance between the interconnected nanosheet structures is relatively large, which may provide abundant locations for redox reactions and intercalation processes. Besides, the relatively small size should help shorten the Zn2+ diffusion length, so it can promote electrochemical reactions. In order to study the effect of different sizes of MoS2 specific surface area on the performance, we conducted a N2 adsorption test. The adsorption isotherms and pore size distributions of the three MoS2 samples are shown in Fig. 3. According to the national standard (GB/19587-2017), MoS2 at different temperatures showed similar type III adsorption isotherms. The results showed that the adsorption of MoS2 belongs to multi-layer adsorption, which is consistent with the microsphere structure assembled from nanosheets in the SEM image. The data in Table S1† show that the prepared MoS2 has a small specific surface area, but according to the pore volume–pore size distribution curve (Fig. S3†), it can be seen that 200-MoS2 has the most uniform mesoporous structure, indicating that it is beneficial to contact with the electrolyte. The high-resolution TEM (HRTEM) image clearly shows that the MoS2 nanosheets on the 200-MoS2 (Fig. 4b) surface arrange uniformly and resemble a spherical shape, while the 180/220-MoS2 (Fig. 4a and c) showed a more disorderly accumulation. In contrast, the lattice fringes of 200-MoS2 exhibited more significant long-range order, confirming the high crystallinity. The distance between the (002) crystal plane layers of MoS2 at different preparation temperatures changed slightly, which was consistent with the XRD results. In addition, the staggered distribution of stripes on the curled edge of 200-MoS2 allows more lattice distortion and atomic defects to be observed. This is also one of the important reasons for the high performance of the 200-MoS2 electrode. The magnified HRTEM image (Fig. 4d) clearly shows the atomic arrangement of the 1T phase and the crystal order of the triangular atomic scale, which further proves the existence of the 1T phase.
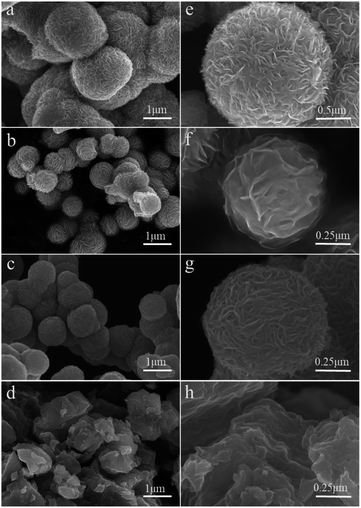 | ||
| Fig. 2 (a and e) SEM images of 220-MoS2, (b and f) SEM images of 200-MoS2, (c and g) SEM images of 180-MoS2, (d and h) SEM images of 160-MoS2. | ||
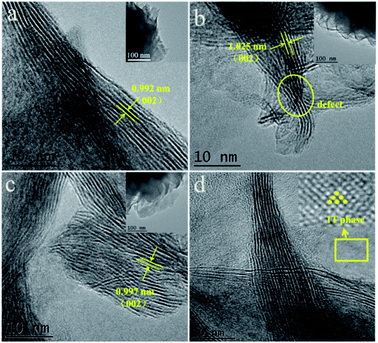 | ||
| Fig. 4 TEM images of (a) 220-MoS2, (b) 200-MoS2, (c) 180-MoS2, (d) HRTEM images of the in-plane 1T-MoS2. | ||
X-ray photoelectron spectroscopy (XPS) was further carried out to detect the chemical composition and valence states of the prepared samples (Fig. 5). The presence of Mo, S, C, N, and O was detected in the XPS spectrum (Fig. S5†). The peaks at 162.08 eV, 228.08 eV, and 285.08 eV correspond to S 2p, Mo 3d, and C 1s, respectively. As shown in Fig. 4b, the high-resolution spectrum of 200-MoS2 Mo 3d has two peaks at 231.53 and 228.38 eV, confirming the existence of Mo 3d3/2 and Mo 3d5/2.56 The XPS results of S 2p are shown in Fig. 4e. There are two peaks at 162.63 eV and 161.38 eV, which can be attributed to S 2p1/2 and S 2p3/2. The results of Mo 3d and S 2p spectra of MoS2 at different preparation temperatures show that 200-MoS2 has a lower binding energy, indicating that 200-MoS2 has high purity. The high binding energy of 180-MoS2 can be attributed to the higher valence of Mo, and the low temperature failed to completely reduce Mo6+. Table S2† lists the atomic contents and the ratios of S/Mo in MoS2 at different preparation temperatures. The S/Mo of 200-MoS2 is the smallest, 2.47 is the closest value to 2, so the MoS2 content is the highest, which is consistent with the XRD results.
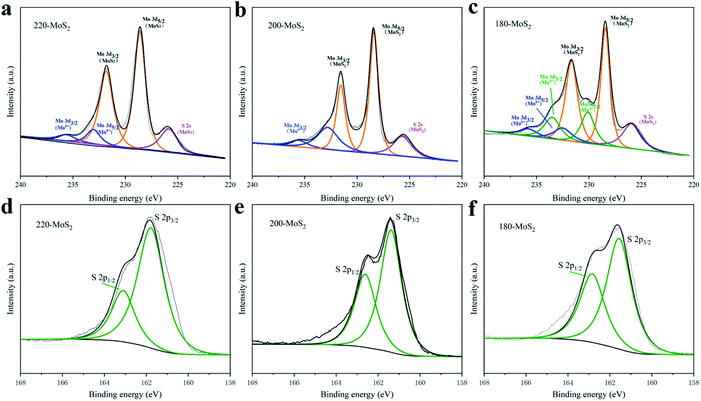 | ||
| Fig. 5 (a–c) Mo 3d and (d–f) S 2s high-resolution XPS spectra of MoS2 prepared at different temperatures. | ||
3.2 Electrochemical properties
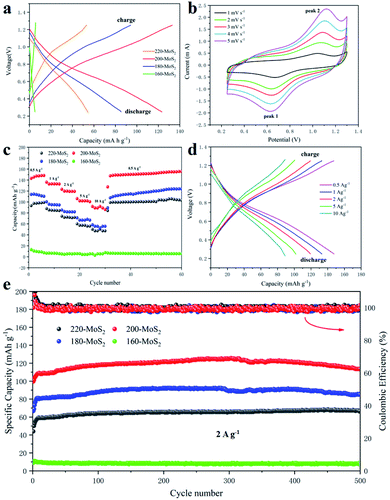
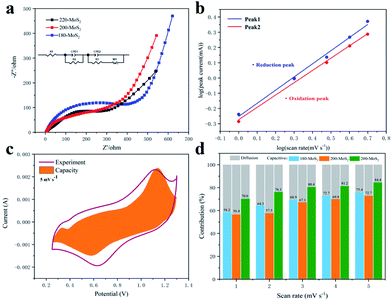
The electrochemical performance of the assembled CR 2025 coin cell was tested. In the voltage range of 0.25–1.3 V, when the current density is 2 A g−1, the galvanostatic charge/discharge curves of MoS2 prepared at different temperatures are shown in Fig. 6a. It can be seen that 200-MoS2 has the highest specific capacity of 123 mA h g−1, and those of 220/180/160-MoS2 are significantly reduced. No obvious platform can be observed during charging and discharging. To investigate the storage characteristics of zinc ions during battery charging and discharging, CV measurements were performed on the assembled battery (Fig. S6†). Fig. 6b displays the CV curve of 200-MoS2 with different scan rates within a potential range of 0.25–1.3 V. At a scan rate of 1 mV s−1, the CV curve clearly shows two obvious symmetrical redox peaks at about 1.04 V and 0.68 V, which respectively correspond to the insertion and extraction of Zn ions during charge and discharge, indicating that the reaction has excellent reversibility. The CV curve of current electrodes in zinc ion batteries shows typical characteristics of electrochemical insertion/extraction of Zn ions. At different scan rates, as the scan rate increases, the CV curves still maintain similar shapes, but the oxidation peak moves to a high potential, and the reduction peak moves to a low potential. The intensity of the redox peak increases significantly, indicating the fast kinetics of Zn deposition/dissolution at a large scan rate. Besides, it also shows that the 200-MoS2 electrode has decent stability. Fig. 6c shows the rate performance of MoS2 as an electrode at different preparation temperatures, in which 200-MoS2 shows superior rate performance. The discharge capacities of the 200-MoS2 electrode are 148, 136, 123, 106 and 91 mA h g−1 at current densities of 0.5, 1, 2, 5 and 10 A g−1, respectively. When the current density was suddenly recovered to 0.5 A g−1, the discharge capacity continued to rise, and the maximum discharge capacity could reach 155 mA h g−1, indicating that the 200-MoS2 electrode has good rate performance and cycle stability. 220-MoS2 and 180-MoS2 show similar performances, which are related to the similar stacked structures. While 160-MoS2 shows almost no capacity, there is no change in capacity at different rates, indicating that MoS2 is not synthesized, which is consistent with the results of SEM and XRD. In order to further verify the cycle performance of the MoS2 electrode, a cycle performance test (Fig. 6e) was carried out at a high current density of 2 A g−1. The discharge capacity of 200-MoS2 is up to 125 mA h g−1. Coulomb efficiency is maintained at 100%. After 500 cycles, the capacity retention rate is still 100%, while the discharge capacity of MoS2 at other temperatures is less than 100 mA h g−1, confirming that 200-MoS2 has a good long cycle stability performance. It suggests that the flower-like structure has a smaller size and high crystallinity, which will be more conducive to the zinc intercalation process. Furthermore, the 200-MoS2 electrode can provide an energy density of 93.73 W h kg−1 at 0.5 A g−1 and a high power density of 3257.61 W kg−1 at 5 A g−1, which is used in high-power battery applications and shows a certain potential for energy storage. It is worth noting that the capacity of the battery showed an increasing trend in the initial stage. This is most likely due to the gradual activation of the electrodes during the electrochemical cycle, obtaining more and more electrochemical sites, resulting in a higher specific capacity.57,58 In addition, as the current density increases and the initial capacity increases, the electrode activation requires a longer period. This trend can be observed in the rate test and cycle test (Fig. 6c and e), and it shows stability after a long cycle. The cycle performance at low current density is an important electrochemical indicator of zinc-ion batteries. The cycle test was carried out on 200-MoS2 at a current density of 0.3 A g−1 (Fig. S8a†). Unexpectedly, the results showed that the battery cannot be charged after 50 cycles, but after replacing the anode, the battery can be charged and discharged again as before. This situation should be attributed to the fact that the negative electrode is more prone to corrosion at low current densities, leading to battery failure. The charge–discharge curve at low current density (Fig. S8b†) showed that with the increase of the number of charge and discharge cycles, the capacity of the battery tends to increase and remains stable in the subsequent cycles.To further assess the electrochemical properties of the prepared electrode as the cathode for aqueous rechargeable zinc ion batteries, the kinetics test by using electrochemical impedance spectroscopy (EIS) shows that all electrode materials present a typical semicircular curve in the high frequency area, and a diagonal straight line in the low frequency area (Fig. 7a). The semicircular area corresponds to the impedance caused by the charge transfer between the electrolyte and the electrode interface. The smaller radius of the semicircle corresponds to smaller contact impedance between the electrolyte and the electrode interface.59,60 200-MoS2 exhibits the smallest charge transfer resistance, while 180-MoS2 exhibits the largest charge transfer resistance. For further research, we used Zview software to fit the impedance curve, and calculated the corresponding resistance value through a quantitative equivalent circuit model. R1 represents the solution resistance, R2 and R3 represent the charge transfer resistances at the interface between the electrolyte and the electrode. By calculation (Table S4†), 200-MoS2 has the smallest charge transfer resistance. This result can be explained by their different structure sizes, a smaller particle size can effectively accelerate the transfer of ions and charges. The constant current charge and discharge curves of 200-MoS2 under various current densities (Fig. 6d) showed similar shapes, implying that the favorable Zn2+ intercalation/deintercalation behavior of smaller-size MoS2 cathode is well maintained in an aqueous electrolyte environment. In general, the electrochemical kinetic process also can be analyzed through the following power law relationship:
| i = avb | (1) |
log(i) = b![[thin space (1/6-em)]](https://www.rsc.org/images/entities/char_2009.gif) log(v) + log log(v) + log![[thin space (1/6-em)]](https://www.rsc.org/images/entities/char_2009.gif) a a | (2) |
| i = k1v + k2v1/2 | (3) |
| i/v1/2 = k1/v1/2 + k2 | (4) |
In order to verify the stability of the material, XRD tests were performed on the initial positive electrode and the electrode after 600 cycles (Fig. S10†). It can be observed that the (002) crystal plane can be seen from the initial electrode that has not been cycled, but after 600 times, the crystal plane disappears and the structure of MoS2 changes, indicating that the structure is broken. This is also the cause of capacity degradation and failure of the battery after 500 cycles.
4 Conclusions
In summary, a flower-like 1T-MoS2 material with large layer spacing (1.025 nm) was successfully fabricated via a facile one-step hydrothermal method, and employed as a cathode in ZIBs. Adjusting the hydrothermal temperature can significantly change the crystallinity of the 1T-MoS2, and effectively improve the zinc storage capacity of MoS2 as a cathode for ZIBs. A comparative study on the different hydrothermal temperatures of 1T-MoS2 reveals that 200-MoS2 displays higher capacity. It can be ascribed to the largest interlayer structure and more lattice distortion, which can ensure the successful intercalation of zinc ions and improve the activity during the cycling process. As a result, 200-MoS2 exhibited significant long-period performance and rate performance in rechargeable aqueous zinc ion batteries as a cathode. When the current density is 0.5 A g−1, the discharge capacity can reach up to 155 mA h g−1. Specifically, it displayed a high specific discharge capacity of 125 mA h g−1 with capacity retention of 100% after 500 cycles at the current density of 2 A g−1. This work provides a new alternative for improving the performance of MoS2 in water-based rechargeable zinc ion batteries. And this cost-effective synthesis method is expected to be used in large-scale production applications.Author contributions
Methodology: Yangyi Yang, Chengyan Cai, Zengren Tao; validation: Chengyan Cai, Zengren Tao, Yuanfei Zhu, Yuanming Tan, Anding Wang, Haiyun Zhou, Yangyi Yang; writing – original draft: Chengyan Cai; writing – review & editing: Chengyan Cai, Zengren Tao, Yuanfei Zhu. All authors have given approval to the final version of the manuscript.Conflicts of interest
The authors declare that they have no known competing financial interests or personal relationships that could have appeared to influence the work reported in this paper.Acknowledgements
This work was supported by the National Natural Science Foundation of China (Grant No. 91022012, 20973203, 51472275) and the Guangdong Natural Science Foundation (Grant No. 2014A030313207).References
- X. Wang, X. Lu, B. Liu, D. Chen, Y. Tong and G. Shen, Adv. Mater., 2014, 26, 4763–4782 CrossRef CAS PubMed.
- C. Han, Y.-B. He, B. Li, H. Li, J. Ma, H. Du, X. Qin, Q.-H. Yang and F. Kang, ChemSusChem, 2014, 7, 2567–2574 CrossRef CAS PubMed.
- M. Zhu, Y. Huang, Q. Deng, J. Zhou, Z. Pei, Q. Xue, Y. Huang, Z. Wang, H. Li, Q. Huang and C. Zhi, Adv. Energy Mater., 2016, 6, 1600969 CrossRef.
- Q. Zhang, Y. Zhang, L. Fu, S. Liu and H. Yang, Electrochim. Acta, 2020, 354, 136721 CrossRef CAS.
- Z. Liu, H. Li, M. Zhu, Y. Huang, Z. Tang, Z. Pei, Z. Wang, Z. Shi, J. Liu, Y. Huang and C. Zhi, Nano Energy, 2018, 44, 164–173 CrossRef CAS.
- H. Jiang, Y. Zhang, Z. Pan, L. Xu and C. Meng, Electrochim. Acta, 2020, 332, 135506 CrossRef CAS.
- N. Nitta, F. Wu, J. T. Lee and G. Yushin, Mater. Today, 2015, 18, 252–264 CrossRef CAS.
- Z. Liu, J. Wang, H. Ding, S. Chen, X. Yu and B. Lu, ACS Nano, 2018, 12, 8456–8466 CrossRef CAS PubMed.
- E. Iruin, A. R. Mainar, M. Enterría, N. Ortiz-Vitoriano and B. Horstmann, Electrochim. Acta, 2019, 320, 134557 CrossRef CAS.
- H. Li, L. Ma, C. Han, Z. Wang, Z. Liu, Z. Tang and C. Zhi, Nano Energy, 2019, 62, 550–587 CrossRef CAS.
- X. Zeng, J. Hao, Z. Wang, J. Mao and Z. Guo, Energy Storage Materials, 2019, 20, 410–437 CrossRef.
- F. F. Cao, Y. G. Guo and L. J. Wan, Energy Environ. Sci., 2011, 4, 1634–1642 RSC.
- J. Ming, J. Guo, C. Xia, W. Wang and H. N. Alshareef, Mater. Sci. Eng., 2018, 135, 58–84 CrossRef.
- S. Li, Y. Liu, X. Zhao, Q. Shen and X. Qus, Adv. Mater., 2021, 33, 12 Search PubMed.
- H. Liu, J. G. Wang, W. Hua, Z. You, Z. Hou and J. Yang, Energy Storage Materials, 2021, 35, 731–738 CrossRef.
- V. Soundharrajan, B. Sambandam, S. Kim, V. Mathew and J. Kim, ACS Energy Lett., 2018, 3, 1998–2004 CrossRef CAS.
- M. Lin, M. Gong, B. Lu, Y. Wu and D. Wang, Nature, 2015, 520, 324–328 CrossRef CAS PubMed.
- M. Yan, P. He, Y. Chen, S. Wang and J. Yang, Adv. Mater., 2018, 30, 1703725 CrossRef PubMed.
- D. Chao, C. R. Zhu, M. Song, P. Liang, X. Zhang, N. H. Tiep, H. Zhao, J. Wang, R. Wang, H. Zhang and H. J. Fan, Adv. Mater., 2018, 30, e1803181 CrossRef PubMed.
- F. Wan, L. Zhang, X. Dai, X. Wang, Z. Niu and J. Chen, Nat. Commun., 2018, 9, 1656 CrossRef PubMed.
- C. Liu, Z. Neale, J. Zheng, X. Jia, J. Huang, M. Yan, M. Tian, M. Wang, J. Yang and G. Cao, Energy Environ. Sci., 2019, 12, 2273–2285 RSC.
- S. Bhoyate, S. Mhin, J. E. Jeon, K. Park, J. Kim and W. Choi, ACS Appl. Mater. Interfaces, 2020, 12, 27249–27257 CrossRef CAS PubMed.
- H. Qin, L. Chen, L. Wang, X. Chen and Z. Yang, Electrochim. Acta, 2019, 306, 307–316 CrossRef CAS.
- B. Zhuchan and A. Zhang, et al. , J. Alloys Compd., 2021, 872, 159599 CrossRef.
- V. Verma, S. Kumar, W. Manalastas, R. Satish and M. Srinivasan, Adv. Sustainable Syst., 2019, 3, 1970004 CrossRef.
- F. Wang, E. Hu, W. Sun, T. Gao, X. Ji, X. Fan, F. Han, X. Q. Yang, K. Xu and C. Wang, Energy Environ. Sci., 2018, 11, 3168–3175 RSC.
- N. Zhang, F. Cheng, Y. Liu, Q. Zhao, K. Lei, C. Chen, X. Liu and J. Chen, J. Am. Chem. Soc., 2016, 12894 CrossRef CAS PubMed.
- S. D. Han, S. Kim, D. Li, V. Petkov and J. T. Vaughey, Chem. Mater., 2017, 29, 11 Search PubMed.
- D. Kundu, B. D. Adams, V. Duffort, S. H. Vajargah and L. F. Nazar, Nat. Energy, 2016, 1, 16119 CrossRef CAS.
- M. Yan, P. He, Y. Chen, S. Wang, Q. Wei, K. Zhao, X. Xu, Q. An, Y. Shuang and Y. Shao, Adv. Mater., 2017, 30, 1703725 CrossRef PubMed.
- L. Zhang, L. Chen, X. Zhou and Z. Liu, Adv. Energy Mater., 2015, 5, 1400930 CrossRef.
- R. Jia, G. Shen, F. Qu and D. Chen, Energy Storage Materials, 2020, 27, 169–186 CrossRef.
- Y. Cheng, L. Luo, L. Zhong, J. Chen, B. Li, W. Wang, S. X. Mao, C. Wang, V. L. Sprenkle, G. Li and J. Liu, ACS Appl. Mater. Interfaces, 2016, 8, 13673 CrossRef CAS PubMed.
- Q. Zhao, W. Huang, Z. Luo, L. Liu and Y. Lu, Sci. Adv., 2018, 4, eaao1761 CrossRef PubMed.
- D. Kundu, P. Oberholzer, C. Glaros, A. Bouzid, E. Tervoort, A. Pasquarello and M. Niederberger, Chem. Mater., 2018, 8b01317 Search PubMed.
- H. Yao, Q. Li, M. Zhang, Z. Tao and Y. Yang, Chem. Eng. J., 2020, 392, 123653 CrossRef CAS.
- M. Zhang, W. Wu, J. Luo, H. Zhang, J. Liu, X. Liu, Y. Yang and X. Lu, J. Mater. Chem. A, 2020, 8, 23 Search PubMed.
- C. Zhao, C. Yu, M. Zhang, Q. Sun, S. Li, M. Norouzi Banis, X. Han, Q. Dong, J. Yang and G. Wang, Nano Energy, 2017, S2211285517305062 Search PubMed.
- M. Pumera, Z. Sofer and A. Ambrosi, J. Mater. Chem. A, 2014, 2, 8981–8987 RSC.
- A. Gigot, M. Fontana, M. Serrapede, M. Castellino and S. Bianco, ACS Appl. Mater. Interfaces, 2016, 8, 32842–32852 CrossRef CAS PubMed.
- X. Zhang, Z. Zhang, H. Fei, S. Bao, D. Wang and Z. Wu, J. Mater. Chem. A, 2017, 5, 2681–2688 RSC.
- J. Zhu, Z. Wang, H. Yu, N. Li, J. Zhang, J. Meng, M. Liao, J. Zhao, X. Lu and L. Du, J. Am. Chem. Soc., 2017, 139, 10216 CrossRef CAS PubMed.
- Z. Xie, K. Chang, B. Li, H. Tang, X. Fu, Z. Chang, X. Z. Yuan and H. Wang, Electrochim. Acta, 2016, 189, 205–214 CrossRef CAS.
- X. Li, X. Lv, N. Li, J. Wu, Y. Z. Zheng and X. Tao, Appl. Catal., B, 2019, 243, 76–85 CrossRef CAS.
- W. S. V. Lee, T. Xiong, X. Wang and J. Xue, Small Methods, 2020, 5, 2000815 CrossRef.
- H. Liang, Z. Cao, F. Ming, W. Zhang, D. H. Anjum, Y. Cui, L. Cavallo and H. N. Alshareef, Nano Lett., 2019, 19, 3199–3206 CrossRef CAS PubMed.
- W. Xu, C. Sun, K. Zhao, X. Cheng, S. Rawal, Y. Xu and Y. Wang, Energy Storage Materials, 2019, 16, 527–534 CrossRef.
- W. Q. Chen, L. Li, L. Li, W. H. Qiu, L. Tang, L. Xu, K. Xu and M. H. Wu, Engineering, 2019, 5, 755–767 CrossRef CAS.
- H. Liang, Z. Cao, F. Ming, W. Zhang, D. H. Anjum, Y. Cui, L. Cavallo and H. N. Alshareef, Nano Lett., 2019, 19, 3199–3206 CrossRef CAS PubMed.
- J. Liu, P. Xu, J. Liang, H. Liu and X. Fan, Chem. Eng. J., 2020, 389, 124405 CrossRef CAS.
- W. Xu, C. Sun, K. Zhao, X. Cheng and Y. Wang, Energy Storage Materials, 2019, 16, 527–534 CrossRef.
- Z. T. Shi, W. Kang, J. Xu, Y. W. Sun, M. Jiang, T. W. Ng, H. T. Xue, D. Yu, W. Zhang and C. S. Lee, Nano Energy, 2016, 22, 27–37 CrossRef CAS.
- T. Xiang, Q. Fang, H. Xie, C. Wu and C. Wang, Nanoscale, 2017, 9, 6975–6983 RSC.
- Y. Yang, Y. Tang, G. Fang, L. Shan and S. Liang, Energy Environ. Sci., 2018, 11, 3157–3162 RSC.
- R. Y. Wang, C. D. Wessells, R. A. Huggins and Y. Cui, Nano Lett., 2013, 13, 5748–5752 CrossRef CAS PubMed.
- F. Xie, G. Wang, T. Zhao, Q. Wang, M. Yan, H. Bi and L. Tang, Energy Storage, 2020, 2, e118 CrossRef CAS.
- X. Lu, Y. Wang, X. Zhang, G. Xu and Y. Wu, J. Hazard. Mater., 2017, 341, 10–19 CrossRef CAS PubMed.
- H. Pan, G. Zhang, X. Liao, M. Yan and L. Mai, Adv. Energy Mater., 2018, 8, 1702463 CrossRef.
- S. Zhang, Y. Zeng, Z. Wang, J. Zhao and G. Dong, Chem. Eng. J., 2017, 334, 487–496 CrossRef.
- S. Wang, W. Li, H. Song, C. Mao, Z. Zhang, H. Peng and G. Li, Inorg. Chem. Front., 2019, 6, 1275–1281 RSC.
- P. He, M. Yan, G. Zhang, R. Sun, L. Chen, Q. An and L. Mai, Adv. Energy Mater., 2017, 7, 1601920 CrossRef.
- Z. Peng, Q. Wei, S. Tan, P. He, W. Luo, Q. An and L. Mai, Chem. Commun., 2018, 54, 4041–4044 RSC.
Footnotes |
| † Electronic supplementary information (ESI) available. See DOI: 10.1039/d1na00166c |
| ‡ These authors contributed equally to this work. |
| This journal is © The Royal Society of Chemistry 2021 |

