 Open Access Article
 This Open Access Article is licensed under a Creative Commons Attribution-Non Commercial 3.0 Unported Licence
A mechanistic study of the electrochemical oxygen reduction on the model semiconductor n-Ge(100) by ATR-IR and DFT†
Simantini
Nayak
,
P. Ulrich
Biedermann
,
Martin
Stratmann
and
Andreas
Erbe
*
Max-Planck-Institut für Eisenforschung GmbH, Max-Planck-Str. 1, 40237, Düsseldorf, Germany. E-mail: a.erbe@mpie.de; aerbe@arcor.de; Fax: +49 211 6792 218; Tel: +49 211 6792 890
First published on 4th January 2013
Abstract
The electrochemical oxygen reduction reaction (ORR) on a n-Ge(100) surface in 0.1 M HClO4 was investigated in situ and operando using a combination of attenuated total reflection infrared (ATR-IR) spectroscopy and density functional (DFT) calculations. The vibrational modes of the detected intermediates were assigned based on DFT calculations of solvated model clusters such as Ge-bound superoxides and peroxides. ATR-IR shows the Ge-bound superoxide with a transition dipole moment oriented at (28 ± 10)° with respect to the surface normal. At slightly negative potentials, the surface-bound peroxide is identified by an OOH bending mode as a further intermediate, oriented at a similar angle. At strongly negative potentials, a surface-bound perchlorate is found. The findings indicate a multistep mechanism of the ORR. The reaction is furthermore coupled with the hydrogen evolution reaction (HER).
1 Introduction
The electrochemical oxygen reduction reaction (ORR) is a crucial reaction for a number of fields in chemistry, including conversion of chemical to electrical energy, and corrosion.1,2 The lack of understanding of the reaction mechanism of the electrochemical ORR is a major bottleneck in the development of efficient fuel cells and in the prevention of corrosion. The ORR involves the transfer of 4 electrons and 4 protons to the O2 molecule and breaking of the formal double bond. The net reaction is O2 + 4e− + 4H+ → 2H2O in acidic solution.1,2 Recently, interest in the reaction mechanism has increased due to its role in fuel cells and batteries.3–7 Many studies have been performed to find ORR catalysts with increased performance or lower cost than existing noble metal catalysts, and to understand the reaction mechanism.8–11 Several major pathways have been put forward, a direct mechanism based on dissociative adsorption of O2 on an electrode surface, or different variants of multistep reaction mechanisms with step-by-step electron transfer, which proceed via the superoxide radical anions and/or peroxides, to the final dissociation of the O–O bond.1,2,7,12–16 A general scheme of possible intermediates has been constructed.12,17–19Traditionally, intermediates that are stable enough to diffuse away from the electrode surface have been detected by electrochemical experiments.12,20 Furthermore, vibrational spectroscopic techniques have been used to detect intermediates during ORR on rough noble metal films relevant to fuel cell applications.21–29Vibrational spectroscopy is a powerful tool to analyze the nature of transient oxygen-related species on the surface, as peak frequencies can clearly distinguish between double bonds (∼1550 cm−1) as present in O2, single bonds (∼800 cm−1) as present in peroxides including H2O2, and bonds with bond order 1.5 (∼1200 cm−1) present in superoxides.22,30 A detailed literature overview of the assignment of vibrational frequencies of reported intermediates, and selected data for reference compounds, is given in the ESI.† Experimental studies have been complemented by computational studies, which lead to more detailed insight into adsorption sites, relative stabilities and the nature and orientation of the species.23,31,32 Detailed experimental studies including the orientation of intermediates have been reported for flat solid/gas interfaces,33,34 but are so far lacking under conditions of electrochemical reactions.
The crystalline semiconductor Ge has been proposed as a model for semiconducting passive films,35 as under ambient conditions most metallic materials are covered with protective semiconducting oxides.36 More recently, semiconductors and other non-metallic materials have been suggested as a replacement of precious metals in electrocatalysis.5,6,37
Ge exhibits a potential-dependent transition from a hydroxide covered to hydrogen terminated surface. This transition has originally been inferred from electrochemical experiments38 and was later confirmed using attenuated total reflection infra-red (ATR-IR) spectroscopy and quartz-crystal microbalance experiments.39–41 Without systematic studies of the ORR on Ge, this transition has been proposed to be related to the onset of the ORR, as it involves a radical surface state.40,42,43
In this work, ATR-IR spectroscopy and density functional theory (DFT) calculations have been used to study the mechanism of the ORR on Ge(100) in 0.1 M HClO4.
2 Materials and methods
2.1 Electrochemical and spectroscopic experiments
The setup consists of the optical base of the horizontal ATR unit SpectraTech Model 0001-100 (SpectraTech, Stamford, CT). The crystal plate was removed from the unit, and replaced by a copper piece that is used to contact the Ge ATR crystals. It was fixed on a PTFE mount to prevent electric contact with the optical base. Trapezoidal Sb-doped n-type Ge(100) crystals (Crystaltechno, Moscow, Russia) were used as substrates. The crystals have a specified resistivity of 10–40 Ω cm and a size of 52 mm × 20 mm × 0.5 mm. The short edges were polished to an angle of 30°, leading to an angle of incidence of 60° at the Ge/electrolyte interface. The Ge crystal was placed in a groove on the copper piece and moved along the direction of the beam until maximum transmitted intensity through the whole system was observed. A PTFE basin was used to hold the electrolyte with a FPM O-Ring in direct contact with the Ge crystal. After alignment of the IR light path, the PTFE basin was screwed onto the base part, pressing the back of the Ge crystal against the copper surface and sealing the electrochemical cell. The cell was covered with a Teflon lid which contains bores as gas inlet and outlet, and connections for the reference electrode (RE) and counter electrode (CE).Several published cleaning protocols have been tried for the Ge(100) surface.40,43,44 Most of them lead to surface roughening. Therefore, the crystals were cleaned by immersing them in neutral Extran lab detergent (VWR) for 1 h. Immersion was followed by rinsing with ultrapure water several times, and leaving them in 2-propanol for 1 h. The crystals were subsequently rinsed with excessive amounts of deionised ultrapure water and dried under an N2 stream prior to experiments. The final cleaning was performed by electrochemical oxidation of the species inside the spectroelectrochemical cell prior to experiments. Eight cycles of scans in an anodic direction from +0.21 to −0.79 (all electrode potentials are given with respect to the standard H2 electrode, SHE) were performed. The resulting final cyclic voltammograms (CVs) were in good agreement with references.38–40,43 The absence of C–H stretching modes in the subsequent experiments is an additional indication for the successful cleaning of the Ge surface.
In the geometry used, the Ge crystal acted as a working electrode (WE) with an electrode area of 5.5 cm2. The dimensions of the crystal imply that there are ∼100 internal reflections probing the WE/electrolyte interface. A double junction Ag/AgCl/3 M KCl microreference electrode (MI-403, MICROELECTRODES, INC., Bedford, NH, USA) was used as a RE. A Pt loop (99.99%, 0.4 mm diameter and 0.2 m length), (Goodfellow, Huntingdon, UK) was used as a CE. 0.1 M HClO4 (70%, Sigma-Aldrich) was used as an electrolyte. The electrolyte was saturated with O2 or Ar, respectively, by purging the solution with gas prior to the experiment. During experiments, the gas volume above the electrolyte was continuously purged with the respective gas. All experiments were carried out at ambient temperature of (23 ± 2) °C.
IR spectra were recorded on a FTS 3000 Fourier transform IR spectrometer (Biorad, Palo Alto, CA, USA; now part of Agilent Technologies) using a mercury cadmium telluride (MCT) detector. IR spectra were recorded in s- and p-polarisation co-adding 1000 scans with a spectral resolution of 4 cm−1. IR spectra are displayed as absorbance defined as
 | (1) |
For spectra recorded in an Ar saturated electrolyte, the residual absorbance from bulk ClO4− was subtracted from the spectra by subtracting a spectrum such as that shown in Fig. S3 (ESI†) from the measured spectra using the algorithm implemented in the program specsubtr.45 Using this procedure, only spectral components visible in the bulk are removed from the spectra. Such spectral components may show up in the resulting difference spectra, e.g. because of changes in the wetted working electrode area in the order of ∼μm2. In particular, no components generated during the electrochemical treatment are removed by the subtraction procedure.
For isotope exchange experiments, a slightly modified setup was used, where the electrolyte was saturated outside the ATR-IR cell initially with Ar, which was later replaced by 18O2, and then pumped into the spectroelectrochemical cell.
2.2 Quantification of spectra and electric fields at interfaces
 .46 The squared amplitudes of the electric field components at the interface I0x, I0y and I0z are calculated from the parameters of the experimental system.46,47 The right-handed Cartesian coordinate system is used where the ATR internal reflection element's surface normal points to the z direction, and the x direction is the projection of the direction of propagation onto the internal reflection element's surface.46
S
2 is related to the angle θ between TDM and surface normal as  .46 In all cases, only a single orientation has been assumed in the orientation distribution function of each TDM. A random orientation resulting in the “magic angle” of 54.6° is expected for dissolved or weakly physisorbed species.46
It should be noted that in the case of coexistence of a certain (small) concentration of dissolved isotropically oriented species with the oriented species, an even more upright orientation of the surface-bound intermediate would be required to arrive at the observed polarization dependence. It should also be pointed out that the averaging of the tilt angle is over cos2(θ).46 Detailed discussions including examples of orientation distribution can be found elsewhere.46,48,49
 | (2) |
2.3 Density functional theory calculations
DFT calculations were done using the program package TURBOMOLE Version 6.2.51 The hybrid density functional B3-LYP52–54 was used with the basis set def2-TZVP,55,56 and the RI-JK approximation.57 The structures have been optimized using redundant internal coordinates until the energy changes are below 10−7 Hartree and forces are below 10−4 Hartree Bohr−1 in calculations without the continuum solvation model. In geometry optimizations with the continuum solvation model the convergence criteria were 10−6 Hartree and 10−3 Hartree Bohr−1. Vibrational frequencies have been calculated using the harmonic approximation and analytical second derivatives for systems without continuum solvation, and numerical (central) second derivatives for systems with continuum solvation.58–60 In the larger Ge clusters only displacements of the atoms corresponding to the ORR species and the directly attached GeH group have been considered. Due to the computational demand all other atoms were not displaced. A test calculation has shown that coupling with the vibrational modes of the water molecules is small and can be neglected for the bands of interest. Frequencies shift by ≤3 cm−1. For better comparison to experimental frequencies the calculated values were scaled by 0.9691.61Solvent effects were treated applying four different approaches:
(1) Neglecting solvent effects by simply calculating the molecules or clusters in a vacuum.
(2) Using the conductor-like screening model COSMO,62 with a static dielectric constant εr = 78.36 and a refractive index n = 1.333 corresponding to water at 25 °C. This approach includes the polarisation effects due to the dielectric shielding of the electrolyte, however, neglects hydrogen bonds.
(3) Including explicit water molecules in the first solvation shell in order to include the effects of hydrogen bonds. For this purpose, a cluster of the solute and water molecules complexing each OH-group and lone pair is constructed. To secure a bulk-like isotropic solvation with a tetrahedral coordination of the solute oxygen(s) and nearly linear hydrogen bonds, the Owater–Osolute–Owater and Owater–Osolute–Osolute angles have been constrained to ∼109°. In the solvent shell of ClO4− and HClO4, the water oxygen has been constrained to be collinear with the respective Cl–O bond.
(4) The solute–water complexes described in (3) were calculated with the COSMO conductor-like screening model to include the polarisation effects by the dielectric shielding on the hydrogen-bonded structures.
It should be noted that representing the dynamic and fluctuating water structure around a solute by a single partially optimized configuration is a crude approximation. Nevertheless it should represent the main trends in the vibrational modes due to aqueous solvation of solutes and adsorbed species.
For each of these solvation models the structures were optimized and vibrational frequencies were calculated as described above.
3 Results
3.1 Electrochemistry and ATR-IR spectroscopy
The CV in Fig. 1 in Ar closely resembles those reported under similar conditions.38,40,41 An anodic peak at +0.1 V is attributed to the formation of a surface oxide.38,40,41 At −0.3 V, a cathodic current peak is observed, attributed to the onset of the change in surface termination from Ge–OH to Ge–H.39,40 The surface transition has been proposed to be related to the onset of the ORR,38,39 as it involves a radical surface state.40,42,43 The H2 evolution reaction (HER) dominates below −0.6 V.38–40 In O2 saturated solution, substantially increased currents are observed in the range −0.3 to −0.7 V in addition to surface oxidation at +0.1 V, and HER at potentials below −0.7 V. | ||
Fig. 1 Lines: CV (50 mV s−1) of n-Ge(100) in O2 ( ) and Ar ( ) and Ar ( ) saturated 0.1 M HClO4. Arrows indicate the scan direction, the horizontal line (—) indicates current density j = 0. Symbols: average j during ATR-IR experiments in O2 ( ) saturated 0.1 M HClO4. Arrows indicate the scan direction, the horizontal line (—) indicates current density j = 0. Symbols: average j during ATR-IR experiments in O2 ( ) and Ar ( ) and Ar ( ). ). | ||
Fig. 2 shows a series of ATR-IRspectra recorded using p-polarisation during the ORR on Ge(100) in the range of 1500 to 900 cm−1. In the presence of O2, three vibrational bands are observed, centered at 1030 cm−1, 1210 cm−1, and 1385 cm−1. Another band at 1105 cm−1 is visible only as a shoulder in few spectra. This band is assigned to the antisymmetric Cl–O stretching mode of ClO4− in solution (Table S1 and Fig. S3, ESI†).63–65 In Ar, no bands are observed. The residual absorbance from bulk ClO4− was subtracted from the spectra.
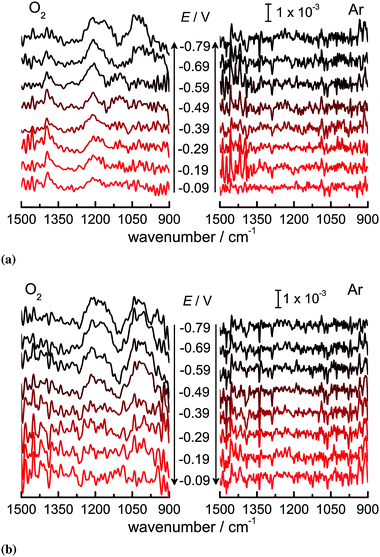 | ||
| Fig. 2 ATR-IR absorbance spectra (p-polarisation) in O2 and Ar saturated 0.1 M HClO4 on Ge(100) in the direction of (a) more negative and (b) less negative potential. | ||
Using the procedures outlined in Section 2.2.1, the orientation of the TDMs of the vibrational modes observed has been determined. The orientations obtained are (10 ± 5)° for the mode at 1030 cm−1, (28 ± 10)° for the mode at 1210 cm−1, and (35 ± 10)° for the mode at 1385 cm−1.
3.2 DFT calculations
In order to arrive at a substantiated interpretation of the spectroelectrochemical experiments, a systematic study of possible ORR intermediates in solution and on the Ge(100) surface was carried out using DFT calculations. Solution species were derived from oxygen by adding electrons and protons in an alternating sequence until the O–O bond breaks after transfer of the third electron. The surface-bound species were constructed based on the experimental observation of a well-defined upright orientation of the TDMs, as reported in Section 3.1. This observation points to a covalent bond to the Ge surface, as will be discussed in Section 4.1. The clusters representing the germanium surface are cut from an ideal Ge(100) surface and all dangling bonds are saturated by hydrogen. A fully reduced surface covered with GeH2 groups is assumed. Test calculations with models including![[double bond splayed left]](https://www.rsc.org/images/entities/char_e009.gif) Ge(–H)–Ge(–H)
Ge(–H)–Ge(–H)![[double bond splayed right]](https://www.rsc.org/images/entities/char_e00a.gif) surface-dimers, which may result from a surface reconstruction, gave similar frequencies, however, require substantially higher computational resources due to the larger model structures. Here only the structures and vibrational modes relevant for this work are analyzed.
surface-dimers, which may result from a surface reconstruction, gave similar frequencies, however, require substantially higher computational resources due to the larger model structures. Here only the structures and vibrational modes relevant for this work are analyzed.
| Species | Solvation model | Wavenumbers | ||
|---|---|---|---|---|
| ν(O–H) | δ(X–O–H)a | ν(O–O) | ||
| a X = H for H2O, X = O elsewhere. b IR-inactive or almost IR-inactive. c This work. | ||||
| H2O | None | 3768/3667 | 1566 | |
| COSMO | 3732/3647 | 1577 | ||
| +4H2O | 3521/3450 | 1626 | ||
| +4H2O + COSMO | 3381/3321 | 1626 | ||
| IR66 | Gas phase | 3756/3657 | 1595 | |
| ATR-IR67 | Liquid water | 3351/3261 | 1639 | |
| H2O2 | None | 3627/3626 | 1394b/1272 | 919b |
| COSMO | 3603/3598 | 1371b/1322 | 923b | |
| +6H2O | 3243/3203 | 1536b/1345 | 888b | |
| +6H2O + COSMO | 3089/3033 | 1534b/1359 | 936b | |
| Raman68 | Vapour | 3607 | 1394 | 864 |
| IR-ellipsometryc | 30% H2O2 | 1380 | ||
| HOO− | None | 3624 | 1067 | 752 |
| COSMO | 3644 | 1184 | 832 | |
| +6H2O | 3548 | 1288 | 913 | |
| +6H2O + COSMO | 3317 | 1364 | 901 | |
| IR-ellipsometryc | 30% H2O2 + NaOH | 1310 | ||
| HOO˙ | None | 3458 | 1385 | 1126 |
| COSMO | 3459 | 1407 | 1158 | |
| +6H2O | 2817 | 1503 | 1214 | |
| +6H2O + COSMO | 2492 | 1501 | 1196 | |
| UV-PES69 | Vacuum | 1125 | ||
| O2˙− | None | 1142b | ||
| COSMO | 1168b | |||
| +6H2O | 1184b | |||
| +6H2O + COSMO | 1183b | |||
| UV-PES70 | He gas discharge | 1090 ± 20 | ||
| O2 | None | 1583b | ||
| Raman71 | Gas | 1556 | ||
| Species | Solvation | Wavenumbers | ||
|---|---|---|---|---|
| ν(O–H) | δ(Cl–O–H) | ν(Cl–O) | ||
| ClO4− | None | 1070/890b | ||
| COSMO | 1069/897b | |||
| +4H2O | 1083/915b | |||
| +4H2O + COSMO | 1075/914b | |||
| ATR-IRc | 0.1 M HClO4 | 1105 | ||
| Raman65 | Dilute HClO4 | 1113/934 | ||
| HClO4 | None | 3578 | 1284 | 1217/1167/1010/689 |
| COSMO | 3522 | 1272 | 1200/1176/1007/703 | |
| +6H2O | 2734 | 1366 | 1213/1213/1013/734 | |
| +6H2O + COSMO | 1629 | 1417 | 1189/1177/962/780 | |
| Raman65 | HClO4 | 1220/1039/757 | ||
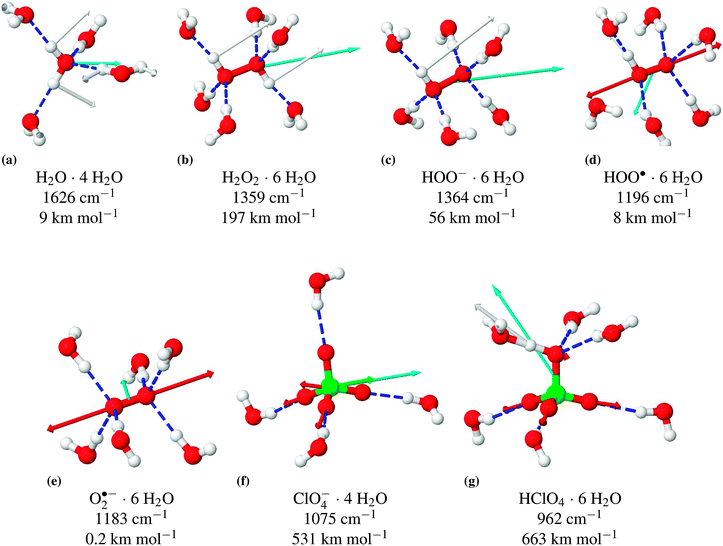 | ||
Fig. 3 Structures and selected vibrational modes, including absorption coefficient, of the explicitly solvated molecules calculated with COSMO. Overview of vibrational frequencies at different solvation models, see Table 1. Hydrogen bonds are depicted as  . The motion of the atoms during the respective vibrational modes are indicated as arrows in the color of the respective atom. The direction and magnitude of the TDM are shown as arrows in cyan ( . The motion of the atoms during the respective vibrational modes are indicated as arrows in the color of the respective atom. The direction and magnitude of the TDM are shown as arrows in cyan ( ). ). | ||
Solvation in water typically has a very significant effect on the vibrational frequencies. The experimental frequencies are shifted by ≈400 cm−1 to lower wavenumbers for the H2O stretching modes ν(O–H) and shifted by 44 cm−1 to higher wavenumbers for the bending mode δ(H–O–H) due to solvation. The apparently small difference between the experimental gas phase and solution frequencies for the bending mode of H2O2 is due to the fact that there are actually two bending modes for H2O2. In the Raman experiment the symmetric mode is observed, while in the IR experiment the asymmetric mode is mainly contributing. According to the calculations (Table 1), these modes differ by more than 100 cm−1 and shift by 140 and 87 cm−1, respectively, upon solvation.
Comparing the frequencies calculated with the four different solvation models shows that only the combination of explicit water molecules in the first hydration shell with the continuum solvation model COSMO properly reproduces the solvation effects. The continuum solvation model alone, as well as the explicit first solvation shell without COSMO, is clearly insufficient. Overall, the agreement of the B3-LYP/def2-TZVP scaled frequencies with the available experimental data is quite good. The root-mean-square deviation is 35 cm−1. The largest deviations are +60 and −77 cm−1.
 | ||
Fig. 4 Structures of the explicitly solvated surface clusters optimized with COSMO. Important vibrational modes are represented by their atomic velocity vectors. The TDM is indicated in cyan ( ) and the surface normal in black (→). Together with the chemical formula of the cluster, the wavenumber, tilt angle of the TDM and the absorption coefficients are given below with the respective structure. An overview of the relevant vibrational frequencies is given in Table 2. ) and the surface normal in black (→). Together with the chemical formula of the cluster, the wavenumber, tilt angle of the TDM and the absorption coefficients are given below with the respective structure. An overview of the relevant vibrational frequencies is given in Table 2. | ||
| Species | Wavenumbers | |||||
|---|---|---|---|---|---|---|
| ν(O–H) | ν(Ge–H) | δ(O–O–H) | ν(O–O) | ν(Ge–O) | ||
| a ν(Cl–O). | ||||||
| Ge13H28 | (a) | 2044/2033/2019/2018 | ||||
| Ge13H27-OH·2H2O | (b) | 3359 | 1971 | 1106 | 635 | |
| Ge13H27-OOH·3H2O | (c) | 3145 | 2032 | 1427 | 911 | 548 |
| Ge13H27-OO−·3H2O | (d) | 1985 | 879 | 607 | ||
| Ge13H27-OO˙·3H2O | (e) | 2041 | 1158 | 471 | ||
| Ge13H27-O-ClO3·3H2O | (f–h) | 2035 | 1155/1040/964/768a | 623 | ||
4 Discussion
4.1 Discussion of the spectral interpretation of ATR-IRspectra during ORR
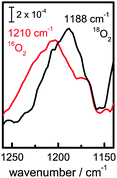 | ||
| Fig. 5 Isotope shift of mode at 1210 cm−1 when working in an 18O2 containing electrolyte at −0.59 V. | ||
This peak cannot originate from an OOH bending mode. In alkaline H2O2, the bending mode of HOO− is clearly observed at 1310 cm−1, and comparison to H2O2, where no peak is observed at 1310 cm−1, supports the assignment as bending mode of the HOO− anion (Fig. S2, ESI†). The vicinity of the surface is not likely to shift the mode by more than a few cm−1. From the expected modes of ORR intermediates, only the O–O stretching modes of superoxo-species are therefore in the spectral region where an absorption is observed experimentally.
From the dichroic ratio, a tilt angle θ ∼ (28 ± 10)° with respect to the surface normal has been determined for the TDM of the band at 1210 cm−1, independent of the applied potential. The well-defined orientation of the TDM observed experimentally indicates that the vibrational mode at 1210 cm−1 is predominantly due to an intermediate covalently bound to the surface.
In the DFT calculations, the solvated model cluster for the surface-bound superoxide radical, Ge13H27-OO˙·3H2O (Fig. 4(e)), also has a very upright O–O bond (tilt angle 18°). The stretching mode ν(O–O) at 1159 cm−1 is in good agreement with the experimental value of 1210 cm−1. The tilt angle of the calculated TDM of 40° is in reasonable agreement with the experimental tilt angle of (28 ± 10)°.
Comparing the peak frequency of the OOH bending mode in H2O2 to the one observed in ORR experiments at 1385 cm−1 gives agreement within 5 cm−1. However, the mode on the Ge surface observed during ORR has a full width at half maximum of 20 cm−1, while in H2O2 it is much wider (FWHM 150 cm−1). Contributing to the width for the absorption in the bulk spectra is likely the fact that (i) each molecule has two normal modes around 1400 cm−1, and (ii) these modes are slightly shifted for different conformations and solvation states of H2O2.
For this absorption, an orientation of θ ∼ (35 ± 10)° has been determined at potentials where the peak is clearly observed in the spectra, i.e. at the initial three potentials. The observed very narrow peak in the ORR experiments, together with the dichroism observed, leads to the assignment of this mode to surface-bound peroxide, as opposed to bulk H2O2.
The surface model cluster with a solvated Ge-bound peroxide group, Ge13H27-OOH·3H2O (Fig. 4(c)), has a fairly upright O–O bond tilted 15° with respect to the surface normal. The neighbouring GeH2 groups and the space required by the solvation shell enforce this upright orientation (Fig. 4(c)). The solvated cluster shows a bending mode δ(O–O–H) at 1427 cm−1 in good agreement with the observed frequency at 1385 cm−1. The corresponding TDM is tilted by 17°. This is in acceptable agreement with the experimental tilt angle of (35 ± 10)°. It should be noted that only one representative structure has been calculated. More accurate simulations would have to sample thermal motion of the functional group and fluctuations in the solvation shell.
Analysis of the dichroic ratio shows that the TDM belonging to this mode is oriented nearly perpendicular to the surface, i.e. almost coinciding with the surface normal, θ ∼ (10 ± 5)°. The DFT calculations also show the surface-bound perchlorate to have a fairly upright standing conformation in the solvated surface cluster, Ge13H27-O-ClO3·3H2O (Fig. 4(f–h)). The Cl–O bond of the Ge-bound O-atom has a tilt angle of 26° with respect to the surface normal. The calculated frequency of the symmetric stretching mode νsym(Cl–O) of 964 cm−1 is lower than the experimental frequency of 1030 cm−1. However, this deviation is systematic as it was also observed for the ν(Cl–O) frequencies in HClO4. The corresponding TDM has a tilt angle of 28° in agreement with the very upright orientation of (10 ± 5)° determined in the ATR experiment. This strong orientation confirms the assignment to the symmetric ClO3 stretching mode of the surface-bound perchlorate. The two asymmetric stretching modes νas(Cl–O) at 1040 cm−1 and 1155 cm−1 have TDMs oriented nearly parallel to the surface with tilt angles of 83° and 63°. Both calculated frequencies are probably underestimated due to a systematic error and at least the one at higher frequency may contribute absorbance in the region of the superoxide species (≈1200 cm−1). The fourth mode at 768 cm−1 belongs to the O-atom which is bound to the Ge surface, and is outside the range of interest.
4.2 Mechanism of the ORR on Ge(100)
The integrated absorbances in p- and s-polarisation of the mode centred at 1210 cm−1 have been transformed into an orientation-independent isotropic absorbance (Aiso), which is proportional to the surface coverage of the respective species. The resulting Aiso are shown in Fig. 6 in comparison with the pure ORR current densities (jORR = jO2 − jAr), obtained as a difference between total measured current densities in O2 (jO2) and Ar (jAr). At −0.1 to −0.3 V, the increase in current follows the increase in absorbance, until a plateau is reached in both current and Aiso between −0.3 and −0.5 V. Consequently, there is a correlation of the net ORR reaction rate (∝jORR) with the surface concentration of superoxide (∝Aiso). Below −0.5 V the surface is fully H-terminated, as shown by the Ge–H stretching modes.39,40 At the Ge–H terminated surface, Aiso increases at highly negative potential, as does jO2 (see the inset), while jORR remains constant. The increase in jO2 is related to the HER, while the increase in Aiso correlates with the appearance of the vibrational band at 1030 cm−1. The increase in Aiso at the three most negative potentials (−0.59 to −0.79 V) is therefore caused by the presence of surface-bound perchlorate, which also contributes weakly to the peak at 1210 cm−1. | ||
Fig. 6 Potential dependence of Aiso of the O–O stretching mode at 1210 cm−1 (in the direction of  negative and negative and  positive potentials) and ORR current densities jORR (in the direction of positive potentials) and ORR current densities jORR (in the direction of  negative and negative and  positive potentials). Inset: comparison of jORR (as in the main figure) with the experimental jO2 (in the direction of positive potentials). Inset: comparison of jORR (as in the main figure) with the experimental jO2 (in the direction of  negative and negative and  positive potentials). positive potentials). | ||
The OOH bending mode is present initially, and decreases in absorbance at more negative potentials. Therefore, at the initial slightly negative potentials, the rate of peroxide formation exceeds its reduction rate. In the reverse scan, the absorbance of this band is on the level of the noise, which is attributed to changes in the surface structure during the experiment. While the absorption coefficient obtained from the DFT calculations of the OOH bending mode is higher than the absorption coefficient of the O–O stretching mode of surface-bound superoxide by a factor of 20, its observed absorbance is considerably lower. To explain this observation, it should be noted that the absorbance is a function of the concentration at and near the Ge/electrolyte interface. The concentration of the surface-bound peroxide is therefore considerably lower than the concentration of surface-bound superoxide.
The absorbance of surface-bound perchlorate at 1030 cm−1 correlates with the HER current. This absorption is, however, not present in Ar, therefore is not related to the HER alone. This species may form in a side reaction of the ORR. However, it may also point to the active involvement of the electrolyte in the ORR.
The observation of a Ge-bound superoxide as an intermediate in the ORR suggests that the ORR starts by the combination of an O2 molecule with a surface radical. Such surface radicals have been discussed as intermediates in the transformation from the OH- to the H-terminated surface, in the HER and as sites for the reduction of H2O2.38,40,43 Further reduction of the Ge–O2˙− and proton transfer leads to the second intermediate, Ge–OOH, observed in this work at slightly negative potentials. An alternative mechanism starting with the insertion of O2 into a Ge–H bond would directly lead to Ge–OOH bypassing the Ge–OO˙, which is inconsistent with the observations of this work. Based on the Ge-bound intermediates identified in the electrochemical ATR-IR experiments and on the mechanisms for the change in surface termination and HER,38,40 we propose the catalytic cycle as shown in Fig. 7. This mechanism includes the surface radical as a common surface active site in both ORR and HER, thus providing a coupling mechanism between the two reactions.
 | ||
| Fig. 7 Cycle with proposed mechanism for the ORR on Ge. Open bonds on the Ge atoms symbolize bonds to bulk Ge or other surface atoms. The radical species 1 has been proposed earlier,38,42 species 2 and 3 are identified in this work. Models for these and the respective vibrational modes are shown in Fig. 4(e) (2) and Fig. 4(c) (3). | ||
5 Conclusion
A summary of the vibrational modes observed, their assignment based on the evidence presented here and the TDM orientation is given in Table 3. In conclusion, the electrochemical ORR on Ge(100) in aqueous HClO4 proceeds via a stepwise mechanism transferring one electron at a time. The active radical species is generated initially by reduction of the surface, which subsequently reacts with O2. The first electrochemical reduction step therefore happens not at the molecule to be activated, but at the surface and is followed by a chemical reduction of oxygen. The presence of large concentration of such reduced surface sites may prove crucial for the activity of a surface towards the ORR. A surface-bound superoxide (Ge–OO˙) with a TDM at a tilt angle of (28 ± 10)° was detected as the main intermediate. The distinctly upright orientation implies that the superoxide is not bridging between different Ge atoms, not bound side-on to a single Ge-atom, and not dissolved. Rather, it is close to what is expected for the Pauling model.2 The surface concentration of superoxide increases at strongly negative potential until the surface is fully H-terminated. Especially before full H-termination, the surface-bound peroxide (Ge–OOH) with a similar orientation to the superoxide is generated at a higher rate than the rate with which it is consumed. Though this work does not address the role of structural defects, detailed experimental information on the ORR mechanism as presented here may help in future knowledge-based theory-guided design of improved catalysts and corrosion inhibition systems. Application of the methodology developed here to relevant oxides is currently under investigation.Acknowledgements
ThyssenKrupp Steel Europe is acknowledged by S.N. for a scholarship in the framework of the IMPRS-SurMat and by P.U.B. for a collaborative research project. The MPIE machine shop built the spectroelectrochemical cell used in the experiments.References
- J. P. Hoare, The Electrochemistry of Oxygen, Interscience, New York, 1968 Search PubMed.
- K. Kinoshita, Electrochemical Oxygen Technology, Wiley, New York, 1992, vol. 1117 Search PubMed.
- F. Cheng and J. Chen, Chem. Soc. Rev., 2012, 41, 2172–2192 RSC.
- I. E. L. Stephens, A. S. Bondarenko, U. Gronbjerg, J. Rossmeisl and I. Chorkendorff, Energy Environ. Sci., 2012, 5, 6744–6762 CAS.
- Y. Feng, A. Gago, L. Timperman and N. Alonso-Vante, Electrochim. Acta, 2011, 56, 1009–1022 CrossRef CAS.
- F. Jaouen, E. Proietti, M. Lefevre, R. Chenitz, J.-P. Dodelet, G. Wu, H. T. Chung, C. M. Johnston and P. Zelenay, Energy Environ. Sci., 2011, 4, 114–130 CAS.
- N. Ramaswamy and S. Mukerjee, Adv. Phys. Chem., 2012, 2012, 491604 Search PubMed.
- J. D. Wiggins-Camacho and K. J. Stevenson, J. Phys. Chem. C, 2011, 115, 20002–20010 CAS.
- E. M. Erickson, M. S. Thorum, R. Vasić, N. S. Marinković, A. I. Frenkel, A. A. Gewirth and R. G. Nuzzo, J. Am. Chem. Soc., 2012, 134, 197–200 CrossRef CAS.
- J.-M. Noël, A. Latus, C. Lagrost, E. Volanschi and P. Hapiot, J. Am. Chem. Soc., 2012, 134, 2835–2841 CrossRef.
- N. Lopez, D. J. Graham, R. McGuire, G. E. Alliger, Y. Shao-Horn, C. C. Cummins and D. G. Nocera, Science, 2012, 335, 450–453 CrossRef CAS.
- N. Anastasijevic, V. Vesovic and R. R. Adzic, J. Electroanal. Chem., 1987, 229, 305–316 CrossRef CAS.
- J. K. Nørskov, J. Rossmeisl, A. Logadottir, L. Lindqvist, J. R. Kitchin, T. Bligaard and H. Jónsson, J. Phys. Chem. B, 2004, 108, 17886–17892 CrossRef.
- Y. Wang and P. B. Balbuena, J. Phys. Chem. B, 2005, 109, 14896–14907 CrossRef CAS.
- T. Jacob and W. A. Goddard, ChemPhysChem, 2006, 7, 992–1005 CrossRef CAS.
- S. Walch, A. Dhanda, M. Aryanpour and H. Pitsch, J. Phys. Chem. C, 2008, 112, 8464–8475 CAS.
- J. S. Spendelow and A. Wieckowski, Phys. Chem. Chem. Phys., 2007, 9, 2654–2675 RSC.
- A. A. Gewirth and M. S. Thorum, Inorg. Chem., 2010, 49, 3557–3566 CrossRef CAS.
- H. S. Wroblowa, Y.-C. Pan and G. Razumney, J. Electroanal. Chem. Interfacial Electrochem., 1976, 69, 195–201 CrossRef CAS.
- B. B. Blizanac, A. C. Lucas, E. M. Gallagher, M. Arenz, N. P. Ross and M. N. Markovic, J. Phys. Chem. B, 2004, 108, 625–634 CrossRef CAS.
- X. Li and A. A. Gewirth, J. Am. Chem. Soc., 2005, 127, 5252 CrossRef CAS.
- T. Itoh, T. Maeda and A. Kasuya, Faraday Discuss., 2006, 132, 95–109 RSC.
- M. Shao, P. Liu and R. R. Adzic, J. Am. Chem. Soc., 2006, 128, 7408–7409 CrossRef CAS.
- J. Brooker, P. A. Christensen, A. Hamnett and R. He, Faraday Discuss., 1992, 94, 339–360 RSC.
- T. Itoh, K. Abe, K. Dokko, M. Mohamedi, I. Uchida and A. Kasuya, J. Electrochem. Soc., 2004, 151, A2042–A2046 CrossRef CAS.
- M. H. Shao and R. R. Adzic, J. Phys. Chem. B, 2005, 109, 16563–16566 CrossRef CAS.
- J. Kim and A. A. Gewirth, J. Phys. Chem. B, 2006, 110, 2565–2571 CrossRef CAS.
- Y. Ayato, K. Kunimatsu, M. Osawa and T. Okadaa, J. Electrochem. Soc., 2006, 153, A203–A209 CrossRef CAS.
- K. Kunimatsu, T. Yoda, D. A. Tryk, H. Uchida and M. Watanabe, Phys. Chem. Chem. Phys., 2010, 12, 621–629 RSC.
- C. Pettenkofer, I. Pockrand and A. Otto, Surf. Sci., 1983, 135, 52–64 CrossRef CAS.
- P. Vassilev and M. T. M. Koper, J. Phys. Chem. C, 2007, 111, 2607–2613 CAS.
- J. A. Keith, G. Jerkiewicz and T. Jacob, ChemPhysChem, 2010, 11, 779–2794 CrossRef.
- J. B. MacNaughton, L.-A. Naslund, T. Anniyev, H. Ogasawara and A. Nilsson, Phys. Chem. Chem. Phys., 2010, 12, 5712–5716 RSC.
- A. Gonchar, T. Risse, H.-J. Freund, L. Giordano, C. Di Valentin and G. Pacchioni, Angew. Chem., Int. Ed., 2011, 50, 2635–2638 CrossRef CAS.
- K. Bohnenkamp and H. Engell, Z. Elektrochem., 1957, 61, 1184–1196 CAS.
- A. W. Hassel and J. W. Schultze, Passivity of Metals, Alloys, and Semiconductors, in Encyclopedia of Electrochemistry, Volume 4, Corrosion and Oxide Films, ed. M. Stratmann and G. S. Frankel, Wiley-VCH, Weinheim, 2003, pp. 216–270 Search PubMed.
- K. Gong, F. Du, Z. Xia, M. Durstock and L. Dai, Science, 2009, 323, 760–764 CrossRef CAS.
- R. Memming and G. Neumann, J. Electroanal. Chem., 1969, 21, 295–305 CrossRef CAS.
- F. Maroun, F. Ozanam and J.-N. Chazalviel, J. Phys. Chem. B, 1999, 103, 5280–5288 CrossRef CAS.
- J.-N. Chazalviel, A. Belaïdi, M. Safi, F. Maroun, B. Erne and F. Ozanam, Electrochim. Acta, 2000, 45, 3205–3211 CrossRef CAS.
- F. Maroun, J.-N. Chazalviel, F. Ozanam and D. Lincot, J. Electroanal. Chem., 2003, 549, 161–163 CrossRef CAS.
- A. Maurer, W. Mindt and H. Gerischer, Surf. Sci., 1966, 4, 431–439 CrossRef.
- H. Gerischer and W. Mindt, Surf. Sci., 1966, 4, 440–451 CrossRef CAS.
- W. Brattain and C. Garrett, Bell Syst. Tech. J., 1955, 34, 129–176 Search PubMed.
- A. Erbe, http://home.arcor.de/aerbe/en/prog/spectraltools.html, 2012.
- E. Goormaghtigh, V. Raussens and J.-M. Ruysschaert, Biochim. Biophys. Acta, Biomembr., 1999, 1422, 105–185 CrossRef CAS.
- N. Harrick, Internal Reflection Spectroscopy, Harrick Scientific, 1987 Search PubMed.
- A. Erbe, R. J. Bushby, S. D. Evans and L. J. C. Jeuken, J. Phys. Chem. B, 2007, 111, 3515–3524 CrossRef CAS.
- G. Gonella, H.-L. Dai, H. C. Fry, M. J. Therien, V. Krishnan, A. Tronin and J. K. Blasie, J. Am. Chem. Soc., 2010, 132, 9693–9700 CrossRef CAS.
- P. Wenzl, M. Fringeli, J. Goette and U. P. Fringeli, Langmuir, 1994, 10, 4253–4264 CrossRef CAS.
- TURBOMOLE V6.2 2010, a development of University of Karlsruhe and Forschungszentrum Karlsruhe GmbH, 1989–2007, TURBOMOLE GmbH, since 2007; available from http://www.turbomole.com.
- A. D. Becke, Phys. Rev. A: At., Mol., Opt. Phys., 1988, 38, 3098–3100 CrossRef CAS.
- C. Lee, W. Yang and R. G. Parr, Phys. Rev. B: Condens. Matter Mater. Phys., 1988, 37, 785–789 CrossRef CAS.
- A. D. Becke, J. Chem. Phys., 1993, 98, 5648–5652 CrossRef CAS.
- F. Weigend and R. Ahlrichs, Phys. Chem. Chem. Phys., 2005, 7, 3297–3305 RSC.
- F. Weigend, Phys. Chem. Chem. Phys., 2006, 8, 1057–1065 RSC.
- F. Weigend, Phys. Chem. Chem. Phys., 2002, 4, 4285–4291 RSC.
- P. Deglmann, F. Furche and R. Ahlrichs, Chem. Phys. Lett., 2002, 362, 511–518 CrossRef CAS.
- P. Deglmann and F. Furche, J. Chem. Phys., 2002, 117, 9535–9538 CrossRef CAS.
- A. Klamt, J. Phys. Chem., 1996, 100, 3349–3353 CrossRef CAS.
- P. Sinha, S. E. Boesch, C. Gu, R. A. Wheeler and A. K. Wilson, J. Phys. Chem. A, 2004, 108, 9213–9217 CrossRef CAS.
- A. Klamt and G. Schuurmann, J. Chem. Soc., Perkin Trans. 2, 1993, 799–805 RSC.
- L. Bencivenni, R. Caminiti, A. Feltrin, F. Ramondo and C. Sadun, J. Mol. Struct. (THEOCHEM), 1992, 257, 369–403 CrossRef.
- A. Karelin, Z. Grigorovich and V. Rosolovskii, Spectrochim. Acta, Part A, 1975, 31, 765–775 CrossRef.
- C. I. Ratcliffe and D. E. Irish, Can. J. Chem., 1984, 62, 1134–1144 CrossRef CAS.
- T. Shimanouchi, Tables of Molecular Vibrational Frequencies Consolidated Volume I, National Bureau of Standards, Gaithersburg, 1972 Search PubMed.
- S. E. Lappi, B. Smith and S. Franzen, Spectrochim. Acta, Part A, 2004, 60, 2611–2619 CrossRef.
- P. A. Giguère and T. K. K. Srinivasan, J. Raman Spectrosc., 1974, 2, 125–132 CrossRef.
- T. M. Ramond, S. J. Blanksby, S. Kato, V. M. Bierbaum, G. E. Davico, R. L. Schwartz, W. C. Lineberger and G. B. Ellison, J. Phys. Chem. A, 2002, 106, 9641–9647 CrossRef CAS.
- K. M. Ervin, I. Anusiewicz, P. Skurski, J. Simons and W. C. Lineberger, J. Phys. Chem. A, 2003, 107, 8521–8529 CrossRef CAS.
- A. Weber and E. A. McGinnis, J. Mol. Spectrosc., 1960, 4, 195–200 CrossRef CAS.
- X. Li and A. A. Gewirth, J. Raman Spectrosc., 2005, 36, 715–724 CrossRef CAS.
Footnote |
| † Electronic supplementary information (ESI) available: Vibrational spectra of reference compounds and results of DFT calculations of Ge3 species. See DOI: 10.1039/c2cp43909c |
| This journal is © the Owner Societies 2013 |