
 Open Access Article
 This Open Access Article is licensed under a Creative Commons Attribution-Non Commercial 3.0 Unported Licence
Selective kinetic control of interfacial charge transfer reactions in Si-composite anodes for Li-ion batteries†
Emma A.
Cave
,
Tyson A.
Carr
and
Cody W.
Schlenker
 *
*
Department of Chemistry, University of Washington, Seattle, Washington 98195-1700, USA. E-mail: schlenk@uw.edu
First published on 23rd August 2024
Abstract
In this report, we demonstrate a strategy to selectively suppress reactions at unpassivated active material surfaces in silicon composite electrodes, mitigating the capacity-draining effects of continual electrolyte reduction in alloying-type anodes for lithium-ion batteries. Inspired by dipolar modification of electrodes for photovoltaic applications, we introduced conformationally-labile permanent dipoles at the electrochemical electrode interface to dynamically modulate charge transfer kinetics across the interface. Polyacrylic acid (PAA) binder modified with the dipole-bearing molecule 3-cyanopropyltriethoxysilane displays a 17% increase in capacity retention versus unmodified PAA binder. Differential capacity analysis shows a marked cathodic shift of ∼150 mV in overpotential in the pre-alloying voltage range following the initial solid electrolyte interphase (SEI) formation step. At the same time, we observe negligible shift in overpotential for reversible lithium-ion storage, consistent with selective modulation of irreversible reaction kinetics. Electrochemical impedance spectroscopy indicates that this modification results in a thinner SEI layer. Despite the improved performance, the charge transfer resistance of the half-cell is higher with the modification, suggesting some opportunity for improving the strategy. Time-resolved spectroelectrochemical analysis of desolvation kinetics in modified binders indicates that the modified binder has slower and less selective ion transport. We conclude that future iterations of this strategy which avoid disrupting the beneficial ionic transport properties of the binder would result in even greater performance enhancement. We propose that this may be accomplished by incorporating oligomeric dipolar modifiers, either in the binder or at the active material itself. Either way would increase the ratio of dipoles to PAA linking sites, thus avoiding the competing deleterious impacts on device performance.
1. Introduction
The growing prevalence of lithium-ion batteries (LIBs) has opened many new pathways to utilizing renewable energy. This growth has streamlined portable electronics, hastened vehicle electrification, and is now enabling a new wave of grid-connected battery energy storage systems.1 According to the International Energy Agency, LIBs will play a pivotal role in reaching net zero emissions by 2050.2 These practical applications make it increasingly compelling to continue to investigate methods of improving the cycle life of next-generation high-capacity conversion electrode materials. While the field has made substantial progress since its inception in the 1970s, projected increases in energy storage demand are steep, necessitating further study into next-generation materials with the potential to meet this demand.Since commercialization in the 1990s, devices with graphite anodes have dominated the LIB market. Graphite has relatively high energy density, delithiation potential near that of Li/Li+, and robust cycling stability,3–6 making it a reliable anode material. However, its moderately low theoretical specific capacity (372 mA h g−1) limits its ability to meet grid-scale storage demands. As a result, high-capacity alloying-type anode materials are garnering considerable attention as next-generation alternatives. Silicon in particular is a prime candidate due to its appropriate discharge voltage (0.4 V vs. Li/Li+) and high theoretical specific capacity (4200 mA h g−1).7 However, instability of Si electrodes is a significant roadblock for many commercial applications. Silicon anodes typically fade to 80% of nominal capacity (a typical end-of-life condition for electric vehicle batteries) in under 150 cycles.8,9 Thus, the technological challenge is to design a Si anode that can cycle with high stability such that it is a viable competitor to graphite.
Due to the alloying mechanism of lithium storage in Si, the active material expands by up to 360% at the highest degree of lithiation.7 This volume expansion is the primary source of capacity instability for silicon anodes, leading to detrimental effects through varied mechanisms, such as: mechanical failure of the electrode leading to electrical disconnection, stress-induced aggregation increasing lithium diffusion path lengths, irreversible reaction of Li+ with surface oxide to form Li2O, and continual formation of the passivating solid–electrolyte interphase (SEI), due to defects in the existing SEI induced by the stress of volume expansion.10–15 The current work primarily aims to address this continual SEI formation.
The SEI is a passivating layer formed on the surface of an electrode due to the electrochemical decomposition of electrolyte species under reducing potentials.16,17 An ideal SEI is one which is: (1) ionically conductive – allowing lithium ions to migrate through the layer, (2) electronically insulating – preventing continued irreversible electrochemical reduction of the electrolyte solution and excessive SEI layer growth, and (3) stable – not needing to continuously re-form to passivate the electrode.18
Si electrodes can form an ionically conductive, electronically insulating SEI, but volume expansion continually disrupts this SEI as the electrode is cycled. Volume expansion induces mechanical stress in the SEI layer, which may crack, exposing bare active material at the crack sites. Further electrolyte reduction occurs at these unpassivated defect sites. Over the course of many cycles, the SEI continues to grow thicker and infiltrate the bulk active material, increasing porosity and causing further excess SEI growth.15 This irreversibly consumes Li+ inventory and increases the internal impedance of the cell, causing cycling performance to decline rapidly.
Multiple strategies have been explored to address these issues including using nanosized Si,19 nanostructured Si,20 mixed Si/C electrodes,21 binder optimization,22,23 and slurry processing optimization to improve electrode mechanical and conductive properties.24–27 The Cui group have used Si/C and nanostructuring strategies in order to make silicon-encapsulating carbon-based secondary structures that do not change volume with lithiation/delithiation, allowing a stable SEI to be formed on the surface of the inactive secondary structure. This secondary structure physically denies solvent access to the active material, effectively halting capacity fade via excess SEI growth.28,29 In this paper we explore a unique alternative strategy for mitigating the continued SEI formation during cycling – rather than denying solvent access to the active material, we aim to dynamically modulate the interfacial charge transfer barrier, and thus the overpotential (and rate constant) for irreversible reactions, by installing electric field responsive dipolar chemical modifiers at the active material interface with the electrolyte.
A crucial requirement of our strategy is selectivity for modulating the interfacial potential barrier for the electrolyte reduction process. While making charge transfer slower across the whole electrode interface would be simple and would arrest undesirable irreversible reduction reactions, it would also halt lithium ion storage. Passivating the electrode as a whole is straightforward but defeats the purpose of a battery electrode. Thus, a method that selectively slows irreversible reactions is desirable. We hypothesize that this selectivity can be achieved by using dipolar modifiers that dynamically align to the uncompensated electric fields at SEI crack sites to tune the interfacial charge transfer barrier.
The barrier to charge movement across an interface is a function of the surface dipole. At native metal surfaces, a surface dipole is induced by charge redistribution locally at the interface. This interfacial dipole magnitude can be tuned by functionalizing the surface with moieties possessing a permanent dipole moment.30–32 This surface dipole electrostatically shifts, relative to the same surface without a dipole, the local vacuum level (Evac, the energy of an electron at rest just outside the interface) according to eqn (1) (in the simplest case):
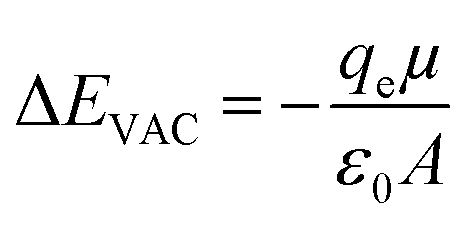 | (1) |
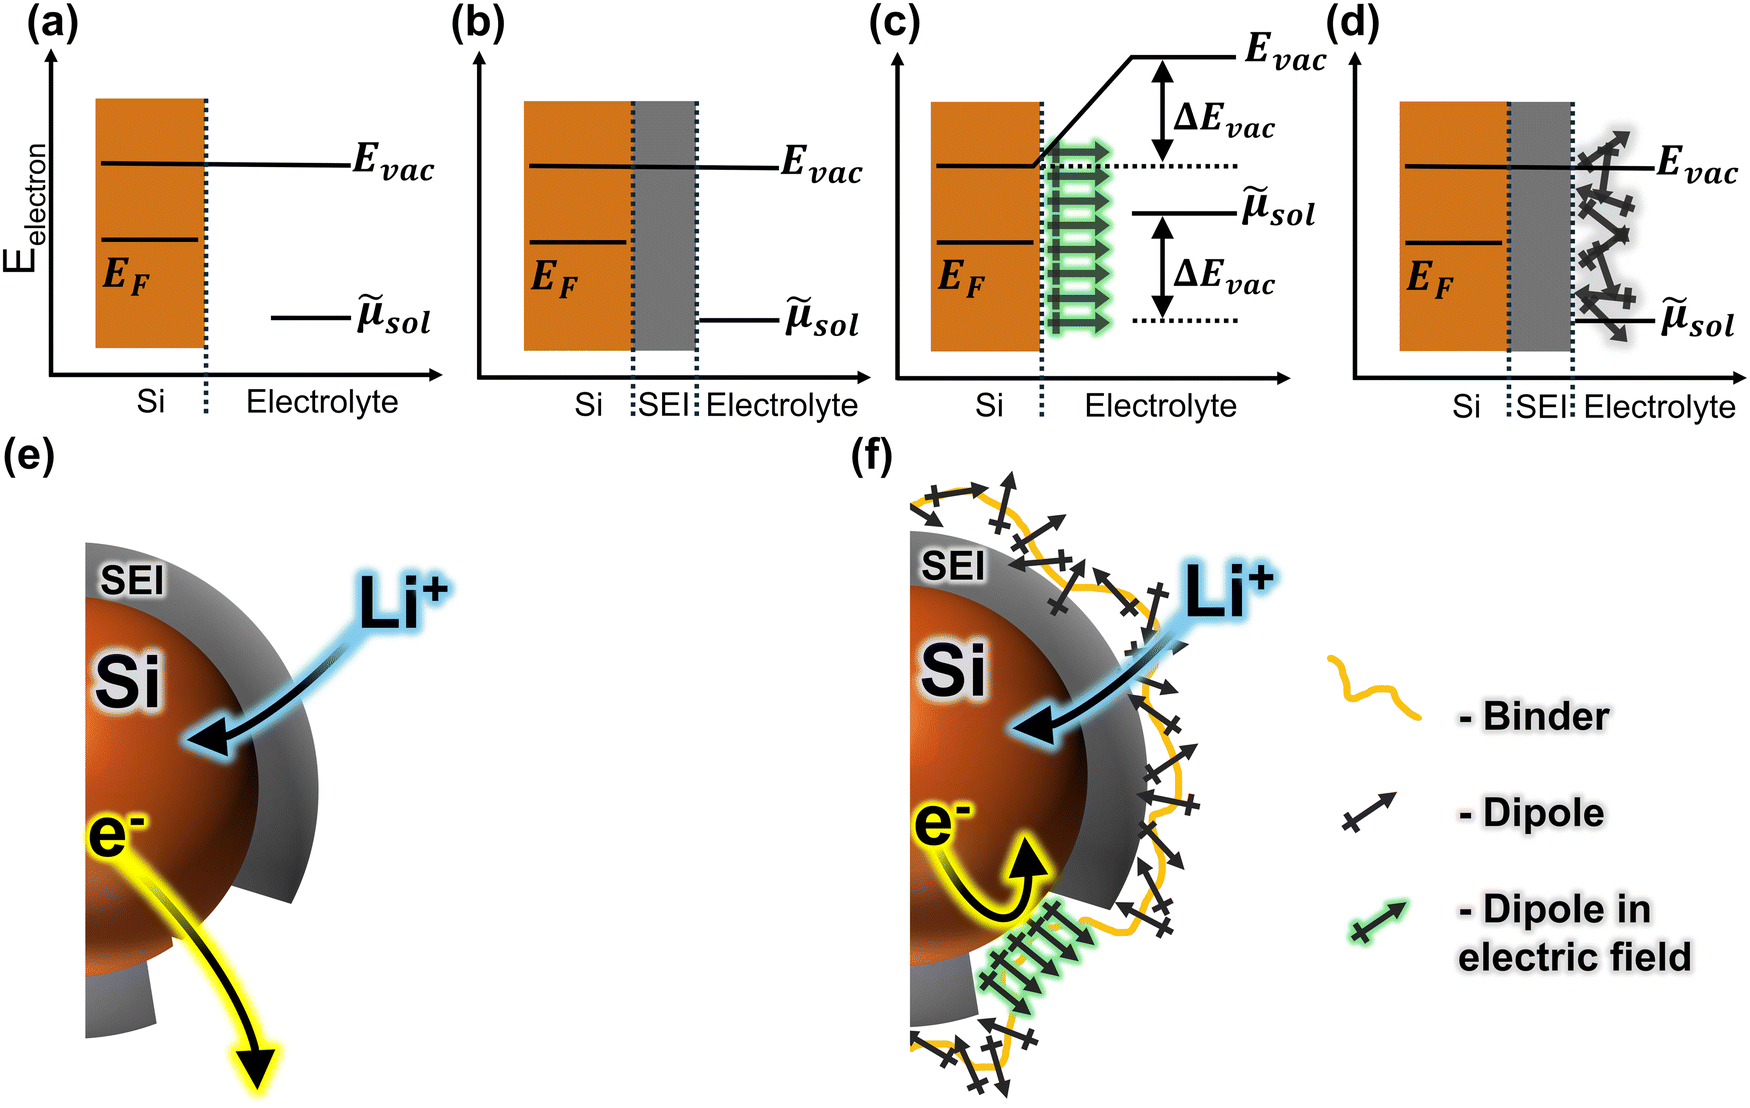 | ||
Fig. 1 Plots (a)–(d) illustrate the electronic energetics at the SEI (grey) vs. the defect sites with and without dipoles. Cartoons show a silicon particle (brown) without (e) and with (f) a layer of conformationally labile dipoles (black crossed arrows). Without a dipolar layer (e), there is little electric field at the surface of the SEI due to the ionic gradient across the SEI (b). At the defects, however, the field is large (a). Lithium-ions (blue) may traverse the SEI (b) and (e), but electrons (yellow) may not (curved arrows indicate movement of charge). At defect sites, either charged species may move between the electrolyte and the silicon (a) and (e). With a layer of conformationally labile dipoles (f), the field at the defects imparts a preferred orientation of the dipoles. This layer of aligned dipoles causes a shift in the vacuum level (Evac) and the electrochemical potential (![[small mu, Greek, tilde]](https://www.rsc.org/images/entities/i_char_e0e0.gif) sol) across this interface, modulating the kinetics of charge transfer across it (c) and (f). At the SEI interface with a layer of conformationally labile dipoles, however, there is little field, and therefore no preferred orientation for the dipoles (d) and (f). This leaves the vacuum level, and thus the charge transfer kinetics, unchanged from the no-dipole case (b). sol) across this interface, modulating the kinetics of charge transfer across it (c) and (f). At the SEI interface with a layer of conformationally labile dipoles, however, there is little field, and therefore no preferred orientation for the dipoles (d) and (f). This leaves the vacuum level, and thus the charge transfer kinetics, unchanged from the no-dipole case (b). | ||
Tuning interfacial charge transfer kinetics by engineering interfacial dipole characteristics is a well-established design strategy in the field of photovoltaics.33,34 As well as being used for photovoltaics, this strategy has been used in optical and electronic devices,30,33,35,36 and even to shift the potentials associated with chemical transformations.37–41 However, this approach is virtually unexplored as a means of tuning interfacial charge transfer kinetics in the field of rechargeable batteries. In a computational study in 2015, Leung and Leenheer proposed a version of such a strategy for Li-ion batteries, wherein reorientable permanent dipoles at an electrode interface are predicted to lower the potentials that solvent molecules experience at the electrode interface.42 To the best of our knowledge, no such strategy has been experimentally attempted as a method of improving LIB electrode material performance.
This lack of attention in the battery field is due in part to the fact that many of the characterization tools that are applied to photovoltaics rely on assessing interface field strengths using optical or spectroscopic characterization techniques, e.g. with the electronic Stark effect. While photovoltaics are typically amenable to such optoelectronic characterization due to their innate requirement for in situ optical access to the active materials, optical access to batteries is extremely challenging. This significantly impedes investigation and control of interfacial electronic structure in battery electrodes. A further complication is the tendency of battery electrode interfaces to evolve with use (whether by surface film deposition or active material phase change), making it intractable to retain a cleanly analyzable monolayer of surface modifier.
We propose a system in which the different electric field strengths at SEI defects vs. at intact SEI are taken advantage of to control local dipole orientations. At defects, the strong electric field imparts a preferred orientation to the dipoles, increasing the barrier for electrolyte reduction. This slows irreversible reactions and mitigates excess SEI formation (Fig. 1c and f). At intact SEI, the lack of electric field leaves the dipoles in a random orientation (because the interfacial field is already compensated by the ionic gradient across the SEI). Because there is no net dipole, the charge transfer barrier is unaffected, and ion movement through the SEI can proceed (Fig. 1d and f). Such spatially heterogeneous control of the charge transfer barrier would mitigate parasitic side reactions due to volume expansion and SEI fracture, while allowing lithium ions to be rapidly stored in the active material, resulting in high electrode cycling stability.
As a first attempt at applying this strategy to alloying electrodes, we report here a dipolar modification of a composite electrode system consisting of silicon nanoparticle active material, polyacrylic acid (PAA) binder, and conductive carbon additive. Rather than modifying the active material surface with a dipolar layer directly, we opted to modify the binder. This strategy was selected with the intent to accommodate the volume expansion that makes it intractable to tune the local electrostatics by tethering the modifier directly to the active material surface. To illustrate, consider the separation between two points on the surface of a deflated balloon as it begins to be inflated. As the balloon expands, the distance between the two points increases rapidly. Likewise, as a silicon particle expands, the distance between individual surface-tethered dipoles increases. That is, the net dipole moment per unit area decreases drastically, minimizing the effect on the interfacial energy levels (eqn (1)). We hypothesize that binder modification allows the active material to instead expand into a dipole-containing matrix as alloying proceeds. Thus, cracks that form in the SEI expose the active material surface to a layer of conformationally labile dipoles that can dynamically reorient to, compensate for, and nullify the spike in the local potential near the exposed electrode. This would lead to a higher barrier to electrolyte reduction, resulting in less excess SEI formation. Conversely, the ionic gradient that compensates the field across regions of intact SEI should suppress any local dipole reorganization at the SEI surface, since these covalently restricted moieties cannot penetrate into the SEI layer. Therefore, we anticipate that such a structure should present a barrier for electron injection from the exposed electrode active material to the electrolyte solution, without imposing barriers to Li-ion conduction across the SEI or the subsequent reversible insertion into the active material. This would change the overpotential for irreversible reaction at defect sites, while leaving the overpotential for reversible alloying largely unchanged.
Our model system in this work consists of PAA modified with 3-cyanopropyltriethoxysilane (CPTES), shown in Fig. 2. This polymer modification strategy is analogous to that for creating orientationally polarizable polymers for electronics applications, where addition of labile nitrile-bearing side chains has previously been demonstrated to increase polymer permittivity.43 This first attempt at dynamic electrostatic control of interfacial kinetics appears to have a significant positive effect on the cycle stability of the electrode. The evidence presented in the present work indicates that the chemical modification strategy which we employed is capable of selectively targeting parasitic reactions, increasing the capacity retention of the electrode. Using differential capacity analysis of modified electrodes, a more reducing overpotential is observed in the pre-alloying potential range in which electrolyte decomposition can occur, while we see no change in overpotential for lithium alloying reactions. We also conclude, based on nonpolar modifier controls, in situ vibrational spectroelectrochemical measurements, and post-mortem X-ray photoelectron spectroscopy (XPS) measurements of the SEI, that the ion-transport properties of the native binder are worsened by the method used to incorporate the dipolar modifier, offsetting some of the beneficial interfacial electrostatic effects of the modification. This suggests significant opportunities for further development of this strategy, potentially leading to even greater performance gains.
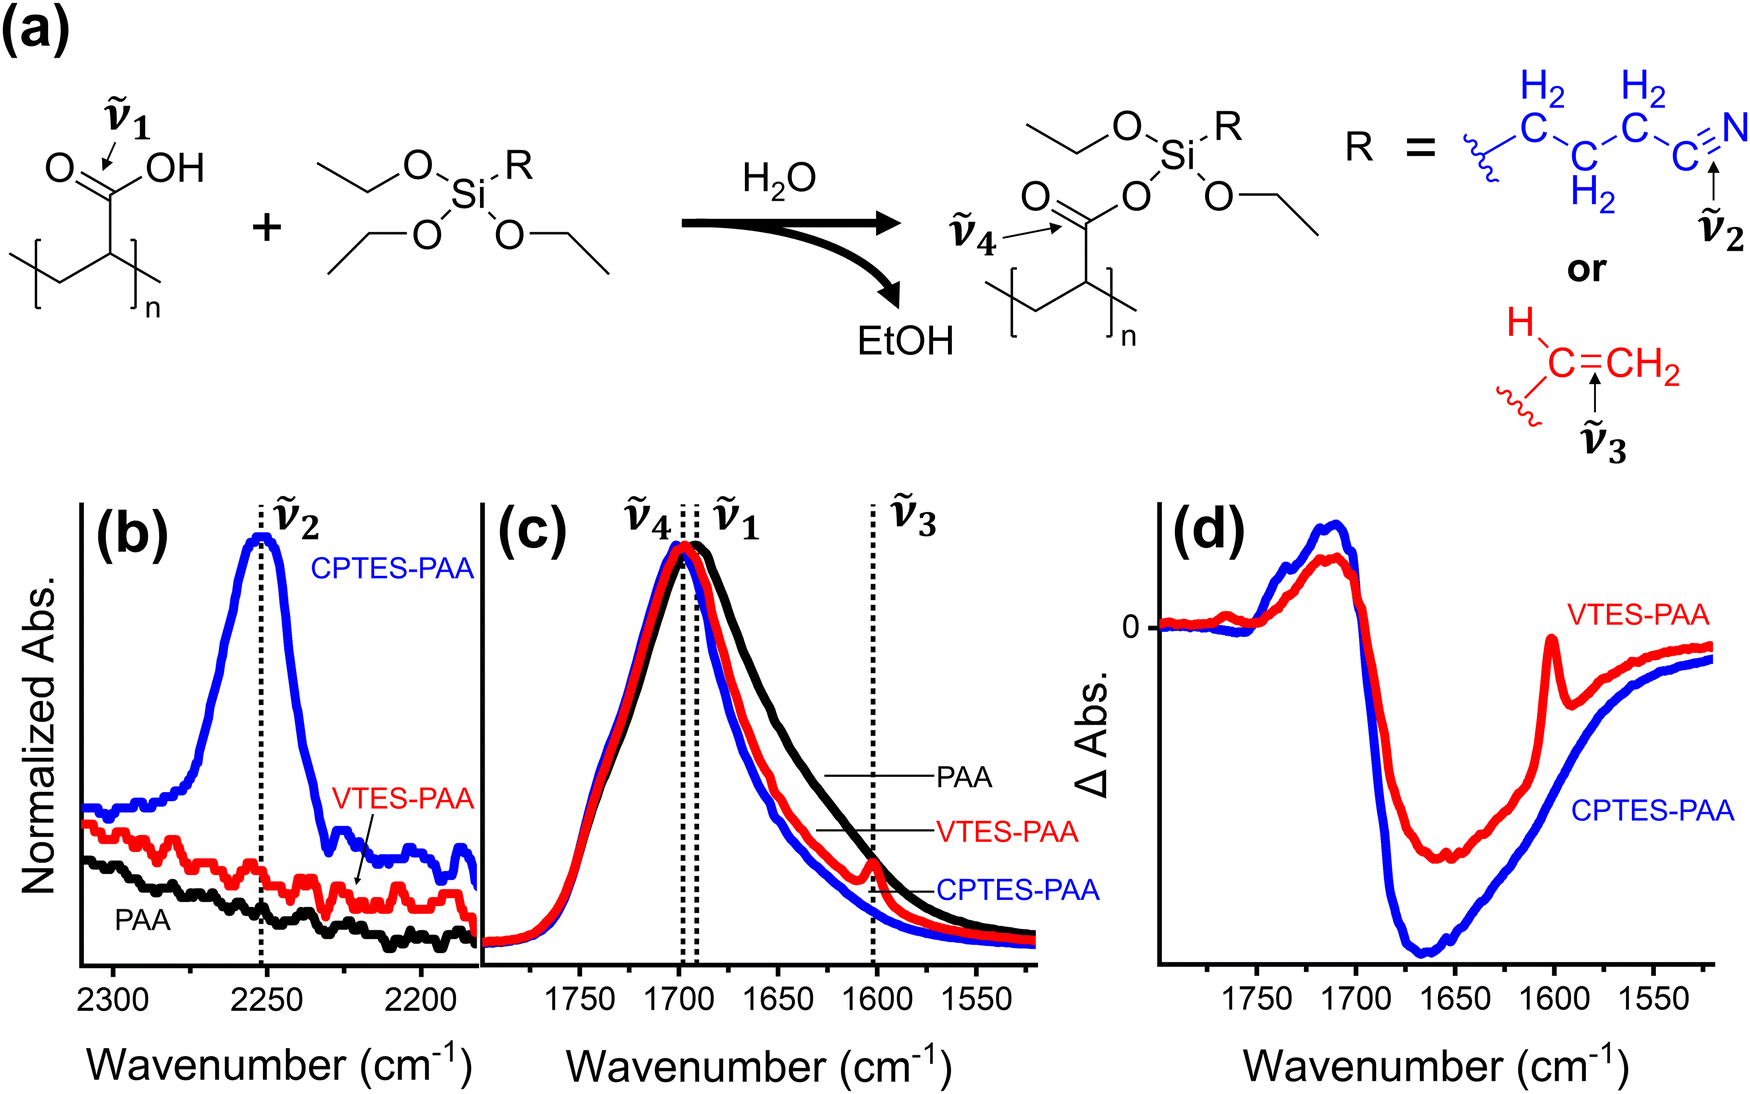 | ||
Fig. 2 (a) Reaction scheme of polyacrylic acid (PAA) with either 3-cyanopropyltriethoxysilane (CPTES) or vinyltriethoxysilane (VTES). Normalized (to the carbonyl stretch [between 1690 cm−1 and 1702 cm−1]) FTIR spectra of: nitrile stretch, ![[small nu, Greek, tilde]](https://www.rsc.org/images/entities/i_char_e0e1.gif) 2, (b), vinyl stretch, 3, carboxylic acid carbonyl stretch, 1, and silyl ester carbonyl stretch, 4 (c). Traces in (d) are difference spectra of modified binders minus PAA binder. For all plots, black traces correspond to PAA binder, blue to CPTES-PAA, and red to VTES-PAA. 2, (b), vinyl stretch, 3, carboxylic acid carbonyl stretch, 1, and silyl ester carbonyl stretch, 4 (c). Traces in (d) are difference spectra of modified binders minus PAA binder. For all plots, black traces correspond to PAA binder, blue to CPTES-PAA, and red to VTES-PAA. | ||
2. Methods
2.1. Materials
Dimethyl carbonate (anhydrous, ≥99%) (DMC), fluoroethylene carbonate (99%) (FEC), lithium metal ribbon (99.9% trace metals basis, 0.75 mm thickness), polyacrylic acid (average Mv ∼ 450![[thin space (1/6-em)]](https://www.rsc.org/images/entities/char_2009.gif) 000 g mol−1), and Whatman glass fiber separators (19 mm discs, grade gf/f) were purchased from Sigma-Aldrich. 3-Cyanopropyltriethoxysilane (97%) (CPTES) and vinyltriethoxysilane (97%) (VTES) were purchased from Gelest. Silicon nanoparticles (crystalline, APS ≤50 nm, 98%, laser synthesized from vapor phase) (SiNP) were purchased from Alfa Aesar. Ethylene carbonate (99%) (EC) was purchased from BASF. Conductive carbon (Vulcan XC72R) was purchased from Cabot Corporation. Silicon powder (150 nm, ≥99.9%) was purchased from MSE Supplies. Copper foil (9 μm thickness) was purchased from MTI Corporation. Lithium hexafluorophosphate (battery grade, dry, 99%) (LiPF6) was purchased from Oakwood Chemical. All CR2032 coin cell components were purchased from Pred Materials International. All reagents were used as received without further purification.
000 g mol−1), and Whatman glass fiber separators (19 mm discs, grade gf/f) were purchased from Sigma-Aldrich. 3-Cyanopropyltriethoxysilane (97%) (CPTES) and vinyltriethoxysilane (97%) (VTES) were purchased from Gelest. Silicon nanoparticles (crystalline, APS ≤50 nm, 98%, laser synthesized from vapor phase) (SiNP) were purchased from Alfa Aesar. Ethylene carbonate (99%) (EC) was purchased from BASF. Conductive carbon (Vulcan XC72R) was purchased from Cabot Corporation. Silicon powder (150 nm, ≥99.9%) was purchased from MSE Supplies. Copper foil (9 μm thickness) was purchased from MTI Corporation. Lithium hexafluorophosphate (battery grade, dry, 99%) (LiPF6) was purchased from Oakwood Chemical. All CR2032 coin cell components were purchased from Pred Materials International. All reagents were used as received without further purification.
2.2. Binder modification and electrode preparation
PAA was dissolved in deionized (DI) water at a concentration of 67 mg mL−1. The binder modification was performed by adding the neat silane (CPTES or VTES) into the PAA solution in a 1:1 weight ratio with PAA. This was stirred for around 6 hours at ambient temperature and then used immediately to prepare films or electrodes. Vibrational spectra of the films were taken with a Nicolet 8700 Fourier transform infrared (FTIR) spectrometer in attenuated total reflectance (ATR) geometry.
Silicon electrodes were prepared using mass ratios 8:1:1:X of silicon nanoparticles:conductive carbon:PAA:silane modifier. For unmodified binder X was equal to 0, while it was 1 for modified binders. In terms of total modified binder, the ratio in modified cells was therefore 7.3:0.9:1.8 (Si:carbon:modified binder). All components were mixed manually using a mortar and pestle for 7 minutes. The slurry was then doctor bladed by hand (roughly around ∼5 cm s−1) onto a copper foil substrate at a gap of 38 μm (1.5 mil) and dried on a hotplate set to 80 °C. Once dry (∼15 minutes), electrode discs were punched with a 15 mm diameter hole punch (177 mm2 nominal area) and cured in a vacuum oven at 100 °C overnight. Electrodes were then weighed and transferred to an argon-filled MBraun glovebox for use in half-cells. PAA electrodes averaged a total nominal mass loading of 4.1 ± 1.3 mg, while CPTES-PAA electrodes averaged 4.4 ± 1.9 mg.
Binder-only films were prepared for FTIR spectroscopy characterization by deposition on indium tin oxide (ITO) coated glass. ITO coated glass substrates were prepared with a consecutive washing protocol of 5 minutes in each of the following: soap + DI water, DI water, acetone, isopropyl alcohol. The binder solutions (PAA, CPTES-PAA, VTES-PAA) were coated onto the ITO slides using a tape mask (58 μm thickness) and a glass stir rod. These films were dried on a hot plate set to 80 °C and then cured in a vacuum oven at 100 °C overnight.
2.3. Coin cell assembly
Half-cells were assembled in an argon-filled Mbraun glovebox with O2 and H2O content both under 5 ppm. Briefly, the electrode, the glass fiber separator, and the plastic spacer were placed in the stainless-steel cup, consecutively. Then 150 μL of the electrolyte solution (1 M LiPF6 in 1:1 v/v EC:DMC, with 10% v/v FEC) was added dropwise onto the glass fiber separator to saturate it. The lithium foil counter and pseudo-reference electrode, stainless-steel spacer, stainless-steel spring, and stainless-steel cap were then added to complete the half-cell assembly. A crimper (MTI Corporation) was used to seal the half-cell. Note that lithium metal presents reactivity hazards in atmosphere, and LiPF6 in battery electrolyte may decompose to liberate small amounts HF, a potential safety hazard.
2.4. Electrochemical characterization
Galvanostatic cycling of prepared coin cells was performed with a MACCOR 4200 16-channel cycler at ambient temperature. Coin cells were typically cycled at C/20 from OCP to 0.01 V and back to 1.2 V (all potentials vs. Li/Li+) for a single formation cycle, and at C/10 between 1.2 V and 0.01 V thereafter. Capacity data was taken during cycling and differential capacity (dQ/dV) data was calculated from this. Differential capacity was calculated using a minimum of 5 mV between points to take the derivative. Power cycling tests on half-cells made using 150 nm SiNP were performed using the following protocol: one C/20 formation cycle, C/10 for 5 cycles, C/5 for 5 cycles, 1C for 5 cycles, 2C for 5 cycles, and C/10 thereafter.Electrochemical impedance spectroscopy (EIS) measurements of coin cells were performed using a Metrohm Autolab PGSTAT302N potentiogalvanostat in a two-electrode setup. A typical EIS experiment consisted of lithiating the anode at C/10 for ten minutes, and then letting the open circuit potential (OCP) relax until the change in OCP reached less than 1 mV h−1, then measuring the impedance spectrum (adapted from Ruffo et al.).44 This 10 minute lithiation step, equilibration, and measurement was repeated until a cutoff of 0.01 V (vs. Li/Li+) was reached during the lithiation step. Impedance measurements were made in the frequency range 100000 Hz to 0.1 Hz, with 10 measurement points per decade of frequency. The AC perturbation amplitude used was 3 mV to ensure pseudolinearity. Each impedance measurement at a given voltage was performed twice, the first in descending frequency order, and the second in ascending frequency order, to assess the integrity of the data. All measurements showed nearly identical impedance responses between the ascending and descending frequency order measurements (Fig. S2, ESI†).
2.5. In situ vibrational spectroscopy
In situ vibrational spectroelectrochemical measurements were performed using an FTIR spectrometer (Nicolet 8700) in ATR geometry and a potentiogalvanostat (Autolab PGSTAT302N). The ATR-FTIR experiments used a mercury cadmium telluride (MCT) detector with a spectral range of 650 cm−1 to 4000 cm−1, resolution of 2 cm−1 and averaging over 128 scans. Our custom-built air-free in situ electrochemical cell is described in previous work.45 The same electrolyte used for the coin cells (above) was used in this cell. Infrared light passes through the ATR element at an angle of around 60° and the resulting evanescent wave penetrates between roughly 500–3000 nm into the electrolyte layer in contact with binder only films, depending on the wavenumber.2.6. X-ray photoelectron spectroscopy
In an argon-filled Mbraun glovebox with O2 and H2O content both under 5 ppm, cycled electrodes were removed from coin cells, rinsed twice with 1 mL of neat DMC, dried on a hotplate set to 90 °C, and stored under Ar until ready for XPS surface analysis with a Kratos Axis-Ultra DLD spectrometer. Samples were exposed to atmosphere for no more than 5 minutes prior to measurement. A total of 5 spots per sample were analyzed, 2 of which were high resolution spectra to assess the binding environment. For these scans, the pass energy was 20 eV. Binding energies were all referenced to the C1s hydrocarbon peak at 285 eV.3. Results and discussion
3.1. Binder modification
Silane-based modification of PAA has been used as a strategy for cell improvement in the last several years.46,47 These modifiers are attractive because they offer the option for both binder crosslinking via the carboxylic acid group of the PAA and direct modification of the Si particles.46Fig. 2a illustrates the scheme for reaction between PAA and a triethoxysilane to form a silyl ester (Si–O–C![[double bond, length as m-dash]](https://www.rsc.org/images/entities/char_e001.gif) O), using two functional group options to compare dipolar vs. nonpolar modifiers. We chose two triethoxysilanes for this study based on their R-group polarity and vibrational activity: 3-cyanopropyltriethoxysilane (CPTES) and vinyltriethoxysilane (VTES). The R-group in CPTES has a dipole moment along the carbon–nitrogen triple bond axis, while the R-group in VTES is nonpolar.
O), using two functional group options to compare dipolar vs. nonpolar modifiers. We chose two triethoxysilanes for this study based on their R-group polarity and vibrational activity: 3-cyanopropyltriethoxysilane (CPTES) and vinyltriethoxysilane (VTES). The R-group in CPTES has a dipole moment along the carbon–nitrogen triple bond axis, while the R-group in VTES is nonpolar.
We use FTIR analysis to characterize the binder films modified with CPTES and VTES (referred to as CPTES-PAA and VTES-PAA respectively). First, we observe the appearance of the nitrile (2, 2255 cm−1, Fig. 2b) and vinyl (3, 1600 cm−1, Fig. 2c) vibrational signatures for CPTES-PAA and VTES-PAA48 respectively. Next, we expect to see a blue shift in the carbonyl stretch for the silyl ester (4, ∼1700 cm−1, Fig. 2c) relative to the carboxylic acid (1, 1691 cm−1, Fig. 2c).49Fig. 2c shows the normalized vibrational absorption spectra for the CO stretch in PAA, CPTES-PAA and VTES-PAA binder-only films. Taking the difference spectra of modified binder versus PAA-only binder (Fig. 2d) it is evident that there is a blue shift in the modified binders, indicating formation of silyl ester moieties. The CPTES-PAA and VTES-PAA CO vibrational stretch signatures exhibit similar blue shift magnitudes in the ΔA spectra, indicating that they are reasonable candidates for comparing the effect of chemically modifying the binder.
3.2. Electrochemical characterization of dipole-modified cells
To test our hypothesis, we compared half-cells made with the dipole-modified (CPTES-PAA) and unmodified (PAA) binders, using 50 nm silicon nanoparticle (SiNP) active material. We chose nanoparticles to test the influence of our dipolar modifier in a system that is already somewhat optimized for reasonable performance to highlight the realistic potential for improvement that our approach may offer. Using nanoparticles mitigates the cracking and fracturing of the particles themselves, which is important to ensure the modification environment stays intact.Over the course of 200 cycles, it is evident that CPTES-PAA cells show enhanced cycling stability compared to PAA cells (Fig. 3a). The CPTES-PAA cells have a 9% higher capacity retention than PAA cells at cycle 100, and 17% higher at cycle 200. We also note that the cycle one specific delithiation capacities are similar: 3730 mA h g−1 for PAA cells, and 3620 mA h g−1 for CPTES-PAA. The capacity retention difference is consistent with the hypothesis that incorporating a dipolar modifier improves cell stability.
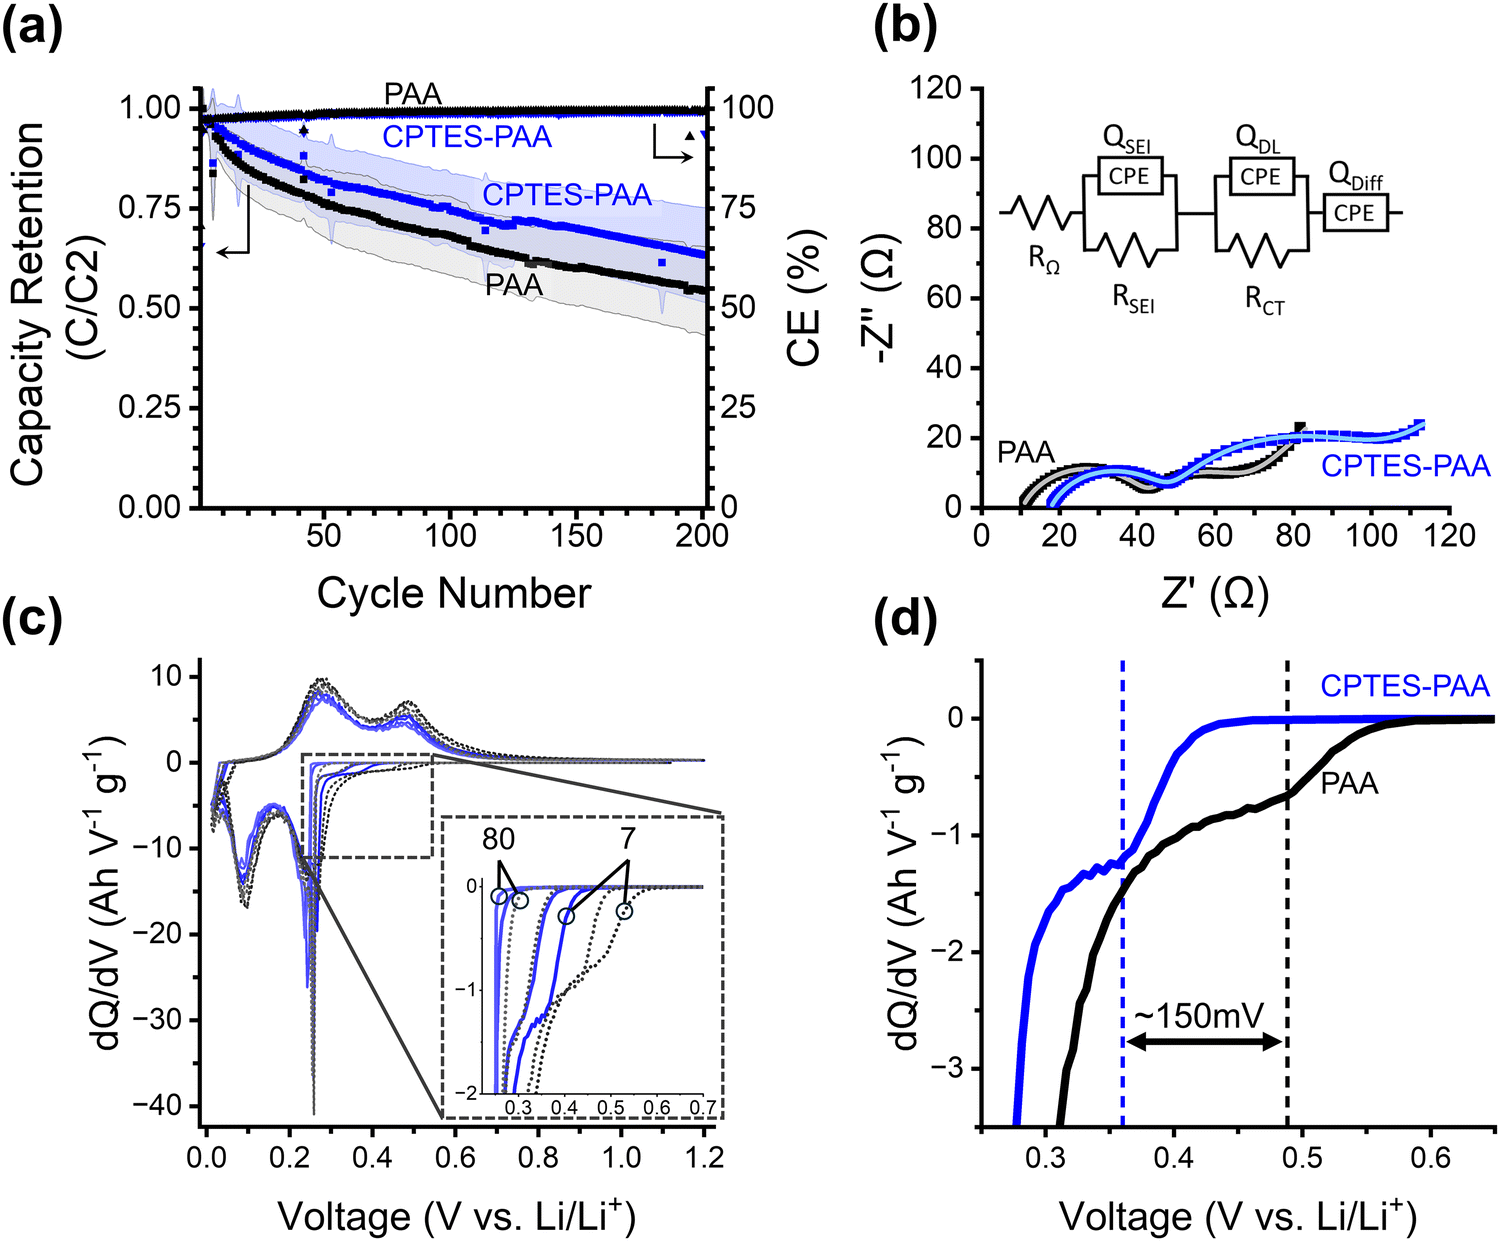 | ||
| Fig. 3 (a) Cycling performance for PAA and CPTES-PAA cells. On the left y-axis is silicon lithiation capacity retention (relative to the second cycle) of half-cells made using PAA (black) or CPTES-PAA (blue) binder. Shaded areas indicate error of 1 standard deviation. This data is the average over many cells cycled a different number of times: with 30/33 cells at cycle 1, 16/17 at cycle 100, and 10/13 at cycle 200 for PAA/CPTES-PAA cells (see Fig. S1, ESI†). On the right y-axis is coulombic efficiency (CE, ratio between lithiation and delithiation capacity). (b) Nyquist plot from half-cells after seven cycles using PAA (OCP before scan: 0.237 V) or CPTES-PAA (OCP before scan: 0.238 V) electrodes, the equivalent circuit model, and the equivalent circuit model fits (lighter colored lines). (c) Differential capacity (dQ/dV) of selected initial cycles (7, 15, 50, 80 from darker to lighter) for half-cells. PAA cells are black/grey dashed traces, CPTES-PAA cells are solid blue traces. (d) Magnification of dQ/dV of 7th cycle in pre-alloying potential range, showing overpotential for the shoulder. Vertical lines are provided as guides to the eye. | ||
To further investigate the influence of the dipole modification on the cell behavior, we turn to differential capacity (dQ/dV) analysis (Fig. 3c and d). As discussed above, we hypothesize that our modification strategy will serve to dynamically mitigate continued electrolyte reduction, while maintaining reversible lithiation. Differential capacity analysis reports on electrochemical activity over the range of potentials (V vs. Li/Li+) in the cycling procedure, with peaks corresponding to processes occurring during lithiation and delithiation. The overpotential at which we observe these peaks informs their assignment to specific processes.
We note that all four peaks corresponding to Si phase changes during lithiation (negative-going peaks at 0.25 V and 0.09 V) and delithiation (positive-going peaks at 0.3 V and 0.45 V) exhibit negligible shifts in overpotential when comparing CPTES-PAA to PAA. This suggests that our modification strategy has not substantially affected the processes of either lithiation or delithiation.
The primary difference in the differential capacity between PAA and CPTES-PAA cells is in the pre-alloying voltage range (0.27 V to 0.8 V) in the lithiation. Reactions occurring within this voltage window can be assigned to a variety of electrochemical processes, some of which are irreversible reduction reactions, while others reversibly store charge. Reduction of organic carbonate solvents on silicon electrodes can occur in this potential range.50,51 Electrochemical reduction of the native silicon oxide surface layer (which is present after electrode fabrication in our electrodes) with lithium also occurs in this potential range.52 With analysis of charge passed in this voltage range, Lucht et al. have also assigned features in this potential range to low-stoichiometries of silicon alloying (up to about Li0.99Si), a loss of which upon extended cycling was attributed to incomplete delithiation.53 However, performing a similar analysis with our cells yields qualitatively different results (Fig. S4, ESI†). Based on this variety of evidence, we posit that irreversible reactions comprise a significant portion of the dQ/dV response within this window.
In our cells, a small shoulder prior to the onset of the first lithiation peak (at 0.25 V) is typically present for both formulations. Schulze et al. observed a very similar feature and speculated that it may be due to processes at the electrode–electrolyte interface.54 Although the specific chemical nature of this shoulder is unclear, we use it as a marker for the overpotential in the pre-alloying potential range.
Using this marker, we observe that the overpotential for reactions in the pre-alloying regime in CPTES-PAA exhibits a significant cathodic shift compared to PAA (Fig. 3d). The magnitude of this shift is typically in the range of 50–150 mV during early cycles and decreases with extended cycling (Fig. 3c and d, also see Fig. S3, ESI†). A cathodic shift in the overpotential for reversible charge storage is expected to result in a decrease in capacity retention, but we instead observe an increase in capacity retention (Fig. 3a), indicating that the increased overpotential can be (at least in part) attributed to slowed irreversible reaction kinetics. Therefore, the observed shift in overpotential in the pre-alloying differential capacity suggests that the presence of the dipole modifier is correlated with a kinetic suppression of irreversible reactions.
It is crucial to note that, while we observe a shift in the overpotential for irreversible reduction reactions, the presence of the dipole modifier does not appear to significantly shift the overpotentials for reversible lithiation and delithiation for the Si active material. This insensitivity of the reversible ion storage overpotential, accompanied by a shift in overpotential for the irreversible reactions, is consistent with a randomized orientation of the ensemble of dipole modifiers along the surface of the intact SEI layer, and significant dipole alignment at SEI defect sites (as described above). This results in suppression of the irreversible reactions (which primarily occur at defects) relative to reversible alloying reactions.
While the improved capacity retention that we observe for our dipole-modified cells is consistent with our initial hypothesis, we employed electrochemical impedance spectroscopy (EIS) to evaluate the mechanistic role of these dipole modifiers in more detail. EIS spectra recorded for half-cells with an OCP of around 0.24 V vs. Li/Li+ after 7 cycles are represented in Nyquist plots in Fig. 3b and fit to the shown equivalent circuit.
For both modified and unmodified cells, a high-frequency semicircular feature and a lower frequency semicircular feature are observed, followed by a low-frequency linear regime with a positive slope (corresponding to the mass-transport limited behavior). The equivalent circuit comprises a solution resistance (RΩ) in series with a constant phase element (CPE) (to model the low-frequency diffusion) and two parallel R-CPE elements. Based on literature precedent, the higher frequency R-CPE element was assigned to the SEI impedance, and the lower frequency R-CPE element was assigned to the charge transfer impedance.55–57
The capacitance of the SEI layer (CSEI) is inversely proportional to the SEI thickness (dSEI)58,59 based on eqn (2):
 | (2) |
 | (3) |
 | (4) |
Based on the EIS equivalent circuit modeling parameters in Table 1, we calculate that CSEI is about two times larger for CPTES-PAA (4.80 μF) compared to PAA (2.29 μF). It should be noted that the translation of CPE parameters to a capacitance value has been performed by various methods in the literature.60–63 However, the approximately twofold difference in the value is obtained regardless of the method of calculation (see ESI†). These SEI capacitance values indicate that the CPTES-PAA electrode SEI is thinner than that of the PAA electrode (eqn (2)), assuming similar ε values between the cells. The observation that the CPTES-PAA cell exhibits a thinner SEI layer is consistent with the hypothesis that the dynamic response of the dipolar modifier acts to mitigate continued SEI growth.
| R Ω (Ω) | R SEI (Ω) | Q SEI (sn μΩ−1) | n SEI | C SEI (μF) | R CT (Ω) | Q DL (sn μΩ−1) | n DL | |
|---|---|---|---|---|---|---|---|---|
| PAA | 10.4 | 32.0 | 25.0 | 0.755 | 2.29 | 22.5 | 2630 | 0.754 |
| CPTES-PAA | 17.7 | 29.8 | 49.7 | 0.743 | 4.80 | 51.1 | 2990 | 0.718 |
The charge transfer impedance element consists of a charge transfer resistance (RCT) in parallel with a CPE (Qdl). The CPE represents a non-ideal electrical double layer at the active material–electrolyte interface. The value of RCT reports on the kinetics of the rate-limiting step in the charge transfer process. This rate-limiting step may be assigned to the desolvation of Li-ions at the electrode interface.64,65 In the case of our electrodes, we observe that, after 7 charge/discharge cycles at C/20, CPTES-PAA cells have a significantly higher RCT value (51.1 Ω) than PAA cells (22.5 Ω). This variation in RCT values would indicate that the rate-limiting step for charge transfer, likely the desolvation, is slowed in the CPTES-PAA case when compared with the PAA case. As we discuss below, these slower desolvation kinetics may have detrimental effects on the cycling performance of the cell, despite the improved overall performance observed.
While the cycling, differential capacity, and SEI capacitance analyses above support our hypothesis, it is unlikely that the only effect our modification would have on the electrode performance is the electrostatic effect. The material introduced to the cell is not many ideal dipoles – it is many molecules, with a potentially much broader array of effects. The difference in RCT indicates this is the case. In the next section, we describe experiments and analysis that we conducted to better understand the origins of both the capacity retention enhancement and of the variations we observe in the charge-transfer kinetics, and discuss possible avenues to improve upon this strategy in the future.
3.3. Competing effects on electrochemical performance
We explained previously why we elected to incorporate our electrostatic modifier by chemically tethering it to the binder material – to attempt to accommodate the volume expansion of the active material. While we have shown thus far that this modification appears to improve the cycling performance of our cells, the chemistry that we used in our approach also changes the chemical nature of the PAA binder. It has been demonstrated that high loadings of silane-based binder additives can have an adverse influence on the mechanical properties of the binder, making the electrodes brittle and unable to withstand the strain of volume expansion and contraction.46 It has also been demonstrated that the ion-transport characteristics of the PAA binder are dependent on the extent of the native polyether network,66 which may be disrupted by the silane-based modification. As such, we studied the effects of incorporating a modifier that we could chemically tether to the binder using the same silane chemistry but where the dipolar functional group was replaced with a non-polar functional group. Our aim here was to clarify whether the chemical and mechanical effects of the silane-based modification, which we anticipated would negatively impact the cell stability, can be separated from the beneficial dynamic electrostatic effect of the dipolar moiety.To clarify the role of any possible detrimental mechanical or chemical effects of the modifiers, we introduced two stressors to the cells incorporating dipolar and non-dipolar modifiers. First, we fabricated new devices using Si nanoparticles with a larger diameter (150 nm) to exacerbate the adverse effects of volume expansion. This larger particle size was selected since it is the critical diameter over which the Si particles crack and fracture upon first lithiation, leading to particle pulverization.19 This allows for more pronounced SEI cracking, exaggerating any differences in mechanical performance between modified and unmodified cells, while allowing the particles themselves to stay intact, due to being smaller than the critical diameter. The second stressor was to subject the cells to a cycling rate test, to evaluate if the kinetic difference indicated by the difference in RCT would be exacerbated by increasing the rate. This allows us to compare the device performance under kinetic stress (Fig. 4a), as well as long term cycling performance after both stressors have been applied (Fig. 4b).
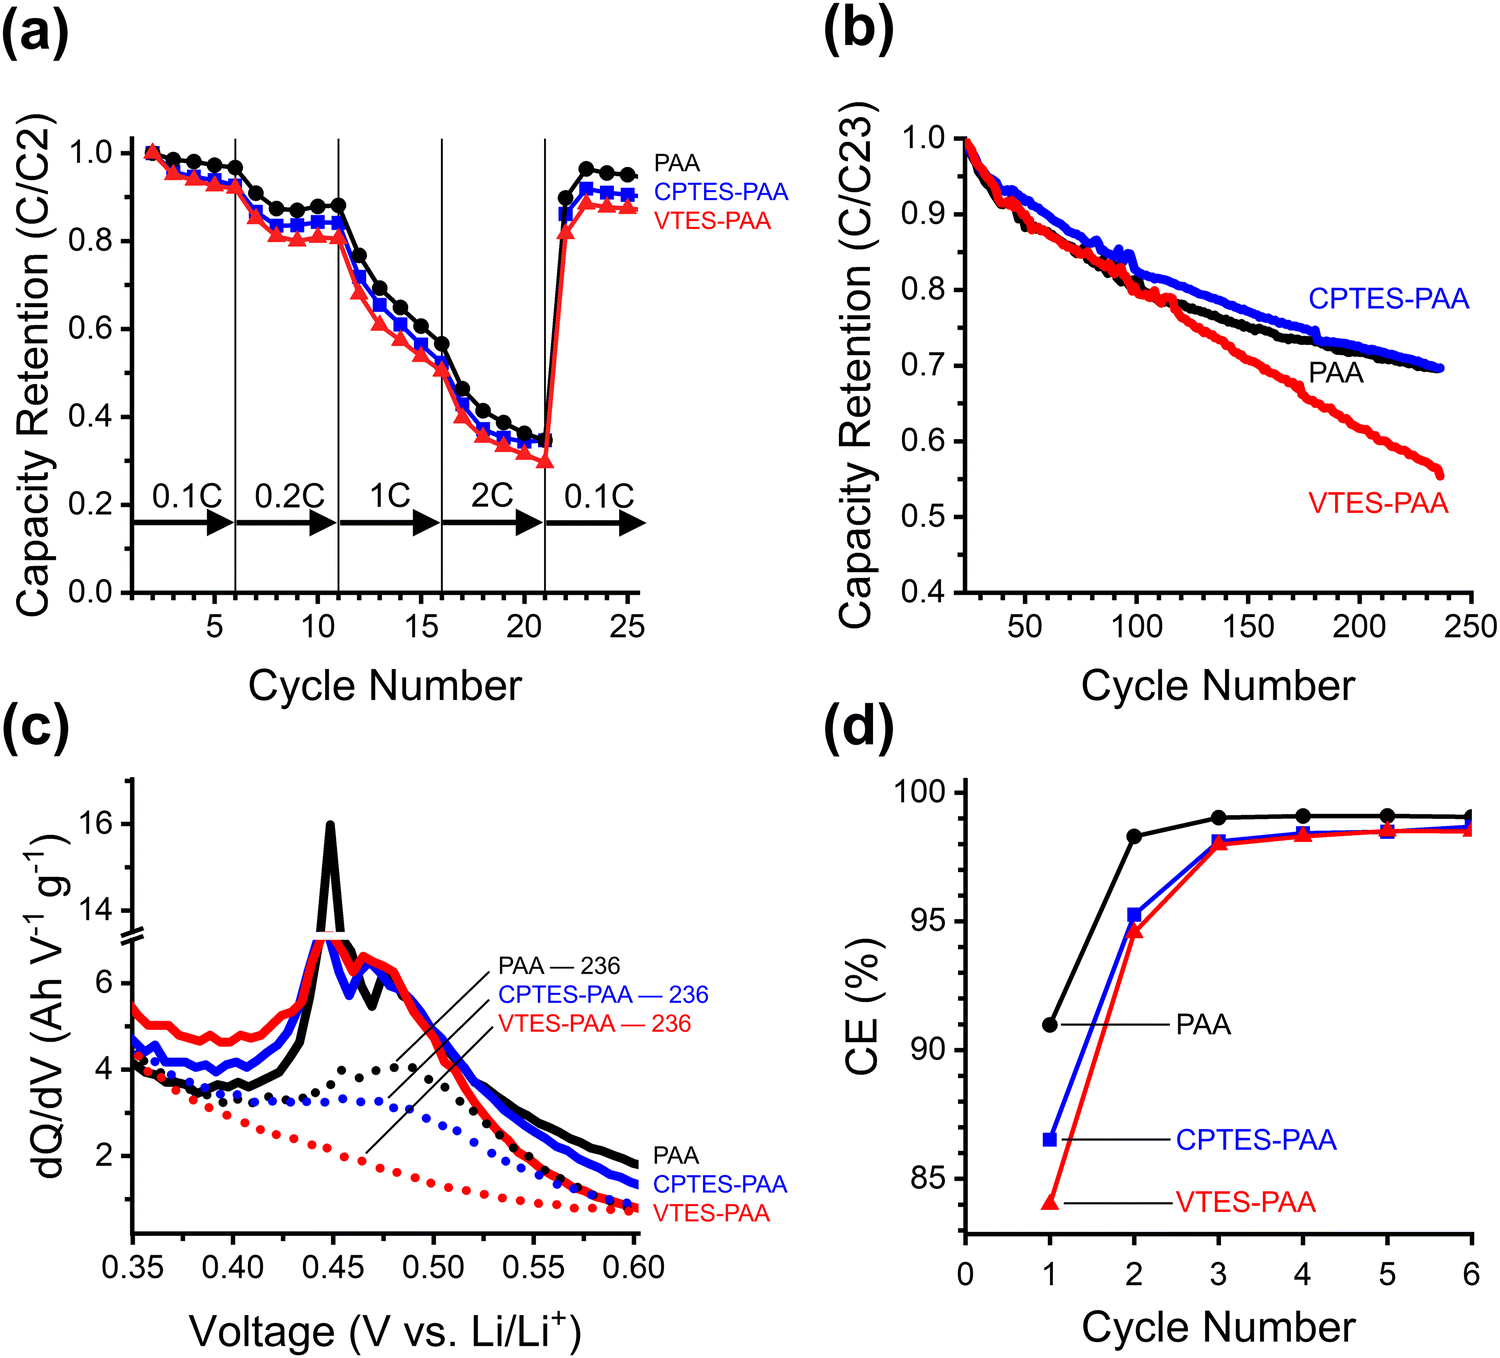 | ||
| Fig. 4 Data corresponding to half-cells made with 150 nm SiNPs, using PAA (black), CPTES-PAA (blue), and VTES-PAA (red) binders. (a) Power cycling test after one C/20 formation cycle. (b) Capacity retention normalized to the 23rd cycle (2nd C/10 cycle after rate test) to monitor the stability of the cells after kinetic stress. (c) 2nd delithiation peaks in the dQ/dV at cycle 36 (solid) and cycle 236 (dotted). (d) CE of the first six cycles. | ||
The kinetic differences between unmodified (PAA), dipole-modified (CPTES-PAA) and nonpolar-modified (VTES-PAA) 150 nm SiNP cells are assessed from the rate test data presented in Fig. 4a. The rate test shows that the cells with modified binders perform somewhat worse than with unmodified PAA. This indicates that there is an unintended side effect of modification that negatively affects the kinetics of reversible charge storage.
To test the capacity retention of these stressed cells, we cycled them for over 200 cycles after running the initial rate capability test. The capacity retention normalized to cycle 23 (the second cycle at C/10 following the rate capability test) is shown in Fig. 4b. The coulombic efficiency profiles for the first six cycles are plotted in Fig. 4d. The nonpolar-modified cell (VTES-PAA) performs the worst of the three cases. This supports the hypothesis that the high modifier loading used causes detrimental mechanical or chemical effects and leads to poor cycling stability. After the rate capability test, the dipole-modified cells (CPTES-PAA) show a modest improvement in capacity retention compared to unmodified (PAA). However, the capacity retentions converge at later cycles. The marked improvement of CPTES-PAA versus VTES-PAA seems to suggest that the beneficial electrostatic effects of the dipole modification are enough to more than overcome the detrimental effects of silane-based modification at early cycles. However, with this larger active material particle size, evidently incorporating the dipolar moiety by chemically modifying the binder leads to overall worse performance at later cycles.
While this evidence indicates that the influence of the dipole is significant enough to overcome the detrimental effects at lower C-rates and early cycles, it does not give mechanistic insight into the precise origin of those detrimental effects. To clarify the mechanism, we analyzed the differential capacity and rate test data. The differential capacity plot in Fig. 4c shows the last delithiation stage of the discharge process. The combination of a sharp and a broad peak around 0.45 V vs. Li/Li+ is the final stage of delithiation from the crystalline silicon phase.67 The disappearance of this peak between cycles 36 (solid traces) and 236 (dotted traces) in the VTES-PAA cells suggests that delithiation of this phase is decreased due to continued SEI growth.53 While this peak decreases in magnitude for CPTES-PAA, it does not completely disappear, as is the case for VTES-PAA. This suggests that the SEI growth for VTES-PAA is much more drastic than CPTES-PAA or PAA, supporting our hypothesis that the silane-based modification can engender detrimental effects.
We expected that the silane-based modification of the binder would affect the electrolyte transport properties of the binder, which would in turn affect the SEI formation and device performance.66 In order to further explore the underlying mechanism and potential chemical origin of the capacity fade that appears to accompany the silane-based modification of the binder in this system, we employed in situ vibrational spectroelectrochemistry as a tool to monitor the relative ion desolvation kinetics in each binder, discussed in the next section.
3.4. In situ spectroelectrochemical binder analysis
In 2021, Martin et al. showed that during curing, PAA undergoes a decarbonylation reaction to form an interchain polyether network.66 Devices with the interchain polyether network (unmodified PAA binder) were observed by the authors to show faster SEI stabilization than devices in which the formation of an interchain polyether network was intentionally disrupted. The authors concluded that this interchain polyether network acted as a selective membrane for lithium ions that limits carbonate solvent transport to the active material surface and promotes Li-ion desolvation prior to transport through the binder. We hypothesized that our chemical modification could be disrupting the formation of this native interchain polyether network due to the formation of silyl ester groups (Fig. 2) from the carboxylic acid groups rather than ion-conductive ether linkages. We note that directly evaluating the polyether network by FTIR was not possible due to overlapping silane signals in the 1050 cm−1 region of the spectrum where those ether signals are (Fig. S8, ESI†).To evaluate the role that binder modification with silyl esters may have in worsening device performance with our modified electrodes, we employed in situ FTIR spectroelectrochemistry to probe the kinetics of ion desolvation with an applied cathodic potential (−1 V vs. OCP). Analysis of these kinetics can indicate whether our silane-based modification method is modulating the electrolyte transport to the active material, and thus the rate of parasitic reactions. To simplify analysis and assess how electrolyte transport properties vary with modification, we performed these measurements on binder-only films. Comparing binder-only films allows us to evaluate the propensity of the Li-ion to readily associate with the binder vs. the electrolyte solvent.
For our FTIR analysis, we will focus on the C–O stretching region to monitor the vibrational reporters for Li-ion solvating and free (not in the solvation shell) EC (∼1202 cm−1 and ∼1158 cm−1 respectively) (Fig. 5a).68 These signatures will be referred to as EC-Li and EC-Free. We focus on the EC signatures since EC is the primary species in the inner solvation sheath of Li+.64Fig. 5a shows the difference in intensity compared to intensity prior to the application of a cathodic potential for PAA films. An increase in the (negative) amplitude of the EC-Li signature in the difference spectrum indicates a loss of solvating EC, and an increase in the (positive) amplitude of the EC-Free signature indicates a gain of free EC. The dynamics of these peaks report on the kinetics of the desolvation process as a constant potential is applied.
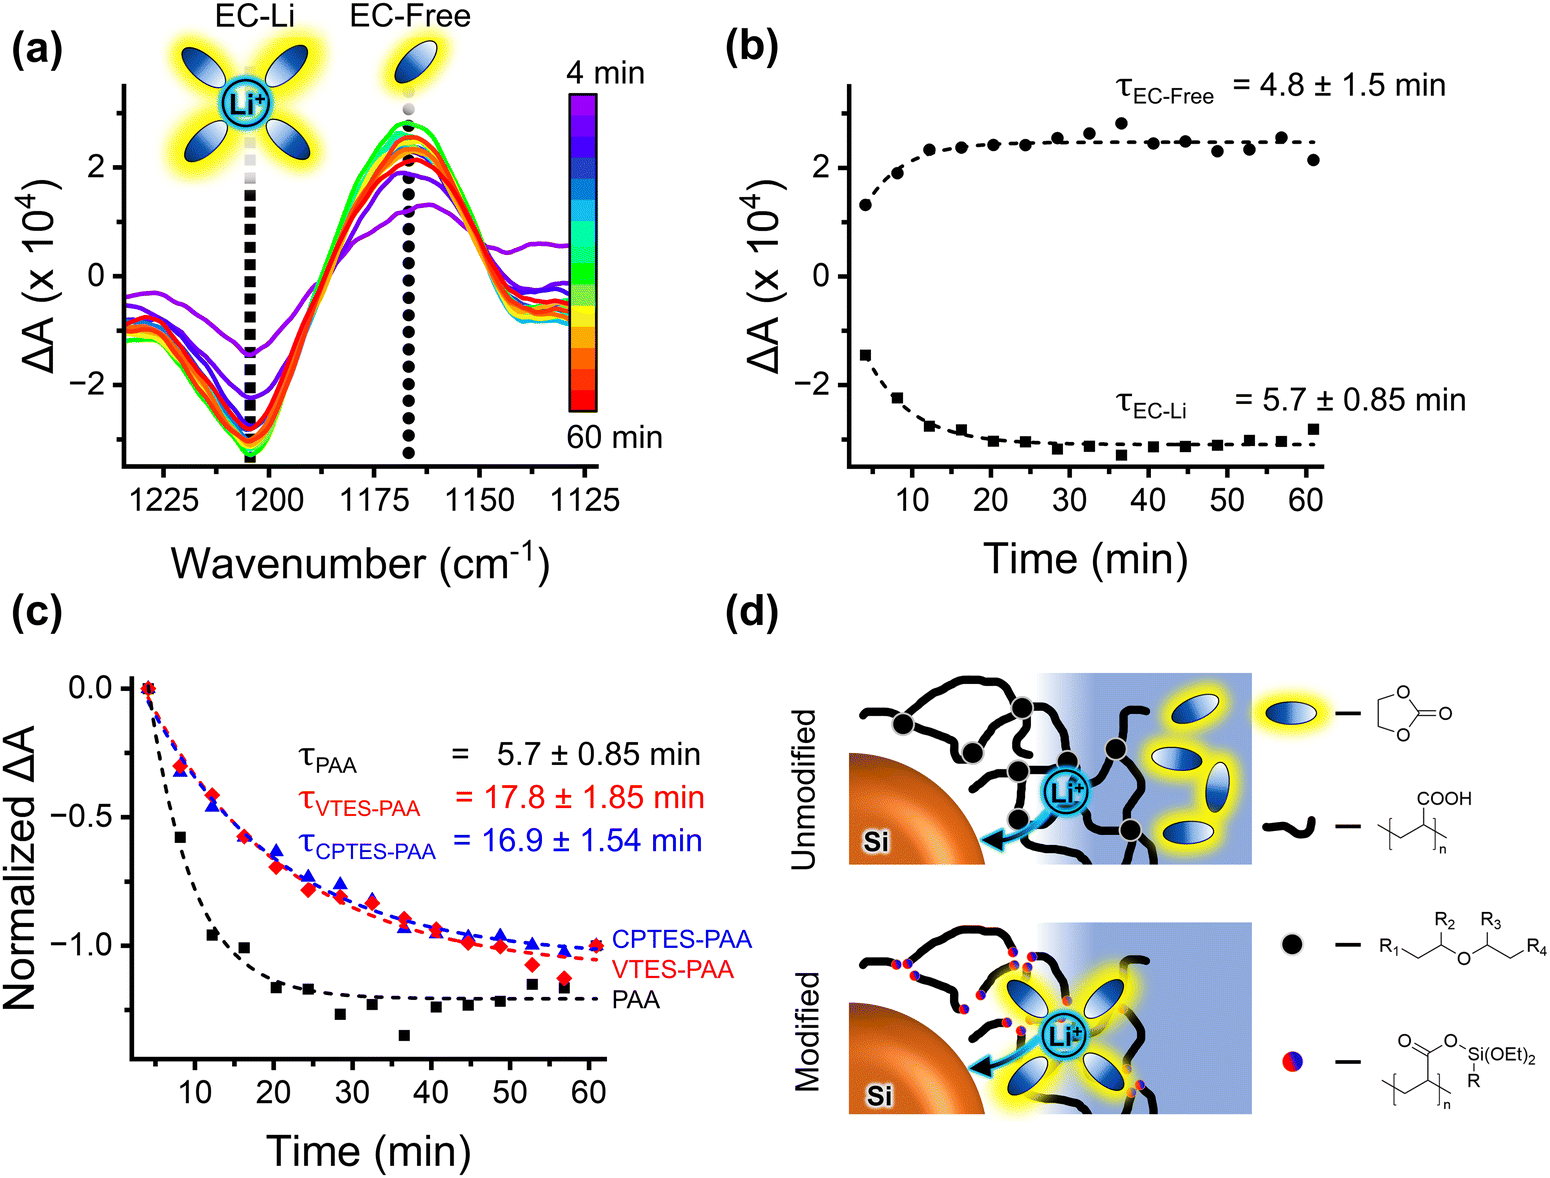 | ||
| Fig. 5 (a) Time sequence in situ spectroelectrochemical FTIR absorbance difference (ΔA) spectra for binder-only PAA film in 1 M LiPF6 in 1:1 EC:DMC (with 10% FEC) during −1 V (vs. OCP) polarization for one hour. Spectra collected every 4 minutes. Spectral window shows C–O stretch for free and Li-coordinated EC (∼1202 cm−1 and ∼1158 cm−1, respectively). Negative going peaks indicate a diminished concentration of the corresponding species and positive going peaks indicate increased concentration. (b) EC-Li (∼1202 cm−1) decay and free EC (∼1158 cm−1) growth exponential fits for PAA film, with fitted time constants (τ). Time constants are specific to the measurement geometry, not indicative of absolute kinetics. (c) Normalized EC-Li (1202 cm−1) decay for PAA (black squares) compared against CPTES-PAA (blue triangles) and VTES-PAA (red diamonds). Dashed lines indicate exponential fit with corresponding τ. (d) Cartoon illustrating the qualitative difference in electrolyte transport in silane-modified vs. unmodified PAA. In unmodified PAA, there are carboxylic acid chains (heavy black lines) with some degree of ether crosslinking (black dots [R1, R2, R3, and R4 represent PAA chains of varying lengths]), and Li+ is transported through this binder without EC (black and blue ovals). In modified binder, ether crosslinkages are replaced by silyl ester substituents (blue/red dots, R in the structure is either the cyanopropyl group of CPTES or the vinyl group of VTES), and Li+ is transported more preferentially while solvated by EC. | ||
To quantify the kinetics, the intensities corresponding to the two EC species were fitted to exponentials. These fits of the ΔA for the growth of EC-Free and decay of EC-Li over 60 minutes of applied cathodic potential and their corresponding time constants (τ) are shown in Fig. 5b for PAA. Fig. 5c shows the exponential fits to normalized ΔA and corresponding time constants for the decay of EC-Free for PAA, CPTES-PAA, and VTES-PAA. It is evident that the decay of EC-Free occurs more quickly for unmodified PAA (τ = 5.7 ± 0.85 min) compared to modified CPTES-PAA (τ = 16.9 ± 1.54 min) and VTES-PAA (τ = 17.8 ± 1.85 min). This is consistent with a binder that favors transport of solvated, rather than bare, lithium ions, as discussed above (Fig. 5d).
We note that, for CPTES-PAA and VTES-PAA, the EC-Free growth time constants do not match well with the corresponding EC-Li decay time constants. This, along with the spectral differences from the unmodified binder (visible in the EC-Free wavenumber region in Fig. S5, ESI†), indicates that EC-free and EC-Li are not the only two EC speciations in the modified binders. We speculate that there may be a vibrationally distinct species corresponding to EC coordinating to the modified binder, which is not necessarily captured in this analysis, and is beyond the scope of this report.
These findings indicate that our modification of the PAA binder does diminish its ion-selectivity, allowing solvated (rather than unsolvated) lithium ions to migrate through the binder to the active material, as illustrated in Fig. 5d. This will translate to an increase in the flux of solvent to the active material surface, providing a higher concentration of solvent which can undergo irreversible reduction reactions, thus increasing the overall rate for those reactions. It also has the effect of slowing the rate-limiting step in reversible charge transfer (consistent with the charge-transfer resistance analysis previously discussed), reducing the rate capability of the electrode.
To support this interpretation of the spectroelectrochemical data, we analyze the first six cycles (cycle 1 – formation cycle at C/20, cycles 2–6 – C/10) (Fig. 4d) of the 150 nm SiNP cells. The lower initial CE for CPTES-PAA (86.5%) and VTES-PAA (84.0%) compared to PAA (91.0%) suggests a significant increase in the extent of irreversible electrochemical processes during the formation cycle when the binder is modified with silanes.
Importantly, we note that the CE stabilizes more rapidly for unmodified PAA, indicating that silane-based modification of the binder may negatively influence SEI stabilization by disrupting the PAA interchain polyether network. In other words, in the case of our CPTES-PAA cells, when we have incorporated a dipole modifier which helps to electrostatically stabilize the electrode, it appears that the chemical approach that we have used to install the dipole modifier may inadvertently lead to a competing effect which concurrently acts to destabilize the SEI formation. The detrimental effect appears to take precedence at early cycles and at late cycles, while in between the beneficial electrostatic effect of the dipole is dominant. In the case of our VTES-PAA cells, where there is no electrostatic stabilization, we observe only the deleterious effect of the silane-based modification, and the capacity retention of these cells rapidly drops.
3.5. Ex situ XPS analysis of SEI
X-ray photoelectron spectroscopy (XPS) analysis of the SEI formed in 50 nm SiNP cells is consistent with this spectroelectrochemical analysis. It has been shown that FEC has much less affinity for Li+ than EC and DMC, and thus the solvation shell of Li+ will contain only a small amount of FEC.69 Therefore, if the modified binder preferentially transports solvated Li-ions to the active material surface, then the reactions that occur to form the SEI will be less likely to involve reduction of FEC (as a minor component of the solvation shell). Generally, SEI layers formed on silicon with FEC additive are observed to have greater stability, and greater fluorine content.70–72 XPS analysis of the elemental composition of electrodes (fabricated with 50 nm SiNPs) removed from cells following cycle seven indicates that CPTES-PAA cells have less than half the fluorine content of PAA cells (Fig. S6, ESI†), indicating preferential access of non-fluorinated solvent to the active material surface.This is further supported by the speciation of the detected fluorine (Fig. 6). In the F 1s spectrum (Fig. 6a) for PAA cells, there is only a peak at 684.9 eV, corresponding to LiF, and a very small shoulder at 686.9 eV, which has been assigned to LixPFyOz.69,71 In CPTES-PAA cells, however, the peak at 686.9 eV is much more prominent relative to the 684.9 eV peak. The presence of FEC in the initial electrolyte has been shown to suppress the 686.9 eV peak in the resultant SEI.72 The peak corresponding to LiF is also much smaller in CPTES-PAA than in PAA cells. These findings are consistent with decreased access of FEC to the active material.
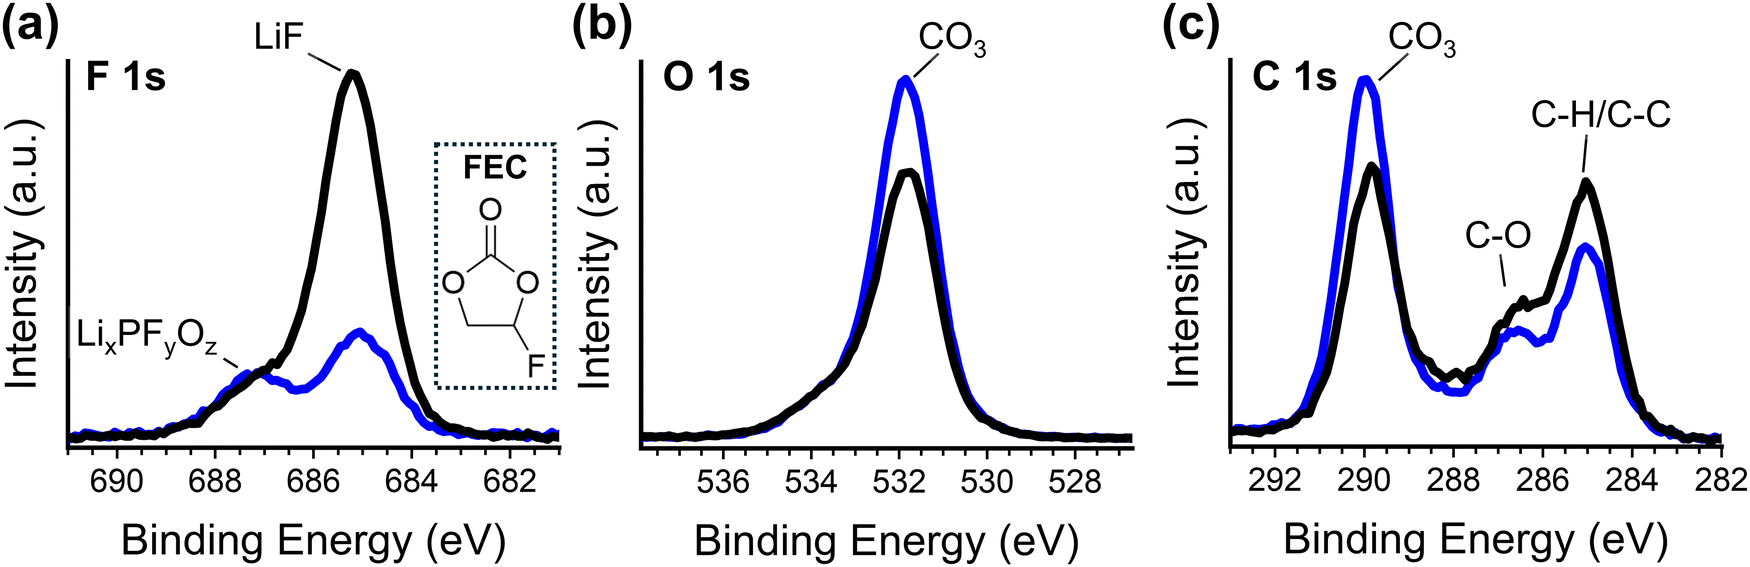 | ||
| Fig. 6 F 1s (a), O 1s (b), and C 1s (c) XPS spectra PAA (black) and CPTES-PAA (blue) electrodes after 7 cycles. Structure of fluoroethylene carbonate is shown in the inset in for reference (a). | ||
In the O 1s spectrum (Fig. 6b), we see the same peaks between CPTES-PAA and PAA-only cells – a peak at 531.8 eV with a small shoulder at 533.8 eV. Both of these correspond to oxygen in a lithium carbonate (CO3) speciation.73 This 531.8 eV peak is stronger in the CPTES-PAA cells than in the PAA only cells. From this, it seems that the modified cells have lithium less preferentially in LiF, and more lithium in lithium carbonates and LixPFyOz, likely due to the decreased access of FEC to the active material. This is corroborated by the C 1s spectrum (Fig. 6c), which shows increased magnitude of the 289.9 eV CO3 and 286.5 C–O peaks in CPTES-PAA vs. PAA only cells, indicating higher lithium carbonate content (possibly lithium ethylene dicarbonate specifically).70,73 Increased Li carbonate content in the SEI is again consistent with what has been observed with decreased FEC content in the electrolyte.72
It could be argued that, because FEC undergoes electrochemical reduction at less cathodic potentials than the other carbonates in this electrolyte,50 the shift in overpotential in the pre-alloying regime (described previously in the dQ/dV analysis) could be due to a relative preference of the CPTES-PAA cells for transporting non-fluorinated electrolyte to the active material. This is a reasonable possibility because FEC is a minority component in the solvation shell of Li-ions, and our modified binder preferentially transports solvent that is in the solvation shell.50 However, control CPTES-PAA cells fabricated with FEC-free electrolyte exhibited the same shift in overpotential compared to FEC-free PAA cells (Fig. S7, ESI†), demonstrating that this shift is unlikely to be a consequence of the identity of the solvent transported to the active material interface.
It is important to note that, despite the detrimental effect on the electrolyte transport characteristics and the resultant low-fluorine SEI formed, the net result of the electrode modification is increased cell capacity retention. As such, the beneficial electrostatic effect appears to be so substantial that it more than overcomes these detrimental effects. These analyses provide valuable information for molecular design strategies to achieve self-regulating ion storage media, broadly applicable to high-capacity conversion electrode materials for alkali-metal-ion batteries.
4. Conclusions
We have shown here that using a silicon composite anode with a dipole functionalized binder improves the capacity retention of a half-cell device versus using unmodified binder. The evidence presented here supports the hypothesis that dynamic interfacial electric field-driven alignment of the dipolar functionality, and consequent preferential slowing of parasitic reactions, is the mechanism by which the capacity retention is improved. This mechanism should be agnostic to many of the specifics of the battery system – that is, it should be generalizable to any formulation of advanced alloying-type metal-ion battery anodes. Our findings further indicate that unintended effects of incorporating dipolar moieties should be considered when optimizing this strategy. In our system, with the incorporation method we used, we found that the lithium-ion transport properties of the binder suffered. Nevertheless, the overall performance of half-cells was significantly improved, even in this unoptimized, proof-of-concept system. The fact that performance did increase in such a system indicates that this strategy holds much potential for improving alloying electrode performance in the future.Further study to examine the local chemical, thermodynamic, and conformational changes is warranted in order to better understand the underlying stabilization mechanisms. In particular, applying in situ analysis methods with the ability to monitor the response of the dipolar moiety to an applied potential may prove to be fruitful. We also conclude that chemically incorporating single dipole modifier molecules directly into the binder is ultimately a suboptimal approach. Pivoting from this approach is an opportunity for further study into how best to maximize the dipolar effect and minimize the detrimental influences on the mechanical and ion transport properties of the binder. Overcoming these challenges could potentially lead to much larger performance enhancements than are observed in the proof-of-concept system used in this work.
One initial avenue will likely be to increase the ratio of dipolar groups to carboxylic acid attachment points, for example by incorporating oligomeric chains of dipolar moieties into the PAA binder (rather than monomeric). This would lead to a higher net dipole loading relative to the number of attachment points and potentially increase the energetic shift (eqn (1)), while minimizing disruption of the native polyether network. Another possible route is to directly modify active material surfaces with oligomeric chains of dipolar moieties, tethered at the chain ends such that, when the surface expands, the chains can stretch into an extended conformation and align with the interfacial electric field. Such a surface-tethered structure would also eliminate the disruption of the native polyether network formed by the PAA, which is beneficial for Li-ion transport. With these further studies, design heuristics could be created and applied to a variety of battery chemistries. Because of the broad applicability of this strategy to interphase-forming battery electrodes, the results of this work should be of interest to the battery community at large, presenting opportunities for further work in materials development and synthesis, device engineering, and operando device characterization.
Author contributions
Emma A. Cave: data curation, formal analysis, investigation, methodology, validation, visualization, writing – original draft, writing, review & editing. Tyson A. Carr: data curation, formal analysis, investigation, methodology, validation, visualization, writing – original draft, writing, review & editing. Cody W. Schlenker: conceptualization, funding acquisition, project administration, supervision, writing – review and editing.Data availability
Data relating to this report is available from the authors upon reasonable request.Conflicts of interest
There are no conflicts to declare.Acknowledgements
The authors are grateful to the University of Washington Clean Energy Institute (CEI) for their financial support of this work. Part of this work was conducted at the Molecular Analysis Facility, a National Nanotechnology Coordinated Infrastructure (NNCI) site at the University of Washington, which is supported in part by funds from the National Science Foundation (awards NNCI-2025489, NNCI-1542101), the Molecular Engineering & Sciences Institute, and CEI.References
- K. Mongird, V. Viswanathan, J. Alam, C. Vartanian, V. Sprenkle and R. Baxter, 2020 Grid Energy Storage Technology Cost and Performance Assessment, USDOE Report DOE/PA-0204, USDOE, 2020 Search PubMed.
- International Energy Agency, Net zero by 2050: A roadmap for the global energy sector, International Energy Agency, Paris, 2021 Search PubMed.
- P. U. Nzereogu, A. D. Omah, F. I. Ezema, E. I. Iwuoha and A. C. Nwanya, Appl. Surf. Sci. Adv., 2022, 9, 100233 CrossRef.
- R. Yazami and P. Touzain, J. Power Sources, 1983, 9, 365–371 CrossRef CAS.
- J. Asenbauer, T. Eisenmann, M. Kuenzel, A. Kazzazi, Z. Chen and D. Bresser, Sustainable Energy Fuels, 2020, 4, 5387–5416 RSC.
- J. Li, J. Fleetwood, W. B. Hawley and W. Kays, Chem. Rev., 2022, 122, 903–956 CrossRef CAS PubMed.
- X. Zuo, J. Zhu, P. Müller-Buschbaum and Y.-J. Cheng, Nano Energy, 2017, 31, 113–143 CrossRef CAS.
- E. Wood, M. Alexander and T. H. Bradley, J. Power Sources, 2011, 196, 5147–5154 CrossRef CAS.
- M. Salah, P. Murphy, C. Hall, C. Francis, R. Kerr and M. Fabretto, J. Power Sources, 2019, 414, 48–67 CrossRef CAS.
- W.-J. Zhang, J. Power Sources, 2011, 196, 13–24 CrossRef CAS.
- F. Shi, Z. Song, P. N. Ross, G. A. Somorjai, R. O. Ritchie and K. Komvopoulos, Nat. Commun., 2016, 7, 11886 CrossRef CAS PubMed.
- J. H. Ryu, J. W. Kim, Y.-E. Sung and S. M. Oh, Electrochem. Solid-State Lett., 2004, 7, A306 CrossRef CAS.
- U. Kasavajjula, C. Wang and A. J. Appleby, J. Power Sources, 2007, 163, 1003–1039 CrossRef CAS.
- M. T. McDowell, S. W. Lee, W. D. Nix and Y. Cui, Adv. Mater., 2013, 25, 4966–4985 CrossRef CAS PubMed.
- C. Wölke, B. A. Sadeghi, G. G. Eshetu, E. Figgemeier, M. Winter and I. Cekic-Laskovic, Adv. Mater. Interfaces, 2022, 9, 2101898 CrossRef.
- E. Peled, J. Electrochem. Soc., 1979, 126, 2047 CrossRef CAS.
- J. Kim, O. B. Chae and B. L. Lucht, J. Electrochem. Soc., 2021, 168, 030521 CrossRef CAS.
- E. Peled, D. Golodnitsky and J. Penciner, in Handbook of Battery Materials, ed. C. Daniel and J. O. Besenhard, Wiley-VCH Verlag GmbH & Co. KGaA, Weinheim, Germany, 2nd edn, 2011, ch. 16, pp. 479–523 Search PubMed.
- X. H. Liu, L. Zhong, S. Huang, S. X. Mao, T. Zhu and J. Y. Huang, ACS Nano, 2012, 6, 1522–1531 CrossRef CAS PubMed.
- M. A. Rahman, G. Song, A. I. Bhatt, Y. C. Wong and C. Wen, Adv. Funct. Mater., 2015, 26, 647–678 CrossRef.
- X. Li, M. Zhang, S. Yuan and C. Lu, ChemElectroChem, 2020, 7, 4289–4302 CrossRef CAS.
- B. T. Young, C. C. Nguyen, A. Lobach, D. R. Heskett, J. C. Woicik and B. L. Lucht, J. Mater. Res., 2019, 34, 97–106 CrossRef CAS.
- C. C. Nguyen, T. Yoon, D. M. Seo, P. Guduru and B. L. Lucht, ACS Appl. Mater. Interfaces, 2016, 8, 12211–12220 CrossRef CAS PubMed.
- Y. M. Zhao, F. S. Yue, S. C. Li, Y. Zhang, Z. R. Tian, Q. Xu, S. Xin and Y. G. Guo, InfoMat, 2021, 3, 460–501 CrossRef CAS.
- B. P. N. Nguyen, S. Chazelle, M. Cerbelaud, W. Porcher and B. Lestriez, J. Power Sources, 2014, 262, 112–122 CrossRef CAS.
- M. K. Burdette-Trofimov, B. L. Armstrong, A. M. Rogers, L. Heroux, M. Doucet, G. Yang, N. D. Phillip, M. K. Kidder and G. M. Veith, J. Phys. Chem. C, 2020, 124, 13479–13494 CrossRef CAS.
- M. K. Burdette-Trofimov, B. L. Armstrong, J. Nelson Weker, A. M. Rogers, G. Yang, E. C. Self, R. R. Armstrong, J. Nanda and G. M. Veith, ACS Appl. Mater. Interfaces, 2020, 12, 55954–55970 CrossRef CAS PubMed.
- N. Liu, Z. Lu, J. Zhao, M. T. McDowell, H. W. Lee, W. Zhao and Y. Cui, Nat. Nanotechnol., 2014, 9, 187–192 CrossRef CAS PubMed.
- H. Wu, G. Chan, J. W. Choi, I. Ryu, Y. Yao, M. T. McDowell, S. W. Lee, A. Jackson, Y. Yang, L. Hu and Y. Cui, Nat. Nanotechnol., 2012, 7, 310–315 CrossRef CAS PubMed.
- R. Otero, A. L. Vázquez de Parga and J. M. Gallego, Surf. Sci. Rep., 2017, 72, 105–145 CrossRef CAS.
- A. Kahn, Mater. Horiz., 2016, 3, 7–10 RSC.
- D. Cahen and A. Kahn, Adv. Mater., 2003, 15, 271–277 CrossRef CAS.
- E. Zojer, T. C. Taucher and O. T. Hofmann, Adv. Mater. Interfaces, 2019, 6, 1900581 CrossRef.
- S. Khodabakhsh, B. M. Sanderson, J. Nelson and T. S. Jones, Adv. Funct. Mater., 2006, 16, 95–100 CrossRef CAS.
- A. Vilan and D. Cahen, Chem. Rev., 2017, 117, 4624–4666 CrossRef CAS PubMed.
- S. A. Paniagua, A. J. Giordano, O. N. L. Smith, S. Barlow, H. Li, N. R. Armstrong, J. E. Pemberton, J.-L. Brédas, D. Ginger and S. R. Marder, Chem. Rev., 2016, 116, 7117–7158 CrossRef CAS PubMed.
- B. A. MacLeod, K. X. Steirer, J. L. Young, U. Koldemir, A. Sellinger, J. A. Turner, T. G. Deutsch and D. C. Olson, ACS Appl. Mater. Interfaces, 2015, 7, 11346–11350 CrossRef CAS PubMed.
- S. Bastide, R. Butruille, D. Cahen, A. Dutta, J. Libman, A. Shanzer, L. Sun and A. Vilan, J. Phys. Chem. B, 1997, 101, 2678–2684 CrossRef CAS.
- S. Yang, D. Prendergast and J. B. Neaton, Nano Lett., 2012, 12, 383–388 CrossRef CAS PubMed.
- N. Guijarro, M. S. Prevot and K. Sivula, Phys. Chem. Chem. Phys., 2015, 17, 15655–15674 RSC.
- A. J. Bard, A. B. Bocarsly, F. R. F. Fan, E. G. Walton and M. S. Wrighton, J. Am. Chem. Soc., 1980, 102, 3671–3677 CrossRef CAS.
- K. Leung and A. Leenheer, J. Phys. Chem. C, 2015, 119, 10234–10246 CrossRef CAS.
- L. Zhu, J. Phys. Chem. Lett., 2014, 5, 3677–3687 CrossRef CAS PubMed.
- R. Ruffo, S. S. Hong, C. K. Chan, R. A. Huggins and Y. Cui, J. Phys. Chem. C, 2009, 113, 11390–11398 CrossRef CAS.
- E. A. Cave, J. Z. Olson and C. W. Schlenker, ACS Appl. Mater. Interfaces, 2021, 13, 48546–48554 CrossRef CAS PubMed.
- Y. Bie, J. Yang, W. Lu, Z. Lei, Y. Nuli and J. Wang, Electrochim. Acta, 2016, 212, 141–146 CrossRef CAS.
- X. Zeng, Y. Shi, Y. Zhang, R. Tang and L. Wei, RSC Adv., 2018, 8, 29230–29236 RSC.
- A. Kuznetsova, E. A. Wovchko and J. T. Yates, Langmuir, 1997, 13, 5322–5328 CrossRef CAS.
- B. Arkles and P. J. Launer, Silicon Compounds: Silanes & Silicones, Gelest, Inc, Morrisville, PA, 3rd edn, 2013, ch. 11, pp. 175–178 Search PubMed.
- T. Hou, G. Yang, N. N. Rajput, J. Self, S.-W. Park, J. Nanda and K. A. Persson, Nano Energy, 2019, 64, 103881 CrossRef CAS.
- T. Hou, K. D. Fong, J. Wang and K. A. Persson, Chem. Sci., 2021, 12, 14740–14751 RSC.
- K. W. Schroder, A. G. Dylla, S. J. Harris, L. J. Webb and K. J. Stevenson, ACS Appl. Mater. Interfaces, 2014, 6, 21510–21524 CrossRef CAS PubMed.
- T. Yoon, C. C. Nguyen, D. M. Seo and B. L. Lucht, J. Electrochem. Soc., 2015, 162, A2325–A2330 CrossRef CAS.
- M. C. Schulze, G. M. Carroll, T. R. Martin, K. Sanchez-Rivera, F. Urias and N. R. Neale, ACS Appl. Energy Mater., 2021, 4, 1628–1636 CrossRef CAS.
- H. Shobukawa, J. Alvarado, Y. Yang and Y. S. Meng, J. Power Sources, 2017, 359, 173–181 CrossRef CAS.
- E. Radvanyi, K. Van Havenbergh, W. Porcher, S. Jouanneau, J.-S. Bridel, S. Put and S. Franger, Electrochim. Acta, 2014, 137, 751–757 CrossRef CAS.
- T. Yoon, N. Chapman, D. M. Seo and B. L. Lucht, J. Electrochem. Soc., 2017, 164, A2082–A2088 CrossRef CAS.
- D. Schneier, Y. Horowitz, J. Kasnatscheew, M. Grünebaum, H.-D. Wiemhöfer, M. Winter and E. Peled, Batteries Supercaps, 2021, 4, 1611–1619 CrossRef CAS.
- R. R. Gaddam, L. Katzenmeier, X. Lamprecht and A. S. Bandarenka, Phys. Chem. Chem. Phys., 2021, 23, 12926–12944 RSC.
- B.-Y. Chang, J. Electrochem. Sci. Technol., 2020, 11, 318–321 CrossRef CAS.
- B. Hirschorn, M. E. Orazem, B. Tribollet, V. Vivier, I. Frateur and M. Musiani, Electrochim. Acta, 2010, 55, 6218–6227 CrossRef CAS.
- G. J. Brug, A. L. G. van den Eeden, M. Sluyters-Rehbach and J. H. Sluyters, J. Electroanal. Chem., 1984, 176, 275–295 CrossRef CAS.
- E. P. M. van Westing, G. M. Ferrari and J. H. W. de Wit, Corros. Sci., 1993, 34, 1511–1530 CrossRef CAS.
- K. Xu, Y. Lam, S. S. Zhang, T. R. Jow and T. B. Curtis, J. Phys. Chem. C, 2007, 111, 7411–7421 CrossRef CAS.
- K. Xu, A. von Cresce and U. Lee, Langmuir, 2010, 26, 11538–11543 CrossRef CAS PubMed.
- T. R. Martin, R. T. Pekarek, J. E. Coyle, M. C. Schulze and N. R. Neale, J. Mater. Chem. A, 2021, 9, 21929–21938 RSC.
- M. N. Obrovac and L. Christensen, Electrochem. Solid-State Lett., 2004, 7, A93 CrossRef CAS.
- P. Lanz and P. Novák, J. Electrochem. Soc., 2014, 161, A1555–A1563 CrossRef CAS.
- C.-C. Su, M. He, R. Amine, T. Rojas, L. Cheng, A. T. Ngo and K. Amine, Energy Environ. Sci., 2019, 12, 1249–1254 RSC.
- B. T. Young, D. R. Heskett, C. C. Nguyen, M. Nie, J. C. Woicik and B. L. Lucht, ACS Appl. Mater. Interfaces, 2015, 7, 20004–20011 CrossRef CAS PubMed.
- C. Xu, F. Lindgren, B. Philippe, M. Gorgoi, F. Björefors, K. Edström and T. Gustafsson, Chem. Mater., 2015, 27, 2591–2599 CrossRef CAS.
- C. C. Nguyen and B. L. Lucht, J. Electrochem. Soc., 2014, 161, A1933–A1938 CrossRef.
- R. Dedryvere, L. Gireaud, S. Grugeon, S. Laruelle, J. M. Tarascon and D. Gonbeau, J. Phys. Chem. B, 2005, 109, 15868–15875 CrossRef CAS PubMed.
Footnote |
| † Electronic supplementary information (ESI) available. See DOI: https://doi.org/10.1039/d4ya00418c |
| This journal is © The Royal Society of Chemistry 2024 |