Thermally enhanced NIR up-conversion fluorescence multimode thermometry based on Y2Mo3O12:Nd3+,Yb3+†
Yexuan
Zhang
a,
Minkun
Jin
a,
Wang
Chen
a,
Ziyang
Wu
a,
Zexun
Li
a and
Chongfeng
Guo
 *ab
*ab
aState Key Laboratory of Photon-Technology in Western China Energy, Institute of Photonics & Photon-Technology, Northwest University, Xi’an 710127, China. E-mail: guocf@nwu.edu.cn; Fax: ±86-29-88302661; Tel: +86-29-88302661
bCollege of Chemistry and Chemical Engineering, Jiangxi Normal University, Nanchang, 330022, China
First published on 30th April 2024
Abstract
Severe thermal quenching of fluorescence is the main obstacle to the application of fluorescence thermometers in higher temperature regions. In order to broaden the temperature detection range of fluorescence thermometers, the Y2Mo3O12:Nd3+,Yb3+ phosphor with negative thermal expansion (NTE) characteristics was successfully synthesized. The up-conversion (UC) fluorescence thermal enhancement (4F3/2 → 4I9/2) increased 109 times at 480 K and the UC fluorescence lifetime (FL) of the transition 4F5/2 → 4I9/2 increased from 77 to 144.5 μs in the range of 280 to 380 K under the excitation of a 980 nm laser. Herein, a multimode temperature probe was constructed through fluorescence intensity ratio (FIR) technology (4F7/2/4F5/2, 4F7/2/4F3/2 and 4F5/2/4F3/2) and FL technology based on the ladder-like thermally coupled energy levels (TCLs) of Nd3+. The feasibility of the probe was verified and Y2Mo3O12:Nd3+,Yb3+ has high stability and accuracy (δT = 0.61 K at 480 K), indicating that it is an ideal candidate in higher temperature monitoring. This work not only proposes an ideal scheme for designing high sensitivity fluorescence thermometers, but also provides a certain reference value for solving the problem of fluorescence thermal quenching.
1. Introduction
The accurate measurement of temperature has always been a constant pursuit because temperature is one of the vital parameters in human life, modern industry and scientific research. Traditional thermal expansion, thermocouples and thermal resistance thermometers have been unable to meet the requirements of some special conditions such as biological tissues and corrosive environments.1–4 Non-contact optical fluorescence thermometers based on lanthanide (Ln) or transition metal ion doped luminescent materials were paid more attention in recent years due to their fast response, controllable size and high thermal resolution.5–8 Among them, thermometers based on the fluorescence intensity ratio (FIR) technology of thermally coupled energy levels (TCLs) have gained more attention due to their stability and repeatability.9–11 However, severe thermal quenching of fluorescence has restricted their applications in higher temperature ranges. Due to the gradually intensified thermal vibration inside crystals when the temperature rises, more energy of electrons on excited state energy levels is consumed in the way of non-radiative relaxation (NR), which weakens the fluorescence intensity and undoubtedly causes the increase of difficulty and error during the course of temperature detection.12,13Although a lot of works have been done for combating the thermal quenching, including surface engineering (passivation or ligand coordination), high-power excitation, phonon-assisted energy transfer (PAET), etc., only limited success has been achieved due to different difficulties faced by each method and non-universality.14–16 In recent years, negative thermal expansion (NTE) based luminescent materials showed good prospects in anti-thermal quenching due to their fascinating luminescence promoting capability from structures. Specifically, the microscopic volume of NTE materials will decrease with the increase of temperature and the gradually compact lattice reduces the phonon energy corresponding to the various vibration modes, which can reduce the energy loss caused by NR.17–19 Among the reported NTE materials, the A2M3O12 (A = Y, Lu, Yb, Sc; M = W, Mo) family has attracted attention due to their high tolerance to Ln3+, which promote the development and utilization of rare earth doped NTE-based thermometers through the FIR technology.20–24 However, the temperature probe based on FIR technology has a large error because different media absorb light with different wavelengths, which promotes the development of thermometers based on different mechanisms.25–28 Fascinatingly, fluorescence lifetime (FL) technology depends on a great variety of temperature-related factors (such as PAET and the multi-phonon decay process), which makes it possible to obtain temperature information from FL.29 Specifically, FL originates from the electronic de-excitation kinetics and exhibits a better anti-disturbance ability, not subject to excitation intensity, phosphor concentration and emission loss, which enables it to avoid errors in different measurement situations and carry out calibrations to temperature readouts of FIR technology.30
The luminescence of Nd3+ has been significantly improved through a PAET process in Yb3+ and Nd3+ co-doped phosphors under the excitation of a 980 nm laser, which is attributed to the appropriate energy gap (∼1000 cm−1) between the excited state energy levels 2F5/2 of Yb3+ and 4F3/2 of Nd3+.31 In addition, the near infrared (NIR) fluorescence of ladder-like TCLs (4F7/2, 4F5/2 and 4F3/2) in Nd3+ has a tendency of thermal enhancement with appropriate PAET as the temperature rises,32 which enabled a high possibility of FL extension of 4F7/2, 4F5/2 and 4F3/2 energy levels with the increase of temperature. Accordingly, NIR fluorescence Nd3+-based thermometers with greater penetrability are ideal candidates for temperature measurements in higher temperature ranges. Fortunately, the phonon energy of Y2M3O12 is close to the energy mismatch between Yb3+ and Nd3+. By selecting appropriate TCLs, the suitable phonon energy and the excellent NTE properties of Y2M3O12 (αV ∼ −3.78 × 10⁻⁵ K−1) make the outstanding FIR and FL temperature sensing performance of Nd3+ possible.
Inspired by the above findings, a thermally enhanced multimode fluorescence thermometer based on the NTE material Y2Mo3O12:Nd3+,Yb3+ was designed in this work. The up-conversion (UC) fluorescence intensity of ladder-like TCLs (4F7/2 → 4I9/2, 4F5/2 → 4I9/2 and 4F3/2 → 4I9/2) is enhanced 109, 26 and 7 times, and their relevant UC FL (4F5/2 → 4I9/2) is increased from 77 to 144.5 μs, which enable us to construct thermally enhanced fluorescence thermometers based on FIR and FL technologies. By combining the NTE properties of Y2Mo3O12 with the PAET mechanism between Yb3+ and Nd3+, the corresponding optical thin film is proved to have qualified temperature sensing capability and its application range extends to higher temperatures while maintaining excellent performance, which makes it an ideal candidate in higher temperature monitoring.
2. Experimental details
2.1. Synthesis of samples
The Y2Mo3O12:Nd3+,Yb3+ powder samples were synthesized using a high-temperature solid-state reaction method. The starting materials, including Y2O3 (99.99%), Nd2O3 (99.99%), Yb2O3 (99.99%) and MoO3 (99.9%), were first weighed according to a certain stoichiometric ratio and mixed completely. Then, the mixture was calcined in a muffle furnace at 850 °C for 6 h and the final samples were successfully obtained after naturally cooling down to room temperature.2.2. Characterization
The phase purity and crystal structures of all the prepared samples were determined using a powder X-ray diffractometer (XRD) with Cu Kα radiation (Rigaku Corporation, Tokyo, Japan; λ = 1.54056 Å) in the range of 10° ≤ 2θ ≤ 80°. The Fourier transform infrared (FT-IR) spectra and Raman spectra were collected on a Bruker INVENIO-R spectrometer and a Thermo Fisher DXR2 laser confocal microscopy Raman spectrometer, respectively. The temperature-dependent UC emission spectra and FL spectra were recorded on a fluorescence spectrometer (Edinburgh FLS920) with a liquid nitrogen cryogenic temperature-control system (Oxford OptistatDN2) combined with an external power-adjustable 980 nm semiconductor laser.3. Results and discussion
3.1. Crystal structure analysis
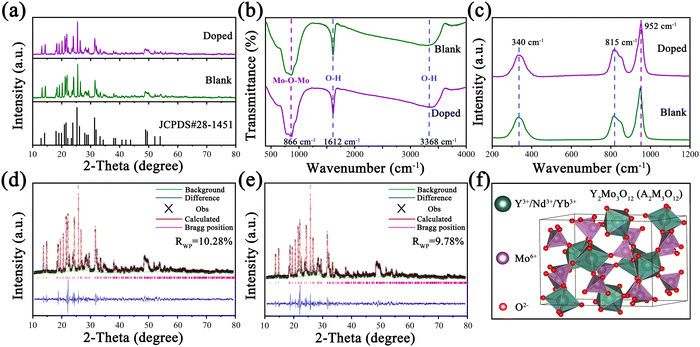
In order to prove the phase purity of the samples, XRD patterns of Y2Mo3O12:1% Nd3+,y% Yb3+ were measured and are displayed in Fig. 1a and Fig. S1 (ESI†). All diffraction peaks of doped and undoped (blank) samples were consistent with those of the standard profiles of orthorhombic Y2Mo3O12 (JCPDS#28-1451) with the Pbcn (60) space group. The FT-IR and Raman spectra were recorded to obtain the lattice vibration information to determine the phonon energy of the doped and blank samples. As shown in Fig. 1b, FT-IR spectra of both blank and doped samples show the strongest absorption peak at 866 cm−1, which corresponds to the vibration of Mo–O–Mo. The bands centered at 1612 cm−1 and 3368 cm−1 are attributed to the stretching vibration of O–H. As shown in Fig. 1c, the peak at 340 cm−1 in the Raman spectra is attributed to symmetric and asymmetric bending motions in both the YO6 octahedron and the MoO4 tetrahedron. The strongest peaks at 815 cm−1 and 952 cm−1 are attributed to the asymmetric and symmetric stretching vibrations of the MoO4 tetrahedra.33–35 From the above analysis, it can be seen that the phonon energy of the samples is 952 cm−1, which is close to the energy mismatch between Nd3+ and Yb3+. As shown in Fig. 1d and e, Rietveld XRD refinements were performed to further confirm the phase purity of the doped and blank samples, and the corresponding results are shown in Table S1 (ESI†). In addition, the results show that the lattice volume (V) of the doped sample is smaller than that of the blank sample due to the substitution of Y3+ ions with larger ionic radii by smaller Yb3+ ions. Y2Mo3O12 crystallized in an orthorhombic system and its crystal structure diagram is shown in Fig. 1f, in which the YO6 octahedron and the MoO4 tetrahedron are connected an oxygen atom.36 Furthermore, Nd3+ (0.983 Å) and Yb3+ (0.868 Å) are more inclined to occupy the Y3+ (0.900 Å) position due to the close ionic radii and the same valence state.3.2. Negative thermal expansion analysis
For further determining how the crystal structure of Y2Mo3O12 changes with temperature, temperature-dependent XRD was performed and the results are displayed in Fig. 2a. With the temperature increasing from 80 to 380 °C, no significant variations were observed in the XRD patterns of the sample, indicating that there is no phase change with the increase of temperature. However, obvious peak shifts to larger angles were found when the peaks corresponding to the lattice planes of (220) and (111) were amplified, as shown in Fig. 2b and c, respectively. According to Bragg's law (2d![[thin space (1/6-em)]](https://www.rsc.org/images/entities/char_2009.gif) sin
sin![[thin space (1/6-em)]](https://www.rsc.org/images/entities/char_2009.gif) θ = nλ), the shifted peaks prove that Y2Mo3O12 has a lattice shrinkage with the increase of temperature, and the shrinkage diagram is displayed in Fig. 2d. The transverse vibration of the bridging oxygen atom intensifies gradually with the increase of temperature, and then the lattice rotates and shrinks. When the temperature rises, the gradually compact lattice weakens the lattice vibration amplitude and thus weakens the energy loss caused by NR, which may affect the luminescence of Ln3+ doped in it.
θ = nλ), the shifted peaks prove that Y2Mo3O12 has a lattice shrinkage with the increase of temperature, and the shrinkage diagram is displayed in Fig. 2d. The transverse vibration of the bridging oxygen atom intensifies gradually with the increase of temperature, and then the lattice rotates and shrinks. When the temperature rises, the gradually compact lattice weakens the lattice vibration amplitude and thus weakens the energy loss caused by NR, which may affect the luminescence of Ln3+ doped in it.
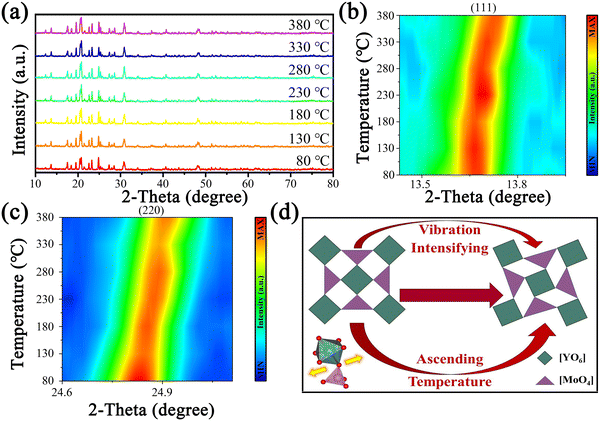 | ||
| Fig. 2 Temperature-dependent (a) XRD patterns of Y2Mo3O12 and two-dimensional mapping of diffraction peaks (b) (111) and (c) (220) as well as (d) lattice distortion diagram of Y2Mo3O12. | ||
3.3. UC luminescence characteristics
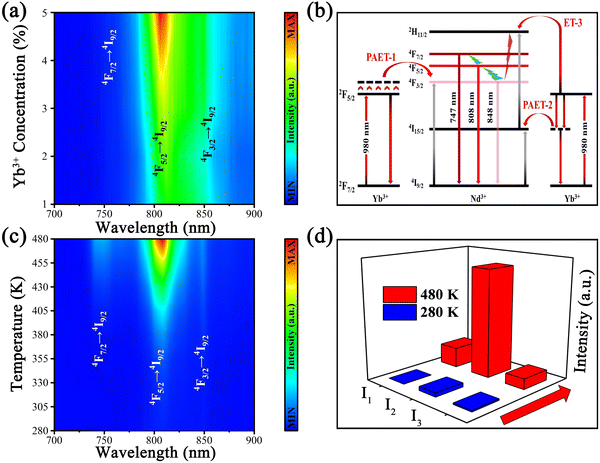
The UC spectra of Y2Mo3O12:1% Nd3+,y% Yb3+ with 980 nm laser excitation are displayed in Fig. 3a, which include the emissions of 4F7/2 → 4I9/2 (725–775 nm, I1), 4F5/2 → 4I9/2 (776–840 nm, I2) and 4F3/2 → 4I9/2 (841–885 nm, I3), and the corresponding fluorescence intensities increase with increasing doping concentration of Yb3+ in our experimental range. To determine the UC mechanism, the dual logarithmic fitting curves of UC emission integral intensities (I) of 4F7/2 → 4I9/2, 4F5/2 → 4I9/2 and 4F3/2 → 4I9/2 emission bands related to pumping power (P) were recorded and are displayed in Fig. S2 (ESI†). The slopes (n = 0.68, 0.53 and 0.27) of the fitting curves denote the dominant role of one photon in the UC process according to the relationship: I ∝ Pn and the possible UC processes of Y2Mo3O12:1% Nd3+,5% Yb3+ under 980 nm laser excitation are displayed in Fig. 3b. Electrons on the ground state energy level 2F7/2 (Yb3+) jump to the excited state energy level 2F5/2 (Yb3+) by absorbing a 980 nm photon, and then the energy was transferred to Nd3+ with the aid of phonon energy. Consequently, electrons on the ground state energy level 4I9/2 (Nd3+) jump to the excited state energy level 4F3/2 (Nd3+), which is called PAET-1. On the other hand, part of the energy generated by Yb3+ is possibly consumed by phonon energy, and the rest of the energy is transferred to Nd3+ to promote jumping of electrons on 4I9/2 to the excited state energy level 4I15/2 (Nd3+), which is called PAET-2. Meanwhile, the electrons populated on 4I15/2 jump to 2H11/2 (Nd3+) through absorption of a 980 nm photon or ET from Yb3+, which is called ET-3. Then the electrons on 2H11/2 relax downward to 4F3/2 by successive NR (2H11/2 → 4F7/2 → 4F5/2 → 4F3/2), generating emissions around 747, 808 and 848 nm from transitions 4F7/2 → 4I9/2, 4F5/2 → 4I9/2 and 4F3/2 → 4I9/2, respectively. Because the energy level gaps between 4F7/2 and 4F5/2 (∼887 cm−1) and 4F5/2 and 4F3/2 (∼1316 cm−1) fall in the range of 200–2000 cm−1 and belong to TCLs, the number of electrons on the upper energy level will increase, while the number of electrons on the lower energy level will decrease with the increase of temperature by following the Boltzmann distribution. The population of the energy level 4F3/2 will increase with the increase of temperature because the energy mismatch between Yb3+ and Nd3+ is supplemented by the more and more popular occurrence of PAET, resulting in an enhancement of 848 nm emission from transition 4F3/2 → 4I9/2 in the phosphor Y2Mo3O12:1% Nd3+,5% Yb3+.In order to explore the temperature sensing performance of the present sample Y2Mo3O12:1% Nd3+,5% Yb3+, its temperature-dependent UC spectra were recorded and are displayed in Fig. 3c. With the temperature increasing from 280 to 480 K, the overall fluorescence intensity of Y2Mo3O12:1% Nd3+,5% Yb3+ continues to increase and the integral fluorescence intensities of I1, I2 and I3 were enhanced 109, 26 and 7 times at 480 K in comparison with those at 280 K, respectively, as shown in Fig. 3d and Fig. S3 (ESI†). In addition, the temperature-dependent down-conversion (DC) spectra of Y2Mo3O12:1% Nd3+,5% Yb3+ were also compared with those of other Nd3+ and Yb3+ doped materials under 808 nm laser excitation, and the DC spectra of the present sample showed a significant fluorescence thermal enhancement with the temperature rising from 330 to 480 K (in Fig. S4a, ESI†), but other materials generally showed a trend of thermal quenching.37–39 The possible DC processes of Y2Mo3O12:1% Nd3+,5% Yb3+ under 808 nm laser excitation are displayed in Fig. S4b (ESI†). It is reasonable to believe that the special NTE properties of the Y2Mo3O12 matrix indeed make the UC or DC fluorescence of Y2Mo3O12:1% Nd3+,5% Yb3+ show a special thermal enhancement trend.
3.4. Optical thermometric performance
Due to the excellent temperature-dependent properties of Y2Mo3O12:1% Nd3+,5% Yb3+ and the different increasing rates of different emissions, its temperature sensing capability was continuously evaluated. The FIR temperature sensing property of Y2Mo3O12:1% Nd3+,5% Yb3+ could be defined according to formula (1):40–43 | (1) |
 | (2) |
 | (3) |
Accordingly, I1/I2, I1/I3 and I2/I3 are set as FIR1, FIR2 and FIR3, respectively. Because the number of electrons on TCLs follows the Boltzmann distribution, the three FIRs of the temperature-dependent UC spectra all increased with the temperature rising from 280 to 480 K, as shown in Fig. 4a–c. Accordingly, the SR and SA values of the three thermometers were calculated using formulas (2) and (3), as shown in Fig. 4d–f and Fig. S5a–c (ESI†), reaching a maximum of 3.49% K−1 and 0.0518 K−1, which are excellent in the most reported fluorescence thermometers based on FIR technology (Table S2, ESI†). Meanwhile, seven heating and cooling cycles were executed to test the reversibility of the three FIRs, which are displayed in Fig. 4g–i. The above results proved that the three FIRs based on the temperature-dependent UC spectra of Y2Mo3O12:1% Nd3+,5% Yb3+ have excellent repeatability and stability.
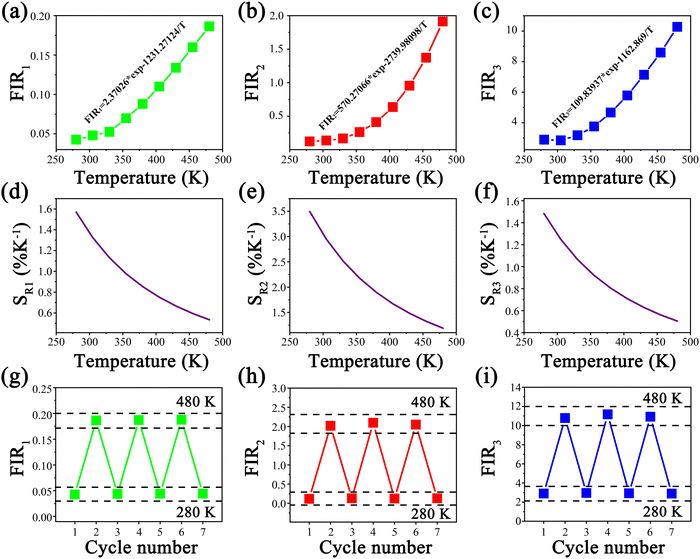 | ||
| Fig. 4 (a)–(c) Temperature-dependent FIR and fitting curves of FIR1, FIR2 and FIR3. (d)–(f) SR of the three kinds of FIR. (g)–(i) Heating and cooling cycles of the three kinds of FIR. | ||
In comparison with the fluorescence intensity, FL is not sensitive to the change of excitation source intensity and emission loss, which enables it to avoid errors from the fluorescence inherent in different measurement situations. Considering the high fluorescence intensity and relatively high fluorescence thermal enhancement of the transition 4F5/2 → 4I9/2 in the temperature-dependent UC spectra of Y2Mo3O12:1% Nd3+,5% Yb3+, the temperature sensing capability of its UC FL (808 nm) was further explored. The FL decay curve could be well fitted using formula (4):
 | (4) |
 | (5) |
| τ = y0 + A·exp(R0·T) | (6) |
 | (7) |
As shown in Fig. 5a and b, the FL (808 nm) of Y2Mo3O12:1% Nd3+,5% Yb3+ extended continually with the temperature rising from 280 to 380 K, and the fitting average FL is prolonged from 77 to 144.5 μs. As the temperature increased, the number of electrons on 4F5/2 continued to increase, and the average FL of the transition 4F5/2 → 4I9/2 was prolonged. Accordingly, the SR value of the FL thermometer was calculated using formula (7), as shown in Fig. 5c, reaching a maximum of 2.13% K−1, which is comparable to those of most reported fluorescence thermometers based on FIR technology (Table S2, ESI†). The above results proved that the temperature-dependent UC FL based on the transition 4F5/2 → 4I9/2 of Y2Mo3O12:1% Nd3+,5% Yb3+ has a competent temperature sensing capability.
 | ||
| Fig. 5 Temperature-dependent (a) decay curves of the excited state energy level 4F5/2, (b) FL and fitting curve, and (c) SR of the FL of Y2Mo3O12:1% Nd3+,5% Yb3+ under 980 nm laser excitation. | ||
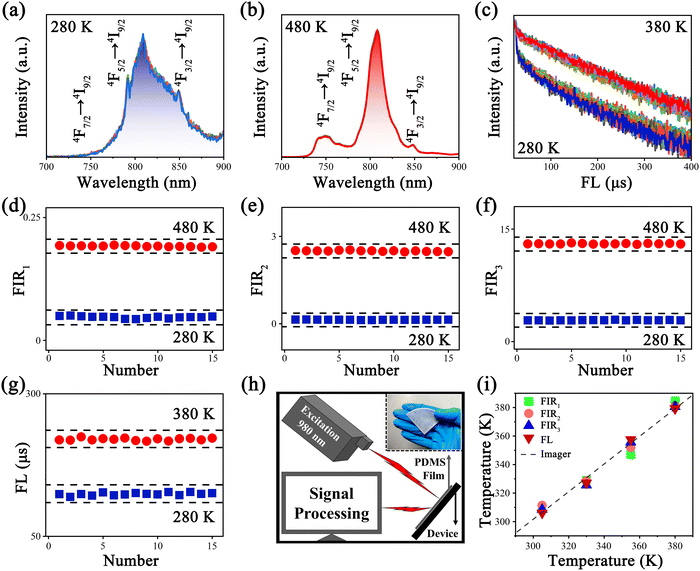
In practical temperature measurements, qualified temperature resolution (δT) is more important in addition to excellent sensitivity. In order to determine the minimum temperature change that can be detected by FIR and FL thermometers, the δT was evaluated according to the formula δT = δFIR/(FIR*SR).51 As shown in Fig. 6a–c, the UC spectra and FL decay curves of Y2Mo3O12:1% Nd3+,5% Yb3+ were recorded 15 times under the same measurement settings, and the corresponding calculation results are shown in Fig. 6d–g, respectively. The best δT values reached 0.57 K at 280 K and 0.61 K at 480 K, and the results showed that the δT of thermometers did not deteriorate severely after fluorescence thermal enhancement (Table S3, ESI†).
Based on the corresponding high sensitivity FIR and FL of Y2Mo3O12:1% Nd3+,5% Yb3+, its practical application was also evaluated by building an ultra-sensitive flexible thin film temperature sensor through mixing the Y2Mo3O12:1% Nd3+,5% Yb3+ phosphor with polydimethylsiloxane (PDMS).52–55 As a demonstration of the working process, its working diagram for real-time temperature sensing of precision devices is displayed in Fig. 6h. The FIR and FL of the phosphor were monitored, and the corresponding environmental temperature could be obtained according to the fitting curves, which is displayed in Fig. S6a–d (ESI†). As shown in Fig. 6i, the temperature measurement results of four kinds of thermometers were basically consistent with a thermal imager, which proved that the multimode thermometer has an accurate temperature sensing capability and self-calibration function. Meanwhile, Y2Mo3O12:1% Nd3+,5% Yb3+ has better temperature sensing performance compared with most existing thermometers based on Nd3+ and the non-NTE matrix (Table S2, ESI†).
4. Conclusions
The NTE material Y2Mo3O12:1% Nd3+,5% Yb3+ was successfully synthesized using a high-temperature solid-state reaction method and the possible UC processes under the excitation of a 980 nm laser were analyzed in detail. By combining the NTE properties of Y2Mo3O12 with the PAET mechanism between Yb3+ and Nd3+, the UC fluorescence thermal enhancement (4F3/2 → 4I9/2) by 109 times at 480 K and UC FL thermal extension (4F5/2 → 4I9/2) from 77 to 144.5 μs in the NIR region were achieved. According to the temperature-dependent UC spectra and FL decay curves of Y2Mo3O12:1% Nd3+,5% Yb3+, a multimode high sensitivity fluorescence thermometer was designed by combining three kinds of FIRs (4F7/2/4F5/2, 4F7/2/4F3/2 and 4F5/2/4F3/2) with the FL (4F5/2 → 4I9/2) of Nd3+. The optimal SR and δT values of Y2Mo3O12:1% Nd3+,5% Yb3+ reached 3.49% K−1 and 0.57 K at 280 K, respectively. Meanwhile, the corresponding optical thin film is proved to have an accurate temperature sensing capability and self-calibration function. It is expected to have ideal application prospects as a NIR fluorescence thermally enhanced multimode thermometer in higher temperature environments.Author contributions
Y. Zhang conducted most of the experiments and their analyses with the assistance of M. Jin and W. Chen, and wrote the manuscript under the supervision of C. Guo. Z. Wu assisted in Rietveld XRD refinements and calculations of the lattice parameters. Z. Li assisted in optical thin film preparation.Conflicts of interest
The authors declare no competing financial interests.Acknowledgements
This work was supported by the National Natural Science Foundation of China (No. 11974278, 51672215, and 12104367) and the Youth Innovation Team of Shaanxi Universities and Thousand Talents Plan of Jiangxi Province (jxsq2020102064).References
- X. Wang, O. S. Wolfbeisa and R. J. Meier, Chem. Soc. Rev., 2013, 42, 7834–7869 RSC.
- C. Mi, J. Zhou, F. Wang, G. Lin and D. Jin, Chem. Mater., 2019, 31, 9480–9487 CrossRef CAS.
- M. Runowski, N. Stopikowska, D. Szeremeta, S. Goderski, M. Skwierczyńska and S. Lis, ACS Appl. Mater. Interfaces, 2019, 11, 13389–13396 CrossRef CAS PubMed.
- E. Pavitra, H. Lee, S. K. Hwang, J. Y. Park, G. L. Varaprasad, M. V. B. Rao, Y. K. Han, G. S. R. Raju and Y. S. Huh, Appl. Surf. Sci., 2022, 579, 152166 CrossRef CAS.
- C. D. S. Brites, P. P. Lima, N. J. O. Silva, A. Millán, V. S. Amaral, F. Palacio and L. D. Carlos, Nanoscale, 2012, 4, 4799–4829 RSC.
- H. Suo, X. Zhao, Z. Zhang, Y. Wang, J. Sun, M. Jin and C. Guo, Laser Photonics Rev., 2020, 15, 2000319 CrossRef.
- X. Qiu, Q. Zhou, X. Zhu, Z. Wu, W. Feng and F. Li, Nat. Commun., 2020, 11, 4 CrossRef CAS PubMed.
- M. Sojka, W. Piotrowski, L. Marciniak and E. Zych, J. Alloys Compd., 2024, 970, 172662 CrossRef CAS.
- C. D. S. Brites, S. Balabhadra and L. D. Carlos, Adv. Opt. Mater., 2019, 7, 1801239 CrossRef.
- A. A. Ansari, A. K. Parchur, M. K. Nazeeruddin and M. M. Tavakoli, Coord. Chem. Rev., 2021, 444, 214040 CrossRef CAS.
- M. Jia, X. Chen, R. Sun, D. Wu, X. Li, Z. Shi, G. Chen and C. Shan, Nano Res., 2023, 16, 2949–2967 CrossRef CAS.
- A. M. Kaczmarek, M. Suta, H. Rijckaert, A. Abalymov, I. V. Driessche, A. G. Skirtach, A. Meijerink and P. V. D. Voort, Adv. Funct. Mater., 2020, 30, 2003101 CrossRef CAS.
- Q. Li, X. Xie, H. Wu, H. Chen, W. Wang, X. Kong and Y. Chang, Nano Lett., 2023, 23, 3444–3450 CrossRef CAS PubMed.
- J. Zhou, S. Wen, J. Liao, C. Clarke, S. A. Tawfik, W. Ren, C. Mi, F. Wang and D. Jin, Nat. Photonics, 2018, 12, 154–158 CrossRef CAS.
- H. Xu, S. Han, R. Deng, Q. Su, Y. Wei, Y. Tang, X. Qin and X. Liu, Nat. Photonics, 2021, 15, 732–737 CrossRef CAS.
- D. Zhang, J. Zhou, X. Cao, X. Ge, F. Tang, C. Zheng, J. Ning and S. Xu, J. Phys. Chem. Lett., 2023, 14, 6464–6469 CrossRef CAS PubMed.
- H. Zou, X. Yang, B. Chen, Y. Du, B. Ren, X. Sun, X. Qiao, Q. Zhang and F. Wang, Angew. Chem., Int. Ed., 2019, 58, 17255–17259 CrossRef CAS PubMed.
- L. Chen, X. Chen, R. Ma, K. Lin, Q. Li, J. Lang, C. Liu, K. Kato, L. Huang and X. Xing, J. Am. Chem. Soc., 2022, 144, 13688–13695 CrossRef CAS PubMed.
- J. Liao, M. Wang, F. Lin, Z. Han, B. Fu, D. Tu, X. Chen, B. Qiu and H. Wen, Nat. Commun., 2022, 13, 2090 CrossRef CAS PubMed.
- M. T. Dove and H. Fang, Rep. Prog. Phys., 2016, 79, 066503 CrossRef PubMed.
- H. Zou, B. Chen, Y. Hu, Q. Zhang, X. Wang and F. Wang, J. Phys. Chem. Lett., 2020, 11, 3020–3024 CrossRef CAS PubMed.
- Y. Wei, Y. Pan, E. Zhou, Z. Yuan, H. Song, Y. Wang, J. Zhou, J. Rui, M. Xu, L. Ning, Z. Liu, H. Wang, X. Xie, X. Tang, H. Su, X. Xing and L. Huang, Angew. Chem., Int. Ed., 2023, 135, e202303482 CrossRef.
- Q. Wang, J. Wen, J. Zheng, Q. Xia, C. Wei, X. Huang, Z. Mu and F. Wu, J. Lumin., 2022, 252, 119306 CrossRef CAS.
- L. Pu, P. Li, J. Zhao, Y. Wang, D. Guo, L. Li, Z. Wang and H. Suo, Laser Photonics Rev., 2023, 17, 2200884 CrossRef CAS.
- Z. Ji, Y. Cheng, X. Cui, H. Lin, J. Xu and Y. Wang, Inorg. Chem. Front., 2019, 6, 110–116 RSC.
- K. He, L. Zhang, Y. Liu, B. Xu, L. Chen and G. Bai, J. Alloys Compd., 2022, 890, 161918 CrossRef CAS.
- M. S. Pudovkin, A. K. Ginkel, O. A. Morozov, A. G. Kiiamov and M. D. Kuznetsov, J. Lumin., 2022, 249, 119037 CrossRef CAS.
- K. Chen, Z. Shao, C. Zhang, S. Jia, T. Deng, R. Zhou, Y. Zhou and E. Song, Chem. Eng. J., 2023, 477, 147165 CrossRef CAS.
- D. Jaque and F. Vetrone, Nanoscale, 2012, 4, 4301–4326 RSC.
- A. Bednarkiewicz, L. Marciniak, L. D. Carlos and D. Jaque, Nanoscale, 2020, 12, 14405–14421 RSC.
- H. Suo, X. Zhao, Z. Zhang and C. Guo, Chem. Eng. J., 2020, 389, 124506 CrossRef CAS.
- L. Pu, Y. Wang, J. Zhao, M. Jin, L. Li, P. Li, Z. Wang, C. Guo and H. Suo, Chem. Eng. J., 2022, 449, 137890 CrossRef CAS.
- H. Lv, P. Du, L. Luo and W. Li, Mater. Adv., 2021, 2, 2642–2648 RSC.
- L. Wang, F. Wang, P. Yuan, Q. Sun, E. Liang, Y. Jia and Z. Guo, Mater. Res. Bull., 2013, 48, 2724–2729 CrossRef CAS.
- X. Liu, Y. Cheng, E. Liang and M. Chao, Phys. Chem. Chem. Phys., 2014, 16, 12848–12857 RSC.
- Y. Yang, L. Lin, P. Lu, Z. Feng, Z. Li, J. Cai, Z. Mei, Y. Huang, W. Guo, Z. Wang and Z. Zheng, J. Lumin., 2021, 240, 118410 CrossRef CAS.
- Z. Zhang, M. Jin, L. Yao and C. Guo, Opt. Mater., 2021, 121, 111607 CrossRef CAS.
- X. Jiang, Y. Sun, X. Wang, L. Hu, S. Chen and Q. Yang, J. Lumin., 2022, 251, 119146 CrossRef CAS.
- C. Gu, Y. Ding, X. Quan, M. Gong, J. Yu, D. Zhao and C. Li, J. Rare Earth, 2021, 39, 1024–1030 CrossRef CAS.
- S. K. Singh, K. Kumar and S. B. Rai, Sens. Actuators, A, 2009, 149, 16–20 CrossRef CAS.
- A. Pandey, V. K. Rai, V. Kumar, V. Kumar and H. C. Swart, Sens. Actuators, B, 2015, 209, 352–358 CrossRef CAS.
- Ž. Antić, M. D. Dramićanin, K. Prashanthi, D. Jovanović, S. Kuzman and T. Thundat, Adv. Mater., 2016, 28, 7745–7752 CrossRef PubMed.
- Y. Gao, F. Huang, H. Lin, J. Zhou, J. Xu and Y. Wang, Adv. Funct. Mater., 2016, 26, 3139–3145 CrossRef CAS.
- H. Suo, F. Hu, X. Zhao, Z. Zhang, T. Li, C. Duan, M. Yin and C. Guo, J. Mater. Chem. C, 2017, 5, 1501–1507 RSC.
- Y. Chen, J. Chen, Y. Tong, W. Zhang, X. Peng, H. Guo and D. Huang, J. Rare Earths, 2021, 39, 1512–1519 CrossRef CAS.
- Y. Sun, M. Chen, P. Xiong, Y. Wang, S. Tian, Q. Jiang, Y. Xiao, H. Zhou, P. Shao, Q. Zhan, J. Gan, Q. Qian, D. Chen and Z. Yang, Adv. Powder Mater., 2023, 2, 100132 CrossRef.
- J. Xiang, J. Zheng, X. Zhao, X. Zhou, C. Chen, M. Jin and C. Guo, Mater. Chem. Front., 2022, 6, 440–449 RSC.
- M. Jin, Y. Wu, Z. Zhang, J. Xiang and C. Guo, Opt. Laser Technol., 2022, 152, 108144 CrossRef CAS.
- H. Suo, C. Guo, Z. Yang, S. Zhou, C. Duan and M. Yin, J. Mater. Chem. C, 2015, 3, 7379–7385 RSC.
- Q. Yang, L. Zhao, Z. Fang, Z. Yang, J. Cao, Y. Cai, D. Zhou, X. Yu, J. Qiu and X. Xu, J. Rare Earths, 2021, 39, 712–717 CrossRef CAS.
- G. Bao, K. Wong, D. Jin and P. A. Tanner, Light-Sci. Appl., 2018, 7, 96 CrossRef PubMed.
- J. Tang, Y. Wu, M. Jin, Y. Li, C. Chen, J. Xiang and C. Guo, Inorg. Chem., 2022, 61, 20035–20042 CrossRef CAS PubMed.
- W. Chen, M. Jin, J. Tang, Y. Li, C. Chen, J. Xiang, Z. Li and C. Guo, J. Lumin., 2023, 263, 120132 CrossRef CAS.
- S. Yakunin, B. M. Benin, Y. Shynkarenko, O. Nazarenko, M. I. Bodnarchuk, D. N. Dirin, C. Hofer, S. Cattaneo and M. V. Kovalenko, Nat. Mater., 2019, 18, 846–852 CrossRef CAS PubMed.
- A. F. Bravo, D. Wang, E. S. Barnard, A. Teitelboim, C. Tajon, J. Guan, G. C. Schatz, B. E. Cohen, E. M. Chan, P. J. Schuck and T. W. Odom, Nat. Mater., 2019, 18, 1172–1176 CrossRef PubMed.
Footnote |
| † Electronic supplementary information (ESI) available. See DOI: https://doi.org/10.1039/d4tc01352b |
| This journal is © The Royal Society of Chemistry 2024 |

