Significant enhancement of the photon upconversion of a single fluorescent microsphere via annular near-field localization†
Chuangxin
Wu‡
a,
Jiujie
Zeng‡
a,
Guozheng
Nie
a,
Shiping
Zhan
 *b,
Xiaofeng
Wu
b and
Yunxin
Liu
 *a
*a
aDepartment of Physics and Electronic Science, Hunan University of Science and Technology, Xiangtan, 411201, China. E-mail: lyunxin@163.com
bSchool of Mechatronic Engineering and Automation, Foshan University, Foshan, 528000, P. R. China. E-mail: spzhan86@163.com
First published on 17th May 2024
Abstract
Fluorescent microspheres exhibit unique emissions at the microscale and have been widely used as probes for immunoassays and advanced micro-sensors. Herein, we report the localized enhancement of the photon upconversion of a single fluorescent microsphere via annular near-field confinement. The single fluorescent microspheres were composed of a 5 μm polystyrene (PS) microsphere coated with upconversion nanoparticles. Ten gold microspheres with a diameter of 5 μm were used for the construction of a “pagoda”-like microcavity. Interestingly, the emission of a single fluorescent microsphere on the “pagoda”-like microcavity was enhanced by tens of times (e.g., 540 nm and 650 nm emissions of Er3+ were increased by 46 times and 40 times, respectively). Theoretical calculations based on the FDTD method confirmed that the confined annular near field overlapped well with the upconversion nanoparticles distributed on the surface of the single fluorescent microsphere so that the emission of the single fluorescent microsphere was significantly enhanced.
Introduction
Fluorescent microspheres have been widely used as probes for immunoassays1 and applied in the fields of clinical diagnosis,2 food safety,3 and environmental monitoring.4 A variety of fluorescent microspheres have been developed and fabricated based on fluorescent dyes, quantum dots, and upconversion nanoparticles.5–7 Among these fluorescent microspheres, PS microspheres coated with upconversion nanoparticles have attracted special attention owing to their high performance gas sensing and use in infrared sensors and optical thermometers.8–10Lanthanide-doped upconversion nanoparticles (UCNPs) can absorb low-energy infrared photons to emit higher-energy visible photons.11–19 This unique property makes them potentially suitable for applications in bioimaging,20,21 biodetection,22–24 advanced optoelectronic devices,25–27 gas sensors,28,29 and anti-counterfeiting technology30,31 and so on. The luminescence of upconversion nanoparticles can be effectively enhanced by tuning the intrinsic parameters of the nanoparticles, such as functionalizing the core–shell structure of upconversion nanocrystals,32,33 changing the crystalline phase,34,35 and doping with different emitters and sensitizers.36,37 Herein, we show that the luminescence of a single PS microsphere coated with upconversion nanoparticles can be significantly enhanced by annular near-field confinement.
The confined annular near-field was generated via a specifically designed “pagoda” constructed with Au microspheres. A single PS microsphere coated with upconversion nanoparticles was located on the center of the annular near-field so that upconversion emission of the single fluorescence microsphere was remarkably enhanced.
Results and discussion
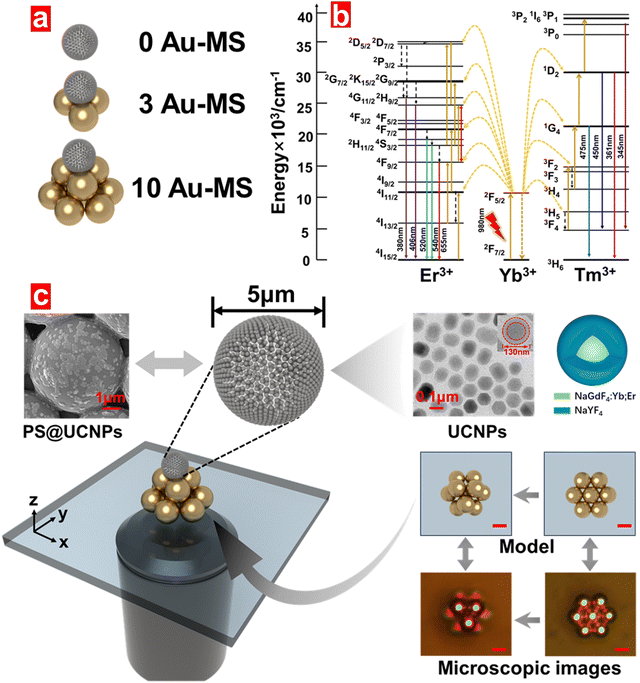
We aimed to explore the influence of near-field confinement on the emission of a single fluorescent microsphere (PS microsphere coated with upconversion nanoparticles, referred to as PS@UCNPs). A pagoda constructed with ten Au microspheres was designed for generating an annular near field. For comparison, three different models, i.e., a single PS@UCNPs fluorescent microsphere supported by zero (0 Au), three (3 Au), and ten gold microspheres (10 Au), were built and investigated. Fig. 1(a) shows a schematic of this microcavity model. Fig. 1(b) depicts a schematic diagram of the energy levels and possible excitation and emission processes that may occur in the luminescence of UCNPs after absorbing low-energy infrared photons. Due to their anti-Stokes properties, these particles emit high-energy visible light. During the experiment, we realized a controlled manipulation of microspheres with a diameter of 5 μm via an operation platform, as shown in Fig. 1(c). The top left shows the SEM image of a single PS@UCNPs fluorescent microsphere, while the TEM image and the structure model of its attached UCNPs are presented in the top right. Models and microscopic images for illustrating a “pagoda”-like open microcavity composed of 10 gold microspheres and its bottom structure with 7 gold microspheres are shown in the bottom right. Using the manipulation platform, we were able to precisely construct a pagoda-like open microcavity and then placed a single fluorescent microsphere right on the top of the pagoda.The morphology of a single microsphere is shown in Fig. 2(a) and (b), while its emission is presented in Fig. 2(c). It is clear that the microsphere emitted green light under 980 nm infrared light excitation due to the coated upconversion nanoparticles of NaGdF4![[thin space (1/6-em)]](https://www.rsc.org/images/entities/char_2009.gif) :
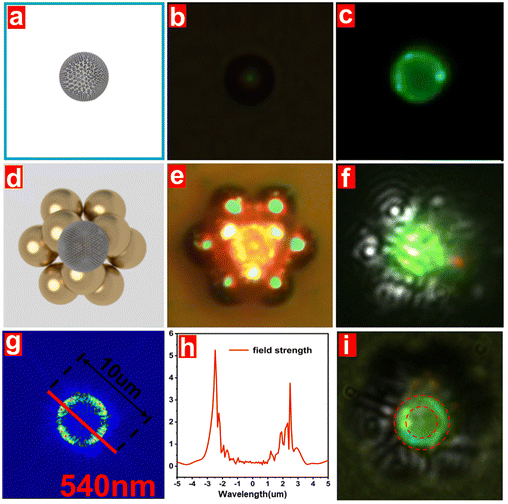
:![[thin space (1/6-em)]](https://www.rsc.org/images/entities/char_2009.gif) Yb,Er@NaYF4. The photon upconversion processes can be simply demonstrated as follows: the Yb3+ ion first absorbs a 980 nm excitation photon and transits from the 2F7/2 to upper 2F5/2 state, and then goes down to the ground state 2F7/2 to transfer its energy to the Er3+ ion for populating the excited state of 4I11/2. The 4I11/2 state will transit to the upper 4F7/2 state when absorbing the 980 nm photon from the Yb3+ ion again. The 4F7/2 state of Er3+ will relax to the 4S3/2, 2H11/2, and 4F9/2 states by non-radiative processes. The 4S3/2, 2H11/2, and 4F9/2 states of the Er3+ ion go down to ground state of 4I15/2 for emitting 540 nm and 520 nm green light and 655 nm red light. In order to investigate the influence of the annular near field confinement, a single PS@UCNPs microsphere was located on the top of the pagoda with 10 Au microspheres, as shown in Fig. 2(d) and (e), and the emission is presented in Fig. 2(f). It can be observed from Fig. 2(c) and (f) that, for the same PS@UCNPs microsphere with the same excitation power density, the emission of the PS@UCNPs microsphere on the top of the pagoda was much stronger than that without the pagoda (excitation power density: 2.0 W mm−2). Based on the finite difference time domain (FDTD) calculations in Fig. 2(g), it can be determined that the pagoda composed of Au spheres could confine the 540 nm emission in an annular area around the PS@UCNPs microsphere. The linear distribution of the cross-section of the annular near field is presented in Fig. 2(h). On the other hand, it should be noted that the upconversion nanoparticles were distributed on the surface of the PS sphere, not the inner region of the microsphere. As a result, the emissions of most of the upconversion nanoparticles were enhanced due to the annular near field confinement. Actually, the annular emission characteristic can be clearly observed from Fig. 2(i) when exciting the pagoda supported PS@UCNPs microsphere with a lower power density (0.5 W mm−2). The surface plasma could be generated under the irradiation of 980 nm infrared light, but the theoretical calculation revealed that the surface plasma was negligible due to the large particle size of the Au microspheres (5 μm).
Yb,Er@NaYF4. The photon upconversion processes can be simply demonstrated as follows: the Yb3+ ion first absorbs a 980 nm excitation photon and transits from the 2F7/2 to upper 2F5/2 state, and then goes down to the ground state 2F7/2 to transfer its energy to the Er3+ ion for populating the excited state of 4I11/2. The 4I11/2 state will transit to the upper 4F7/2 state when absorbing the 980 nm photon from the Yb3+ ion again. The 4F7/2 state of Er3+ will relax to the 4S3/2, 2H11/2, and 4F9/2 states by non-radiative processes. The 4S3/2, 2H11/2, and 4F9/2 states of the Er3+ ion go down to ground state of 4I15/2 for emitting 540 nm and 520 nm green light and 655 nm red light. In order to investigate the influence of the annular near field confinement, a single PS@UCNPs microsphere was located on the top of the pagoda with 10 Au microspheres, as shown in Fig. 2(d) and (e), and the emission is presented in Fig. 2(f). It can be observed from Fig. 2(c) and (f) that, for the same PS@UCNPs microsphere with the same excitation power density, the emission of the PS@UCNPs microsphere on the top of the pagoda was much stronger than that without the pagoda (excitation power density: 2.0 W mm−2). Based on the finite difference time domain (FDTD) calculations in Fig. 2(g), it can be determined that the pagoda composed of Au spheres could confine the 540 nm emission in an annular area around the PS@UCNPs microsphere. The linear distribution of the cross-section of the annular near field is presented in Fig. 2(h). On the other hand, it should be noted that the upconversion nanoparticles were distributed on the surface of the PS sphere, not the inner region of the microsphere. As a result, the emissions of most of the upconversion nanoparticles were enhanced due to the annular near field confinement. Actually, the annular emission characteristic can be clearly observed from Fig. 2(i) when exciting the pagoda supported PS@UCNPs microsphere with a lower power density (0.5 W mm−2). The surface plasma could be generated under the irradiation of 980 nm infrared light, but the theoretical calculation revealed that the surface plasma was negligible due to the large particle size of the Au microspheres (5 μm).
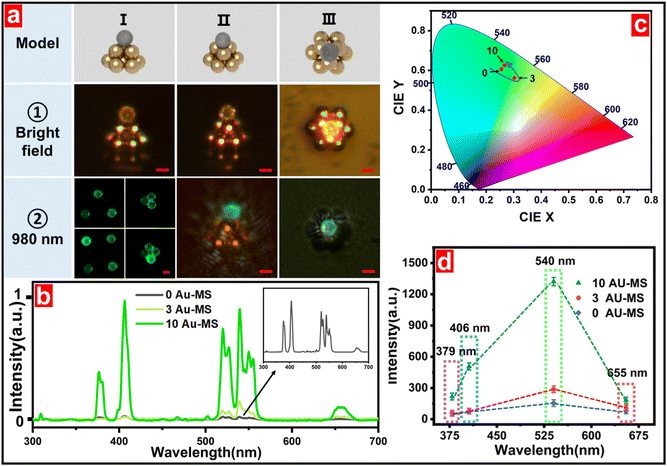
We constructed this pagoda model in the self-loaded manipulation platform. The pagoda model with different angles of view is shown in the upper row of Fig. 3(a), while the microscope images of the pagoda with and without 980 nm infrared irradiation are shown in the middle and lower rows of Fig. 3(a), respectively. The corresponding emission spectra are shown in Fig. 3(b). It was observed that the gold sphere pagoda could lead to a significant enhancement of the luminescence of the single PS@UCNPs microsphere. Based on the normalized integral fluorescence intensities in Fig. 3(d), the intensity difference of PS@UCNPs with and without the Au-sphere pagoda could be directly determined. For the green emission peak at 540 nm, a single PS@UCNPs microsphere with the pagoda of 10 Au spheres exhibited an emission 46 times stronger than that without the pagoda. Meanwhile, it should be noted that a single PS@UCNPs microsphere with the support of 3 Au spheres also exhibited stronger emission (∼8 times) than that without Au microspheres, but its enhancement factor was obviously lower than that with the pagoda of 10 Au spheres. For the violet peak at 406 nm and red emission peak at 655 nm, the intensity of a single PS@UCNPs microsphere with the support of 10 Au spheres was enhanced by more than 37 times and 40 times, respectively, relative to the one without the pagoda. We found that the gold sphere model not only significantly enhanced the fluorescence intensity, but also had a subtle effect on the relative intensity of the fluorescence in different bands. It could be observed from the chromatogram in Fig. 3(c) that the chromatic coordinates of fluorescence migrated lightly to different degrees with changing the support of Au spheres. The efficient tuning of the microcavity on the emission color was demonstrated in detail in another work by our group.
In order to investigate the influence of the annular near field confinement on the emission wavelength, we coated PS microspheres with UCNPs (NaYF4@NaYbF4![[thin space (1/6-em)]](https://www.rsc.org/images/entities/char_2009.gif) :
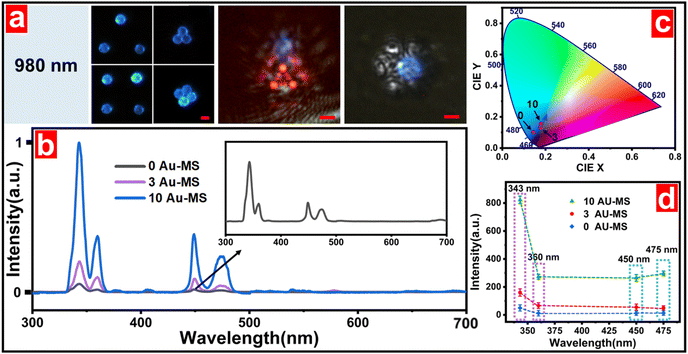
:![[thin space (1/6-em)]](https://www.rsc.org/images/entities/char_2009.gif) 0.5%Tm@NaYF4)38 emitting blue light. The microscopic images of these blue PS@UCNPs microspheres with and without the support of the Au-sphere pagoda are shown in Fig. 4(a). Fig. 4(b) shows the fluorescence spectra of a single blue PS@UCNPs microsphere with and without the Au-sphere pagoda. It is clear that the Au-sphere pagoda also had a remarkable influence on the emission of the single blue PS@UCNPs microsphere. In comparison with the condition without the Au-sphere pagoda, the 475, 450, 360, and 343 nm emissions of a single blue PS@UCNPs microsphere with the Au-sphere pagoda were enhanced by more than 23 times, 23 times, 24 times, and 19 times, respectively. From the chromatogram in Fig. 4(c), it could be observed that the color coordinates of the blue PS@UCNPs microsphere also displayed a slight shift when adding the support of the Au-sphere pagoda.
0.5%Tm@NaYF4)38 emitting blue light. The microscopic images of these blue PS@UCNPs microspheres with and without the support of the Au-sphere pagoda are shown in Fig. 4(a). Fig. 4(b) shows the fluorescence spectra of a single blue PS@UCNPs microsphere with and without the Au-sphere pagoda. It is clear that the Au-sphere pagoda also had a remarkable influence on the emission of the single blue PS@UCNPs microsphere. In comparison with the condition without the Au-sphere pagoda, the 475, 450, 360, and 343 nm emissions of a single blue PS@UCNPs microsphere with the Au-sphere pagoda were enhanced by more than 23 times, 23 times, 24 times, and 19 times, respectively. From the chromatogram in Fig. 4(c), it could be observed that the color coordinates of the blue PS@UCNPs microsphere also displayed a slight shift when adding the support of the Au-sphere pagoda.
The extinction coefficients of the structures with 3 and 10 Au microspheres (The diameter of Au microspheres was 5 μm) were calculated using the FDTD method and the results are shown in Fig. 5. It could be easily determined that the extinction efficient of the pagoda with 10 Au microspheres was obviously higher than that with only 3 Au microspheres. In addition, it could be noted that the Au-sphere pagoda exhibited different extinction efficiencies at different wavelengths. The strongest extinction peak was located at 495 nm while the weakest extinction valley was located at 655 nm. The higher extinction efficient of the pagoda with 10 Au spheres indicated a stronger near field confinement, and thus a higher enhancement factor for the emissions.
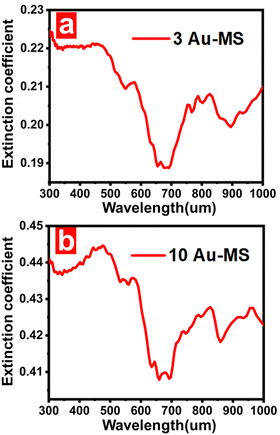 | ||
| Fig. 5 Extinction spectra of (a) the triangle structure with 3 Au microspheres and (b) the pagoda-like microcavity with 10 Au microspheres. | ||
Conclusion
Localized enhancement of the photon upconversion of a single fluorescent microsphere via annular near-field confinement was demonstrated. Single fluorescent microspheres were composed of a PS microsphere with the diameter of 5 μm coated with upconversion nanoparticles. Ten gold microspheres with the diameter of 5 μm were used for construction a pagoda-like microcavity. The open microcavity could confine the emissions with various wavelengths in an annular region, which could lead to remarkable emission enhancement of the single fluorescent microsphere. The theoretical calculation-based FDTD method confirmed that the confined annular near field overlapped well with the upconversion nanoparticles distributed on the surface of the single fluorescent microsphere, so that the emission of the single fluorescent microsphere was significantly enhanced. The presented findings not only provide a new solution for enhancing the emission of a single fluorescent microsphere, but also opens up a potential window for tailoring the emission color.Conflicts of interest
There are no conflicts to declare.Acknowledgements
This work was funded by the National Natural Science Foundation of China (Grant No. 62275079 and 62175062) and Natural Science Foundation of Guangdong Province (Grant No. 2023A1515011130).References
- X. Zhang, X. Yu, K. Wen, C. Li, G. Mujtaba Mari, H. Jiang, W. Shi, J. Shen and Z. Wang, J. Agric. Food Chem., 2017, 65, 8063–8071 CrossRef CAS PubMed
.
- D.-B. Wang, B. Tian, Z.-P. Zhang, X.-Y. Wang, J. Fleming, L.-J. Bi, R.-F. Yang and X.-E. Zhang, Biosens. Bioelectron., 2015, 67, 608–614 CrossRef CAS PubMed
.
- S. Ahmed, J. Ning, D. Peng, T. Chen, I. Ahmad, A. Ali, Z. Lei, M. Abubakr Shabbir, G. Cheng and Z. Yuan, Food Agric. Immunol., 2020, 31, 268–290 CrossRef CAS
.
- B. Qiao, Y. Li, P. Hu, Y. Sun, Z. Si, S. Lu, H. Ren, Z. Liu, Y. Zhang and L. Meng, Sens. Actuators, B, 2018, 262, 221–227 CrossRef CAS
.
- M. You, M. Lin, Y. Gong, S. Wang, A. Li, L. Ji, H. Zhao, K. Ling, T. Wen and Y. Huang, ACS Nano, 2017, 11, 6261–6270 CrossRef CAS PubMed
.
- M. Ren, H. Xu, X. Huang, M. Kuang, Y. Xiong, H. Xu, Y. Xu, H. Chen and A. Wang, ACS Appl. Mater. Interfaces, 2014, 6, 14215–14222 CrossRef CAS PubMed
.
- D. Lou, L. Fan, Y. Cui, Y. Zhu, N. Gu and Y. Zhang, Anal. Chem., 2018, 90, 6502–6508 CrossRef CAS PubMed
.
- H. He, B. Liu, S. Wen, J. Liao, G. Lin, J. Zhou and D. Jin, Anal. Chem., 2018, 90, 12356–12360 CrossRef CAS PubMed
.
- G. Huang, X. Wu, S. Zhan and Y. Liu, J. Mater. Chem. C, 2022, 10, 5190–5199 RSC
.
- X. Wu, S. Cheng, G. Huang, S. Zhan, G. Nie, X. Su, D. Cheng and Y. Liu, Ceram. Int., 2024, 50, 3843–3851 CrossRef CAS
.
- X. Wu, S. Zhan, J. Han and Y. Liu, Nano Lett., 2020, 21, 272–278 CrossRef PubMed
.
- Y. Liu, J. Vanacken, X. Chen, J. Han, Z. Zhong, Z. Xia, B. Chen, H. Wu, Z. Jin and J. Y. Ge, Adv. Mater., 2019, 31, 1806341 CrossRef PubMed
.
- F. Wang, Y. Han, C. S. Lim, Y. Lu, J. Wang, J. Xu, H. Chen, C. Zhang, M. Hong and X. Liu, Nature, 2010, 463, 1061–1065 CrossRef CAS PubMed
.
- J. Zhou, A. I. Chizhik, S. Chu and D. Jin, Nature, 2020, 579, 41–50 CrossRef CAS PubMed
.
- B. Zhou, B. Shi, D. Jin and X. Liu, Nat. Nanotechnol., 2015, 10, 924–936 CrossRef CAS PubMed
.
- Y. Liu, Y. Lu, X. Yang, X. Zheng, S. Wen, F. Wang, X. Vidal, J. Zhao, D. Liu and Z. Zhou, Nature, 2017, 543, 229–233 CrossRef CAS PubMed
.
- H. Dong, L.-D. Sun and C.-H. Yan, Chem. Soc. Rev., 2015, 44, 1608–1634 RSC
.
- W. Xu, J. Liu, B. Dong, J. Huang, H. Shi, X. Xue and M. Liu, Sci. Adv., 2023, 9, eadi7931 CrossRef CAS PubMed
.
- Z.-H. Chen, H. Quan, Y. Wang and Y. Yang, IEEE Photonics J., 2019, 11, 1–8 Search PubMed
.
- J. Xu, P. Yang, M. Sun, H. Bi, B. Liu, D. Yang, S. Gai, F. He and J. Lin, ACS Nano, 2017, 11, 4133–4144 CrossRef CAS PubMed
.
- Q. Liu, T. Yang, W. Feng and F. Li, J. Am. Chem. Soc., 2012, 134, 5390–5397 CrossRef CAS PubMed
.
- W. Zheng, P. Huang, D. Tu, E. Ma, H. Zhu and X. Chen, Chem. Soc. Rev., 2015, 44, 1379–1415 RSC
.
- Q. Su, W. Feng, D. Yang and F. Li, Acc. Chem. Res., 2017, 50, 32–40 CrossRef CAS PubMed
.
- N. M. Idris, M. K. Gnanasammandhan, J. Zhang, P. C. Ho, R. Mahendran and Y. Zhang, Nat. med., 2012, 18, 1580–1585 CrossRef CAS PubMed
.
- Y. Zhai, X. Yang, F. Wang, Z. Li, G. Ding, Z. Qiu, Y. Wang, Y. Zhou and S. T. Han, Adv. Mater., 2018, 30, 1803563 CrossRef PubMed
.
- X. Yin, W. Xu, G. Zhu, Y. Ji, Q. Xiao, X. Dong, M. He, B. Cao, N. Zhou, X. Luo, L. Guo and B. Dong, Nat. Commun., 2022, 13, 6549 CrossRef CAS PubMed
.
- Y. Ji, W. Xu, D. Li, D. Zhou, X. Chen, N. Ding, J. Li, N. Wang, X. Bai and H. Song, Nano Energy, 2019, 61, 211–220 CrossRef CAS
.
- B. Gu and Q. Zhang, Adv. Sci., 2018, 5, 1700609 CrossRef PubMed
.
- Z.-H. Chen, L. Li, H. Shi, Y. Wang, F. Sun and Y. Yang, IEEE J. Sel. Top. Quantum Electron., 2021, 27, 1–7 Search PubMed
.
- X. Liu, Y. Wang, X. Li, Z. Yi, R. Deng, L. Liang, X. Xie, D. T. Loong, S. Song and D. Fan, Nat. Commun., 2017, 8, 899 CrossRef PubMed
.
- H. Suo, Q. Zhu, X. Zhang, B. Chen, J. Chen and F. Wang, Mater. Today Phys., 2021, 21, 100520 CrossRef CAS
.
- D. Hudry, I. A. Howard, R. Popescu, D. Gerthsen and B. S. Richards, Adv. Mater., 2019, 31, 1900623 CrossRef PubMed
.
- W. Xu, X. Chen and H. Song, Nano Today, 2017, 17, 54–78 CrossRef CAS
.
- B. Chen and F. Wang, Acc. Chem. Res., 2019, 53, 358–367 CrossRef PubMed
.
- D. T. Klier and M. U. Kumke, J. Mater. Chem. C, 2015, 3, 11228–11238 RSC
.
- S. Wen, J. Zhou, K. Zheng, A. Bednarkiewicz, X. Liu and D. Jin, Nat. Commun., 2018, 9, 2415 CrossRef PubMed
.
- D. Zhou, R. Sun, W. Xu, N. Ding, D. Li, X. Chen, G. Pan, X. Bai and H. Song, Nano Lett., 2019, 19, 6904–6913 CrossRef CAS PubMed
.
- B. Zhou, B. Tang, C. Zhang, C. Qin, Z. Gu, Y. Ma, T. Zhai and J. Yao, Nat. Commun., 2020, 11, 1174 CrossRef CAS PubMed
.
Footnotes |
| † Electronic supplementary information (ESI) available. See DOI: https://doi.org/10.1039/d4tc01063a |
| ‡ Contributed equally. |
| This journal is © The Royal Society of Chemistry 2024 |

