First-principles study of the oxidation susceptibility of WS2, WSe2, and WTe2 monolayers†
Ashima
Rawat
*a,
Lokanath
Patra
b,
Ravindra
Pandey
 a and
Shashi P.
Karna
*c
aDepartment of Physics, Michigan Technological University, Houghton, MI 49931, USA. E-mail: arawat2@mtu.edu
bDepartment of Mechanical Engineering, University of California, Santa Barbara, Santa Barbara, CA 93106-5070, USA
cDEVCOM Army Research Laboratory, Weapons, and Materials Research Directorate, ATTN: FCDD-RLW, Aberdeen Proving Ground, Aberdeen, Maryland 21005-5069, USA. E-mail: shashi.p.karna.civ@army.mil
First published on 13th March 2024
Abstract
The environmental stability of two-dimensional (2D) transition metal dichalcogenide monolayers is of great importance for their applications in electronic, photonic, and energy storage devices. In this study, we focus on understanding the susceptibility of WS2, WSe2, and WTe2 monolayers to oxygen exposure in the form of atomic oxygen and O2 and O3 molecules, respectively. Calculations based on the van der Waals-corrected density functional theory predicted that O2 and O3 molecules are weakly adsorbed on these monolayers, although atomic oxygen prefers chemisorption accompanied by a significant charge transfer from the surface to oxygen. In the physisorbed molecular configurations consisting of O2 and O3, the partially oxidized monolayers retain their geometrical and electronic structures. The calculated transition path as the oxygen approaches the surface shows a high-energy barrier for all cases, thus explaining the photo-induced formation of the oxidized configurations in the experiments. Furthermore, oxidizing the WS2 monolayer is predicted to modify its electronic structure, reducing the band gap with increasing oxygen coverage on the surface. Overall, the calculated results predict the resilience of WS2, WSe2, and WTe2 monolayers against oxygen exposure, thus ensuring stability for devices fabricated with these monolayers.
1. Introduction
Two-dimensional (2D) semiconductors, especially transition metal dichalcogenides (TMDs), such as WX2 and MoX2 (X: S, Se, Te), have emerged as an attractive class of materials for a wide range of applications in electronics and optoelectronics devices because of their unique electronic properties, such as high carrier mobility, tunable band gap, and anisotropic electron transport.1–11 However, their device applications also encounter challenges due to their enhanced susceptibility to oxidation under ambient conditions. This rather undesirable chemical property has drawn considerable attention in understanding the stability and oxidation behavior of TMDCs, especially WS2 and MoS2.12–15 In a recent study of thermal stability, Rahman et al.16 found that the monolayer MoS2 is quite stable up to a temperature of 1300 K against oxidation. However, at 1400 K, oxidation initiation begins, and by 1500 K, MoS2 readily reacts with O2. Another study by Zhao et al. delved into O2 adsorption on both pristine and defective TMD monolayers. The research highlighted the inert nature of defect-free TMDs to O2, while oxidation, an exothermic process, primarily occurred at chalcogen vacancies with adsorption energies ranging from 1.8 to 3.9 eV.17 Investigations on bilayer MoS2 demonstrated a substantial reduction in the “ON” state current under ambient conditions. The reduced current was attributed to additional scattering centers from chemisorption on defect sites, indicating the sensitivity of TMDs to ambient conditions and the impact on electronic properties.18 For the case of WS2, a recent experimental study has demonstrated its oxidation under exposure to UV light, but this photo-oxidation of WS2 is not fully understood.19 These studies collectively provide an enhanced understanding of the susceptibility of TMDs toward oxidation and its implications on device performance. However, this understanding also raises the following questions: (1) What is the mechanism of oxidation of TMDs? (2) What kind of oxidative species are more effective in oxidizing TMDs, thereby affecting the electronic band structure and other electronic properties? To address these questions, we have systematically studied the reaction of three oxidizing species, namely free O atoms and O2 and O3 molecules with WS2, WSe2, and WTe2 within the framework of density functional theory (DFT) and climbing image nudged elastic band (CINEB) methods. Our emphasis will be on understanding the effects on geometrical and electronic structures and trying to develop a detailed understanding of the oxidation process in terms of chemical bonding, dissociation energy, and density of states in the current study.2. Computational method
DFT-based calculations using the projected augmented wave (PAW) pseudopotential20 were performed as implemented in the Vienna ab initio simulation package (VASP).21–24 The Perdew–Burke–Ernzerhof form of the generalized gradient approximation (PBE-GGA)25 was used, along with the van der Waals (vdW) correction term (D3) proposed by Grimme.26 The convergence criteria for energy and the Hellmann–Feynman force acting on each atom were set to 10−6 eV and 0.01 eV Å−1, respectively. The Brillouin zone was sampled using a centered k-point grid of size (12 × 12 × 1). A (2 × 2 × 1) periodic supercell was constructed for the monolayers, and periodic image interactions were minimized by using a vacuum of 15 Å along the z-axis direction. The dynamic stability of the system was determined by calculating the phonon frequencies using the PHONOPY package,27,28 for which the force constants were obtained using density functional perturbation theory.29The oxygen adsorption energy (Eadsorption) was calculated using the following expression.30–34
| Eadsorption = E(oxygen+WX2) − (E(WX2) + E(oxygen)) | (1) |
The CINEB method,35 as implemented in VASP, was employed to calculate the minimum energy paths describing the interaction between an oxygenous species, atomic oxygen, and O2 and O3 molecules, respectively, and a TMD monolayer. The CINEB method generates a set of six intermediate configurations (i.e., images) from the predetermined initial and final configurations. The initial (non-interacting) configuration consists of a molecule about 4.5 Å above the surface for these calculations. The final configuration consists of dissociated oxygens (atomic oxygen or O2 or O3 molecule) adsorbed on the monolayer.36
3. Results and discussion
Fig. 1 shows the hexagonal (2 × 2) supercell considered for the calculations. For the pristine WS2, WSe2, and WTe2 monolayers, the calculated lattice constants and band gaps are presented in Table 1 and the band structures are provided in Fig. S1, (ESI†) which are in good agreement with the previously reported DFT values. Table S1 (ESI†) lists the structural properties of O2 and O3 molecules calculated at the DFT (GGA) level of theory and are reasonably in good agreement with reported theoretical and experimental values: O2: 1.24 Å (DFT)41 and 1.21 Å (experiment)42 and O3: 1.28 Å (DFT43 and experiment44), 116.49° (experiment)43 and 117.90° (DFT).44 | ||
| Fig. 1 (a) Side and (b) top views of the pristine WS2, WSe2, and WTe2 monolayers. Color codes: gray: W and pink: chalcogen (S/Se/Te). | ||
The equilibrium configurations of the oxygen adsorbed on WS2, WSe2, and WTe2 monolayers are shown in Fig. 2. Three different surface sites were considered for adsorption calculations: (chalcogen)top, Wtop, and hollow. Interestingly, the energetically preferred sites, shown in Fig. 2, consist of an O atom forming a bond with the chalcogen atom (i.e., the (chalcogen)top site). The remaining O atoms in O2 and O3 are slightly elongated parallel to the surface approaching the neighboring chalcogen atom. Table 2 lists the adsorption energy (Eadsorb), dissociation energy (Ediss), molecule–surface distance (RX–O), charge transferred from the surface to molecule (Qo), and activation barrier height (Ebarrier), describing the interaction of O, O2, and O3 with the WS2, WSe2, and WTe2 monolayers. Note that the dissociation energy (Ediss) was calculated as the difference between the total energy of the dissociated configuration (i.e., O2 → O + O or O3 → O + O + O) and the non-interacting configuration consisting of a molecule of about 4.5 Å above the surface.36
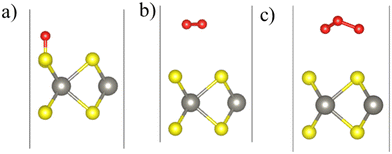 | ||
| Fig. 2 Calculated equilibrium configurations of (a) O, (b) O2, and (c) O3 molecules adsorbed on the WS2 monolayer. Color code: S (yellow), W (gray), and O (red). | ||
| Monolayer | WS2 | WSe2 | WTe2 | ||
|---|---|---|---|---|---|
| O | Chemisorption | E adsorb, eV per atom | −3.92 | −3.00 | −3.44 |
| R x–o, Å | 1.48 | 1.65 | 1.85 | ||
| Q 0/O atom | 1.91e | 0.86e | 0.98e | ||
| O2 | Physisorption | E adsorb, eV per atom | −0.05 | −0.03 | −0.16 |
| R x–o, Å | 3.39 | 3.59 | 3.67 | ||
| Q 0/O atom | ≈0.0e | 0.03e | 0.08e | ||
| Dissociation | E diss, eV | −0.96 | 1.23 | 0.28 | |
| R x–o, Å | 1.48 | 1.65 | 1.82 | ||
| Q 0/O atom | 1.9e | 0.81e | 1.08e | ||
| E barrier, eV | 5.47 | 5.17 | 5.05 | ||
| O3 | Physisorption | E adsorb, eV per atom | −0.07 | −0.08 | −0.14 |
| R x–o, Å | 3.05 | 2.95 | 2.93 | ||
| Q 0/O atom | 0.06e | 0.15e | 0.22e | ||
| Dissociation | E diss, eV | −1.43 | 1.04 | ≈0 | |
| R x–o (Å) | 1.48 | 1.65 | 1.82 | ||
| Q 0/O atom | 1.88e | 0.58e | 0.77e | ||
| E barrier, eV | 6.03 | 7.30 | 6.85 |
Atomic oxygen interacting with the WS2, WSe2, and WTe2 monolayers tends to chemisorb itself onto the top of the chalcogen atom (i.e., S or Se or Te) with an equilibrium bond distance, Rx–o, of 1.48, 1.65, and 1.85 Å for WS2, WSe2, and WTe2, respectively. The calculated Eadsorb is −3.92, −3.0, and −3.44 eV for WS2, WSe2, and WTe2, respectively. We note that atomic oxygen forms an ionic-covalent bond with an S atom of WS2 as in the SO molecule for which RS–O is 1.48 Å.45 The bonding follows a relatively large charge transfer (1.91e) from the monolayer (S) to atomic O, thereby resulting in chemisorption on the surface. A lesser degree of ionicity is predicted for the Se–O and Te–O bonds for the chemisorbed complexes on the WSe2 and WTe2 monolayers. In the context of monolayers composed of WX2, the interaction between tungsten (W) and chalcogen (X) atoms is characterized by a reduction in the charge transfer from W to X, i.e. ΔQ = 1.31e, 0.56e, and 0.11e for WS2, WSe2, and WTe2, respectively.46 Hence the affinity of oxygen for forming a bond with S is much higher than those for Se and Te since S has more charge than Se/Te. Furthermore, an inspection of the partial density of states (Fig. S2, ESI†) shows that chemisorption of atomic oxygen does not induce gap states in the band gaps of the WS2, WSe2, and WTe2 monolayers.
In contrast to the atomic oxygen chalcogenide interaction, the O2 and O3 molecules prefer a weakly physisorbed configuration on top of the WS2, WSe2, and WTe2 monolayers with much lower Eadsorb in the range of 0.03–0.16 eV with the corresponding bond distance, Rx–o, of about ≈3 Å or greater in their equilibrium configurations (Table 2).
This contrasting nature of adsorption can be attributed to the strong O–O bond(s) with bond dissociation energies of 5.11 and 6.27 eV in O2 and O3 molecules, respectively,47 which prevents a strong interaction with surface chalcogen atoms of the WS2, WSe2, and WTe2 monolayers. To assess the feasibility of charge transfer from the surface to the molecules, we have compared the relative positions of the Fermi levels of the monolayers with the lowest unoccupied molecular levels (LUMO) of the O/O2/O3 molecules.36,48 From Fig. 3, we note that for the WSe2 and WTe2 monolayers, the Fermi levels lie above the O, O2, and O3 levels, whereas for WS2, the Fermi level straddles only the O and O3 levels. We can, thus, expect finite charge transfer in all the adsorption cases except for the O2 on the WS2 monolayer. We quantified this charge transfer using Bader charge analysis as presented in Table 2, which confirms that there is almost no charge transfer in the case of O2 physisorbed on the WS2 monolayer, as displayed in Fig. 3. It is worth noting that in the weakly physisorbed configurations, both O2 and O3 retain their structural identity in terms of the bond length and bond angles: R(O–O) is 1.24 Å for the O2 complexes, and (R(O–O), A(O–O–O)) are (1.29 Å, 117.5°), (1.30 Å, 117.0°), and (1.31 Å, 116.3°) for the O3-WS2, O3-WSe2, and O3-WTe2 complexes, respectively. The calculated R(O–O) values for isolated O2 and O3 molecules are 1.24 Å and 1.28 Å, respectively. Note that the adsorption energy of the O2 molecule for the pristine MoS2 was reported to be 58 meV.49
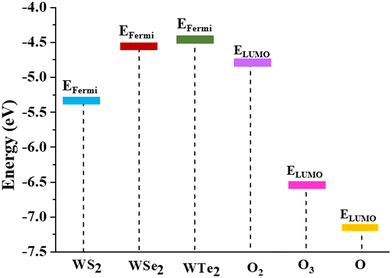 | ||
| Fig. 3 Schematic diagram displaying the monolayer's Fermi level (EFermi) and the lowest unoccupied molecular orbital (ELUMO) of atomic O and molecular O2 and O3. | ||
Next, we calculated the transition path taken by both O2 and O3 molecules approaching the surface using the CINEB method, as displayed in Fig. 4. Here, the initial (non-interacting) configuration consisted of a molecule placed at ∼4.5 Å above the monolayer, and the final configuration consisted of the dissociated atomic oxygen, forming bonds with the surface atoms (i.e., S or Se or Te) of the monolayers.
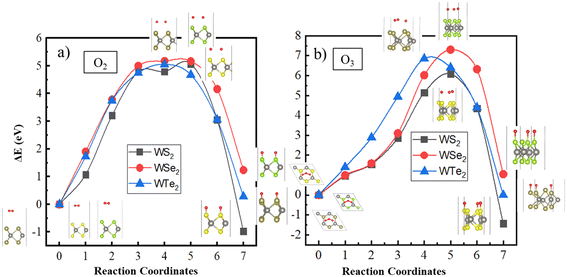 | ||
| Fig. 4 Molecular transition path on the WS2, WSe2, and WTe2 monolayers for (a) O2 and (b) O3 molecules calculated using the CINEB method. | ||
The calculated molecular transition path exhibits a relatively high energy barrier for either O2 or O3 dissociation on these monolayers. The energy barrier for O2 dissociation to atomic oxygens is calculated to be ≈5 eV, whereas that for O3 dissociation to atomic oxygens is predicted to be ≥6 eV (Table 2). Notably, among the investigated monolayers, only the WS2 monolayer preferred the oxidized configurations with an Edissociation ≈−0.96 eV for O2 and −1.43 eV for O3 relative to the non-interacting configurations. This can be attributed to the ease with which S–O bonds can form on the WS2 monolayer relative to the Se–O or Te–O surface bonds for the other monolayers. The oxidized WSe2 or WTe2 monolayers are not predicted to be energetically preferred (Table 2). It should be noted that experiments have been performed on the diatomic molecules SO, SeO, and TeO, reporting their vibrational properties.50
After recognizing that a partially oxidized WS2 monolayer (with 25% surface coverage) can be stable, we now examine the electronic properties and the stability of the fully oxidized WS2 monolayer (with 100% surface coverage).
In the equilibrium configuration of the oxidized WS2 monolayer, the calculated S–O bond length is 1.48 Å, similar to that predicted for a partially oxidized WS2 surface (Table 2). Another striking feature appears in the calculated total density of states at the Fermi level for the oxidized WS2 monolayer, as shown in Fig. 5. By comparing the pristine WS2 (Fig. 5a) with the partially oxidized one (Fig. 5b), we observed that the band gap reduces by 0.36 eV, and as we move away from the Fermi level in the valence states, new hybridized S–O states appear due to the formation of S–O bonds. A similar observation has been made for SnS/SnSe/GeS/GeSe monolayers where oxygen chemisorption leads to band gap reduction with the activation barrier O2 in the range from 1.26 to 1.60 eV.51 Notably, these studies did not address the oxidation of the monolayers by atomic O and O3 molecules.
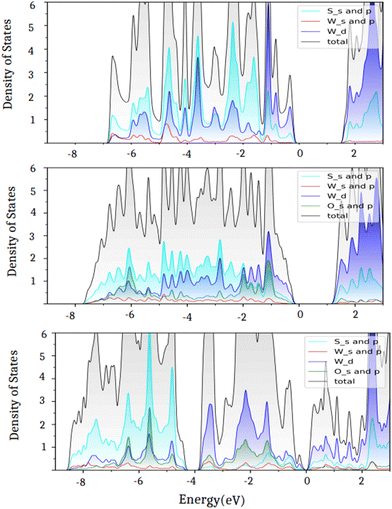 | ||
| Fig. 5 Projected densities of states for the (a) pristine, (b) partially oxidized, and (c) fully oxidized WS2 monolayers. | ||
Further comparison with the fully oxidized monolayer (Fig. 5a) shows that the band gap reduces from 1.86 eV (pristine) to 1.50 eV (Fig. 5b) for the partially oxidized and to 0.30 eV for the fully oxidized WS2 monolayer and the hybridized states appear near the Fermi level due to the increase in the S–O bonds. In the case of a partially oxidized WS2 monolayer (Fig. 5b), the upper valence band (width of 6 eV) consists of the dominating S–O bonds with small contributions from W–O bonds. In the fully oxidized monolayer, however, the upper valence band splits into two parts; the S–O band has moved down to about 4 eV relative to the Fermi level as can be seen in Fig. 5c. The reduction in the band gap in TMDs with oxidation has also been previously reported by DFT calculations.52
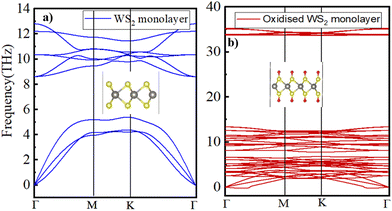
To assess the dynamic stability of the fully oxidized WS2, phonon dispersion calculations were performed using the PHONOPY package. Fig. 6b displays the calculated phonon dispersion relationship, in which a small pocket of negative frequencies (<0.25 THz) near Γ along the Γ–M direction in the Brillouin zone is noticed. We believe that this small pocket of negative frequencies is an artifact of the technical details such as the supercell size and functional used53 in the present study. Otherwise, the calculated phonon band structure for the pristine WS2 monolayer (displayed in Fig. 6a) is in good accordance with the earlier published reports.54 A comparison of the phonon band structures of the oxidized WS2 monolayer with the pristine one clearly shows a distinct phonon branch appearing at approximately 33 THz, which typically corresponds to the S–O bond stretching frequency.55
4. Summary
The oxidation susceptibility/resistance of WS2, WSe2, and WTe2 monolayers was investigated from their interaction with atomic oxygen and O2 and O3 molecules, respectively. Calculations using van der Waals-corrected density functional theory (DFT) predicted the strongly chemisorbed O in the case of interaction with atomic oxygen, but weakly physisorbed O2 and O3 on the monolayer surface. These results are in accordance with a significant charge transfer from the surface to atomic oxygen for all the cases. The weakly physisorbed O2 and O3 molecules retain their molecular configurations at about 3.0 Å or more above the surface. The CINEB calculations predicted a large energy barrier for either O2 or O3 to dissociate into atomic oxygens on the surface. Interestingly, the oxidized WS2 is energetically preferred over the pristine WS2, although the energy barrier is about 5.5 eV, which explains the experimental observation of the high resistance of WS2 to ambient oxidation for up to ten months but is susceptible to photo-induced oxidation.Conflicts of interest
There are no conflicts to declare.Acknowledgements
The authors would like to thank the computational facilities provided by Michigan Technological University. The funding from the Army Research Office through grant no. W911NF-14-2-0088 for partial support of this research at Michigan Tech University (R. P.) is gratefully acknowledged.References
- M. Chhowalla, H. S. Shin, G. Eda, L. J. Li, K. P. Loh and H. Zhang, Nat. Chem., 2013, 5, 263–275 CrossRef PubMed.
- Y. Guo, C. Liu, Q. Yin, C. Wei, S. Lin, T. B. Hoffman, Y. Zhao, J. H. Edgar, Q. Chen, S. P. Lau, J. Dai, H. Yao, H.-S. P. Wong and Y. Chai, ACS Nano, 2016, 10, 8980–8988 CrossRef CAS.
- G. R. Bhimanapati, Z. Lin, V. Meunier, Y. Jung, J. Cha, S. Das, D. Xiao, Y. Son, M. S. Strano and V. R. Cooper, ACS Nano, 2015, 9, 11509–11539 CrossRef CAS.
- Z. Wang and B. Mi, Environ. Sci. Technol., 2017, 51, 8229–8244 CrossRef CAS.
- E. Singh, K. S. Kim, G. Y. Yeom and H. S. Nalwa, ACS Appl. Mater. Interfaces, 2017, 9, 3223–3245 CrossRef CAS PubMed.
- Y. Wu, N. Joshi, S. Zhao, H. Long, L. Zhou, G. Ma, B. Peng, O. N. Oliveira Jr., A. Zettl and L. Lin, Appl. Surf. Sci., 2020, 529, 147110 CrossRef CAS.
- X. Chen, C. Liu and S. Mao, Nano-Micro Lett., 2020, 12, 1–24 CrossRef PubMed.
- S. Kuriakose, T. Ahmed, S. Balendhran, V. Bansal, S. Sriram, M. Bhaskaran and S. Walia, 2D Mater., 2018, 5, 032001 CrossRef.
- Q. H. Wang, K. Kalantar-Zadeh, A. Kis, J. N. Coleman and M. S. Strano, Nat. Nanotechnol., 2012, 7, 699–712 CrossRef CAS PubMed.
- B. Radisavljevic, A. Radenovic, J. Brivio, V. Giacometti and A. Kis, Nat. Nanotechnol., 2011, 6, 147–150 CrossRef CAS.
- X.-L. Fan, Y. Yang, P. Xiao and W.-M. Lau, J. Mater. Chem. A, 2014, 2, 20545–20551 RSC.
- J. O. Island, G. A. Steele, H. S. J. van der Zant and A. Castellanos-Gomez, 2D Mater., 2015, 2, 011002 CrossRef.
- G. Wang, W. J. Slough, R. Pandey and S. P. Karna, 2D Mater., 2016, 3, 025011 CrossRef.
- Q. Zhao, R. Frisenda, P. Gant, D. Perez de Lara, C. Munuera, M. Garcia-Hernandez, Y. Niu, T. Wang, W. Jie and A. Castellanos-Gomez, Adv. Funct. Mater., 2018, 28, 1805304 CrossRef.
- B. Chamlagain and S. I. Khondaker, ACS Omega, 2021, 6, 24075–24081 CrossRef CAS PubMed.
- M. H. Rahman, E. H. Chowdhury and S. Hong, Surf. Interfaces, 2021, 26, 101371 CrossRef CAS.
- H. Liu, N. Han and J. Zhao, RSC Adv., 2015, 5, 17572–17581 RSC.
- H. Qiu, L. Pan, Z. Yao, J. Li, Y. Shi and X. Wang, Appl. Phys. Lett., 2012, 100, 123104 CrossRef.
- J. C. Kotsakidis, Q. Zhang, A. L. Vazquez de Parga, M. Currie, K. Helmerson, D. K. Gaskill and M. S. Fuhrer, Nano Lett., 2019, 19, 5205–5215 CrossRef CAS PubMed.
- P. E. Blöchl, Phys. Rev. B: Condens. Matter Mater. Phys., 1994, 50, 17953 CrossRef PubMed.
- G. Kresse and J. Furthmüller, Phys. Rev. B: Condens. Matter Mater. Phys., 1996, 54, 11169 CrossRef CAS PubMed.
- G. Kresse and J. Hafner, Phys. Rev. B: Condens. Matter Mater. Phys., 1993, 47, 558 CrossRef CAS PubMed.
- G. Kresse and J. Hafner, Phys. Rev. B: Condens. Matter Mater. Phys., 1994, 49, 14251 CrossRef CAS PubMed.
- G. Kresse and J. Furthmüller, Comput. Mater. Sci., 1996, 6, 15–50 CrossRef CAS.
- J. P. Perdew, K. Burke and M. Ernzerhof, Phys. Rev. Lett., 1996, 77, 3865 CrossRef CAS PubMed.
- S. Grimme, S. Ehrlich and L. Goerigk, J. Comput. Chem., 2011, 32, 1456–1465 CrossRef CAS PubMed.
- A. Togo, F. Oba and I. Tanaka, Phys. Rev. B: Condens. Matter Mater. Phys., 2008, 78, 134106 CrossRef.
- A. Togo and I. Tanaka, Scr. Mater., 2015, 108, 1–5 CrossRef CAS.
- S. Baroni, S. De Gironcoli, A. Dal Corso and P. Giannozzi, Rev. Mod. Phys., 2001, 73, 515 CrossRef CAS.
- A. Zaman, R. Shahriar, S. T. Hossain, M. R. Akhond, H. T. Mumu and A. Sharif, RSC Adv., 2023, 13, 23558–23569 RSC.
- M. A. Islam, H. Li, S. Moon, S. S. Han, H.-S. Chung, J. Ma, C. Yoo, T. J. Ko, K. H. Oh, Y. Jung and Y. Jung, ACS Appl. Mater. Interfaces, 2020, 12, 53174–55318 CrossRef CAS PubMed.
- T. Liu, Y. Chen, M. Zhang, L. Yuan, C. Zhang, J. Wang and J. Fan, AIP Adv., 2017, 7, 125007 CrossRef.
- D. Bahamon, M. Khalil, A. Belabbes, Y. Alwahedi, L. F. Vega and K. Polychronopoulou, RSC Adv., 2021, 11, 2947–2957 RSC.
- H. Wei, Y. Gui, J. Kang, W. Wang and C. Tang, Nanomaterials, 2018, 8, 646 CrossRef PubMed.
- G. Henkelman, B. P. Uberuaga and H. Jónsson, J. Chem. Phys, 2000, 113, 9901–9904 CrossRef CAS.
- L. Patra, G. Mallick, R. Pandey and S. P. Karna, Appl. Surf. Sci., 2022, 588, 152940 CrossRef CAS.
- A. Rawat, N. Jena and A. De Sarkar, J. Mater. Chem. A, 2018, 6, 8693–8704 RSC.
- Y. Ma, Y. Dai, M. Guo, C. Niu, J. Lu and B. Huang, Phys. Chem. Chem. Phys., 2011, 13, 15546–15553 RSC.
- D. Le, A. Barinov, E. Preciado, M. Isarraraz, I. Tanabe, T. Komesu, C. Troha, L. Bartels, T. S. Rahman and P. A. Dowben, J. Phys.: Condens. Matter, 2015, 27, 182201 CrossRef PubMed.
- P. Manchanda and R. Skomski, J. Phys.: Condens. Matter, 2016, 28, 064002 CrossRef PubMed.
- A. Panchenko, M. T. M. Koper, T. E. Shubina, S. J. Mitchell and E. Roduner, J. Electrochem. Soc., 2004, 151, A2016–A2027 CrossRef CAS.
- H. Nakatsuji and H. Nakai, Chem. Phys. Lett., 1992, 197, 339 CrossRef CAS.
- R. Trambarulo, S. N. Ghosh, C. A. Burrus Jr. and W. Gordy, J. Chem. Phys., 1953, 21, 851–855 CrossRef CAS.
- D. Farmanzadeh and N. A. Ardehjani, Appl. Surf. Sci., 2018, 444, 642–649 CrossRef CAS.
- N. N. Greenwood and A. Earnshaw, Chemistry of the Elements, Elsevier, 2012 Search PubMed.
- J. Li, N. V. Medhekar and V. B. Shenoy, J. Phys. Chem. C, 2013, 117, 15842–15848 CrossRef CAS.
- B. W. Pfennig, Principles of Inorganic Chemistry, John Wiley & Sons, 2021 Search PubMed.
- R. L. Anderson, IBM J. Res. Dev., 1960, 4, 283–287 CAS.
- H. Liu, N. Han and J. Zhao, RSC Adv., 2015, 5, 17572–11758 RSC.
- P. Haranath, P. T. Rao and V. Sivaramamurty, Zeitschrift für Physik A, 1959, 155, 507–517 CrossRef CAS.
- Y. Guo, S. Zhou, Y. Bai and J. Zhao, ACS Appl. Mater. Interfaces, 2017, 9, 12013–12020 CrossRef CAS PubMed.
- K. Iordanidou, M. Houssa, G. Pourtois, V. V. Afanas'ev and A. Stesmans, Phys. Status Solidi RRL, 2016, 11, 787–791 CrossRef.
- V. Zólyomi, N. D. Drummond and V. I. Fal'ko, Phys. Rev. B: Condens. Matter Mater. Phys., 2014, 89, 205416 CrossRef.
- A. Berkdemir, H. R. Gutiérrez, A. R. Botello-Méndez, N. Perea-López, A. L. Elías, C.-I. Chia, B. Wang, V. H. Crespi, F. López-Urías, J.-C. Charlier, H. Terrones and M. Terrones, Sci. Rep., 2013, 3, 1755 CrossRef.
- K. I. Oh and C. R. Baiz, J. Chem. Phys., 2019, 151(23), 234107 CrossRef PubMed.
Footnote |
| † Electronic supplementary information (ESI) available. See DOI: https://doi.org/10.1039/d3nr06089f |
| This journal is © The Royal Society of Chemistry 2024 |

