 Open Access Article
Exploring the structure of type V deep eutectic solvents by xenon NMR spectroscopy
Matteo
Boventi
a,
Michele
Mauri
 a,
Franca
Castiglione
 *b and
Roberto
Simonutti
 *a
*a
aDepartment of Materials Science, University of Milano-Bicocca, Via R. Cozzi 55, 20125 Milano, Italy. E-mail: roberto.simonutti@unimib.it
bDepartment of Chemistry, Materials and Chemical Engineering “G. Natta”, Politecnico di Milano, Piazza L. Da Vinci 32, 20133 Milano, Italy. E-mail: franca.castiglione@polimi.it
First published on 30th May 2024
Abstract
Hydrophobic non-ionic (type V) deep eutectic solvents (DESs) have recently emerged as a new class of sustainable materials that have shown unique properties in several applications. In this study, type V DESs thymol![[thin space (1/6-em)]](https://www.rsc.org/images/entities/char_2009.gif) :
:![[thin space (1/6-em)]](https://www.rsc.org/images/entities/char_2009.gif) camphor, menthol
camphor, menthol![[thin space (1/6-em)]](https://www.rsc.org/images/entities/char_2009.gif) :
:![[thin space (1/6-em)]](https://www.rsc.org/images/entities/char_2009.gif) thymol and eutectic mixtures (EMs) based on menthol
thymol and eutectic mixtures (EMs) based on menthol![[thin space (1/6-em)]](https://www.rsc.org/images/entities/char_2009.gif) :
:![[thin space (1/6-em)]](https://www.rsc.org/images/entities/char_2009.gif) carboxylic acids with variable chain length, are experimentally investigated using xenon NMR spectroscopy, with the aim to clarify the peculiar nanostructure of these materials. The results, obtained from the analysis of the 129Xe chemical shifts and of the longitudinal relaxation times, reveal a correlation between the deviation from ideality of the DESs and their structure free volume. Furthermore, the effect of varying the composition of DESs and EMs on the liquid structure is also studied.
carboxylic acids with variable chain length, are experimentally investigated using xenon NMR spectroscopy, with the aim to clarify the peculiar nanostructure of these materials. The results, obtained from the analysis of the 129Xe chemical shifts and of the longitudinal relaxation times, reveal a correlation between the deviation from ideality of the DESs and their structure free volume. Furthermore, the effect of varying the composition of DESs and EMs on the liquid structure is also studied.
Introduction
Since the pioneering work of Abbott et al. in 2003,1 deep eutectic solvents (DESs) have emerged as potential candidates for the substitution of conventional organic solvents both in research and in industry. The great interest in DESs is due to their outstanding solvent and physical properties coupled with the possibility to obtain them using green and sustainable starting materials. These solvents are generally easy to prepare and, depending on the starting materials, they can also be non-toxic, environmentally friendly, and inexpensive.2,3 DESs can be obtained using a general combination of a hydrogen bond donor and a hydrogen bond acceptor, allowing to obtain task-specific solvents with optimized physicochemical properties for any given application. Even though many different eutectic mixtures have been reported as DESs, there is an important distinction between a eutectic mixture and a deep eutectic solvent. This issue has been addressed by Martins et al. who proposed a new definition of DES as a mixture whose eutectic point is below that of a thermodynamically ideal mixture.4 The thermodynamic nonideality of deep eutectic solvents is generally attributed to the favorable intermolecular interactions between the two different components compared to the interactions between two or more molecules of the same component.5,6 Thus, to establish whether a mixture is a deep eutectic solvent or not, its solid–liquid phase diagram must be determined and compared to the ideal case. Importantly, the definition of Martins et al. is not restricted to a single composition, such as the eutectic point, but it covers the entire compositional range in which the mixture is liquid at the operating temperature for a given system or process.Deep eutectic solvents have been traditionally classified into five types based on the chemistry of their constituents.2 While type I–IV are composed of at least an ionic species, type V DESs are a rather new class of entirely nonionic DESs composed only of molecular hydrogen bond donors and acceptors.7 They have shown great potential in different applications including extraction of metals and organic molecules, separation, detection of water pollutants, gas capture and separation,8 drug solubilization and delivery.9–16 Among all applications, CO2 capture is one of the most relevant, and recently the hydrophobic nonionic DES containing L-menthol/phenolic alcohols17 and terpenoid-based DES18 were designed for improving CO2 solubility. A detailed understanding of the structural organization of DESs on the nanoscale and the relationships between their structure and their physicochemical properties would be extremely useful to increase the effectiveness of DES in many different applications as well as helping in the design of task-specific solvents a priori. In this view, the NMR spectroscopy of noble gases,19,20 especially xenon, with its ability to probe matter on the nanoscale in a non-destructive way, can give highly detailed information about the complex nanostructure of these neoteric materials. 129Xe NMR has been traditionally applied to characterize the structure of widely different porous systems such as zeolites,21,22 mesoporous silica and silica-based materials,23–25 porous carbon-based materials,26–29 polymers,30–32 and metal–organic frameworks.33,34 However, 129Xe has also been used as an inert NMR probe to characterize the structure of isotropic and anisotropic liquids. In 2013, Morgado et al. thoroughly studied the structural organization of a wide variety of linear, branched, and cyclic alkanes with 129Xe NMR.35 Later, they also determined the presence of segregated nanodomains in perfluoroalkyl alkanes,36 and in mixtures of hexane and perfluorohexane at different compositions.37 In other examples, different 129Xe NMR parameters, such as chemical shift, spin-lattice relaxation time, and self-diffusion coefficient, have been employed to describe the nanostructure of ionic liquids and their nano separation,38–40 and the porous topology of porous liquids.41
In this work, 129Xe NMR spectroscopy is applied to investigate the liquid structure of eutectic solvents/mixtures for the first time. In particular, the type V menthol![[thin space (1/6-em)]](https://www.rsc.org/images/entities/char_2009.gif) :
:![[thin space (1/6-em)]](https://www.rsc.org/images/entities/char_2009.gif) thymol, thymol
thymol, thymol![[thin space (1/6-em)]](https://www.rsc.org/images/entities/char_2009.gif) :
:![[thin space (1/6-em)]](https://www.rsc.org/images/entities/char_2009.gif) camphor deep eutectic solvents42 and a series of known eutectic mixtures of menthol, as hydrogen bond acceptor (HBA), and variable chain length carboxylic acids as hydrogen bond donor (HBD)43 are studied. Variable-temperature chemical shifts, spin-lattice relaxation times, and diffusion coefficients gave valuable information about the nanoscopic organization of the eutectic mixtures that is influenced by the molar ratio of menthol/carboxylic acid.
camphor deep eutectic solvents42 and a series of known eutectic mixtures of menthol, as hydrogen bond acceptor (HBA), and variable chain length carboxylic acids as hydrogen bond donor (HBD)43 are studied. Variable-temperature chemical shifts, spin-lattice relaxation times, and diffusion coefficients gave valuable information about the nanoscopic organization of the eutectic mixtures that is influenced by the molar ratio of menthol/carboxylic acid.
Experimental section
Materials
Isotopically enriched xenon gas (isotopic enrichment of 86.6% in the 129Xe isotope) was acquired from CortecNet. L-Menthol (99% purity) was purchased from Thermo Scientific, octanoic acid (≥98%), dodecanoic acid (98%), thymol (≥98.5%) and camphor (96%) were purchased from Merck, decanoic acid (99%) was purchased from Acros Organics, tetradecanoic acid (99%) was purchased from Fluka Analytics. All reagents were used as received without further purification.Binary mixtures preparation
Binary eutectic mixtures (EMs) and DESs were prepared following the procedure reported in the literature.43 Besides, low melting mixtures (LMM) of menthol (Menth) and octanoic (OctA), decanoic (DecA), dodecanoic (DodecA) and myristic (MyrA) acids, along with mixtures of thymol (Thym) and camphor (Camph) with variable compositions were also prepared. The components were accurately weighed on an analytical balance and inserted into 40 mL glass vials at the desired molar compositions. The mixtures were heated at 60 °C under stirring using a magnetic stirrer for several hours until homogeneous clear liquids were formed. Then, mixtures were cooled down to room temperature and stored under nitrogen to avoid humidity. The molar composition of the EMs and DESs prepared in this study are shown in Table 1.| Eutectic mixtures | Mole ratio | Abbreviations |
|---|---|---|
Thymol![[thin space (1/6-em)]](https://www.rsc.org/images/entities/char_2009.gif) : :![[thin space (1/6-em)]](https://www.rsc.org/images/entities/char_2009.gif) camphor camphor |
0.5![[thin space (1/6-em)]](https://www.rsc.org/images/entities/char_2009.gif) : :![[thin space (1/6-em)]](https://www.rsc.org/images/entities/char_2009.gif) 0.5 0.5 |
Thym![[thin space (1/6-em)]](https://www.rsc.org/images/entities/char_2009.gif) : :![[thin space (1/6-em)]](https://www.rsc.org/images/entities/char_2009.gif) Camph Camph |
Menthol![[thin space (1/6-em)]](https://www.rsc.org/images/entities/char_2009.gif) : :![[thin space (1/6-em)]](https://www.rsc.org/images/entities/char_2009.gif) thymol thymol |
0.5![[thin space (1/6-em)]](https://www.rsc.org/images/entities/char_2009.gif) : :![[thin space (1/6-em)]](https://www.rsc.org/images/entities/char_2009.gif) 0.5 0.5 |
Menth![[thin space (1/6-em)]](https://www.rsc.org/images/entities/char_2009.gif) : :![[thin space (1/6-em)]](https://www.rsc.org/images/entities/char_2009.gif) Thym Thym |
Menthol![[thin space (1/6-em)]](https://www.rsc.org/images/entities/char_2009.gif) : :![[thin space (1/6-em)]](https://www.rsc.org/images/entities/char_2009.gif) octanoic acid octanoic acid |
0.56![[thin space (1/6-em)]](https://www.rsc.org/images/entities/char_2009.gif) : :![[thin space (1/6-em)]](https://www.rsc.org/images/entities/char_2009.gif) 0.44 0.44 |
Menth![[thin space (1/6-em)]](https://www.rsc.org/images/entities/char_2009.gif) : :![[thin space (1/6-em)]](https://www.rsc.org/images/entities/char_2009.gif) OctA OctA |
Menthol![[thin space (1/6-em)]](https://www.rsc.org/images/entities/char_2009.gif) : :![[thin space (1/6-em)]](https://www.rsc.org/images/entities/char_2009.gif) decanoic acid decanoic acid |
0.6![[thin space (1/6-em)]](https://www.rsc.org/images/entities/char_2009.gif) : :![[thin space (1/6-em)]](https://www.rsc.org/images/entities/char_2009.gif) 0.4 0.4 |
Menth![[thin space (1/6-em)]](https://www.rsc.org/images/entities/char_2009.gif) : :![[thin space (1/6-em)]](https://www.rsc.org/images/entities/char_2009.gif) DecA DecA |
Menthol![[thin space (1/6-em)]](https://www.rsc.org/images/entities/char_2009.gif) : :![[thin space (1/6-em)]](https://www.rsc.org/images/entities/char_2009.gif) dodecanoic acid dodecanoic acid |
0.75![[thin space (1/6-em)]](https://www.rsc.org/images/entities/char_2009.gif) : :![[thin space (1/6-em)]](https://www.rsc.org/images/entities/char_2009.gif) 0.25 0.25 |
Menth![[thin space (1/6-em)]](https://www.rsc.org/images/entities/char_2009.gif) : :![[thin space (1/6-em)]](https://www.rsc.org/images/entities/char_2009.gif) DodecA DodecA |
Menthol![[thin space (1/6-em)]](https://www.rsc.org/images/entities/char_2009.gif) : :![[thin space (1/6-em)]](https://www.rsc.org/images/entities/char_2009.gif) myristic acid myristic acid |
0.8![[thin space (1/6-em)]](https://www.rsc.org/images/entities/char_2009.gif) : :![[thin space (1/6-em)]](https://www.rsc.org/images/entities/char_2009.gif) 0.2 0.2 |
Menth![[thin space (1/6-em)]](https://www.rsc.org/images/entities/char_2009.gif) : :![[thin space (1/6-em)]](https://www.rsc.org/images/entities/char_2009.gif) MyrA MyrA |
NMR sample preparation
Samples for 129Xe NMR were prepared as follows. Wilmad 504-PP-8 NMR tubes with 5 mm outer diameter and 3.43 mm inner diameter were filled with a small amount of sample (0.2–0.5 mL). The tubes were connected to a Schlenk line and degassed under dynamic vacuum at a pressure of 6.0 × 10⁻² torr by performing freeze–pump–thaw cycles until no gas bubbles were observed inside the samples. Isotopically enriched xenon gas was inserted into a section of the manifold with known volume and quantitated by measuring its pressure. Xenon gas was then put in contact with the sample and trapped inside the tube by freezing it with liquid nitrogen. Finally, the tube was flame-sealed, paying close attention that the sealing region was free of any liquid droplets that could decompose and contaminate the tube. Tubes were allowed to heat up slowly to room temperature and were equilibrated for a few days before the measurements. Samples for diffusion NMR experiments were prepared with the same procedure but a thin sealed capillary tube containing a small volume of DMSO-d6 (80–100 μL) was added into the NMR tube for deuterium lock. For all the samples, the final nominal xenon pressure was in the range 2–4 bar.129Xe NMR spectroscopy
One-dimensional spectra and spin-lattice relaxation time measurements were performed on a Bruker Avance 500 spectrometer operating at a Larmor frequency of 500.13 MHz for 1H and 139.09 MHz for 129Xe. The spectrometer was equipped with a double-resonance broadband observe (BBO) probe. One-dimensional 129Xe spectra were acquired with 8–256 scans and a relaxation delay in the range 60–200 s. Chemical shifts were referenced by setting the chemical shift of xenon dissolved in benzene at 298 K to 188.1 ppm.44 Spectra were acquired every 10 K in different temperature ranges depending on the melting point of the samples. 129Xe spin-lattice relaxation times were measured using the Inversion Recovery pulse sequence with the default Bruker pulse program. For each measurement, 12 delay increments were recorded with 8–16 scans for each increment and a long relaxation delay in the range 200–400 s to ensure the complete relaxation of 129Xe nuclei. The probe temperature was controlled with a BVT3000 variable temperature unit with an uncertainty of 0.1 K. For low-temperature experiments a liquid nitrogen evaporator, controlled with the same variable temperature unit, was connected to the NMR probe.Diffusion NMR experiments were performed on a Bruker 500 NEO spectrometer equipped with a direct observe BBFO (broadband including fluorine) iProbe. All the experiments were performed using the bipolar pulse longitudinal eddy current delay (BPPLED) sequence.45 A pulsed gradient unit was used to produce magnetic-field pulse gradients up to 53 G cm−1. The duration of the magnetic-field pulse gradients (δ) and the diffusion times (Δ) were optimized for each sample to obtain complete dephasing of the signals with the maximum gradient strength. 129Xe diffusion experiments were performed with acquisition parameters δ = 3 ms and Δ = 120–360 ms, relaxation delay of 200–150 s, 16 scans and 24 gradient linear steps. The parameters for 1H diffusion experiments were δ = 3 ms and Δ = 300 ms, a relaxation delay of 10 s, 8 scans and 24 gradient linear steps. The temperature was set at 298 K and controlled with air flow.
Results and discussion
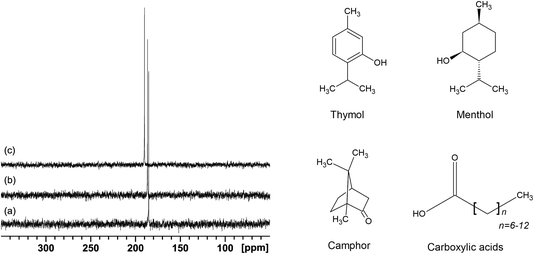
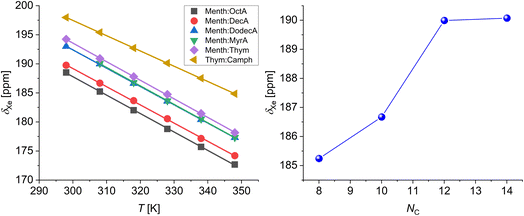
The 129Xe NMR spectra for all the samples show a single, sharp, and intense line, typical of xenon dissolved in liquids. As an example, the spectra of xenon dissolved in mixtures of menthol and octanoic, decanoic, and dodecanoic acid at their eutectic compositions are shown in Fig. 1.At 298 K, the chemical shifts of xenon dissolved in the mixtures at their eutectic composition span a relatively small range, between 188.5 and 198.0 ppm, with the highest values being the chemical shift of xenon dissolved in the deep eutectic solvents menthol![[thin space (1/6-em)]](https://www.rsc.org/images/entities/char_2009.gif) :
:![[thin space (1/6-em)]](https://www.rsc.org/images/entities/char_2009.gif) thymol (194.2 ppm) and thymol
thymol (194.2 ppm) and thymol![[thin space (1/6-em)]](https://www.rsc.org/images/entities/char_2009.gif) :
:![[thin space (1/6-em)]](https://www.rsc.org/images/entities/char_2009.gif) camphor (198.0 ppm) (Fig. 2). The room temperature chemical shift of xenon dissolved in the eutectic mixture menthol
camphor (198.0 ppm) (Fig. 2). The room temperature chemical shift of xenon dissolved in the eutectic mixture menthol![[thin space (1/6-em)]](https://www.rsc.org/images/entities/char_2009.gif) :
:![[thin space (1/6-em)]](https://www.rsc.org/images/entities/char_2009.gif) myristic acid 0.8
myristic acid 0.8![[thin space (1/6-em)]](https://www.rsc.org/images/entities/char_2009.gif) :
:![[thin space (1/6-em)]](https://www.rsc.org/images/entities/char_2009.gif) 0.2 could not be determined since the sample was too close to its melting point and it became too viscous to obtain a good 129Xe NMR spectrum.43 It is well known that the chemical shift of xenon dissolved in liquid is mainly determined by non-covalent interactions. More specifically, the chemical shift of xenon dissolved in molecular liquids, as demonstrated by Jameson et al. using molecular dynamics simulations, is primarily determined by the free volume available to xenon and the range of free volumes sampled over time.46 Our results highlight that DESs have a smaller free volume compared to general EMs due to less favorable packing of the components. Considering EMs, the chemical shift increases with the number of carbon atoms (NC) of the carboxylic acid alkyl chain, until it reaches a plateau for NC = 12–14 (see Fig. 2). The increase in 129Xe chemical shift with increasing number of carbon atoms has already been observed in the case of linear alkanes and cycloalkanes, and is due to the deshielding effect of both –CH3- and –CH2-groups on xenon.35,47 Excluding the contribution of the carboxyl group to the xenon deshielding, which to a good approximation we can consider identical in the different carboxylic acids, the chemical shift increase is in agreement with the increased deshielding due to a higher number of methylene groups interacting with xenon.
0.2 could not be determined since the sample was too close to its melting point and it became too viscous to obtain a good 129Xe NMR spectrum.43 It is well known that the chemical shift of xenon dissolved in liquid is mainly determined by non-covalent interactions. More specifically, the chemical shift of xenon dissolved in molecular liquids, as demonstrated by Jameson et al. using molecular dynamics simulations, is primarily determined by the free volume available to xenon and the range of free volumes sampled over time.46 Our results highlight that DESs have a smaller free volume compared to general EMs due to less favorable packing of the components. Considering EMs, the chemical shift increases with the number of carbon atoms (NC) of the carboxylic acid alkyl chain, until it reaches a plateau for NC = 12–14 (see Fig. 2). The increase in 129Xe chemical shift with increasing number of carbon atoms has already been observed in the case of linear alkanes and cycloalkanes, and is due to the deshielding effect of both –CH3- and –CH2-groups on xenon.35,47 Excluding the contribution of the carboxyl group to the xenon deshielding, which to a good approximation we can consider identical in the different carboxylic acids, the chemical shift increase is in agreement with the increased deshielding due to a higher number of methylene groups interacting with xenon.
In order to obtain insight on the nanostructure of the investigated DESs, xenon T1 relaxation times and diffusion coefficients D were measured at 298 K, and the experimental data are shown in Fig. 3. The T1 values, for all samples, were obtained using a mono-exponential fit, thus indicating the single homogeneous environment experienced by xenon atoms. For all the studied systems, the measured spin-lattice relaxation times are an order of magnitude lower than those of xenon dissolved in linear alkanes.39 Furthermore, the lowest T1 values are observed for the two DESs, which also show the highest chemical shift values compared to the EMs. It is known that the predominant relaxation mechanism for 129Xe dissolved in liquids is the dipolar interaction between 129Xe and 1H, which, in turn, is sensitive to the correlation time of the molecular reorientation.48,49 The strength of the dipolar interaction between two nuclei increases with decreasing distance. Thus, the measured relaxation times further confirm that, on average, the free volume experienced by xenon is lower in DESs compared to general eutectic mixtures.
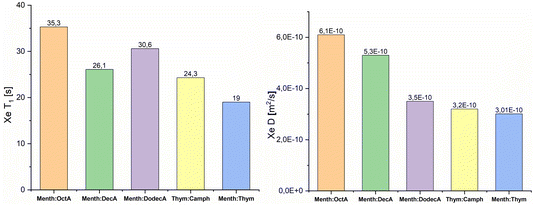 | ||
| Fig. 3 129Xe T1 relaxation times and diffusion coefficients D, of xenon dissolved in ESs and DESs. All data are acquired at 298 K. | ||
Diffusion NMR experiments allowed us to determine the self-diffusion coefficients of xenon, D(129Xe). The results are shown in Fig. 3. In all the measured samples, the self-diffusion of xenon is slower compared to that of xenon in water (2.2 × 10⁻⁹ m2 s−1).50 Moreover, the determined D(129Xe) values decrease as NC increases. Martins et al. reported that the dynamic viscosities of the menthol![[thin space (1/6-em)]](https://www.rsc.org/images/entities/char_2009.gif) :
:![[thin space (1/6-em)]](https://www.rsc.org/images/entities/char_2009.gif) carboxylic acids eutectic mixtures increase as NC increases.43 The measured NMR self-diffusion coefficients are in agreement with these results since they decrease with increasing viscosity of the eutectic mixture. This trend is also confirmed by the 1H self-diffusion coefficients but with values that are an order of magnitude lower. The strict correlation between self-diffusion and dynamic viscosity demonstrates that there are no segregated nanodomains and cage-like aggregates. Similar results were found for xenon dissolved in 1-alkyl-3-methylimidazolium-based ionic liquids.40
carboxylic acids eutectic mixtures increase as NC increases.43 The measured NMR self-diffusion coefficients are in agreement with these results since they decrease with increasing viscosity of the eutectic mixture. This trend is also confirmed by the 1H self-diffusion coefficients but with values that are an order of magnitude lower. The strict correlation between self-diffusion and dynamic viscosity demonstrates that there are no segregated nanodomains and cage-like aggregates. Similar results were found for xenon dissolved in 1-alkyl-3-methylimidazolium-based ionic liquids.40
An important factor influencing the physicochemical properties, particularly the CO2 solubility in eutectic mixtures, is the molar ratio between the donors HBA and HBD.51 To investigate the effect of the HBA/HBD molar ratio on the mixture nanostructure, xenon NMR parameters (chemical shift and T1 relaxation times) were measured for several LMMs (Menth![[thin space (1/6-em)]](https://www.rsc.org/images/entities/char_2009.gif) :
:![[thin space (1/6-em)]](https://www.rsc.org/images/entities/char_2009.gif) OctA, Menth
OctA, Menth![[thin space (1/6-em)]](https://www.rsc.org/images/entities/char_2009.gif) :
:![[thin space (1/6-em)]](https://www.rsc.org/images/entities/char_2009.gif) DecA and Menth
DecA and Menth![[thin space (1/6-em)]](https://www.rsc.org/images/entities/char_2009.gif) :
:![[thin space (1/6-em)]](https://www.rsc.org/images/entities/char_2009.gif) DodecA, Thym
DodecA, Thym![[thin space (1/6-em)]](https://www.rsc.org/images/entities/char_2009.gif) :
:![[thin space (1/6-em)]](https://www.rsc.org/images/entities/char_2009.gif) Camph) at different compositions.
Camph) at different compositions.
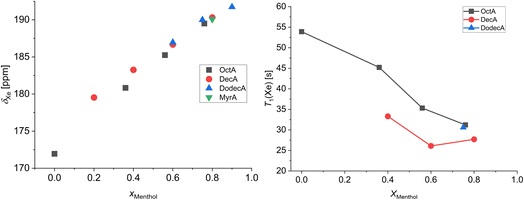
Fig. 4 shows the chemical shift (308 K) and T1 relaxation times (298 K) of xenon in the menthol![[thin space (1/6-em)]](https://www.rsc.org/images/entities/char_2009.gif) :
:![[thin space (1/6-em)]](https://www.rsc.org/images/entities/char_2009.gif) carboxylic acid mixtures as a function of the menthol molar fraction. The room temperature data of the low-melting mixtures menthol
carboxylic acid mixtures as a function of the menthol molar fraction. The room temperature data of the low-melting mixtures menthol![[thin space (1/6-em)]](https://www.rsc.org/images/entities/char_2009.gif) :
:![[thin space (1/6-em)]](https://www.rsc.org/images/entities/char_2009.gif) decanoic acid 0.2
decanoic acid 0.2![[thin space (1/6-em)]](https://www.rsc.org/images/entities/char_2009.gif) :
:![[thin space (1/6-em)]](https://www.rsc.org/images/entities/char_2009.gif) 0.8 and menthol
0.8 and menthol![[thin space (1/6-em)]](https://www.rsc.org/images/entities/char_2009.gif) :
:![[thin space (1/6-em)]](https://www.rsc.org/images/entities/char_2009.gif) dodecanoic acid 0.6
dodecanoic acid 0.6![[thin space (1/6-em)]](https://www.rsc.org/images/entities/char_2009.gif) :
:![[thin space (1/6-em)]](https://www.rsc.org/images/entities/char_2009.gif) 0.4 and 0.9
0.4 and 0.9![[thin space (1/6-em)]](https://www.rsc.org/images/entities/char_2009.gif) :
:![[thin space (1/6-em)]](https://www.rsc.org/images/entities/char_2009.gif) 0.1 could not be obtained since these mixtures melt between 298 K and 308 K.43 The 129Xe chemical shift of xenon dissolved in pure octanoic acid is also shown since, among the employed carboxylic acids, it is the only one sufficiently above its melting point at 308 K. From Fig. 4, it is evident that the chemical shift of dissolved xenon is responsive to the sample composition and, more specifically, that it increases almost linearly with the molar fraction of menthol. Another interesting feature is that, at high menthol molar fractions, the chemical shifts of dissolved xenon are very similar to each other, independent of the carboxylic acid. This indicates that (i) for high menthol molar fractions, the xenon chemical shift is mostly determined by the interactions with the polar moieties of menthol and (ii) for low menthol molar fractions, where the nonpolar groups become prevalent, xenon moves away from menthol, and it is preferentially solvated by the nonpolar alkyl chains due to its intrinsic hydrophobic nature. 129Xe spin-lattice relaxation times follow an opposite trend: they decrease as the menthol molar fraction increases. This highlights the presence of strong xenon–menthol dipolar interactions, even stronger than those between xenon and carboxylic acids.
0.1 could not be obtained since these mixtures melt between 298 K and 308 K.43 The 129Xe chemical shift of xenon dissolved in pure octanoic acid is also shown since, among the employed carboxylic acids, it is the only one sufficiently above its melting point at 308 K. From Fig. 4, it is evident that the chemical shift of dissolved xenon is responsive to the sample composition and, more specifically, that it increases almost linearly with the molar fraction of menthol. Another interesting feature is that, at high menthol molar fractions, the chemical shifts of dissolved xenon are very similar to each other, independent of the carboxylic acid. This indicates that (i) for high menthol molar fractions, the xenon chemical shift is mostly determined by the interactions with the polar moieties of menthol and (ii) for low menthol molar fractions, where the nonpolar groups become prevalent, xenon moves away from menthol, and it is preferentially solvated by the nonpolar alkyl chains due to its intrinsic hydrophobic nature. 129Xe spin-lattice relaxation times follow an opposite trend: they decrease as the menthol molar fraction increases. This highlights the presence of strong xenon–menthol dipolar interactions, even stronger than those between xenon and carboxylic acids.
The room temperature chemical shifts and spin-lattice relaxation times of xenon dissolved in thymol![[thin space (1/6-em)]](https://www.rsc.org/images/entities/char_2009.gif) :
:![[thin space (1/6-em)]](https://www.rsc.org/images/entities/char_2009.gif) camphor mixtures are shown in Fig. 5. Notably, the chemical shift increases with decreasing thymol molar fraction or, equivalently, increasing camphor molar fraction. As a rigid and constrained molecule, camphor imposes distinct spatial constraints on its surrounding environment. Thus, the average free volume experienced by xenon atoms decreases with increasing molar fraction of camphor, and this is reflected in its chemical shift. Interestingly, the spin-lattice relaxation time of xenon in thymol
camphor mixtures are shown in Fig. 5. Notably, the chemical shift increases with decreasing thymol molar fraction or, equivalently, increasing camphor molar fraction. As a rigid and constrained molecule, camphor imposes distinct spatial constraints on its surrounding environment. Thus, the average free volume experienced by xenon atoms decreases with increasing molar fraction of camphor, and this is reflected in its chemical shift. Interestingly, the spin-lattice relaxation time of xenon in thymol![[thin space (1/6-em)]](https://www.rsc.org/images/entities/char_2009.gif) :
:![[thin space (1/6-em)]](https://www.rsc.org/images/entities/char_2009.gif) camphor mixtures shows a minimum for the eutectic composition. This indicates that the 129Xe–1H dipole–dipole interaction is stronger at the eutectic than at other compositions, possibly because xenon experiences a significantly different environment in the DES. More studies on the spin-lattice relaxation of xenon dissolved in deep eutectic solvents have to be conducted to give a precise explanation for this phenomenon.
camphor mixtures shows a minimum for the eutectic composition. This indicates that the 129Xe–1H dipole–dipole interaction is stronger at the eutectic than at other compositions, possibly because xenon experiences a significantly different environment in the DES. More studies on the spin-lattice relaxation of xenon dissolved in deep eutectic solvents have to be conducted to give a precise explanation for this phenomenon.
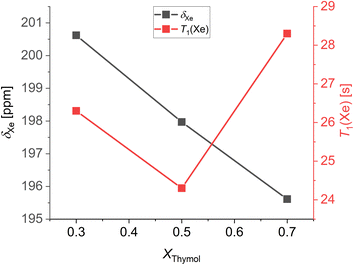 | ||
Fig. 5 Chemical shift and T1 relaxation times measured at 298 K of xenon dissolved in thymol![[thin space (1/6-em)]](https://www.rsc.org/images/entities/char_2009.gif) : :![[thin space (1/6-em)]](https://www.rsc.org/images/entities/char_2009.gif) camphor mixtures as a function of the composition. camphor mixtures as a function of the composition. | ||
To study the behavior of the different LMMs, ESs, and the thymol![[thin space (1/6-em)]](https://www.rsc.org/images/entities/char_2009.gif) :
:![[thin space (1/6-em)]](https://www.rsc.org/images/entities/char_2009.gif) camphor DES at different temperatures, we measured the 129Xe chemical shift in the range 298–348 K. The results are shown in Fig. 6. For all the mixtures, both at the eutectic and non-eutectic compositions, the chemical shift of dissolved xenon decreases with increasing temperature. The linear fits of the variable temperature data returned a slope very close to −0.3 ppm K−1 for all samples. This value is very similar to those reported for xenon dissolved in alkanes and cycloalkanes.35 As demonstrated by Jameson et al., the temperature dependence of the chemical shift is mainly determined by the variation of the free volume sampled by xenon.46 Thus, the similar temperature dependences in the studied systems rule out the existence of cage-like structures or host–guest complexes between xenon and the components of the eutectic mixtures, as instead observed in the case of porous liquids.41
camphor DES at different temperatures, we measured the 129Xe chemical shift in the range 298–348 K. The results are shown in Fig. 6. For all the mixtures, both at the eutectic and non-eutectic compositions, the chemical shift of dissolved xenon decreases with increasing temperature. The linear fits of the variable temperature data returned a slope very close to −0.3 ppm K−1 for all samples. This value is very similar to those reported for xenon dissolved in alkanes and cycloalkanes.35 As demonstrated by Jameson et al., the temperature dependence of the chemical shift is mainly determined by the variation of the free volume sampled by xenon.46 Thus, the similar temperature dependences in the studied systems rule out the existence of cage-like structures or host–guest complexes between xenon and the components of the eutectic mixtures, as instead observed in the case of porous liquids.41
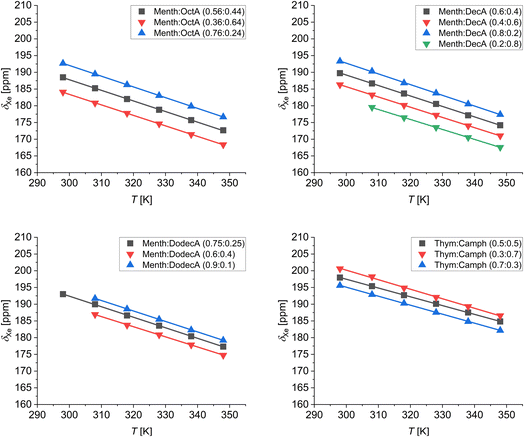 | ||
| Fig. 6 129Xe chemical shift as a function of temperature of xenon dissolved in the low-melting mixtures at different compositions. | ||
Conclusions
Xenon NMR spectroscopy has proven to be a valid tool for studying the structure of different ionic liquids, highlighting the presence of nanodomains, and their peculiar dynamic properties. In this work we move beyond ionic species, and we focus on the investigation of the liquid structure of two type V DES, menthol![[thin space (1/6-em)]](https://www.rsc.org/images/entities/char_2009.gif) :
:![[thin space (1/6-em)]](https://www.rsc.org/images/entities/char_2009.gif) thymol, thymol
thymol, thymol![[thin space (1/6-em)]](https://www.rsc.org/images/entities/char_2009.gif) :
:![[thin space (1/6-em)]](https://www.rsc.org/images/entities/char_2009.gif) camphor, and several ESs based on menthol and carboxylic acids using isotopically enriched xenon NMR spectroscopy for the first time. Specifically, 129Xe chemical shifts and spin-lattice relaxation times, more sensitive to the structure free volume and “cage” effect, and the diffusion coefficients influenced by the presence of aggregates, were experimentally determined. In our systems, molecular shape and alkyl chain length caused changes in xenon chemical shifts and relaxation times indicating an increase in free volume for eutectic mixtures compared to deep eutectic solvents consisting of molecular species that, due to their shape, self-organize in the liquid phase leaving less free volume. The diffusion motion of xenon in the liquid structure reveals the absence of nano-segregation of the mixture’s constituents, correlating rather well with the viscosity data. Overall, our results, using xenon as the NMR probe, shed light on the intricate structure of these new materials used in CO2 gas adsorption and other possible applications as eco-friendly solvents.
camphor, and several ESs based on menthol and carboxylic acids using isotopically enriched xenon NMR spectroscopy for the first time. Specifically, 129Xe chemical shifts and spin-lattice relaxation times, more sensitive to the structure free volume and “cage” effect, and the diffusion coefficients influenced by the presence of aggregates, were experimentally determined. In our systems, molecular shape and alkyl chain length caused changes in xenon chemical shifts and relaxation times indicating an increase in free volume for eutectic mixtures compared to deep eutectic solvents consisting of molecular species that, due to their shape, self-organize in the liquid phase leaving less free volume. The diffusion motion of xenon in the liquid structure reveals the absence of nano-segregation of the mixture’s constituents, correlating rather well with the viscosity data. Overall, our results, using xenon as the NMR probe, shed light on the intricate structure of these new materials used in CO2 gas adsorption and other possible applications as eco-friendly solvents.
Author contribution
Matteo Boventi: methodology, investigation, data analysis, writing – original draft. Michele Mauri: conceptualization, methodology, writing – reviewing. Franca Castiglione: conceptualization, methodology, supervision, writing – reviewing. Roberto Simonutti: conceptualization, supervision, writing – reviewing.Conflicts of interest
There are no conflicts to declare.References
- A. P. Abbott, G. Capper, D. L. Davies, R. K. Rasheed and V. Tambyrajah, Chem. Commun., 2003, 70–71 RSC.
- B. B. Hansen, S. Spittle, B. Chen, D. Poe, Y. Zhang, J. M. Klein, A. Horton, L. Adhikari, T. Zelovich, B. W. Doherty, B. Gurkan, E. J. Maginn, A. Ragauskas, M. Dadmun, T. A. Zawodzinski, G. A. Baker, M. E. Tuckerman, R. F. Savinell and J. R. Sangoro, Chem. Rev., 2021, 121, 1232–1285 CrossRef CAS PubMed.
- T. El Achkar, H. Greige-Gerges and S. Fourmentin, Environ. Chem. Lett., 2021, 19, 3397–3408 CrossRef CAS.
- M. A. R. Martins, S. P. Pinho and J. A. P. Coutinho, J. Solution Chem., 2019, 48, 962–982 CrossRef CAS.
- J. Cao and E. Su, J. Clean. Prod., 2021, 314, 127965 CrossRef CAS.
- D. O. Abranches and J. A. P. Coutinho, Curr. Opin. Green Sustainable Chem., 2022, 35, 100612 CrossRef CAS.
- D. O. Abranches, M. A. R. Martins, L. P. Silva, N. Schaeffer, S. P. Pinho and J. A. P. Coutinho, Chem. Commun., 2019, 55, 10253–10256 RSC.
- K. Xin, F. Gallucci and M. Van Sint Annaland, ACS Sustainable Chem. Eng., 2022, 10, 15284–15296 CrossRef CAS.
- M. Gilmore, É. N. McCourt, F. Connolly, P. Nockemann, M. Swadźba-Kwaśny and J. D. Holbrey, ACS Sustainable Chem. Eng., 2018, 6, 17323–17332 CrossRef CAS.
- A. van den Bruinhorst, S. Raes, S. A. Maesara, M. C. Kroon, A. C. C. Esteves and J. Meuldijk, Sep. Purif. Technol., 2019, 216, 147–157 CrossRef CAS.
- N. H. C. S. Silva, E. S. Morais, C. S. R. Freire, M. G. Freire and A. J. D. Silvestre, Molecules, 2020, 25, 210 CrossRef CAS PubMed.
- M. A. R. Martins, L. P. Silva, P. S. Jorge, D. O. Abranches, S. P. Pinho and J. A. P. Coutinho, Eur. J. Pharm. Sci., 2021, 156, 105583 CrossRef CAS PubMed.
- T. Brouwer, B. C. Dielis, J. M. Bock and B. Schuur, Processes, 2021, 9, 796 CrossRef CAS.
- Á. Santana-Mayor, B. Socas-Rodríguez, R. Rodríguez-Ramos, A. V. Herrera-Herrera and M. Á. Rodríguez-Delgado, Anal. Bioanal. Chem., 2021, 413, 1967–1981 CrossRef PubMed.
- S. J. R. Vargas, G. Pérez-Sánchez, N. Schaeffer and J. A. P. Coutinho, Green Chem., 2021, 23, 4540–4550 RSC.
- M. Lalikoglu, Biomass Convers. Biorefin., 2022, 12, 1331–1341 CrossRef CAS.
- A. Alhadid, J. Safarov, L. Mokrushina, K. Müller and M. Minceva, Front. Chem., 2022, 10, 1–8 Search PubMed.
- A. R. Harifi-Mood and M. Sarafrazi, J. Environ. Chem. Eng., 2023, 11, 109177 CrossRef CAS.
- C. J. Jameson, Chem. Rev., 1991, 91, 1375–1395 CrossRef CAS.
- B. M. Goodson, J. Magn. Reson., 2002, 155, 157–216 CrossRef CAS PubMed.
- J. Demarquay and J. Fraissard, Chem. Phys. Lett., 1987, 136, 314–318 CrossRef CAS.
- I. L. Moudrakovski, C. I. Ratcliffe and J. A. Ripmeester, J. Am. Chem. Soc., 1998, 120, 3123–3132 CrossRef CAS.
- V. V. Terskikh, I. L. Mudrakovskii and V. M. Mastikhin, J. Chem. Soc., Faraday Trans., 1993, 89, 4239–4243 RSC.
- M. Wenzel, L. Eckert, K. Müller, D. Solonenko, C. Wiebeler, D. R. T. Zahn, D. Enke and J. Matysik, Phys. Chem. Chem. Phys., 2022, 24, 14488–14497 RSC.
- J. D. Barboza-Carmona, M. Wenzel, L. Eckert, D. Enke, J. Matysik and I. F. Céspedes-Camacho, J. Sol-Gel Sci. Technol., 2022, 101, 176–184 CrossRef CAS.
- T. Onfroy, F. Guenneau, M. A. Springuel-Huet and A. Gédéon, Carbon, 2009, 47, 2352–2357 CrossRef CAS.
- M. Oschatz, H. C. Hoffmann, J. Pallmann, J. Schaber, L. Borchardt, W. Nickel, I. Senkovska, S. Rico-Francés, J. Silvestre-Albero, S. Kaskel and E. Brunner, Chem. Mater., 2014, 26, 3280–3288 CrossRef CAS.
- M. Mauri, M. Farina, G. Patriarca, R. Simonutti, K. T. Klasson and H. N. Cheng, Int. J. Polym. Anal. Charact., 2015, 20, 119–129 CrossRef CAS.
- M. Farina, M. Mauri, G. Patriarca, R. Simonutti, K. T. Klasson and H. N. Cheng, RSC Adv., 2016, 6, 103803–103810 RSC.
- J. B. Miller, J. H. Walton and C. M. Roland, Macromolecules, 1993, 26, 5602–5610 CrossRef CAS.
- H. Yoshimizu, S. Ohta, T. Asano, T. Suzuki and Y. Tsujita, Polym. J., 2012, 44, 821–826 CrossRef CAS.
- M. Boventi, M. Mauri, K. Golker, J. G. Wiklander, I. A. Nicholls and R. Simonutti, ACS Appl. Polym. Mater., 2022, 4, 8740–8749 CrossRef CAS PubMed.
- H. C. Hoffmann, B. Assfour, F. Epperlein, N. Klein, S. Paasch, I. Senkovska, S. Kaskel, G. Seifert and E. Brunner, J. Am. Chem. Soc., 2011, 133, 8681–8690 CrossRef CAS.
- R. Giovine, C. Volkringer, M. A. Springuel-Huet, A. Nossov, F. Blanc, J. Trébosc, T. Loiseau, J. P. Amoureux, O. Lafon and F. Pourpoint, J. Phys. Chem. C, 2017, 121, 19262–19268 CrossRef CAS.
- P. Morgado, R. Bonifacio, F. G. Martins and E. J. M. Filipe, J. Phys. Chem. B, 2013, 117, 9014–9024 CrossRef CAS PubMed.
- P. Morgado, J. Barras and E. J. M. Filipe, Phys. Chem. Chem. Phys., 2020, 22, 14736–14747 RSC.
- P. Morgado, L. F. G. Martins and E. J. M. Filipe, Phys. Chem. Chem. Phys., 2019, 21, 3742–3751 RSC.
- F. Castiglione, R. Simonutti, M. Mauri and A. Mele, J. Phys. Chem. Lett., 2013, 4, 1608–1612 CrossRef CAS PubMed.
- F. Castiglione, G. Saielli, M. Mauri, R. Simonutti and A. Mele, J. Phys. Chem. B, 2020, 124, 6617–6627 CrossRef CAS PubMed.
- G. Saielli, F. Castiglione, M. Mauri, R. Simonutti and A. Mele, ChemPhysChem, 2021, 22, 1880–1890 CrossRef CAS PubMed.
- M. Boventi, M. Mauri, F. Alexander, S. L. James, R. Simonutti and F. Castiglione, J. Mol. Liq., 2023, 370, 121038 CrossRef CAS.
- M. A. R. Martins, L. P. Silva, N. Schaeffer, D. O. Abranches, G. J. Maximo, S. P. Pinho and J. A. P. Coutinho, ACS Sustainable Chem. Eng., 2019, 7, 17414–17423 CrossRef CAS.
- M. A. R. Martins, E. A. Crespo, P. V. A. Pontes, L. P. Silva, M. Bülow, G. J. Maximo, E. A. C. Batista, C. Held, S. P. Pinho and J. A. P. Coutinho, ACS Sustainable Chem. Eng., 2018, 6, 8836–8846 CrossRef CAS.
- M. S. Syamala, R. J. Cross and M. Saunders, J. Am. Chem. Soc., 2002, 124, 6216–6219 CrossRef CAS PubMed.
- D. H. Wu, A. Chen and C. S. Johnson, J. Magn. Reson., Ser. A, 1995, 115, 260–264 CrossRef CAS.
- C. J. Jameson, D. N. Sears and S. Murad, J. Chem. Phys., 2004, 121, 9581–9592 CrossRef CAS PubMed.
- M. Luhmer and K. Bartik, J. Phys. Chem. A, 1997, 101, 5278–5283 CrossRef CAS.
- K. Oikarinen and J. Jokisaari, Appl. Magn. Reson., 1995, 8, 587–595 CrossRef CAS.
- I. E. Dimitrov, R. Reddy and J. S. Leigh, J. Magn. Reson., 2000, 145, 302–306 CrossRef CAS PubMed.
- J. Wolber, S. J. Doran, M. O. Leach and A. Bifone, Chem. Phys. Lett., 1998, 296, 391–396 CrossRef CAS.
- F. P. Pelaquim, A. M. Barbosa Neto, I. A. L. Dalmolin and M. C. da Costa, Ind. Eng. Chem. Res., 2021, 60, 8607–8620 CrossRef CAS.
| This journal is © The Royal Society of Chemistry 2024 |

