 Open Access Article
Revisiting the driving force inducing phase separation in PEG–phosphate aqueous biphasic systems†
Sophie
Bonnassieux
a,
Raj
Pandya
bcd,
Dhyllan Adan
Skiba
e,
Damien
Degoulange
 fg,
Dorothée
Petit
h,
Peter
Seem
h,
Russel P.
Cowburn
ch,
Betar M.
Gallant
 e and
Alexis
Grimaud
 *a
*a
aDepartment of Chemistry, Merkert Chemistry Center, Boston College, Chestnut Hill, MA 02467, USA. E-mail: alexis.grimaud@bc.edu
bLaboratoire Kastler Brossel, ENS-Université PSL, CNRS, Sorbonne Université, Collège de France, 24 rue Lhomond, 75005 Paris, France
cCavendish Laboratory, University of Cambridge, Cambridge CB3 0HE, UK
dDepartment of Chemistry, University of Warwick, Coventry, CV4 7AL, UK
eDepartment of Mechanical Engineering, Massachusetts Institute of Technology, 77 Massachusetts Avenue, Cambridge, MA 02139, USA
fChimie du Solide et de l'Energie, Collège de France, UMR 8260, 75231 Paris Cedex 05, France
gSorbonne Université, 75006 Paris, France
hDurham Magneto Optics Ltd, Church Road, Toft, Cambridge CB23 2RF, UK
First published on 23rd April 2024
Abstract
Liquid phase separation using aqueous biphasic systems (ABS) is widely used in industrial processes for the extraction, separation and purification of macromolecules. Using water as the single solvent, a wide variety of solutes have been used to induce phase separation including polymers, ionic liquids or salts. For each system, polymer–polymer, polymer–ionic liquid, polymer–salt or salt–salt, different driving forces were proposed to induce phase separation. Specifically, for polymer–salt systems, a difference in solvation structure between the polymer-rich and the salt-rich was proposed, while other reports suggested that a large change in enthalpy and entropy accompanied the phase separation. Here, we reinvestigated the PEG/K2HPO4/H2O systems using a combination of liquid-phase nuclear magnetic resonance (NMR) and high-resolution Raman spectroscopies, coupled with injection microcalorimetry. Both NMR and Raman reveal a decreased water concentration in the PEG-rich phase, with nonetheless no significant differences observed for both 1H chemical shift or OH stretching vibrations. Hence, both PEG- and salt-rich phases exhibit similar water solvation properties, which is thus not the driving force for phase separation. Furthermore, NMR reveals that PEG interacts with salt ions in the PEG-rich solution, inducing a downfield shift with increasing salt concentration. Injection microcalorimetry measurements were carried out to investigate any effect due to enthalpy change during mixing. Nevertheless, these measurements indicate very small enthalpy changes when mixing PEG- and salt-rich solutions in comparison with that previously recorded for salt–salt systems or associated with mixing of two solvents. Hence, our study discards any large change of enthalpy as the origin for phase separation of PEG/K2HPO4 systems, in addition to large difference in solvation properties.
Introduction
Liquid–liquid phase separation lies at the heart of chemical phenomena in biological systems such as the separation of macromolecules inside cells as well as industrial processes including separations and purifications. Currently, organic–aqueous systems are responsible for the majority of liquid–liquid phase separations, and are thus well studied and understood.1 More recently, aqueous–aqueous systems have gained attention due to their desirable properties and prospective applications. Aqueous–aqueous systems, known as aqueous biphasic systems (ABSs) or aqueous two-phase systems (ATPS), in which two solutes cause an aqueous solution to separate into two phases, provide several advantages over the traditional organic–aqueous systems. ABSs provide a gentler environment for biomaterial separations, are cleaner for the environment due to the absence of organic solvent, and are readily accessible due to their reduced costs.2–8ABSs were first discovered in 1896 by Beijerinck by the formation of two phases when two polymers (gelatin and a polysaccharide, either agar or soluble starch) were mixed in water.9 Many polymers are able to induce the formation of ABSs, including non-ionic polymers such as polyethylene glycol (PEG), dextran (DEX), polypropylene glycol (PPG), polyvinylpyrrolidone (PVP), as well as ionic polymers including polyacrylic acid (PPA) and polyacrylamide (PAM).10 Polymer–polymer aqueous solutions remain the most common and well-studied type of ABS but other solutes can also induce phase separation in aqueous solution. First report of polymer–salt ABS was made by Albertsson in 1956 using phosphate buffers and PEG,11 before being extended to a variety of salts and polymers.10 Like for polymer–polymer ABS, it was been found that longer PEG chains facilitate phase separation for polymer–salt systems.12,13 Furthermore, for PEG-based systems, comparing results obtained for different sodium salts showed that anions with a “salting-in” ability, such as chloride (Cl−) and nitrate (NO3−), have a lower tendency to form ABSs while anions with a “salting-out” ability, such as carbonate (CO32−), have a higher tendency to form ABSs.10,14 Based on these results, salting-in/salting-out ability of anions as expressed by the Hofmeister (or lyotropic) series was concluded to explain polymer–salt ABS formation. This series follows, at least partially, the same trend as the Gibbs free energy of hydration of the different salt ions.10 Common understanding is that the interactions of water with salt ions or with the polymers, which are known to form various polymeric water structures, must play a role in driving the phase separation, with phase separation occurring for ions that do not interact with the polymer but instead takes water from the polymer.10,14
More recently, ionic liquid–salt and salt–salt ABSs were reported,15 with systems such as LiCl/LiTFSI/H2O pioneered by our group.16–18 With increasing richness in ABS chemistries arises the question regarding the driving force behind phase separation for ABS. Studying salt–salt ABSs sharing common cations (Li+), we have recently highlighted the differences existing between these different ABS families. Indeed, we demonstrated that size and shape asymmetry is necessary to induce phase separation, bearing in mind that the immiscibility is triggered at high salt concentration in which packing constrains arise.17 We then demonstrated using high resolution Raman imaging a continuum of solvation structure existing across the liquid/liquid interface formed in the LiCl/LiTFSI/H2O system, with the LiTFSI rich phase exhibiting weaker hydrogen bonding network resembling that of a so-called water-in-salt system, while the LiCl phase shows a strong hydrogen bonding network.18
Previous studies indicate debate and uncertainty in what causes phase separation in ABS systems.10 It has been suggested that phase separation in polymer-based ABSs results from differences in the structure of water. Thus, a difference in solvation structure in either phase results in the partitioning behavior.19 Additionally, the salting-out effect and differences in hydrophilicity of the solutes were proposed as driving force for phase separation in both polymer–polymer and polymer–salt ABS.20,21 Aside from solvation properties, it has also been suggested that large changes in enthalpy and entropy accompanies phase separation.20
In light of past reports, we reinvestigated polymer–salt ABS systems using the methodology previously developed for salt–salt ABSs to decipher the role of solvation properties and entropy gain following separation as potential driving forces for phase separation, focusing our efforts on the PEG/K2HPO4 system. We employ a variety of techniques including liquid nuclear magnetic resonance (NMR) spectroscopy and high-resolution Raman spectroscopy to study the solvation properties of both liquid phases as well as injection microcalorimetry to investigate changes in enthalpy of mixing as a function of ABS composition.
Materials and methods
Materials
Potassium phosphate dibasic (K2HPO4 anhydrous, Sigma-Aldrich, 99%), polyethylene glycol 4000 (PEG 4000, Thermo Scientific), and polyethylene glycol 20![[thin space (1/6-em)]](https://www.rsc.org/images/entities/char_2009.gif) 000 (PEG 20
000 (PEG 20![[thin space (1/6-em)]](https://www.rsc.org/images/entities/char_2009.gif) 000, Sigma-Aldrich) were weighed and MilliQ water was added to reach the desired molalities.
000, Sigma-Aldrich) were weighed and MilliQ water was added to reach the desired molalities.
Phase diagram construction
Phase diagrams were measured using the cloud point titration method previously described.6,12 Briefly, starting from a known mass of a concentrated solution of one component, an aqueous solution of the second component is weighed while being added dropwise and vortexed until the solution becomes cloudy. Then, water is weighed while being added dropwise and vortexed until the solution becomes clear again. These steps are repeated for each point of the diagram.NMR spectroscopy
NMR spectra were obtained using a Bruker AVANCE NEO 500 MHz spectrometer equipped with an X nuclei optimized 5 mm double resonance BBO H&F CyroProbe Prodigy. 1H and 31P spectra are obtained using 8 and 32 scans, respectively.Raman spectroscopy
Bulk Raman spectroscopy spectra were acquired using a Horiba Micro XploRA Raman spectrometer fitted with a 100× lens. A 638 nm laser and a 1800 g mm−1 grating were used. Spectra are acquired using a 10 seconds acquisition time.Raman imaging
Raman imaging of the samples was performed using an in-house prototype instrument at Durham Magneto Optics Ltd, UK, with a 532 nm excitation and imaging with a 1.4-NA oil-immersion objective. The spectral resolution of the system is 16 cm−1. The maximum pump power before the objective was ∼10 mW, a power level that ensured no degradation of samples. All images presented were taken with integration times per pixel in the 0.001–0.05 s settings range. Background subtraction of Raman spectra was performed using a custom polynomial smoothing method.Titration microcalorimetry
The calorimetric measurements were completed isothermally using a power compensation microcalorimeter (Thermal Hazard Technology, μRC). Each injection was performed using an automated syringe pump tower attachment. Samples were stirred to allow for uniform mixing. The partial enthalpy of mixing was found by integrating the resulting power spike upon injection of one phase into the second phase.Results & discussion
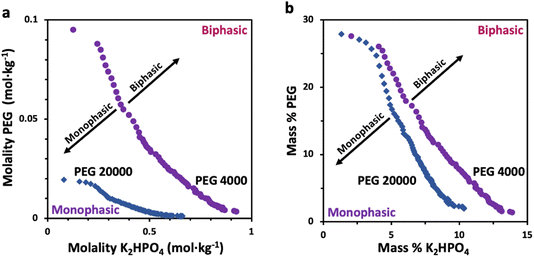
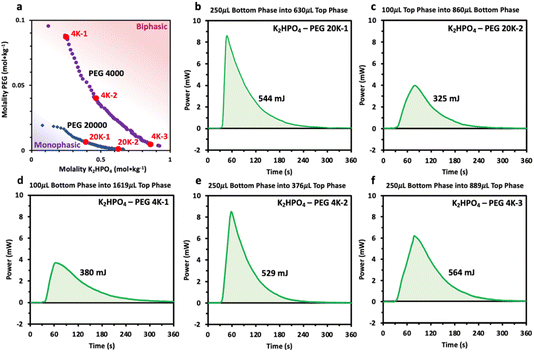
Prior to characterizing the polymer–salt system, we first study the phase diagrams of two PEG/K2HPO4 systems at room temperature using the point cloud titration technique, and varying the length of PEG (Fig. 1) (note that the melting points of PEG 4000 and PEG 20![[thin space (1/6-em)]](https://www.rsc.org/images/entities/char_2009.gif) 000 are low, between 53–58 °C). Doing so, biphasic (pink) or monophasic (purple) regions are observed, with differences existing as function of PEG chain length. Indeed, increasing the PEG chain length from 4000 to 20
000 are low, between 53–58 °C). Doing so, biphasic (pink) or monophasic (purple) regions are observed, with differences existing as function of PEG chain length. Indeed, increasing the PEG chain length from 4000 to 20![[thin space (1/6-em)]](https://www.rsc.org/images/entities/char_2009.gif) 000 results in a shift of the binodal curve separating the miscible from the immiscible regions to lower concentrations. This is in agreement with the general rule that longer polymer chains phase separate at lower weight percentages.12 One can understand this trend by observing that PEG 20
000 results in a shift of the binodal curve separating the miscible from the immiscible regions to lower concentrations. This is in agreement with the general rule that longer polymer chains phase separate at lower weight percentages.12 One can understand this trend by observing that PEG 20![[thin space (1/6-em)]](https://www.rsc.org/images/entities/char_2009.gif) 000 is less soluble than PEG 4000 or that PEG 20
000 is less soluble than PEG 4000 or that PEG 20![[thin space (1/6-em)]](https://www.rsc.org/images/entities/char_2009.gif) 000 is more hydrophobic than PEG 4000, as suggested elsewhere.22,23
000 is more hydrophobic than PEG 4000, as suggested elsewhere.22,23
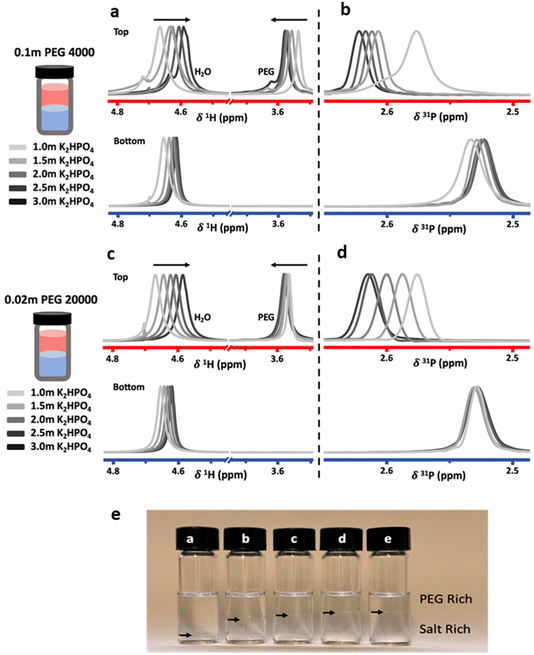
To investigate the effect of salt concentration, solutions were prepared in the biphasic region with constant PEG concentrations and increasing salt concentrations. Measurements were carried out on the two immiscible liquids following separation after equilibration. Liquid-state NMR spectroscopy was used to probe differences in solvation structure and ion interactions. Proton (1H) and phosphorus (31P) NMR spectra were collected for the top and bottom phases of ABS solutions containing a constant concentration of 0.1 m PEG 4000 or 0.02 m PEG 20![[thin space (1/6-em)]](https://www.rsc.org/images/entities/char_2009.gif) 000, with K2HPO4 concentrations ranging from 1.0 m to 3.0 m (Fig. 2).
000, with K2HPO4 concentrations ranging from 1.0 m to 3.0 m (Fig. 2).
Both the PEG 4000 and the PEG 20![[thin space (1/6-em)]](https://www.rsc.org/images/entities/char_2009.gif) 000 systems exhibit similar trends. In the 1H-NMR spectra, a shift of the water peak (≈4.7 ppm) to lower values (upfield) is observed, indicating higher shielding of water protons. In the top phase, this is likely caused by an apparent increase in PEG concentration as the PEG-rich top phase decreases in volume as the salt concentration is increased (Fig. 2e). In the bottom phase, the upfield shift is attributed to the increased salt concentration. The shift is not as significant since the salt-rich bottom phase increases in volume with increasing salt concentrations, and thus the bottom phase only moderately increases in salt concentration. Perhaps unintuitively, the 1H-NMR peak corresponding to PEG (≈3.55 ppm) shifts downfield with increased salt concentrations. While indeed the top phase experiences an increase in apparent PEG concentration due to decreasing volume, an increase in PEG concentration alone does not cause any shift in the PEG peak (Fig. 3). The observed shift indicates an interaction between the PEG and salt ions, as discussed in previous reports.10,14 Hence, salt ions are interacting with PEG chains in the PEG-rich top phase. 31P-NMR spectra show a downfield shift in the top (red) phase, with minimal shift in the bottom phase (blue). The downfield shift observed in the top phase is due to a decreased phosphate concentration. This agrees with previous reports for other ABSs that higher concentrations induce better separations and less transfer across the interface. The bottom phase shows only a small upfield shift due to the limited increase in phosphate concentration, a result of the bottom phase volume increasing with increased salt concentrations.
000 systems exhibit similar trends. In the 1H-NMR spectra, a shift of the water peak (≈4.7 ppm) to lower values (upfield) is observed, indicating higher shielding of water protons. In the top phase, this is likely caused by an apparent increase in PEG concentration as the PEG-rich top phase decreases in volume as the salt concentration is increased (Fig. 2e). In the bottom phase, the upfield shift is attributed to the increased salt concentration. The shift is not as significant since the salt-rich bottom phase increases in volume with increasing salt concentrations, and thus the bottom phase only moderately increases in salt concentration. Perhaps unintuitively, the 1H-NMR peak corresponding to PEG (≈3.55 ppm) shifts downfield with increased salt concentrations. While indeed the top phase experiences an increase in apparent PEG concentration due to decreasing volume, an increase in PEG concentration alone does not cause any shift in the PEG peak (Fig. 3). The observed shift indicates an interaction between the PEG and salt ions, as discussed in previous reports.10,14 Hence, salt ions are interacting with PEG chains in the PEG-rich top phase. 31P-NMR spectra show a downfield shift in the top (red) phase, with minimal shift in the bottom phase (blue). The downfield shift observed in the top phase is due to a decreased phosphate concentration. This agrees with previous reports for other ABSs that higher concentrations induce better separations and less transfer across the interface. The bottom phase shows only a small upfield shift due to the limited increase in phosphate concentration, a result of the bottom phase volume increasing with increased salt concentrations.
 | ||
Fig. 3 Proton NMR spectra of solutions (containing no salt) with increasing (a) PEG 4000 and (b) PEG 20![[thin space (1/6-em)]](https://www.rsc.org/images/entities/char_2009.gif) 000 concentrations. 000 concentrations. | ||
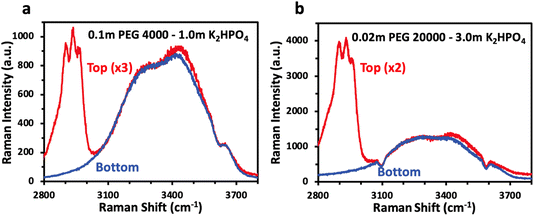
While NMR spectroscopy provides insight into concentration of dissolved species in each phase and their interactions, vibrational spectroscopy such as Raman allows for probing of the water structure and answer if, as previously proposed, phase separation for polymer–salt ABS is driven by a difference in solvation structure. Fig. 4 shows the Raman spectra of the top and bottom phases, overlaid, for selected PEG/K2HPO4 ABS solutions. The bulk Raman spectra show very little difference between the water structure for both solutions, made apparent by the similar OH stretching water signatures in the top and bottom phases for each solution. The two main components of the signal are observed below 3500 cm−1, which corresponds to strong hydrogen bonding network. One can note the absence of signal at wavenumbers above 3500 cm−1, often ascribed to weak hydrogen bonding in the presence of a large concentration of salt. Hence, we reveal that the water solvation structure for the polymer- and salt-rich phases in PEG/K2HPO4 ABS solution is similar and corresponds to that of a diluted solution. This is in stark contrast with salt–salt ABSs such as LiCl/LiTFSI, for which the LiTFSI- and LiCl-rich phases show very different solvation structures, with the former showing a solvation structure alike that of a water-in-salt concentrated electrolyte and the latter showing the solvation structure of a more diluted solution.18 Thus, differences in the solvation structure of water are not responsible for phase separation of the PEG/K2HPO4 ABS.
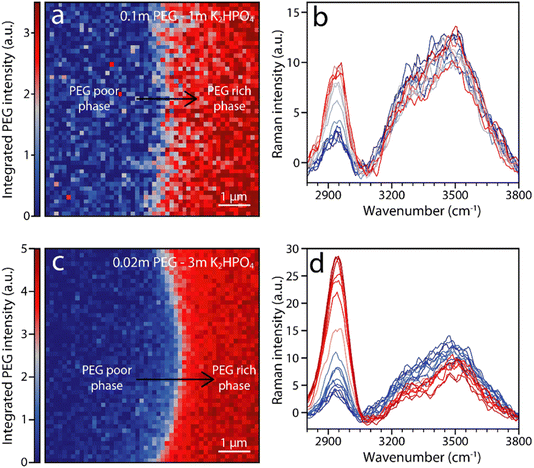
To confirm that solvation structure is not a major driving force for phase separation, high resolution Raman imaging is used to characterize the solution immediately around the interface. Fig. 5 shows false-color images of the integrated intensity of the PEG peaks at around 2900 cm−1 for PEG–K2HPO4 systems of various compositions. Moving from the PEG poor bottom phase (blue) to the PEG rich top phase (red), a change in intensity of the vibration at ≈2920 cm−1 associated with PEG is observed from the PEG-rich (red) to the PEG-poor (blue) phase, indicating, to no surprise, a change in PEG concentration. Furthermore, vibrations associated with OH stretching in the 3200–3700 cm−1 wavenumber range also show a change in intensity, albeit less pronounced than for PEG vibrations. This gradual change indicates that the concentration of water in the PEG-rich phase is poorer than in the salt-rich one. Nevertheless, minimal shift is observed, indicating no significant modification of the H-bonding network. This observation holds for all tested ABSs, which includes a range of PEG length and salt concentration, confirming that little to no difference in solvation structure exists between the two phases even on a microscopic level by the interface (Fig. S1†).
We thus reveal that, unlike previously hypothesized, differences in water solvation structures are not the driving force inducing phase separation in the PEG/K2HPO4 ABSs. However, the results do indicate a perhaps significant interaction between the PEG and K2HPO4. Our attention then turned to the other driving force previously proposed in the literature: a large change in enthalpy and entropy accompanying phase separation.2 To study this hypothesis, injection microcalorimetry was used to quantify the enthalpy that accompanies phase separation. Polymer–salt systems were first prepared at room temperature at different points of the phase diagram nearby the binodal curve in the immiscible region. After equilibration, both phases were extracted. The phase with a greater volume was the placed in the calorimeter and held at 2 °C, a temperature at which both liquid phases are miscible. The phase with the smaller volume was then injected into the larger phase and the heat associated with mixing measured. The volume of each phase was adjusted such that the original composition of the polymer–salt system was obtained. Prior to analyzing the results, the effect of volume of injectant on the heat generated was first estimated, knowing that the volume of each phase changes as function of the initial composition of the system (volume of the top phase rich in PEG becomes smaller for systems concentrated in salt, and vice versa). By injecting pure water into water, a residual heat was measured, its value being directly proportional to the volume of injectant (100 μL of injectant gives a heat of approximatively 100 mJ, 250 μL of injectant gives approximatively 250 mJ) (Fig. S2†). This result most likely originates from a slight deviation from the set temperature of 2 °C for the injectant. It is important to consider this residual heat when interpreting the values obtained when mixing the polymer–salt phases at 2 °C. The measured heats are thus a sum of the residual heat (which is function of the injectant volume) and the heat of mixing.
First, positive heat values are measured for all these systems, confirming that these systems possess a negative enthalpy of mixing and that all these systems are lower critical temperature TLC systems that mix at low temperature and become immiscible at high temperature (Fig. 6). Second, the heat of mixing for each system appears to be strongly dependent on the volume of the injectant, with a nearly constant heat around 350 and 550 mJ recorded for 100 and 250 μL of injectant, respectively. Unfortunately, the residual heats appear to dominate the response of the mixing measurements, making direct quantifications of the mixing enthalpy difficult. However, the measurements still indicate that the enthalpies of the mixing must be negative and small (<−20 J molmix−1), and suggest that they are relatively independent of the salt and PEG concentration as well as on the PEG chain length (4000 vs. 20![[thin space (1/6-em)]](https://www.rsc.org/images/entities/char_2009.gif) 000). Comparing these values with those previously obtained for LiCl/LiTFSI ABS systems, heat values 2 to 3 times smaller are measured.18 Such small enthalpy of mixing for PEG/K2HPO4 systems regardless of the composition agrees with the spectroscopic data that show no significant changes in the solvation structure of water in the different phases. In other words, when mixing both phases, few interactions are broken or made, resulting in the enthalpy for both phases, the PEG- and the salt-rich phases, being nearly the same. Our results thus refute a large gain in enthalpy to be the driving force for phase separation for PEG/K2HPO4 systems. Furthermore, as for any TLC system, the enthalpy and entropy of mixing share the same sign such that the Gibbs free energy of mixing is negative below the TLC (miscible regime) and positive above the TLC (immiscible regime).24,25 Nevertheless, the TΔSmix term is smaller than ΔHmix at low temperature, and only increasing the temperature makes ΔGmix negative. In conclusion, as for the enthalpy of mixing, we do not expect that a large gain in entropy is at the origin for the immiscibility of the PEG/K2HPO4 system at high temperature.
000). Comparing these values with those previously obtained for LiCl/LiTFSI ABS systems, heat values 2 to 3 times smaller are measured.18 Such small enthalpy of mixing for PEG/K2HPO4 systems regardless of the composition agrees with the spectroscopic data that show no significant changes in the solvation structure of water in the different phases. In other words, when mixing both phases, few interactions are broken or made, resulting in the enthalpy for both phases, the PEG- and the salt-rich phases, being nearly the same. Our results thus refute a large gain in enthalpy to be the driving force for phase separation for PEG/K2HPO4 systems. Furthermore, as for any TLC system, the enthalpy and entropy of mixing share the same sign such that the Gibbs free energy of mixing is negative below the TLC (miscible regime) and positive above the TLC (immiscible regime).24,25 Nevertheless, the TΔSmix term is smaller than ΔHmix at low temperature, and only increasing the temperature makes ΔGmix negative. In conclusion, as for the enthalpy of mixing, we do not expect that a large gain in entropy is at the origin for the immiscibility of the PEG/K2HPO4 system at high temperature.
Conclusion
In this work, we have revisited the polymer–salt PEG/K2HPO4 ABSs using an array of technique including Raman and NMR spectroscopy as well as titration microcalorimetry. Spectroscopy results reveal that the water H-bonding network is very similar in each phase of the PEG/K2HPO4 system, independently of the salt or PEG concentrations and of the PEG chain length, with both the PEG-rich and the salt-rich phase showing strong H-bonding network typical of diluted solutions. These results thus rebut the possibility of large difference in solvation as the driving force for phase separation. Furthermore, 1H NMR spectroscopy shows a downfield shift of the PEG peak upon increasing salt concentration, that we ascribed to interaction between PEG and the salt in the PEG-rich phase. Nevertheless, it remains unclear if this interaction is responsible for phase separation. Comparing these results with previous findings regarding the driving force for salt–salt ABSs (LiCl/LiTFSI or HCl/LiTFSI) for which the OH stretching vibrations from water were observed to be strongly different between both liquid phases, we conclude that the driving force for phase separation is different between PEG/K2HPO4 and salt/salt systems. Such difference is further evidenced when observing that the enthalpy of mixing is very small for PEG/K2HPO4 systems, and likely independent of salt and PEG concentration. These results indicate that when mixing both liquid phases, the PEG- and the salt-rich, very few interactions are broken or made, confirming that both phases show very similar solvation structure. Hence, we can discard a large enthalpy gain as the driving force for phase separation in the PEG/K2HPO4 system. Finally, observing that these systems are so-called TLC, we hypothesize that entropy of mixing is also very likely to be small between these two phases. While our work does not conclude on the driving force for phase separation in this specific polymer–salt ABS, we nevertheless highlight stark differences existing between polymer–salt and salt–salt ABSs, with the latter being driven by a change in solvation structure induced by the different solvation and size properties of the salt anions.17,18Conflicts of interest
D. P., P. S. and R. P. C. are employees of Durham Magneto Optics Ltd, a company selling scientific instrumentation.Acknowledgements
S. B. acknowledges funding from the Kozarich Summer Undergraduate Research Fellowship. This research was supported by the NSF-MRI award CHE-2117246.References
- A. Schmidt and J. Strube, Application and Fundamentals of Liquid–Liquid Extraction Processes: Purification of Biologicals, Botanicals, and Strategic Metals, in Kirk-Othmer Encyclopedia of Chemical Technology, John Wiley & Sons, Ltd, 2018, pp. 1–52, DOI:10.1002/0471238961.koe00041.
- R. Hatti-Kaul, Aqueous two-phase systems, Mol. Biotechnol., 2001, 19, 269–277 CrossRef CAS PubMed.
- A. Glyk, T. Scheper and S. Beutel, PEG–salt aqueous two-phase systems: an attractive and versatile liquid–liquid extraction technology for the downstream processing of proteins and enzymes, Appl. Microbiol. Biotechnol., 2015, 99, 6599–6616 CrossRef CAS PubMed.
- J. V. D. Molino, D. de A. Viana Marques, A. P. Júnior, P. G. Mazzola and M. S. V. Gatti, Different types of aqueous two-phase systems for biomolecule and bioparticle extraction and purification, Biotechnol. Prog., 2013, 29, 1343–1353 CrossRef CAS PubMed.
- M. Mastiani, N. Firoozi, N. Petrozzi, S. Seo and M. Kim, Polymer-Salt Aqueous Two-Phase System (ATPS) Micro-Droplets for Cell Encapsulation, Sci. Rep., 2019, 9, 15561 CrossRef PubMed.
- M. Iqbal, et al., Aqueous two-phase system (ATPS): an overview and advances in its applications, Biol. Proced. Online, 2016, 18, 18 CrossRef PubMed.
- M. Gras, et al., Ionic-Liquid-Based Acidic Aqueous Biphasic Systems for Simultaneous Leaching and Extraction of Metallic Ions, Angew. Chem., Int. Ed., 2018, 57, 1563–1566 CrossRef CAS PubMed.
- A. L. Grilo, M. Raquel Aires-Barros and A. M. Azevedo, Partitioning in Aqueous Two-Phase Systems: Fundamentals, Applications and Trends, Sep. Purif. Rev., 2016, 45, 68–80 CrossRef.
- P.-Å. Albertsson, Partition of Cell Particles and Macromolecules in Polymer Two-Phase Systems, Adv. Protein Chem., 1970, 24, 309–341 CrossRef CAS PubMed.
- J. F. B. Pereira and J. A. P. Coutinho, Aqueous Two-Phase Systems, Liquid-Phase Extraction, Elsevier, 2020, pp. 157–182 Search PubMed.
- P.-Å. Albertsson, Chromatography and Partition of Cells and Cell Fragments, Nature, 1956, 177, 771–774 CrossRef CAS PubMed.
- A. D. Diamond and J. T. Hsu, Phase diagrams for dextran-PEG aqueous two-phase systems at 22 °C, Biotechnol. Tech., 1989, 3, 119–124 CrossRef CAS.
- J. G. Huddleston, H. D. Willauer and R. D. Rogers, Phase Diagram Data for Several PEG + Salt Aqueous Biphasic Systems at 25 °C, J. Chem. Eng. Data, 2003, 48, 1230–1236 CrossRef CAS.
- K. P. Ananthapadmanabhan and E. D. Goddard, Aqueous biphase formation in polyethylene oxide-inorganic salt systems, Langmuir, 1987, 3, 25–31 CrossRef CAS.
- M. G. Freire, et al., Aqueous biphasic systems: a boost brought about by using ionic liquids, Chem. Soc. Rev., 2012, 41, 4966–4995 RSC.
- N. Dubouis, et al., Chasing Aqueous Biphasic Systems from Simple Salts by Exploring the LiTFSI/LiCl/H2O Phase Diagram, ACS Cent. Sci., 2019, 5, 640–643 CrossRef CAS PubMed.
- N. Dubouis, A. France-Lanord, A. Brige, M. Salanne and A. Grimaud, Anion Specific Effects Drive the Formation of Li-Salt Based Aqueous Biphasic Systems, J. Phys. Chem. B, 2021, 125, 5365–5372 CrossRef CAS PubMed.
- D. Degoulange, et al., Direct imaging of micrometer-thick interfaces in salt–salt aqueous biphasic systems, Proc. Natl. Acad. Sci. U. S. A., 2023, 120, e2220662120 CrossRef CAS PubMed.
- B. Yu. Zaslavsky, et al., Structure of water as a key factor of phase separation in aqueous mixtures of two nonionic polymers, Polymer, 1989, 30, 2104–2111 CrossRef.
- H.-O. Johansson, G. Karlström, F. Tjerneld and C. A. Haynes, Driving forces for phase separation and partitioning in aqueous two-phase systems, J. Chromatogr. B: Biomed. Sci. Appl., 1998, 711, 3–17 CrossRef CAS PubMed.
- A. M. S. Jorge, J. A. P. Coutinho and J. F. B. Pereira, Hydrodynamics of cholinium chloride-based aqueous biphasic systems (ABS): a key study for their industrial implementation, Sep. Purif. Technol., 2023, 320, 124183 CrossRef CAS.
- A. Glyk, T. Scheper and S. Beutel, Influence of Different Phase-Forming Parameters on the Phase Diagram of Several PEG–Salt Aqueous Two-Phase Systems, J. Chem. Eng. Data, 2014, 59, 850–859 CrossRef CAS.
- G. Tubío, L. Pellegrini, B. B. Nerli and G. A. Picó, Liquid–Liquid Equilibria of Aqueous Two-Phase Systems Containing Poly(ethylene glycols) of Different Molecular Weight and Sodium Citrate, J. Chem. Eng. Data, 2006, 51, 209–212 CrossRef.
- S. I. Sandler, Models for Thermodynamic and Phase Equilibria Calculations, Taylor & Francis, 1993 Search PubMed.
- P. W. Atkins and J. De Paula, Physical Chemistry, W. H. Freeman, New York, 2006 Search PubMed.
Footnote |
| † Electronic supplementary information (ESI) available. See DOI: https://doi.org/10.1039/d4fd00058g |
| This journal is © The Royal Society of Chemistry 2024 |

