 Open Access Article
Creative Commons Attribution 3.0 Unported Licence
Overdetermination method for accurate dynamic ion correlations in highly concentrated electrolytes†
Tabita
Pothmann
a,
Maleen
Middendorf
 bc,
Christian
Gerken
a,
Pinchas
Nürnberg
b,
Monika
Schönhoff
 *b and
Bernhard
Roling
 *a
*a
aDepartment of Chemistry and Center for Materials Science (WZMW), University of Marburg, Hans-Meerwein-Strasse 4, 35032 Marburg, Germany. E-mail: roling@staff.uni-marburg.de
bInstitute of Physical Chemistry, University of Muenster, Corrensstraße 30, D-48149 Münster, Germany. E-mail: schoenho@uni-muenster.de
cInternational Graduate School for Battery Chemistry, Characterization, Analysis, Recycling and Application (BACCARA), University of Münster, Münster, 48149, Germany
First published on 14th March 2024
Abstract
Highly concentrated battery electrolytes exhibit a low flammability as well as a high thermal and electrochemical stability, and they typically form stable solid electrolyte interphases in contact with electrode materials. The transport properties of these electrolytes in batteries are strongly influenced by correlated movements of the ions. In the case of a binary electrolyte, the transport properties can be described by three Onsager coefficients and a thermodynamic factor. In order to determine these four target quantities, at least four experimental quantities are needed. Overdetermination by measuring five or more experimental quantities is uncommon. Here we have combined electrochemical impedance spectroscopy, electrophoretic NMR measurements and concentration cell measurements for characterizing two highly concentrated sulfolane/LiFSI electrolytes. Two sets of four experimental quantities and one set of five experimental quantities were compared with regard to the uncertainties of the resulting four target quantities. We show that the methods employing only four experimental quantities either lead to large uncertainties of the Onsager coefficients or to large uncertainties of the thermodynamic factor, while only the overdetermination by five experimental quantities leads to acceptable uncertainties of all four target quantities. The results for the Onsager coefficients are discussed with regard to dynamic ion correlations and to transport limitations in battery cells.
Introduction
The standard liquid electrolyte used in lithium-ion batteries is a 1 M solution of LiPF6 in a mixture of organic carbonates. Since the organic carbonate molecules exhibit a high vapor pressure, this electrolyte is flammable and therefore represents a safety risk.1,2 In addition, this type of electrolyte does not form stable interphases in contact with Li metal as a potential anode material and in contact with high-voltage cathode materials, such as LiNi0.5Mn1.5O4.3,4 Consequently, these limitations motivate a high interest in searching for alternative electrolytes that are suitable for batteries with improved energy density. A promising approach are highly concentrated electrolytes (HCE) with salt concentrations up to 5–6 M.5 In HCEs, virtually all solvent molecules are involved in the solvation of ions such that virtually no free solvent molecules exist.5 This leads to a low chemical potential of the solvent molecules, implying a low vapor pressure, a strongly reduced flammability and an improved oxidation/reduction stability of the molecules. Furthermore, it has been shown that a number of highly concentrated electrolytes exhibit improved interfacial properties in contact with Li metal (formation of a stable solid electrolyte interphase, suppression of Li dendrite formation)6–9 and in contact with high-voltage cathode materials.10 In particular, a high stability vs. oxidation at cathode materials is given for highly concentrated sulfolane-based electrolytes.11 On the other hand, a high salt concentration leads to a slowing down of the dynamics of ions and solvent molecules, resulting in higher viscosities and lower ionic conductivity compared to the standard battery electrolyte.1,12,13 Due to strong ion–ion and ion–solvent interactions in HCEs, there are dynamic correlations between the movements of distinct ions,5,14,15 which can have a strong impact on charge and mass transport in batteries.14,15The transport properties of a binary Li+ conducting electrolyte (single salt in a single solvent) can be described by three Onsager coefficients σ++, σ−− and σ+− and a thermodynamic factor.15 If additional diffusion coefficients are available, the Onsager coefficients σ++ and σ−− can be further split into a self part and a distinct part.15,16 For a determination of the three Onsager coefficients σ++, σ−− and σ+− and the thermodynamic factor, at least four experimental quantities are required.16,17 It is common to measure exactly four experimental quantities, typically the ionic conductivity, the stationary Li+ current between Li metal electrodes, the salt diffusion coefficient and the open-circuit potential of concentration cells with transference.17 This approach has been applied to various binary electrolytes with lithium salts, such as lithium bis(fluorosulfonyl)imide (LiFSI), lithium bis(tri-fluoromethanesulfonyl)imide (LiTFSI) and LiPF6 in solvents like diglyme (G2), triglyme (G3), tetraglyme (G4) and sulfolane.12,17–19 In the case of LiTFSI/G4-based and LiFSI/G4-based HCEs, the concentration-cell open-circuit measurements were replaced by electrophoretic NMR data.16 In most cases, a detailed analysis of the uncertainties of the obtained Onsager coefficients and of the thermodynamic factor was not carried out. Furthermore, hardly any attempt was made to measure more than four experimental quantities in order to improve the accuracy of the transport parameters.
In this paper, we carry out a detailed analysis of the influence of the choice and number of quantities contained in an experimental data set on the accuracy of the Onsager coefficients and the thermodynamic factor. We take binary sulfolane/LiFSI electrolytes with molar ratios of solvent to salt of 2.4/1 and 3/1, respectively, as model-type electrolytes, and we combine three experimental methods, namely open-circuit potential measurements on concentration cells with transference (CCT), electrophoretic NMR measurements (eNMR) and electrochemical impedance spectroscopy (EIS) for determining five experimental quantities. To compare this approach to the previous ones, we consider three different sets of experimental quantities for determining the Onsager coefficients and thermodynamic factor: (i) a set of four experimental quantities obtained from CCT and EIS,17 in the following referred to as the CCT/EIS approach; (ii) a set of four experimental quantities obtained from eNMR and EIS,16 in the following referred to as the eNMR/EIS approach; and (iii) a set of all five experimental quantities, in the following referred to as the CCT/eNMR/EIS approach; see also scheme in Fig. S1 in ESI.† We show that there are significant differences between the three sets regarding the accuracy of the obtained transport parameters. In particular, the CCT/eNMR/EIS approach with five experimental quantities results in significantly improved accuracies. We discuss the implications for the fundamental understanding of dynamic ion correlations in highly concentrated electrolytes and for charge and mass transport limitations14,20 in battery cells.
Experimental section
Electrolyte preparation
The electrolytes were prepared in an argon-filled glovebox with a water and oxygen content below 1 ppm. Before use, sulfolane (99%, Sigma-Aldrich) (SL) and lithium bis(fluorosulfonyl)imide (>98%, TCI Chemicals) (LiFSI) were dried for 12 h at a pressure less than 10−6 bar. SL was dried at room temperature and LiFSI at 100 °C. The compositions of the electrolytes can be found in Table 1. In Fig. 1, the chemical structure of the molecules is shown.| SL/LiFSI | x SL | x LiFSI | c LiFSI mol l−1 |
|---|---|---|---|
| 2.4/1 | 0.71 | 0.29 | 3.14 |
| 3.0/1 | 0.75 | 0.25 | 2.65 |
The water content of the electrolyte solutions was determined by Karl Fischer titration and was found to be below 70 ppm.
Total ionic conductivity
To determine the total ionic conductivity σion of a sample electrolyte, a TSC 70 closed cell (rhd instruments, Darmstadt, Germany) was used. Impedance measurements were carried out at 30 °C in a frequency range from 105 Hz to 1 Hz using an Alpha-A impedance analyzer (Novocontrol Technologies, Montabaur, Germany) equipped with a ZG2 interface. The cell constant k of the TSC 70 closed cell was determined by means of a 0.1 M KCl standard solution. The obtained impedance spectra were fitted using the software RelaxIS (rhd instruments, Darmstadt, Germany) in order to determine the ionic resistance Rion. The ionic conductivity of the sample electrolyte was then calculated as σion = k/Rion.Very-low-frequency impedance spectroscopy on symmetric cells Li|electrolyte|Li
Very-low-frequency impedance measurements were carried out on a symmetric cell Li|electrolyte|Li as described in ref. 21. The cell was assembled in an argon-filled glovebox and then removed from the glovebox. The interfacial resistance between the Li electrodes and the electrolyte was determined every single hour from impedance measurements in a frequency range from 106 to 0.1 Hz at a temperature of 30 °C. For the impedance measurements, an Alpha-A impedance analyzer (Novocontrol Technologies) equipped with a ZG2 interface was used. As soon as the temporal change of the interfacial resistance dropped below 1 Ω h−1, the interface was considered as stable, and a very-low-frequency impedance spectroscopy measurement in a frequency range from 106 Hz to 10−4 Hz was carried out at 30 °C with an applied AC voltage of 2 mVrms. Subsequently, the distance between the Li electrodes was altered, and the entire procedure was repeated. The obtained impedance spectra were fitted using the software RelaxIS (rhd instruments, Darmstadt, Germany), and the fitting results were used to determine the Li+ transference number under anion-blocking conditions, , and the salt diffusion coefficient Dsalt.
Concentration cell with transference
Open-circuit measurements were carried out on a concentration cell with transference: Li|sample electrolyte with salt concentration csalt|separator|reference electrolyte with salt concentration cref|Li. First, a cell with Li electrodes, but without electrolytes in the two half-cells, was assembled in an argon-filled glovebox. The glass-fiber separator was soaked with a 1![[thin space (1/6-em)]](https://www.rsc.org/images/entities/char_2009.gif) :
:![[thin space (1/6-em)]](https://www.rsc.org/images/entities/char_2009.gif) 1 (v/v) mixture of the sample electrolyte and the reference electrolyte. After assembly, the cell was removed from the glovebox, inserted into an incubator (Model BD23, Binder GmbH), stabilized at a temperature of 30 °C for 30 min and connected to a Zahner ZENNIUM potentiostat (Zahner-Elektrik, Kronach, Germany). Then the sample electrolyte and the reference electrolyte were inserted into their respective half-cells, and the open-circuit potential was measured by means of the Thales software (Zahner-Elektrik, Kronach, Germany). Data for each concentration were taken at least twice. From the statistical analysis of the results, an uncertainty of 5% in the open-circuit potentials was estimated.
1 (v/v) mixture of the sample electrolyte and the reference electrolyte. After assembly, the cell was removed from the glovebox, inserted into an incubator (Model BD23, Binder GmbH), stabilized at a temperature of 30 °C for 30 min and connected to a Zahner ZENNIUM potentiostat (Zahner-Elektrik, Kronach, Germany). Then the sample electrolyte and the reference electrolyte were inserted into their respective half-cells, and the open-circuit potential was measured by means of the Thales software (Zahner-Elektrik, Kronach, Germany). Data for each concentration were taken at least twice. From the statistical analysis of the results, an uncertainty of 5% in the open-circuit potentials was estimated.
The obtained open-circuit potential Δφ was plotted against the salt concentration of the sample electrolytes csalt, and the slope  was obtained from a linear fit.
Diffusion NMR and electrophoretic NMR
For the NMR measurements, an Avance Neo 400 MHz or an Avance III HD 400 MHz spectrometer (Bruker, Rheinstetten, Germany) with a gradient probe head (Diff BB or Diff 50 with maximum gradient field strength of 17 T m−1 or 28 T m−1, Bruker) was used. A temperature of 30 °C was verified by inserting an NMR tube containing glycol and a PT100 thermocouple (GMH 3750, Greisinger, Regenstauf, Germany) into the spectrometer. Diffusion measurements were performed using a pulsed field gradient stimulated echo (PFGSTE) pulse sequence. In each experiment, the gradient pulse duration δ (1–3 ms) and diffusion time Δ (50–300 ms) were kept constant, while the gradient strength g maximum of 14 T m−1 was incrementally increased reaching a maximum value, which was adjusted for each sample ensuring an adequate echo decay. This allows evaluation of the self-diffusion coefficient D according to eqn (1), where I is the signal intensity.22 | (1) |
Electrophoretic NMR (eNMR) experiments were carried out as reported previously with a self-build electrode holder23 and a 1000 mc pulse generator (P&L Scientific, Sweden). The applied voltage pulses (up to 150 V) were implemented in a double stimulated echo (DSTE) pulse sequence24 and gradually increased with alternating sign, reaching a maximum that was adjusted individually for each sample. Within an experiment, the electrode distance d (2.2 cm), gradient pulse duration, gradient strength and diffusion time were set to constant values. Ion migration leads to a phase shift Φ − Φ0 in the NMR spectrum, which was evaluated by phase-sensitive Lorentzian fits as described earlier.25 Then the mobility μ was calculated from the slope of a linear fit of Φ − Φ0 against U according to eqn (2).
 | (2) |
For each sample, a minimum of three repeated fillings of the eNMR electrode holder were prepared from at least two sample preparations, and the mobilities were averaged. The error was estimated as 5% plus additional statistical and fitting errors.
Determination of the Onsager coefficients and the thermodynamic factor
In the following, the experimental quantities are denoted by mi, while the target values are denoted by zi with z1 = σ++/σion, z2 = σ−−/σion, z3 = σ+−/σion and z4 being the thermodynamic factor Φ = d![[thin space (1/6-em)]](https://www.rsc.org/images/entities/char_2009.gif) ln
ln![[thin space (1/6-em)]](https://www.rsc.org/images/entities/char_2009.gif) a±/d
a±/d![[thin space (1/6-em)]](https://www.rsc.org/images/entities/char_2009.gif) ln
ln![[thin space (1/6-em)]](https://www.rsc.org/images/entities/char_2009.gif) csalt. Here, a± and csalt denote the mean ion activity and the salt concentration, respectively.
csalt. Here, a± and csalt denote the mean ion activity and the salt concentration, respectively.
In the case of the CCT/EIS approach, the four experimental quantities  , m2 = σion,
  , and m4 = Dsalt were used to calculate the target values as described in Dong et al.17 In the case of the eNMR/EIS approach, the four experimental quantities m1 = tμ+, m2 = σion,
  , and m4 = Dsalt were used to calculate the target values as described in Pfeifer et al.16
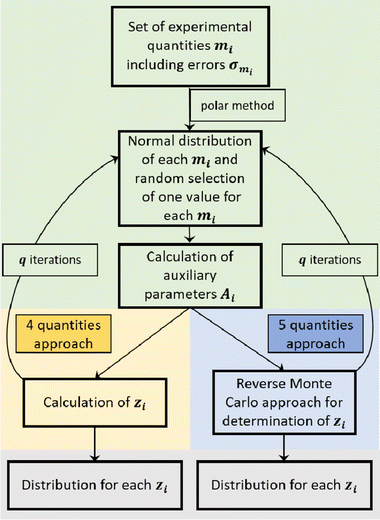
In the case of the CCT/eNMR/EIS approach, a Monte Carlo-based self-scripted software was used for determining the target values from five experimental quantities. An illustration of the software algorithm is shown in Fig. 2. The algorithm can be divided into three parts.
In the case of the 4-quantities approach (highlighted in yellow in Fig. 2), the target values zi were directly calculated from the auxiliary parameters Ai by means of the equations given in Dong et al.17 or directly calculated from the experimental quantities as described by Pfeifer et al.16
In the case of the 5-quantities approach (highlighted in blue in Fig. 2), a Reverse Monte Carlo (RMC) approach was used for determining the target variables. An illustration of the RMC algorithm is given in Fig. S2 in the ESI.†
First, a set of starting values for the target values zi was created; these were chosen to be within the expected range, and the auxiliary parameters Ai,calc were calculated by means of eqn (S6)–(S10) in the ESI.† The set of Ai,calc values was then compared to the set of Ai values created in part 1 from the experimental data by calculating the sum of square errors SSE:
 | (3) |
In this sum, the errors of the respective auxiliary parameter σAi resulting from error propagation were taken into account.
The SSE was now minimized as follows. One target value zi was randomly selected, and a new value zi,new was created by randomly increasing or decreasing zi by a small step size Δzi.
| zi,new = zi ± Δzi | (4) |
The step sizes were chosen as Δz1 = Δz2 = Δz3 = 0.001 and Δz4 = 0.001z4,start with the starting value for the thermodynamic factor z4,start. A new sum of square errors SSEnew was then calculated using the new value zi,new and was compared to the actual SSE value. According to the Metropolis–Hastings algorithm, the change of the target value was accepted with probability min{1, exp(−(SSEnew − SSE))}. If the change was accepted, zi was set to zi,new, and SSE was set to SSEnew. Then, the next target value zi was randomly selected and randomly increased or decreased, until four modifications of randomly chosen target values were performed and a new set of the target values was obtained. This entire procedure was repeated p times with p = 100![[thin space (1/6-em)]](https://www.rsc.org/images/entities/char_2009.gif) 000. For each set of mi values created in part 1, a single set of target values zi with the least SSE was saved.
000. For each set of mi values created in part 1, a single set of target values zi with the least SSE was saved.
Parts 1 and 2 of the algorithm were then repeated with a new set of mi values, and overall q sets of mi values were created with q = 10![[thin space (1/6-em)]](https://www.rsc.org/images/entities/char_2009.gif) 000.
000.
Results and discussion
Diffusion coefficients
Diffusion coefficients serve to separate the Onsager coefficients σii into a self part and a distinct part according to | (5) |
The obtained diffusion coefficients for all constituents, resulting from PFG NMR for the three observed nuclei (1H, 19F, 7Li), can be found in the ESI Fig. S3.† The results for the SL/LiFSI 3/1 compositions are in good agreement with the literature.27 In both investigated compositions with x = 2.4 and x = 3, Li+ is the fastest diffusing species, while the SL and FSI− have similar diffusion coefficients. As expected, the diffusion coefficient decreases with increasing salt concentration due to an increase of Coulomb interactions. Furthermore, the diffusion coefficients were used to calculate the self-part σself of the Onsager coefficients according to eqn (6).
 | (6) |
Results for the self part of the Onsager coefficients are shown in Table 3.
Electrophoretic NMR (eNMR)
Electrophoretic mobilities of all three constituents, even of the uncharged SL molecules, were determined by eNMR. Representative phase shift data, from which the mobility was calculated can be found in the ESI Fig. S4.† The resulting mobilities (Table 2 and Fig. 3a) were further used to calculate an ionic conductivity σeNMR, which is in good agreement with results obtained from impedance spectroscopy; see ESI Fig. S5 and eqn (S11)† and accompanying description.| SL/LiFSI | μ Li+/m2 (V s)−1 | μ A−/m2 (V s)−1 | μ SL/m2 (V s)−1 |
|---|---|---|---|
| 2.4/1 | (3.82 ± 0.5) × 10−10 | (−1.93 ± 0.03) × 10−10 | (6.56 ± 1.63) × 10−11 |
| 3.0/1 | (4.70 ± 0.8) × 10−10 | (−3.69 ± 0.5) × 10−10 | (6.10 ± 4.16) × 10−11 |
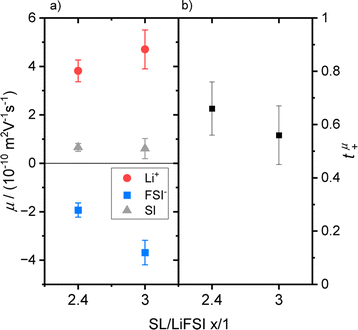 | ||
| Fig. 3 (a) Mobility data of SL/LiFSI = x/1 with x = 2.4 and 3 for Li+ (red dots), FSI− (blue squares) and SL (grey triangles) and (b) the resulting Li+ transference numbers t+μ. | ||
Comparable trends can be observed for both electrolytes, see Fig. 3a, as Li+ reaches the highest mobility drifting towards the negative electrode, while the FSI− anions migrate in the opposite direction. Similar to the trends of the diffusion coefficients, a higher concentration leads to lower mobility values due to the increase in Coulomb interactions.
Interestingly, a slightly positive mobility can be found for the neutral SL molecules, which can be explained by the following consideration. It is important to note that electrophoretic mobilities are determined in the laboratory reference frame, which is a consequence of the determination of the molecular displacement by the fixed gradient coils. It has only recently been realized that this reference frame is identical to a volume-fixed frame, where the net volume flux is zero.28,29 This feature is connected to the incompressibility of the electrolyte, implying that the volume fluxes of all constituents under the electric field must compensate. Indeed, the validity of this conservation law can be verified for the SL/LiFSI x/1 electrolytes by calculating the net molar volume flux Jv (see ESI Fig. S6 and eqn (S12)† and accompanying description). The positive mobility of SL may thus result from such a compensating volume flux.
The transference number ti is defined as the partial conductivity of a constituent i in relation to the total conductivity. By using the electrophoretic mobilities μi, the charge numbers zi and the number densities Ni, a mobility-based transference number can be calculated as:
 | (7) |
The number densities Ni are calculated from mass density measurements, which can be found in the ESI, Table S1† and description. The resulting tμ+ value (see Table 3 and Fig. 3b) might be slightly larger for the higher concentration, but in view of the error range, both numbers are very similar.
We note that, while the total conductivity is invariant of the choice of reference frame, the partial conductivities, and thus the transference numbers, are not. tμ+ is given in the volume-centered reference frame, while other methods yield potentially different results. For example, concentrated solution theory delivers t in a solvent-fixed frame. Discussions of the issue of reference frames and corresponding transformations of transference numbers have been elaborated elsewhere.29,30
Electrochemical impedance spectroscopy (EIS)
The ionic conductivity σion of the two sulfolane/LiFSI electrolytes at 30 °C is given in Table 4. σion decreases with increasing salt concentration.| SL/LiFSI | σ ion/mS cm−1 | t abc+ | D salt/m2 s−1 |
|---|---|---|---|
| 2.4/1 | 1.56 ± 0.13 | 0.227 ± 0.02 | (1.16 ± 0.2) × 10−11 |
| 3.0/1 | 1.94 ± 0.04 | 0.289 ± 0.02 | (3.15 ± 0.9) × 10−11 |
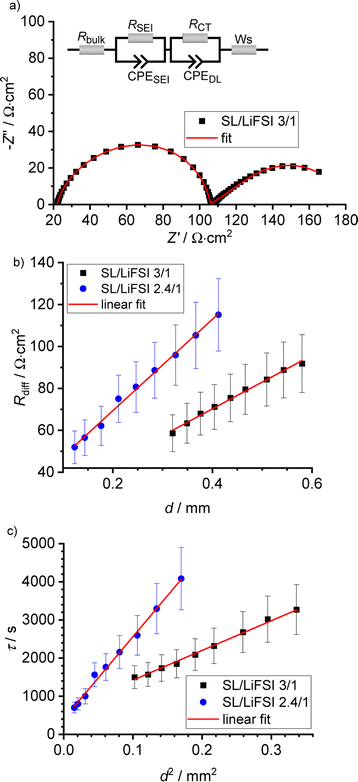
In Fig. 4a, a very-low-frequency impedance spectrum for the sulfolane/LiFSI 3/1 electrolyte at an electrode distance of 0.429 mm is shown. The spectrum was fitted by an equivalent circuit, also shown in Fig. 4a.16 The bulk ionic resistance of the electrolyte is connected in series to two R-CPE elements (resistor parallel to constant-phase element), which account for the solid electrolyte interphase (SEI) impedance and for the charge-transfer resistance/double-layer capacitance at the Li|electrolyte interface. The Warburg-short element connected in series is given by:
 | (8) |
 in Fig. 4b, the lithium transference number under anion-blocking conditions,
  , is given by:16,21
 | (9) |
 | (10) |
The results obtained from the VLF experiments are summarized in Table 4. Both  and Dsalt decrease with increasing salt concentration.
Concentration cells with transference (CCT)
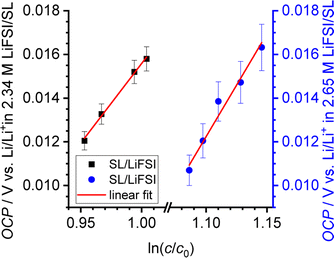
In Fig. 5, we plot the open-circuit potential (OCP) of the concentrations cells versus ln(csalt). Linear fits of the data were used to determine the slopes , which are listed in Table 5.
Calculation of Onsager coefficients and thermodynamic factor
Fig. 6 shows the distributions of the Onsager coefficients, all normalized by the ionic conductivity σion, and of the thermodynamic factor (TF), as obtained from the self-scripted software for the SL/LiFSI 3/1 system. The CCT/EIS approach leads to large uncertainties for the Onsager coefficients, as seen by the very broad distributions in blue color. Due to these large uncertainties, it is even uncertain whether the mobility of the cations, which is proportional to σ++ − σ+−,16 or the mobility of the anions, which is proportional to σ−− − σ+−,16 is higher. Furthermore, the sign of σ+− is also uncertain. The uncertainty of the thermodynamic factor (TF) is relatively small; however, values of the TF around and below unity do not seem to be physically meaningful. At high salt concentrations close to the solubility limit of the salt, the thermodynamic factor is expected to be significantly larger than unity.31–33 | ||
| Fig. 6 Calculated distributions of the normalized Onsager coefficients (a) σ++/σion, (b) σ−−/σion, (c) σ+−/σion and (d) of the thermodynamic factor for the SL/LiFSI 3/1 electrolyte. | ||
The eNMR/EIS approach leads to much lower uncertainties of the Onsager coefficients, see the red distributions in Fig. 6. The higher value of σ++/σion as compared to σ−−/σion reflects the mobility-based transference number t+μ > 0.5 obtained from eNMR.
The eNMR/EIS approach clearly leads to negative values for the Onsager cross coefficient σ+−, pointing to anticorrelated movements of cations and anion.16 We conclude that the information obtained from eNMR is of higher relevance for the accurate determination of the Onsager coefficients than the information from CCT. On the other hand, the eNMR/EIS approach leads to large uncertainties for the TF. The reason is that in the underlying equations of the eNMR/EIS approach, the TF appears only in a single equation, namely the equation for the salt diffusion coefficient Dsalt, while in the CCT/EIS approach, the TF appears in addition in the expression for the slope  .
.
The combined CCT/eNMR/EIS approach yields similar values and uncertainties for the Onsager coefficients to the eNMR/EIS approach, but significantly smaller uncertainties for the TF. This demonstrates that only the overdetermination of four target values by five experimental quantities leads to low uncertainties of all four target values. All values and uncertainties are listed in Table 6. A similar picture with large uncertainties in the results of the four-quantity approaches is evident for the SL/LiFSI 2.4/1 electrolyte; see Fig. S7† and resulting quantities in Table 7.
| SL/LiFSI 3/1 | σ ++/σion | σ −−/σion | σ +−/σion | TF |
|---|---|---|---|---|
| CCT/eNMR/EIS 5 exp. quantities | (0.39 ± 0.02) | (0.28 ± 0.02) | (−0.16 ± 0.02) | (3.7 ± 0.8) |
| eNMR/EIS 4 exp. quantities | (0.40 ± 0.02) | (0.27 ± 0.02) | (−0.17 ± 0.01) | (10 ± 4) |
| CCT/EIS 4 exp. quantities | (0.33 ± 0.08) | (2 ± 2) | (0 ± 1) | (0.7 ± 0.5) |
| SL/LiFSI 2.4/1 | σ ++/σion | σ −−/σion | σ +−/σion | TF |
|---|---|---|---|---|
| CCT/eNMR/EIS 5 exp. quantities | (0.36 ± 0.06) | (0.26 ± 0.08) | (−0.19 ± 0.02) | (4.3 ± 0.7) |
| eNMR/EIS 4 exp. quantities | (0.4 ± 0.1) | (0.1 ± 0.1) | (−0.190 ± 0.008) | (8 ± 6) |
| CCT/EIS 4 exp. quantities | (0.24 ± 0.03) | (0.8 ± 0.5) | (−0.1 ± 0.20) | (1.8 ± 0.9) |
Concentration dependence of transport coefficients
We continue our discussion with the results from the CCT/eNMR/EIS approach (overdetermination approach). In Fig. 7, the Onsager coefficients normalized to the ionic conductivity σion are plotted versus the salt concentration. In addition, we use the self parts σself+ and σself− obtained from the self-diffusion coefficients of the ions to calculate distinct parts of the Onsager coefficients according to eqn (5). These distinct parts describing cation–cation and anion–anion correlations, respectively,16 were also normalized to the ionic conductivity σion and plotted in Fig. 7. All values are also listed in Table S2 in the ESI.† Both distinct parts are negative, reflecting anticorrelated cation–cation movements and anticorrelated anion–anion movements. While the cation–cation anticorrelations σdistinct++/σion increase with increasing salt concentrations, the anion–anion anticorrelations σdistinct−−/σion are virtually constant. We note that like-ion anticorrelations have also been found for tetraglyme-based electrolytes.16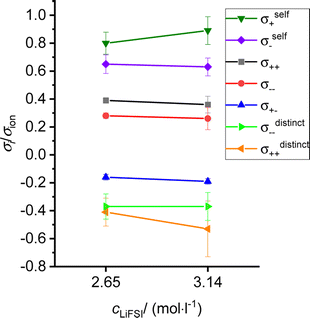 | ||
| Fig. 7 Salt concentration dependence of different transport coefficients, all normalized by the ionic conductivity. | ||
The normalized Onsager cross coefficient σ+−/σion is negative, but less negative than σdistinct++/σion and σdistinct−−/σion, showing that cation–anion anticorrelations are weaker than like-ion anticorrelations. Fig. 7 shows a slight increase of the cation–anion anticorrelations with increasing salt concentration.
Electrolyte classification
As pointed out in ref. 15 and 20, ion correlations in an electrolyte exert an influence on the charge and mass transport properties in lithium-ion batteries. While positive cation–anion correlations slow down charge transport and reduce the ionic conductivity σion, negative cation–anion correlations enhance the ionic conductivity, but slow down neutral salt transport (mass transport) and reduce the salt transport coefficient σsalt.20In Fig. 8, we plot σsaltvs. σion for the two sulfolane/LiFSI electrolytes studied here together with data for other binary electrolytes. Since the Onsager cross coefficient σ+− is negative for both sulfolane/LiFSI electrolytes, the data points of these electrolytes are located below the line for an ideal strong electrolyte. Thus, neutral salt transport is the limiting factor for the application of these electrolytes in batteries. Furthermore, both data points are below the line, at which the Li+ ion transport coefficient under anion-blocking conditions σabc exhibits a value of 1 mS cm−1,20 see yellow/red separating line in Fig. 8. This indicates that the two sulfolane/LiFSI electrolytes are not well suited for high-power batteries.
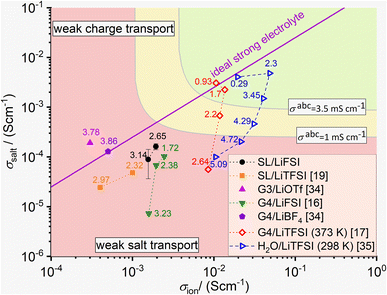 | ||
| Fig. 8 Plot of the salt transport coefficient σsaltvs. the ionic conductivity σion for classifying different electrolytes.16,17,19,34,35 The data points with filled symbols result from experiments at 303 K, while the data points with open symbols result from MD simulations at the given temperature. The straight line in magenta represents an ideal strong electrolyte without any ion correlations. Electrolytes above this line show weak charge transport properties, while electrolytes below this line show weak salt transport properties. Two iso-σabc lines with σabc values of 3.5 mS cm−1 and 1 mS cm−1, respectively, are sketched for assessing the Li+ transport in the electrolyte under anion-blocking conditions in a lithium-ion battery. The numbers next to the data points give the salt concentration of the electrolytes in mol l−1. | ||
Conclusions
We have characterized the transport properties of two highly concentrated sulfolane/LiFSI electrolytes by combining electrochemical impedance spectroscopy, electrophoretic NMR measurements and concentration cell measurements. Two sets of four experimental quantities and one set of five experimental quantities were compared with regard to the uncertainties of four target quantities, namely three Onsager coefficients and a thermodynamic factor. To this end, we used a self-scripted Monte Carlo-based software. It was shown that the two alternative sets of four experimental quantities lead either to large uncertainties of the Onsager coefficients or to large uncertainties of the thermodynamic factor. In contrast, the overdetermination of the four target quantities by five experimental quantities leads to acceptable uncertainties of all four target values. The obtained Onsager coefficients were combined with NMR-based self-diffusion coefficients of cations and anions in order to split the Onsager coefficients σ++ and σ−− into their self and distinct parts. The negative sign of the distinct parts for both electrolytes proves cation–cation anticorrelations as well as anion–anion anticorrelations. The negative sign of the Onsager cross coefficient σ± for both electrolytes implies fast charge transport, but weak salt transport properties in a battery.Conflicts of interest
There are no conflicts to declare.Acknowledgements
We would like to thank the German Science Foundation (DFG) for financial support of this work under the project numbers 504905154 (Ro1213/19-1; Scho636/8-1). Maleen Middendorf is supported by the International Graduate School for Battery Chemistry, Characterization, Analysis, Recycling and Application (BACCARA), which is funded by the Ministry for Culture and Science of North Rhine Westphalia, Germany.References
- J. Zheng, J. A. Lochala, A. Kwok, Z. D. Deng and J. Xiao, Adv. Sci., 2017, 4(8), 1700032 CrossRef.
- A. Mauger and C. M. Julien, Ionics, 2017, 23(8), 1933 CrossRef CAS.
- N. P. W. Pieczonka, Z. Liu, P. Lu, K. L. Olson, J. Moote, B. R. Powell and J.-H. Kim, J. Phys. Chem. C, 2013, 117(31), 15947 CrossRef CAS.
- Q. Ma, X. Zhang, A. Wang, Y. Xia, X. Liu and J. Luo, Adv. Funct. Mater., 2020, 30(32), 2002824 CrossRef CAS.
- O. Borodin, J. Self, K. A. Persson, C. Wang and K. Xu, Joule, 2020, 4(1), 69 CrossRef CAS.
- Y. Jie, X. Ren, R. Cao, W. Cai and S. Jiao, Adv. Funct. Mater., 2020, 30(25), 1910777 CrossRef CAS.
- G. Jiang, F. Li, H. Wang, M. Wu, S. Qi, X. Liu, S. Yang and J. Ma, Small Struct., 2021, 2(5), 2000122 CrossRef CAS.
- T. T. Hagos, B. Thirumalraj, C.-J. Huang, L. H. Abrha, T. M. Hagos, G. B. Berhe, H. K. Bezabh, J. Cherng, S.-F. Chiu, W.-N. Su and B.-J. Hwang, ACS Appl. Mater. Interfaces, 2019, 11(10), 9955 CrossRef CAS PubMed.
- T. Li, X.-Q. Zhang, N. Yao, Y.-X. Yao, L.-P. Hou, X. Chen, M.-Y. Zhou, J.-Q. Huang and Q. Zhang, Angew. Chem., Int. Ed. Engl., 2021, 60(42), 22683 CrossRef CAS.
- X. Fan, L. Chen, X. Ji, T. Deng, S. Hou, J. Chen, J. Zheng, F. Wang, J. Jiang, K. Xu and C. Wang, Chem, 2018, 4(1), 174 CAS.
- J. Alvarado, M. A. Schroeder, M. Zhang, O. Borodin, E. Gobrogge, M. Olguin, M. S. Ding, M. Gobet, S. Greenbaum, Y. S. Meng and K. Xu, Mater. Today, 2018, 21(4), 341 CrossRef CAS.
- J. S. Ho, O. A. Borodin, M. S. Ding, L. Ma, M. A. Schroeder, G. R. Pastel and K. Xu, Energy Environ. Mater., 2023, 6(1), e12302 CrossRef CAS.
- A. Lewandowski and A. Świderska-Mocek, J. Power Sources, 2009, 194(2), 601 CrossRef CAS.
- B. Roling, V. Miß and J. Kettner, Energy Environ. Mater., 2024, 7(1), e12533 CrossRef CAS.
- N. M. Vargas-Barbosa and B. Roling, ChemElectroChem, 2020, 7(2), 367 CrossRef CAS.
- S. Pfeifer, F. Ackermann, F. Sälzer, M. Schönhoff and B. Roling, Phys. Chem. Chem. Phys., 2021, 23(1), 628 RSC.
- D. Dong, F. Sälzer, B. Roling and D. Bedrov, Phys. Chem. Chem. Phys., 2018, 20(46), 29174 RSC.
- K. Ueno, K. Yoshida, M. Tsuchiya, N. Tachikawa, K. Dokko and M. Watanabe, J. Phys. Chem. B, 2012, 116(36), 11323 CrossRef CAS.
- K. Shigenobu, K. Dokko, M. Watanabe and K. Ueno, Phys. Chem. Chem. Phys., 2020, 22(27), 15214 RSC.
- B. Roling, J. Kettner and V. Miß, Energy Environ. Mater., 2022, 5(1), 6 CrossRef CAS.
- F. Wohde, M. Balabajew and B. Roling, J. Electrochem. Soc., 2016, 163(5), A714–A721 CrossRef CAS.
- E. O. Stejskal and J. E. Tanner, J. Chem. Phys., 1965, 42(1), 288 CrossRef CAS.
- M. Gouverneur, J. Kopp, L. van Wüllen and M. Schönhoff, Phys. Chem. Chem. Phys., 2015, 17(45), 30680 RSC.
- M. Bielejewski, M. Giesecke and I. Furó, J. Magn. Reson., 2014, 243, 17 CrossRef CAS.
- F. Schmidt, A. Pugliese, C. C. Santini, F. Castiglione and M. Schönhoff, Magn. Reson. Chem., 2020, 58(3), 271 CrossRef CAS PubMed.
- G. Marsaglia and T. A. Bray, SIAM Rev., 1964, 6(3), 260 CrossRef.
- K. Dokko, D. Watanabe, Y. Ugata, M. L. Thomas, S. Tsuzuki, W. Shinoda, K. Hashimoto, K. Ueno, Y. Umebayashi and M. Watanabe, J. Phys. Chem. B, 2018, 122(47), 10736 CrossRef CAS PubMed.
- M. Lorenz, F. Kilchert, P. Nürnberg, M. Schammer, A. Latz, B. Horstmann and M. Schönhoff, J. Phys. Chem. Lett., 2022, 13(37), 8761 CrossRef CAS PubMed.
- F. Kilchert, M. Lorenz, M. Schammer, P. Nürnberg, M. Schönhoff, A. Latz and B. Horstmann, Phys. Chem. Chem. Phys., 2023, 25(38), 25965 RSC.
- Y. Shao, H. Gudla, D. Brandell and C. Zhang, J. Am. Chem. Soc., 2022, 144(17), 7583 CrossRef CAS PubMed.
- M. Farkhondeh, M. Pritzker, M. Fowler and C. Delacourt, Electrochem. Commun., 2016, 67, 11 CrossRef CAS.
- M. Farkhondeh, M. Pritzker, C. Delacourt, S. S.-W. Liu and M. Fowler, J. Phys. Chem. C, 2017, 121(8), 4112 CrossRef CAS.
- D. B. Shah, H. K. Kim, H. Q. Nguyen, V. Srinivasan and N. P. Balsara, J. Phys. Chem. C, 2019, 123(39), 23872 CrossRef CAS.
- K. Shigenobu, M. Shibata, K. Dokko, M. Watanabe, K. Fujii and K. Ueno, Phys. Chem. Chem. Phys., 2021, 23(4), 2622 RSC.
- Z. Li, R. Bouchal, T. Mendez-Morales, A.-L. Rollet, C. Rizzi, S. Le Vot, F. Favier, B. Rotenberg, O. Borodin, O. Fontaine and M. Salanne, J. Phys. Chem. B, 2019, 123(49), 10514 CrossRef CAS.
Footnote |
| † Electronic supplementary information (ESI) available. See DOI: https://doi.org/10.1039/d4fd00034j |
| This journal is © The Royal Society of Chemistry 2024 |


