 Open Access Article
Creative Commons Attribution 3.0 Unported Licence
Room-temperature stacking disorder in layered covalent-organic frameworks from machine-learning force fields†
Ju
Huang
 a,
Seung-Jae
Shin
b,
Kasper
Tolborg
 a,
Alex M.
Ganose
 c,
Gabriel
Krenzer
 a and
Aron
Walsh
 *ad
*ad
aDepartment of Materials, Imperial College London, London SW7 2AZ, UK. E-mail: a.walsh@imperial.ac.uk
bDepartment of Materials Science and Engineering, Yonsei University, Seoul 03722, Republic of Korea
cDepartment of Chemistry, Imperial College London, London W12 0BZ, UK
dDepartment of Physics, Ewha Womans University, Seoul 03760, Korea
First published on 1st May 2023
Abstract
The local structures of layered covalent-organic frameworks (COFs) deviate from the average crystal structures assigned from X-ray diffraction experiments. For two prototype COFs of Tp-Azo and DAAQ-TFP, density functional theory calculations have shown that the eclipsed structure is not an energy minimum and that the internal energy is lowered for an inclined stacking arrangement. Here we explore the structural disorder of these frameworks at 300 K through molecular dynamics (MD) simulations using an on-the-fly machine learning force field (MLFF). We find that an initially eclipsed stacking mode spontaneously distorts to form a zigzag configuration that lowers the free energy of the crystal. The simulated diffraction patterns show good agreement with experimental observations. The dynamic disorder from the MLFF MD trajectories is found to persist in mesoscale MD simulations of 155 thousand atoms, giving further confidence in our conclusions. Our simulations show that the stacking behaviour of layered COFs is more complicated than previously understood.
New conceptsCovalent organic frameworks (COFs) are materials formed from rigid organic building blocks that connect in two or three dimensions. They are often heralded for their ordered nature and high crystallinity, especially in comparison to traditional organic polymers with strong connections in only one dimension. However, there is growing evidence from crystallographic and spectroscopic probes, as well as from materials modelling, that these frameworks contains high amounts of disorder. In particular, an eclipsed configuration is often assumed for layered COFs for applications ranging from gas storage to batteries. The structure is however a saddle point on the potential energy surface. The energy of the system is lowered when adjacent layers are displaced. Our study probes this phenomenon using a multi-technique approach with a room temperature description provided by a machine-learning force field that has been actively learned from density functional theory energies, forces, and stresses. We show how the local structure distorts in time and gives rise to the average features that can be seen in slow experimental probes. Hidden stacking disorder is likely a common feature across many families of layered COFs and metal–organic frameworks. |
1. Introduction
Covalent-organic frameworks (COFs) are a class of porous organic materials synthesized from secondary building units through reticular chemistry.1,2 COFs are a rich materials platform and have gained attention due to their compositional modularity, structural diversity, pore size tunability, and chemical stability.3–5 Despite these advantages, experimental and computational studies have reported the presence of various types of defects and disorder within COF structures, which can influence their crystallinity, stability, porosity, and conductivity.6–14 One example is stacking disorder, in which layers of a COF with two-dimensional (2D) connectivity are offset at different amounts relative to adjacent layers. Recent evidence for stacking disorder comes from athermal density functional theory (DFT) calculations, which revealed a variety of stacking modes can exist in contrast to eclipsed stacking (i.e. zero layer offset) typically reported in experiments.6,8,13,15 However, the stacking behaviour obtained from DFT simulations is inherently static in nature and limited by the small system size that can be studied. As a result, prior models may not be representative of the true stacking behaviour of layered COFs at ambient temperature.The stacking disorder in COFs is challenging to probe experimentally due to the averaging effect of time and space from various probes. In 2011, Lukose et al.16 used DFT calculations and X-ray diffraction (XRD) to investigate the formation of four different stacking sequences (eclipsed, zigzag, serrated and inclined) in a set of reported and hypothetical 2D COFs and found that these stackings exhibit different diffraction patterns and band gaps. In 2017, Fan et al.17 confirmed that SIOC-COF-8 and SIOC-COF-9 stack in an inclined arrangement using a combination of powder XRD, pore-size distribution analysis, and transmission electron microscopy (TEM) analysis. In 2022, Kang et al.11 used 13C solid-state nuclear magnetic resonance (ssNMR) to study the chemical environment of atoms in adjacent layers of 2D COFs and reported that different stacking modes can be quantitatively characterized by the split signals of the methoxy/methyl side groups. In the same year, Natraj et al.10 employed continuous rotation electron diffraction and XRD to demonstrate that TAPPy-PDA and TAPB-DMPDA COFs are disordered along the stacking c direction while remaining ordered within the ab plane.
COFs can be viewed as organic macromolecules with typically more than 100 atoms in the crystallographic unit cell. Thus, it is unfeasible to study their dynamics and disorder over long time and length scales using ab initio molecular dynamics (MD) simulations. As an alternative, more efficient but generally less accurate simulation methods, such as Grand Canonical Monte Carlo (GCMC)12,18 and classical MD simulations,13,19,20 have been applied to study COFs and related metal–organic frameworks (MOFs).21–23 For classical MD simulations, force fields with fixed functional forms are required to describe the interatomic forces. Popular force fields such as OPLS24,25 and DREIDING12,26–29 have been used to study the dynamics of COFs. However, the accuracy depends strongly on the particular force field parameterization and its ability to describe the local structure and extended interactions.
An alternative approach to obtain near DFT accuracy for dynamic simulations at a lower computational cost is machine learning force fields (MLFFs).28,30–36 MLFFs trained on DFT data have demonstrated high efficiency and accuracy in predicting atomic energies and forces.32,34,37 On-the-fly learning is an efficient method for force field training. It constructs a DFT reference database by sampling an MD trajectory for structures with high predicted uncertainty.31 This approach means that during the MD simulation, only a fraction of the force evaluations are performed using DFT, with the rest provided by the MLFF. This state-of-the-art method has been used to study the dynamical properties of many materials, including the melting points of Al, Si, Ge, Sn and MgO,31 the phase transitions of hybrid perovskites,38 and the thermal conductivity of zirconia.39 These previous studies indicate the potential of applying MLFFs to understand the dynamics of structurally and compositionally complex materials such as COFs.
In this work, on-the-fly MLFF models are trained for the prototype COFs, Tp-Azo40,41 and DAAQ-TFP42 (Fig. S1, ESI†), which have exhibited high energy storage performance as battery electrodes. We find COF structures that are initialized in an eclipsed stacking arrangement spontaneously shift to a zigzag stacking mode during MLFF-MD simulations. In contrast, the inclined structures retain their stacking throughout, suggesting that both zigzag and inclined stacking are locally stable arrangements. Using classical force fields to simulate longer time and length scales, similar, but more diverse, stacking properties are observed. These different stacking sequences in COFs lead to different radial distribution functions (RDF) and predicted XRD patterns, and we show that a zigzag motif is in best agreement with experimental observations.
2. Computational methods
Kohn–Sham DFT is a powerful tool for calculating atomic energies and forces from first principles. However, its computational cost generally limits its applicability to relatively small systems and short-range time scales. We employ MLFFs to model the dynamics of two COFs at room temperature for intermediate system sizes. The results obtained from the MLFF were compared to those obtained from a classical force field for large-scale simulations.2.1 Crystal structure optimisation
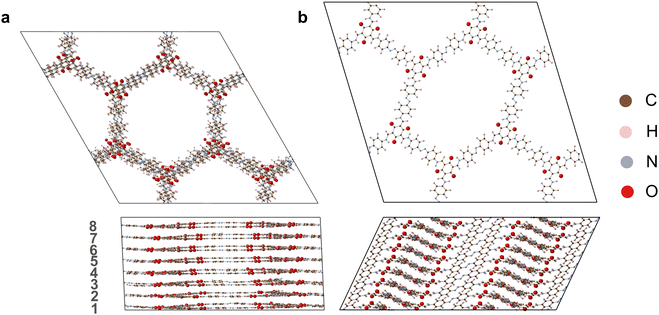
The starting crystal structures for Tp-Azo41 and DAAQ-TFP42 COFs were taken from our previous DFT study,15 in which the structures were relaxed from experimental reports. To further optimize the structures and determine the lattice parameters, we employed the projector augmented wave (PAW) formalism43 within the VASP43,44 code. The Perdew–Burke–Ernzerhof (PBE)45 exchange–correlation functional was used in conjunction with the Tkatchenko–Scheffler method incorporating iterative Hirshfeld partitioning for the treatment of interlayer van der Waals (vdWs) interactions.46 Wave functions were expanded in a plane-wave basis with an energy cutoff of 520 eV. Gaussian broadening with a width of 0.01 eV was employed to set the electronic occupations. At each ionic step of the DFT calculation, the total energy was converged to within 10−6 eV. These parameters were used consistently throughout the study. The optimised eclipsed and inclined Tp-Azo and DAAQ-TFP structures and their lattice parameters are shown in Fig. 1 and Table S1 (ESI†).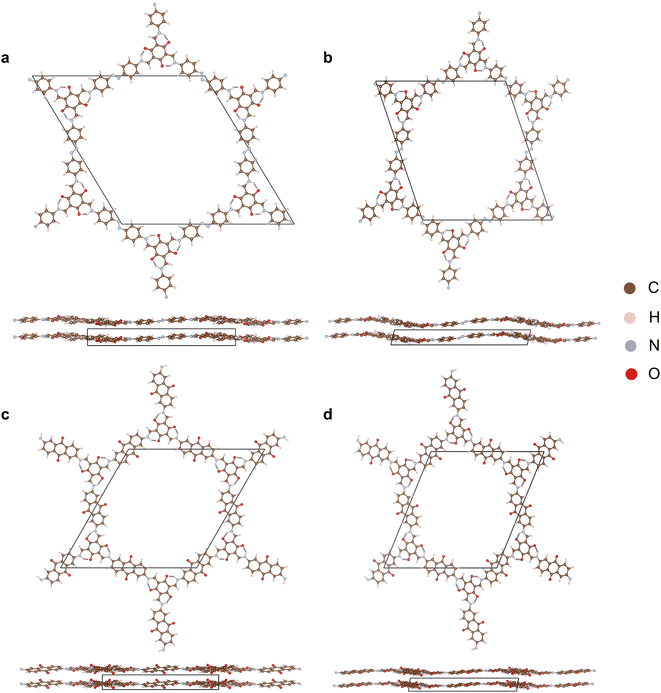 | ||
| Fig. 1 Crystal structures of (a) eclipsed Tp-Azo, (b) inclined Tp-Azo, (c) eclipsed DAAQ-TFP, (d) inclined DAAQ-TFP viewed along the c direction (top) and ab plane (bottom). | ||
2.2 Machine-learning force field
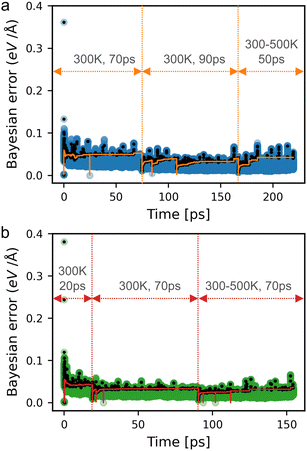
Following the geometry optimization, 1 × 1 × 2 supercells (containing 216 atoms) were used to generate the MLFF datasets for eclipsed and inclined Tp-Azo and DAAQ-TFP. The isothermal–isobaric (NpT) ensemble with the Langevin thermostat47 and a time step of 0.5 fs was used during the training process. We employed the on-the-fly MLFF generation scheme implemented in VASP,31,48 which uses Gaussian approximation potentials (GAP) with the Smooth Overlap of Atomic Positions (SOAP) approach for structural features.49 Radial and angular cutoffs of 7 Å and 5 Å were used to describe the local environments. Other parameters of the on-the-fly MLFF scheme were kept at their default settings. These settings were consistently applied throughout the MLFF study.Initially, we trained the force field from the equilibrium ground state structure at 300 K. Next, we trained the model on a gradual heating run from 300 K to 500 K starting from the equilibrium structure to probe a more diverse region of the potential energy surface. The time for each training is shown in Fig. 3 for Tp-Azo and Fig. S2 (ESI†) for DAAQ-TFP. The temperature was kept below the degradation temperature of the COFs but high enough to widely sample the potential energy surface.1,50 In total, the MLFF was trained for more than 150 ps, including several restarts in each training run as shown in Fig. 3 and Fig. S2 (ESI†).
The trained force fields were validated using a test set of 500 structures, each consisting of a 1 × 1 × 2 supercell of each stacking mode for the two COFs. These structures were randomly sampled from 10 MD trajectories, each generated with a different random seed. Each MD trajectory was obtained within an NpT ensemble at 300 K for 50 ps, utilizing the generated MLFF. The energies, forces and stresses for these 500 structures were subsequently calculated using DFT and compared with those obtained from the MLFF, in order to investigate the accuracy of the trained force field. Large errors in the validation process indicate the training should be continued.
To study the dynamic behaviour of large COFs under ambient pressure at 300 K, validated force fields were applied to 2 × 2 × 8 supercells containing 3456 atoms using an NpT ensemble. The expansion of supercell along the stacking axis is to enable the description of short to medium-range fluctuations. The simulation process involved the use of separately trained force fields for each stacking mode of each COF, with production runs lasting over 100 ps with a time step of 0.5 fs.
To analyze the disorder present in the COFs, the structures from the MD trajectory were analyzed for interlayer offsets. The overall process described above is illustrated in Fig. 2.
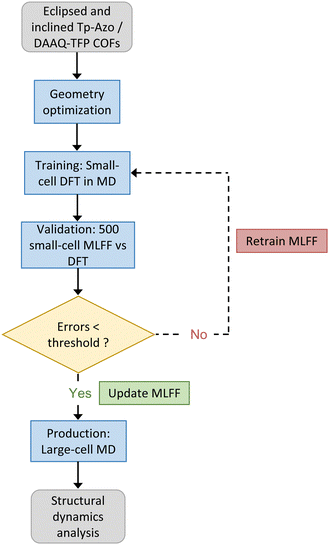 | ||
| Fig. 2 The computational workflow used for on-the-fly MLFF training, validation, and production runs for the Tp-Azo and DAAQ-TFP COFs studied in this work. | ||
2.3 Classical force field
Classical force field-based MD simulations were carried out using the large-scale atomic/molecular massively parallel simulator (LAMMPS) code.51 The OPLS-AA force field was chosen for its general applicability in predicting the structure of organic molecules.25 A supercell (containing 155
![[thin space (1/6-em)]](https://www.rsc.org/images/entities/char_2009.gif) 520 atoms) was utilized for both the eclipsed and inclined configurations. We performed MD simulations with the NpT ensemble at 300 K and 1 atm using the Nosé–Hoover thermostat52 and barostat.53 The simulations were run for 300 ps with the last 100 ps used for sampling and analysis after allowing for equilibration. The initial structures for each configuration were constructed based on the DFT-optimized structures presented in Fig. 1.
520 atoms) was utilized for both the eclipsed and inclined configurations. We performed MD simulations with the NpT ensemble at 300 K and 1 atm using the Nosé–Hoover thermostat52 and barostat.53 The simulations were run for 300 ps with the last 100 ps used for sampling and analysis after allowing for equilibration. The initial structures for each configuration were constructed based on the DFT-optimized structures presented in Fig. 1.
3. Results and discussion
3.1 MLFF molecular dynamics
The number of DFT calculations performed during on-the-fly training, along with the root-mean-squared error (RMSE) in the energies per atom, forces and stresses are summarized in Table 1. Fig. 3 illustrates the Bayesian errors, the structures that were sampled with DFT, and the force error threshold during the training process for eclipsed (a) and inclined (b) Tp-Azo. The Bayesian errors in the training of eclipsed and inclined DAAQ-TFP are provided in Fig. S2 (ESI†).| Energy (meV atom−1) | Force (eV Å−1) | Stress (kbar) | |||||
|---|---|---|---|---|---|---|---|
| System | # DFT calcs | Training | Validation | Training | Validation | Training | Validation |
| E-Tp-Azo | 1213 | 0.58 | 0.55 | 0.080 | 0.079 | 0.38 | 0.38 |
| I-Tp-Azo | 1221 | 0.52 | 0.66 | 0.076 | 0.077 | 0.30 | 0.30 |
| E-DAAQ-TFP | 1181 | 0.41 | 0.42 | 0.082 | 0.084 | 0.39 | 0.44 |
| I-DAAQ-TFP | 1243 | 0.41 | 0.56 | 0.082 | 0.080 | 0.38 | 0.40 |
During the training process, over 99% of force evaluations were performed using the MLFF rather than expensive DFT calculations, saving a significant portion of computational time. The final models show small RMSEs in the predicted energy (0.41–0.58 meV per atom), force (0.076–0.082 eV Å−1), and stress (0.30–0.39 kbar). Furthermore, the maximum Bayesian errors during training remain low and stable as illustrated in Fig. 3 and Fig. S2 (ESI†). These errors are similar to other studies that have utilized MLFFs for MD.31,38,48
We validated the trained force fields to demonstrate their performance. Energies, forces, and stresses calculated from the MLFFs and DFT for the eclipsed and inclined validation structures are shown in Fig. S3 and S4 (ESI†). The RMSE of energy (0.42–0.66 meV per atom), force (0.077–0.084 eV Å−1), and stress (0.30–0.44 kbar) of the validation dataset, as presented in Table 1, are almost the same as the RMSEs observed during the training. These results indicate that the force fields have been trained to sufficient accuracy.
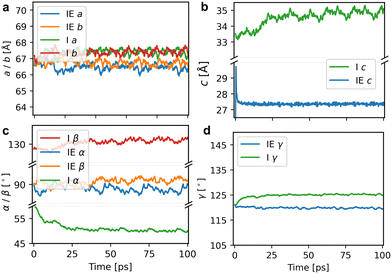
To investigate the stacking behaviour of the COFs, we performed production calculations in a 2 × 2 × 8 supercell (containing 3456 atoms). Calculations were performed with the NpT ensemble at 300 K for a total of 100 ps and a time step of 0.5 fs. MLFF-MD runs were performed for the eclipsed and inclined structures of both COFs. The Bayesian errors for the production MD runs remained stable throughout the entire trajectory and are illustrated in Fig. S5 (ESI†). The lattice parameters of the eclipsed and inclined Tp-Azo structures during the production runs are presented in Fig. 4 (Fig. S6, ESI† gives the results for DAAQ-TFP). The cell lengths (a, b, c) and angles (α, β, γ) averaged over the whole trajectory are given in Table 2. We also report the internal energy (E0) of the final structure at the end of the MD run after being relaxed using the MLFF. The average lattice parameters differ slightly from the initial equilibrium starting structures (a and b change less than 0.5%, c expands in the range of 3–6%) as expected due to the inclusion of temperature in the MD run (Table S1, ESI†). Fig. 4 (Tp-Azo) and Fig. S6, ESI† (DAAQ-TFP) reveal the structures are dynamically stable during the trajectories with lattice parameters that remain roughly constant.
| System | ā (Å) |
![[b with combining macron]](https://www.rsc.org/images/entities/i_char_0062_0304.gif) (Å) (Å) |
![[c with combining macron]](https://www.rsc.org/images/entities/i_char_0063_0304.gif) (Å) (Å) |
![[small alpha, Greek, macron]](https://www.rsc.org/images/entities/i_char_e0c2.gif) (°) (°) |
![[small beta, Greek, macron]](https://www.rsc.org/images/entities/i_char_e0c3.gif) (°) (°) |
![[small gamma, Greek, macron]](https://www.rsc.org/images/entities/i_char_e0c4.gif) (°) (°) |
E 0 (eV) | ΔE0 (eV) |
|---|---|---|---|---|---|---|---|---|
| Z-Tp-Azo | 33.24 | 33.35 | 3.42 | 88.59 | 91.15 | 119.81 | −760.36 | — |
| I-Tp-Azo | 33.69 | 33.73 | 4.36 | 50.15 | 131.14 | 125.23 | −760.59 | 0.24 |
| Z-DAAQ-TFP | 30.44 | 30.51 | 3.43 | 90.78 | 92.19 | 59.78 | −787.43 | — |
| I-DAAQ-TFP | 30.34 | 30.52 | 4.09 | 58.83 | 53.44 | 58.40 | −787.55 | 0.11 |
The plots of total internal energy versus time, presented in Fig. S7 (ESI†), demonstrate the excellent stability of the entire MLFF-MD trajectory. The stability of the simulations indicates that both configurations can be considered metastable states, which will be further rationalized in the following section.
A comparison of the internal energy calculated from the relaxation of the final structures in the MD using MLFF also shows that the internal energy of the inclined stacking is lower than that of initially eclipsed COFs that distort to a zigzag structure during the simulation in Table 2. In Tp-Azo, the energy difference between the zigzag and inclined structures is 0.24 eV per unit cell (2.20 meV per atom), while it is 0.11 eV per unit cell (1.04 meV per atom) in DAAQ-TFP. However, the energy difference between the two stacking modes is relatively small suggesting competition between the two arrangements will be present at ambient temperatures.
3.2 Tracking disorder
Our results reveal that the main source of disorder occurs along the c direction of stacking rather than in the ab plane. This is in agreement with continuous rotational electron diffraction experiments, which found that 2D COFs of TAPPy-PDA and TAPB-DMPDA behave as single-crystals in the ab plane but are disordered in the c dimension.10 To demonstrate this point, in Fig. 6 we plot the stacking disorder averaged over the full MD trajectories for initially eclipsed and inclined Tp-Azo (the same analysis is presented in Fig. S11 (ESI†) for DAAQ-TFP). The disorder is quantified by the offset of each layer relative to adjacent layers. The offsets are decomposed into their components along the x, y and z directions and are averaged along the MD trajectories after equilibration (Fig. S9 and S10, ESI†). For the x and y directions, an offset of 0 Å indicates a fully eclipsed structure, whereas a constant positive or negative offset indicates inclined stacking. A constant offset in the z direction indicates a fixed layer separation.
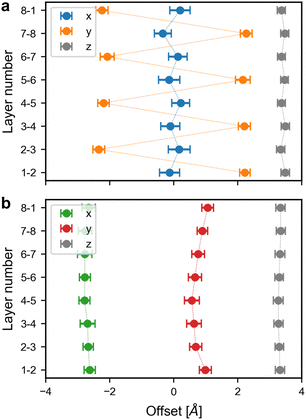 | ||
| Fig. 6 Offsets in the x, y, z directions between adjacent layers in (a) zigzag and (b) inclined Tp-Azo. The layer numbers correspond to the numbers in Fig. 5. | ||
For zigzag Tp-Azo (initially eclipsed pre-equilibration), the average absolute offset for the x, y, and z directions are 0.2 Å, 2.2 Å, and 3.4 Å, respectively. The small values for the x offset (close to zero) indicate adjacent layers are almost perfectly stacked in the x direction. The offsets for the y direction oscillate from ∼−2.2 to ∼2.2 Å, indicating each layer is shifted by an equal but opposite amount relative to adjacent layers. This oscillating offset is a characteristic signature of a zigzag stacking mode. The relatively constant offset in the z direction indicates the layer separation remains roughly fixed throughout the entire MD run. The total absolute displacement in the ab plane is 2.1 Å, highlighting the strong deviation from the idealised eclipsed structure. The eclipsed DAAQ-TFP structure also shifts to a zigzag stacking mode during equilibration. The interlayer offsets show broadly the same features as Tp-Azo, with a relatively large overall displacement distance in the ab plane of 1.8 Å (Fig. S11a, ESI†).
The inclined COF structures retain their inclined stacking throughout the entire MD run. This can be seen in the stacking disorder analysis which reveals a roughly constant negative offset of 2.6–2.8 Å in the x direction and 0.6–1.1 Å in the y direction for Tp-Azo (offsets in DAAQ-TFP are 2.1–2.4 Å and 0.4–0.7 Å in x and y, respectively). The overall offsets in the ab plane are 2.4 Å (Tp-Azo) and 2.5 Å (DAAQ-TFP) (Fig. 6b and Fig. S11b, ESI†). Thus, the overall offsets are marginally larger for inclined stacking than initially eclipsed stacking in both COFs. The inter-layer distances are very similar, around 3.4 Å in each case, independent of the stacking mode (Fig. 6 and Fig. S11, ESI†). The calculated offsets in the ab plane fall in the predicted energy minimum basin from static DFT calculations which span 1.7 Å to 3.5 Å.15
Configurational entropy is a thermodynamic driving force for the observed behaviour. In the ab plane, there are multiple degrees of freedom in the zigzag configuration, but only one in the inclined configuration. As there is only a small difference in the internal energy of zigzag and inclined configurations, an entropic contribution from stacking faults in a zigzag configuration, which is not present in the inclined configuration would be sufficient to change the order of free energies at T = 300 K. Thus, we expect the zigzag mode to be the favoured structure at ambient temperature.
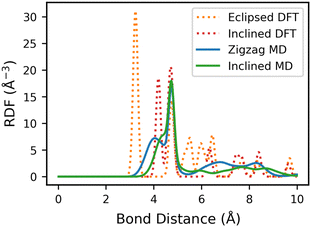
We first calculate the RDF of the eclipsed and inclined structures from static DFT relaxed structure. The O–O RDF of the eclipsed Tp-Azo structure reveals a sharp peak at 3.2 Å, corresponding to the inter-layer distance. In the inclined stacking structure, the peak position is shifted to 4.2 Å due to additional displacement along the ab plane (Fig. 7).15 Comparable results are found for DAAQ-TFP (Fig. S12, ESI†).
We next calculate the average RDF across the MLFF-MD trajectories after the structures are equilibrated. We find that the small-distance sharp peaks are broadened and shifted to larger distances compared to the static DFT RDFs. The shift in the initially eclipsed structures is larger than that of the inclined structures, primarily as the eclipsed structures shifted to a zigzag arrangement during the simulation. There is a qualitative difference in the RDFs of the inclined and zigzag structures, indicating that RDF analysis can be used as a probe for stacking disorder.
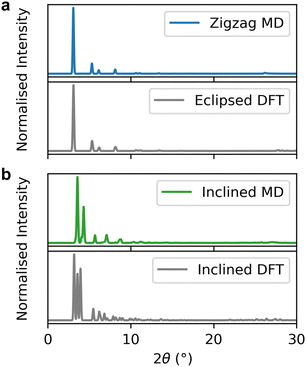
There are significant differences in the simulated XRD patterns of the zigzag and inclined structures (Fig. 8 and Fig. S14, ESI†). The zigzag structure shows a single sharp low-angle diffraction peak, whereas the inclined structure has a split low-angle peak. The peak splitting in the inclined structure is due to the reduced symmetry in slip-stacked structures and is consistent with previous simulated XRD patterns from DFT relaxed COFs.14,56
For both Tp-Azo41 and DAAQ-TFP,42 the simulated XRD of the zigzag structure shows a significantly improved fit with the experimental PXRD pattern compared to the inclined structure. Interestingly, the averaged zigzag XRD pattern and the XRD from the eclipsed static DFT relaxation look similar up to high angles (subtle differences are observed for the (001) reflection peaks in Fig. S13 and S14, ESI†). Many studies have concluded that the stacking of COFs is eclipsed based on good agreement between the PXRD data and the simulated eclipsed diffraction patterns. However, our work demonstrates that comparisons of experimental diffraction patterns with simulated patterns from static DFT are not sufficient to unambiguously assign the stacking mode. Indeed, the instability of the eclipsed stacking in our simulations combined with the good agreement of the zigzag structure with experimental XRD patterns, suggest that previous work may be incorrectly assigning the eclipsed configurations.
3.3 Mesoscopic dynamics
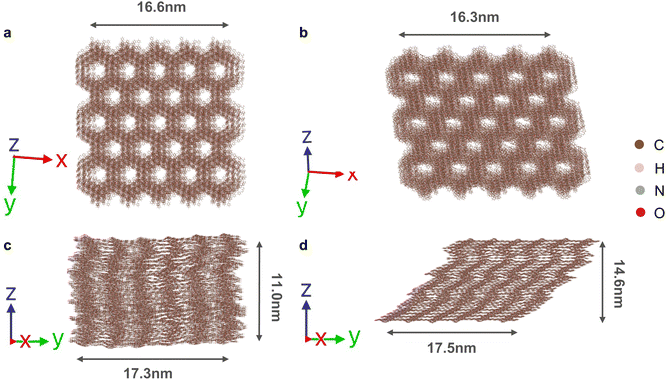
To further investigate the dynamic structures of the COFs on a mesoscopic length scale of over 15 nm, MD simulations using a classical force fields were performed (Fig. 9 and Fig. S16, ESI†). Lower accuracy is expected here as there has been no system-specific tuning of the model parameters; however, the equilibrium structures obtained from the OPLS-AA force field show reasonable agreement with the MLFF (and underlying DFT) values (Table S2 and Fig. S15, ESI†).Again we considered room temperature dynamics starting from the two initial stacking configurations. Qualitatively similar dynamic behaviour is observed. Importantly, the eclipsed COFs spontaneously disorder into the zigzag configuration at equilibrium, while the inclined COFs maintain their stacking mode in these large-scale MD simulations (Fig. 9, Fig. S16 and S17, ESI†). This analysis gives us confidence that our predictions with the MLFF are not limited by finite size-effects in the MD simulations.
4. Conclusions
To investigate the dynamic properties of the layer disorders in 2D COFs, we performed MD simulations of two prototypes of COFs: Tp-Azo and DAAQ-TFP, using on-the-fly MLFFs and the classical OPLS-AA force field. The small Bayesian errors observed in the training and validation of the on-the-fly MLFF indicate the trained force field can be used to accurately describe the dynamics of these systems.In the MLFF-MD simulations, the initially eclipsed configurations shift into a zigzag stacking sequence, while the inclined configurations remain in the inclined mode, showing that both are locally stable states at ambient conditions. However, due to the larger entropic contribution to the zigzag stacking, we expect this to be the favoured structure. The predicted diffraction patterns of the “random” zigzag mode from the MLFF exhibit significantly better agreement with the reported experimental PXRD than the (perfectly) eclipsed or inclined stacking patterns, highlighting the importance of sampling the dynamic structures. This questions the common assignment of eclipsed structures on the basis of low-quality PXRD patterns often reported for 2D COFs in the literature. The results from classical force field dynamics are qualitatively consistent MLFF-MD simulations, supporting that a zigzag stacking structure is realistic on longer lengths scales.
Overall, the results of the room temperature simulations indicate that the on-the-fly MLFF is a valuable tool for accurately describing the dynamic properties of 2D COFs and that the stacking structure of these materials is more complicated than previously reported.
Author contributions
Ju Huang: conceptualization, investigation, methodology, visualization, writing – original draft, writing – review & editing. Seung-Jae Shin: methodology, formal analysis, writing – original draft, writing – review & editing. Kasper Tolborg: formal analysis, methodology, visualization, writing – review & editing. Alex M. Ganose: software, writing – review & editing. Gabriel Krenzer: software, writing – review & editing. Aron Walsh: conceptualization, methodology, resources, supervision, writing – review & editing.Conflicts of interest
The authors declare no interest conflicts.Acknowledgements
We thank Matthias Golomb for useful discussions on porous frameworks. J. H. acknowledges Imperial College London and the Chinese Scholarship Council (CSC) for providing a PhD scholarship. S.-J. S. is funded by the National Research Foundation of Korea (NRF-2018M3D1A1058793). K. T. is funded by the Independent Research Fund Denmark through the International Postdoctoral grant (0164-00015B). G. K. acknowledges the Faraday Institution for funding a PhD studentship (faraday.ac.uk; EP/S003053/1), grant number FIRG025. A. M. G. was supported by EPSRC Fellowship EP/T033231/1. We are also grateful to the UK Materials and Molecular Modelling Hub for computational resources, which is partially funded by EPSRC (EP/P020194/1 and EP/T022213/1). Via our membership of the UK's HEC Materials Chemistry Consortium, which is funded by EPSRC (EP/L000202), this work used the ARCHER2 UK National Supercomputing Service (https://www.archer2.ac.uk). Also, this work was supported by the Korea National Supercomputing Center with supercomputing resources including technical support (KSC-2022-CRE-0245).References
- A. P. Cote, A. I. Benin, N. W. Ockwig, M. O'Keeffe, A. J. Matzger and O. M. Yaghi, Science, 2005, 310, 1166–1170 CrossRef CAS PubMed.
- H. M. El-Kaderi, J. R. Hunt, J. L. Mendoza-Cortés, A. P. Côté, R. E. Taylor, M. O'Keeffe and O. M. Yaghi, Science, 2007, 316, 268–272 CrossRef CAS PubMed.
- Y. Hu, L. J. Wayment, C. Haslam, X. Yang, S.-H. Lee, Y. Jin and W. Zhang, EnergyChem, 2021, 3, 100048 CrossRef CAS.
- C. Stähler, L. Grunenberg, M. W. Terban, W. R. Browne, D. Doellerer, M. Kathan, M. Etter, B. V. Lotsch, B. L. Feringa and S. Krause, Chem. Sci., 2022, 13, 8253–8264 RSC.
- S.-Y. Ding and W. Wang, Chem. Soc. Rev., 2013, 42, 548–568 RSC.
- E. L. Spitler, B. T. Koo, J. L. Novotney, J. W. Colson, F. J. Uribe-Romo, G. D. Gutierrez, P. Clancy and W. R. Dichtel, J. Am. Chem. Soc., 2011, 133, 19416–19421 CrossRef CAS PubMed.
- A. Mähringer and D. D. Medina, Nat. Chem., 2020, 12, 985–987 CrossRef PubMed.
- F. Haase, K. Gottschling, L. Stegbauer, L. Germann, R. Gutzler, V. Duppel, V. Vyas, K. Kern, R. Dinnebier and B. Lotsch, Mater. Chem. Front., 2017, 1, 1354–1361 RSC.
- F. Haase and B. V. Lotsch, Chem. Soc. Rev., 2020, 49, 8469–8500 RSC.
- A. Natraj, W. Ji, J. Xin, I. Castano, D. W. Burke, A. M. Evans, M. J. Strauss, M. Ateia, L. S. Hamachi and N. C. Gianneschi, et al. , J. Am. Chem. Soc., 2022, 144, 19813–19824 CrossRef CAS PubMed.
- C. Kang, Z. Zhang, A. K. Usadi, D. C. Calabro, L. S. Baugh, K. Yu, Y. Wang and D. Zhao, J. Am. Chem. Soc., 2022, 144, 3192–3199 CrossRef CAS PubMed.
- M. Tong, Q. Yang, Y. Xiao and C. Zhong, Phys. Chem. Chem. Phys., 2014, 16, 15189–15198 RSC.
- B. T. Koo, W. R. Dichtel and P. Clancy, J. Mater. Chem., 2012, 22, 17460–17469 RSC.
- A. M. Pütz, M. W. Terban, S. Bette, F. Haase, R. E. Dinnebier and B. V. Lotsch, Chem. Sci., 2020, 11, 12647–12654 RSC.
- J. Huang, M. J. Golomb, S. R. Kavanagh, K. Tolborg, A. M. Ganose and A. Walsh, J. Mater. Chem. A, 2022, 10, 13500–13507 RSC.
- B. Lukose, A. Kuc, J. Frenzel and T. Heine, Beilstein J. Nanotechnol., 2010, 1, 60–70 CrossRef CAS PubMed.
- Y. Fan, Q. Wen, T.-G. Zhan, Q.-Y. Qi, J.-Q. Xu and X. Zhao, Chem. – Eur. J., 2017, 23, 5668–5672 CrossRef CAS PubMed.
- Y. Wang, W. Wang, Z. Zhang and P. Li, Applied Surf. Sci., 2022, 571, 151355 CrossRef CAS.
- P. G. Boyd, S. M. Moosavi, M. Witman and B. Smit, J. Phys. Chem. Lett., 2017, 8, 357–363 CrossRef CAS PubMed.
- D. Feng, Y. Feng, Y. Liu, W. Zhang, Y. Yan and X. Zhang, J. Phys. Chem. C, 2020, 124, 8386–8393 CrossRef CAS.
- G. Fraux, S. Chibani and F.-X. Coudert, Phil. Trans. Roy. Soc. A, 2019, 377, 20180220 CrossRef CAS PubMed.
- J. Keupp and R. Schmid, Adv. Theory Simul., 2019, 2, 1900117 CrossRef CAS.
- M. R. Momeni, Z. Zhang and F. A. Shakib, Chem. Commun., 2021, 57, 315–318 RSC.
- J. M. Cox, B. Mileson, A. Sadagopan and S. A. Lopez, J. Phys. Chem. C, 2020, 124, 9126–9133 CrossRef CAS.
- W. L. Jorgensen, D. S. Maxwell and J. Tirado-Rives, J. Am. Chem. Soc., 1996, 118, 11225–11236 CrossRef CAS.
- S. L. Mayo, B. D. Olafson and W. A. Goddard, J. Phys. Chem., 1990, 94, 8897–8909 CrossRef CAS.
- X. Zhang, M. Wei, Z. Zhang, X. Shi and Y. Wang, Desalination, 2022, 526, 115548 CrossRef CAS.
- J. P. Mailoa, M. Kornbluth, S. Batzner, G. Samsonidze, S. T. Lam, J. Vandermause, C. Ablitt, N. Molinari and B. Kozinsky, Nat. Mach. Intell., 2019, 1, 471–479 CrossRef.
- L.-C. Lin, J. Choi and J. C. Grossman, Chem. Commun., 2015, 51, 14921–14924 RSC.
- V. Botu, R. Batra, J. Chapman and R. Ramprasad, J. Phys. Chem. C, 2017, 121, 511–522 CrossRef CAS.
- R. Jinnouchi, F. Karsai and G. Kresse, Phys. Rev. B, 2019, 100, 014105 CrossRef CAS.
- D. Bayerl, C. M. Andolina, S. Dwaraknath and W. A. Saidi, Digital Discovery, 2022, 1, 61–69 RSC.
- M. F. C. Andrade, H.-Y. Ko, L. Zhang, R. Car and A. Selloni, Chem. Sci., 2020, 11, 2335–2341 RSC.
- C. Chen and S. P. Ong, Nat. Comput. Sci., 2022, 2, 718–728 CrossRef.
- Y. Kang, H. Park, B. Smit and J. Kim, Nat. Mach. Intell., 2023, 5, 309–318 CrossRef.
- Y. Zuo, C. Chen, X. Li, Z. Deng, Y. Chen, J. Behler, G. Csányi, A. V. Shapeev, A. P. Thompson and M. A. Wood, et al. , J. Phys. Chem. A, 2020, 124, 731–745 CrossRef CAS PubMed.
- R. Jinnouchi, F. Karsai, C. Verdi, R. Asahi and G. Kresse, J. Chem. Phys., 2020, 152, 234102 CrossRef CAS PubMed.
- R. Jinnouchi, J. Lahnsteiner, F. Karsai, G. Kresse and M. Bokdam, Phys. Rev. Lett., 2019, 122, 225701 CrossRef CAS PubMed.
- C. Verdi, F. Karsai, P. Liu, R. Jinnouchi and G. Kresse, npj Comput. Mater., 2021, 7, 1–9 CrossRef.
- G. Zhao, Y. Zhang, Z. Gao, H. Li, S. Liu, S. Cai, X. Yang, H. Guo and X. Sun, ACS Energy Lett., 2020, 5, 1022–1031 CrossRef CAS.
- S. Chandra, T. Kundu, S. Kandambeth, R. BabaRao, Y. Marathe, S. M. Kunjir and R. Banerjee, J. Am. Chem. Soc., 2014, 136, 6570–6573 CrossRef CAS PubMed.
- C. R. DeBlase, K. E. Silberstein, T.-T. Truong, H. D. Abruña and W. R. Dichtel, J. Am. Chem. Soc., 2013, 135, 16821–16824 CrossRef CAS PubMed.
- G. Kresse and J. Furthmüller, Phys. Rev. B: Condens. Matter Mater. Phys., 1996, 54, 11169 CrossRef CAS PubMed.
- J. Hafner and G. Kresse, Properties of Complex Inorganic Solids, Springer, 1997, pp. 69–82 Search PubMed.
- J. P. Perdew, K. Burke and M. Ernzerhof, Phys. Rev. Lett., 1996, 77, 3865 CrossRef CAS PubMed.
- P. Bultinck, C. Van Alsenoy, P. W. Ayers and R. Carbó-Dorca, J. Chem. Phys., 2007, 126, 144111 CrossRef PubMed.
- R. Scott, Computer Simulation of Liquids, 1991 Search PubMed.
- P. Liu, C. Verdi, F. Karsai and G. Kresse, Phys. Rev. Mater., 2021, 5, 053804 CrossRef CAS.
- A. P. Bartók, R. Kondor and G. Csányi, Phys. Rev. B: Condens. Matter Mater. Phys., 2013, 87, 184115 CrossRef.
- A. M. Evans, M. R. Ryder, W. Ji, M. J. Strauss, A. R. Corcos, E. Vitaku, N. C. Flanders, R. P. Bisbey and W. R. Dichtel, Faraday Discuss., 2021, 225, 226–240 RSC.
- S. Plimpton, J. Comput. Phys., 1995, 117, 1–19 CrossRef CAS.
- S. Nosé, J. Chem. Phys., 1984, 81, 511–519 CrossRef.
- W. G. Hoover, Phys. Rev. A, 1985, 31, 1695 CrossRef PubMed.
- M. Martnez-Abada, C. T. Stoppiello, K. Strutynski, B. Lerma-Berlanga, C. Mart-Gastaldo, A. Saeki, M. Melle-Franco, A. N. Khlobystov and A. Mateo-Alonso, J. Am. Chem. Soc., 2019, 141, 14403–14410 CrossRef PubMed.
- S. P. Ong, W. D. Richards, A. Jain, G. Hautier, M. Kocher, S. Cholia, D. Gunter, V. L. Chevrier, K. A. Persson and G. Ceder, Computational Mater. Sci., 2013, 68, 314–319 CrossRef CAS.
- Y. Zhang, M. Položij and T. Heine, Chem. Mater., 2022, 34, 2376–2381 CrossRef CAS.
Footnote |
| † Electronic supplementary information (ESI) available. See DOI: https://doi.org/10.1039/d3mh00314k |
| This journal is © The Royal Society of Chemistry 2023 |

