 Open Access Article
Synergistic photo-enhanced electrocatalysis of Pt–ZnO–Bi2O3 heterojunction for methanol oxidation under visible light illumination†
Kamal Kanti
Bera
a,
Malay
Chakraborty
a,
Shyamal Kanti
Bera
b,
Anupam
Chowdhury
a,
Mahima
Ranjan Das
c,
Mousumi
Mondal
a and
Swapan Kumar
Bhattacharya
 *a
*a
aPhysical Chemistry Section, Department of Chemistry, Jadavpur University, Kolkata 700032, India. E-mail: swapankumarbhattacharya@gmail.com; Fax: +913324146584; Tel: +919831699643
bSchool of Chemical Science, National Institute of Science Education and Research (NISER), Bhubaneswar-752050, India
cDepartment of Physics, The University of Burdwan, Burdwan 713104, India
First published on 7th October 2022
Abstract
Pt-based bismuth oxide (Bi2O3), zinc oxide (ZnO), and Bi2O3–ZnO heterojunctions were synthesized and tested in the photo-electrocatalytic oxidation of methanol in alkali under visible light irradiation. The decreased band gaps in Bi2O3 (2.05–2.36 eV) and ZnO (2.61–2.94 eV) in the ternary junctions compared to those in Pt–ZnO (2.95 eV), Pt–Bi2O3 (2.25 eV), bare Bi2O3(2.71 eV) and bare ZnO (3.38 eV) are seemingly responsible for the enhancement of light-absorption causing synergistic catalytic effects. The cyclic voltammetric peak current density of the ternary heterojunction, PZ5B1 (ZnO![[thin space (1/6-em)]](https://www.rsc.org/images/entities/char_2009.gif) :
:![[thin space (1/6-em)]](https://www.rsc.org/images/entities/char_2009.gif) Bi2O3 = 5
Bi2O3 = 5![[thin space (1/6-em)]](https://www.rsc.org/images/entities/char_2009.gif) :
:![[thin space (1/6-em)]](https://www.rsc.org/images/entities/char_2009.gif) 1) is improved 5.2, 4.1, and 3.6 times that of Pt–Bi2O3, Pt–ZnO and commercial Pt/C, respectively, under visible light. The composite PZ25B1 (ZnO
1) is improved 5.2, 4.1, and 3.6 times that of Pt–Bi2O3, Pt–ZnO and commercial Pt/C, respectively, under visible light. The composite PZ25B1 (ZnO![[thin space (1/6-em)]](https://www.rsc.org/images/entities/char_2009.gif) :
:![[thin space (1/6-em)]](https://www.rsc.org/images/entities/char_2009.gif) Bi2O3 = 25
Bi2O3 = 25![[thin space (1/6-em)]](https://www.rsc.org/images/entities/char_2009.gif) :
:![[thin space (1/6-em)]](https://www.rsc.org/images/entities/char_2009.gif) 1) exhibited 1.62 times greater activity under light than the corresponding dark value. The light response gradually increases with the increasing mass percentage of ZnO having a maximum value in PZ25B1 and decreases again. Due to the smallest Pt size (2.51 nm) and high electrochemical surface area (30.9 m2 g−1) in PZ25B1, methanol adsorption increases and the small bandgap helps absorb more visible light and creates large number of holes, which makes methanol oxidation faster. The negative shift of the peak potential under illumination in the CO stripping experiment indicates easy removal of adsorbed CO species on the Pt surface of the catalysts. The charge-transfer conductance of the best light-responsive and highly stable catalyst, PZ25B1 is 1.86 times greater in light than that in the dark. The stability of the PZ25B1 catalyst is judged from multiple cycling in cyclic voltammetry and chronoamperometric study. Chromatography experiments help in the identification of MOR product selectivity and mechanistic pathways.
1) exhibited 1.62 times greater activity under light than the corresponding dark value. The light response gradually increases with the increasing mass percentage of ZnO having a maximum value in PZ25B1 and decreases again. Due to the smallest Pt size (2.51 nm) and high electrochemical surface area (30.9 m2 g−1) in PZ25B1, methanol adsorption increases and the small bandgap helps absorb more visible light and creates large number of holes, which makes methanol oxidation faster. The negative shift of the peak potential under illumination in the CO stripping experiment indicates easy removal of adsorbed CO species on the Pt surface of the catalysts. The charge-transfer conductance of the best light-responsive and highly stable catalyst, PZ25B1 is 1.86 times greater in light than that in the dark. The stability of the PZ25B1 catalyst is judged from multiple cycling in cyclic voltammetry and chronoamperometric study. Chromatography experiments help in the identification of MOR product selectivity and mechanistic pathways.
1. Introduction
The noble metal Pt is a state-of-the-art electro-catalyst in the methanol oxidation reaction (MOR).1–4 However, its less abundance, high cost, strong poisoning effect, and low durability have become issues for the large-scale commercialization of direct methanol fuel cells (DMFCs).5,6 To moderate the above issues, it is crucial to find suitable support on Pt, which will help dispersion, decreases the loading amount, and has the ability to transfer charges to the catalyst. In this regard, semiconducting metal oxide (SMO) materials are advocated as promising noncarbon-based supports in MOR. Nanostructured SMO supports are thermodynamically stable materials compared to the corresponding metal. Strong coupling to the noble metal leads to a substantial decrease in the surface electron density of the metal nanoparticles, which assists in suppressing CO adsorption. Metal oxides generally adsorb –OH and react with Pt–CO by bi-functional mechanism7 to form CO2, which effectively alleviates CO poisoning and helps further the adsorption of methanol on the Pt surface. In a photo-assisted DMFC system, methanol is oxidized by the synergistic process of electro and photocatalytic mechanism at the Pt/semiconductor surface under light irradiation.8,9 Semiconductors with the aid of light, excite the valence band (VB) electrons to the conduction band (CB) and thus separate electron–hole pairs (e−–h+). The photogenerated holes, h+ create the hydroxyl radical (˙OH), which oxidizes the adsorbed methanol to CO2.10–12Metal oxides such as TiO2,13–15 ZnO,16 WO3,17 CeO2,18 SiO2,19 V2O5,20 SnO2,21 and Bi2O3,22 have been endorsed as potential supports for Pt owing to strong metal-support interaction, outstanding physicochemical properties, co-catalytic activity and also enhancement of electrocatalytic activity on photoexcitation.23 Recently, ternary heterojunction catalysts, such as Pt anchored anatase-rutileTiO2,24 Pt/Cu2O/GNs,25 Pt–BiOI/MoS2,26 Pt/SnO2/GNs,27 TiO2/ZnO/Pt,28 Pt–CuI/TiO2,29 Pt (Pd)/ZnO,30 Pt/WO3–NaTaO3,31 Pt–Ru/TiO2,32 NiO–TiO2/Pt,33 and Pt/ZnO/KB34 have been employed for methanol oxidation by photo-illumination. The most studied oxide, TiO2, has a high bandgap and absorbs UV light, which is no more than 5% of solar radiation reaching the earth's surface.35,36 Therefore, the finding of visible light receptive semiconductor photocatalyst is desirable and emergent. Among the family of visible light active photocatalysts, Bi2O3 is encouraging because of the narrow bandgap (2.4–2.8 eV) that easily generates charge carriers under visible light.37,38 Indeed, it is a p-type semiconductor and has four main differently active polymorphs α, β, γ, and δ. Another oxide, ZnO is an n-type semiconductor with a bandgap of 3.37 eV, high-electrochemical coupling coefficient, photostability, superb electron mobility with high exciton binding energy (60 meV),39 has also been regarded as a promising material for photodetector, solar cell, photocatalyst and photo-electrochemical fuel cell applications.40–42 In general, the photo-electrocatalytic efficiency depends highly on the tandem separation of electrons and holes. Therefore, the introduction of a p–n heterojunction using visible light active Bi2O3-based binary metal oxides such as Bi2O3–ZnO is attractive and promising. It exhibits low electron–hole recombination, efficient interfacial charge transfer, and a synergistic effect in the methanol oxidation reaction. Earlier investigation revealed that the incorporation of Pt into ZnO nanoparticles enhances the photo corrosion resistance, which improves the photocatalytic efficiency and photo-stability.43 Again combination of Bi2O3 with ZnO is also used as a corroding obstruction in regeneratable Zn–air batteries.44
In our previous study,45 we prepared Pt–ZnO–Bi2O3 heterojunctions for electrocatalytic methanol oxidation. Recently, we have also reported that Pt–ZnO composite has excellent photo electrooxidation activity and high stability toward methanol under visible light.8 In this paper, we synthesized Pt-decorated Bi2O3–ZnO heterojunctions following a previous method,45 well-characterized it by XRD, FTIR, FESEM, HRTEM, EDX-Mapping, XPS, UV-vis, and PL spectroscopy, and tested its photo-electrocatalytic activity with reference to methanol oxidation using CV, CA and EIS techniques under visible light and compared the activity in the absence of light. This study was performed in an alkaline medium because an acidic medium has some drawbacks: (i) slower kinetics due to greater CO poisoning (ii) slow alcohol deprotonation (iii) methanol crossover from anode to cathode, which decreases the cell performance. Again, the alkaline medium is kinetically faster for MOR, The OH− ion adsorption on the catalyst surface eliminates the oxidation bi-products, CO2, and H+ from the system. Moreover, the corrosive nature of the anode material is less in a mild alkaline atmosphere; thereby, increasing the cycle life and durability of the system.46,47 The photo-electrocatalytic activity of the ternary heterojunction was optimized with the proper amount of ZnO loading. We found that the construction of the p–n heterojunction is helpful in decreasing the bandgap of ZnO and Pt acts as an electron mediator between Bi2O3 and ZnO, thus decreasing the recombination of photogenerated electron–hole pairs, enhancing the catalytic performance and stability of the ternary heterojunction-catalyst toward methanol oxidation reaction. The identification of methanol oxidation products was executed using HPLC and GCMS and a plausible mechanistic pathway is drawn under visible light.
2. Experimental
Reagents used in the synthesis
Bismuth nitrate pentahydrate (Merck), zinc acetate dihydrate (Merck), chloroplatinic acid (Arora Matthey Ltd), Nafion (Sigma-Aldrich), 10 wt% commercial PtXC72 (Sigma-Aldrich), glycerin (Merck), sodium borohydride (Merck), methanol, ethanol (Analytical grade) and sodium hydroxide (Merck) were used as received. Millipore water was utilized all over the synthesis process and measurements.Synthesis of the Bi2O3, ZnO, ZnO–Bi2O3 heterojunction
ZnO–Bi2O3 heterojunctions of different compositions were synthesized using the solvothermal method. First, 0.01 M bismuth nitrate pentahydrate, Bi(NO3)3·5H2O and zinc acetate dihydrate, 0.01 M Zn(acac)2·6H2O solutions were prepared in glycerin, mixed in different ratios and sonicated for 30 min, succeeded by continuous stirring for 1 h. Next, the colloidal solution was displaced in a 100 mL Teflon-lined stainless steel autoclave, which was then heated at 180 °C for 6 h. After cooling to room temperature, yellowish-white ZnO–Bi2O3 nanocomposites were collected by centrifugation (5000 rpm, 5 min), several times washing and drying (90 °C). Pure ZnO and Bi2O3 nanoparticles were similarly obtained without mixing with each other. Finally, all the synthesized substances were annealed at 400 °C for 2 h.48Preparation of Pt–Bi2O3 (PB), Pt–ZnO (PZ) and Pt–ZnO–Bi2O3 (PZB) heterojunctions
Various compositions of Pt–ZnO–Bi2O3 were synthesized as follows: 12 mg of the previously prepared ZnO–Bi2O3 nanocatalyst was sonicated in 2 mL ethanol for 45 min and 4 mL H2PtCl6 (8 mM) was mixed with the solution and sonicated for another 5 min. Following that, 2.5 mL NaBH4 (30 mM) solution was mixed with the suspension at room temperature. The colour of the solution turned immediately black due to the formation of Pt nanoparticles on ZnO–Bi2O3 (ZB) nanocomposites. We finally obtained powdery Pt–ZnO–Bi2O3 (PZB) nanocomposites after centrifuging, cleaning, and drying. The synthesized ternary composites were designated based on mass percentages of Pt as PZ1B1 (20.23 wt% Pt), PZ1B5 (21.78 wt% Pt), PZ5B1(21.13 wt% Pt), PZ20B1 (21.98 wt% Pt), PZ25B1(21.54 wt% Pt), and PZ30B1(24.2 wt% Pt), which represent almost the same weight percentages of Pt deposited on ZnO and Bi2O3 of different molar ratios as ca. 1![[thin space (1/6-em)]](https://www.rsc.org/images/entities/char_2009.gif) :
:![[thin space (1/6-em)]](https://www.rsc.org/images/entities/char_2009.gif) 1, 1
1, 1![[thin space (1/6-em)]](https://www.rsc.org/images/entities/char_2009.gif) :
:![[thin space (1/6-em)]](https://www.rsc.org/images/entities/char_2009.gif) 5, 5
5, 5![[thin space (1/6-em)]](https://www.rsc.org/images/entities/char_2009.gif) :
:![[thin space (1/6-em)]](https://www.rsc.org/images/entities/char_2009.gif) 1, 20
1, 20![[thin space (1/6-em)]](https://www.rsc.org/images/entities/char_2009.gif) :
:![[thin space (1/6-em)]](https://www.rsc.org/images/entities/char_2009.gif) 1, 25
1, 25![[thin space (1/6-em)]](https://www.rsc.org/images/entities/char_2009.gif) :
:![[thin space (1/6-em)]](https://www.rsc.org/images/entities/char_2009.gif) 1 and 30
1 and 30![[thin space (1/6-em)]](https://www.rsc.org/images/entities/char_2009.gif) :
:![[thin space (1/6-em)]](https://www.rsc.org/images/entities/char_2009.gif) 1, respectively.
1, respectively.
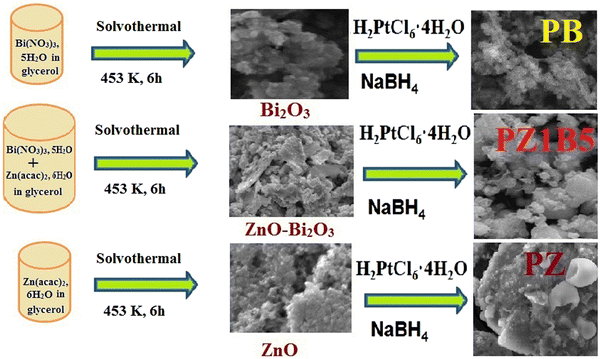
The binary composites PB and PZ were obtained using only Bi2O3 and ZnO precursors, respectively, instead of mixed semiconductor nanoparticles following this similar method. The formation of binary and ternary heterojunctions is shown in the following Scheme 1.
Structural characterization
The analysis of X-ray diffraction (XRD) was accomplished with an X-ray diffractometer Bruker D8 Advance generated at 40 kV and 40 mA, using a CuKα radiation source (λ = 1.5418 Å). The morphologies of the as-synthesized nanocomposites were characterized by field emission scanning electron microscopy (FESEM, INSPECT F50 FEI), transmission electron microscopy (TEM), and high-resolution transmission electron microscopy (JEM-2100F HRTEM, JEOL, Japan), selected area electron diffraction (SAED). The compositions of the as-synthesized catalysts were derived from Rietveld analysis of XRD and energy dispersion X-ray spectroscopy (EDX). X-ray photoelectron spectroscopy (XPS) of PB, PZ, and the PZ25B1 heterojunction was studied by Thermo Fisher Scientific Multilab 2000 spectrometer run at 150 W (12 kV, 12.5 mA) with non-monochromatic AlKa radiation (1486.6 eV) X-ray source. The physicochemical and optical characteristics were analyzed using a UV-visible spectrophotometer (V-630, Jasco, Japan) and photoluminescence spectra (RF-5301, Shimadzu, Japan). Ex situ Fourier transform infrared spectroscopy (FTIR, PerkinElmer, Spectrum RX1, Resolution 4 cm−1) on the prepared composites was also performed.Fabrication of the as-synthesized electrodes
To fabricate the electrodes for electrocatalytic measurements, 2 mg of the synthesized catalysts were dissolved in 1 mL ethanol by sonicating 30 min. 10 μL of the dispersed solution was drop cast on the previously polished, cleaned, and plained surface of the graphite carbon electrode and then dried for 3 h. At last, the film was prepared by drop-casting of 5 μL of 1(w/v)% Nafion and drying overnight.Photo-electrochemical measurement
The photo-electrochemical measurements were performed using an AUTOLAB potentiostat at room temperature using a traditional three-electrode system. A large Pt foil (1 cm × 1 cm) and saturated calomel electrode (SCE) were used as counter and reference electrodes, respectively. The modified PB/C, PZ/C, and various compositions of PZB/C electrodes of 0.12 cm2 geometrical surface area were used as working electrodes. The potential data were expressed against the SCE. A cyclic voltammetry study was conducted in the potential between −0.9 V to +0.6 V using 1 M NaOH aqueous solution in the presence and absence of 0.05 M MeOH at different scan rates ranging from 1 mV s−1 to 300 mV s−1. The CA study was accomplished for 600 s at −0.3 V. Prior to all the electrochemical measurements, the freshly produced nitrogen gas was passed into electrolytic solutions. The CO stripping and oxidation experiment was performed in the potential range of −0.6 V to +0.2 V versus the SCE electrode using 1 M NaOH solution at a scan rate 50 mV s−1. First, N2 gas was passed for 20 min into the solution. After that, the working electrode was held in a CO-saturated NaOH solution by passing CO for 15 min, and then to excess CO that was adsorbed was removed by passing N2 gas again into the NaOH solution for 15 min. The electrochemical impedance spectroscopy (EIS) was performed at a constant potential, −0.3 V under an ac voltage of 5 mV over the frequency range between 0.1 and 105 Hz. A 30 W LED bulb (wavelength >400 nm) was used as the visible light source during all the electrochemical measurements. The intensity of this light (100 × 100 lx) was estimated using a lux meter (LX-101A). The experimental setup of the photo-electro oxidation process was described in our previous study.33Analysis of products by HPLC and GCMS
At first, time-coursed current density measurements were performed for 7200 s in 10 mL 0.5 M methanol + 1 M NaOH solution taking PB, PZ, PZ25B1, and PZ30B1 composites as working electrodes, at constant potential −0.3 V with respect to SCE under both light and dark conditions.24,33,45 Then, the resulting solutions were studied for high-performance liquid chromatography (HPLC) (Shimadzu Corporation, Japan) and Gas Chromatography-Mass Spectrometry (GCMS) was performed on Thermo Fisher ITQ900 instruments (EI) and a TG-SQC capillary column using helium gas as a carrier.3. Results and discussion
Characterization
The crystal structures of the synthesized catalysts: PB, PZ, commercial PtXC72, and various PZB composites were ascertained from the PXRD profile (Fig. 1(a)). The Rietveld refinement output of the PXRD data8,33,45 is depicted in Fig. S1 (ESI†). The wt% of Pt, ZnO, and Bi2O3 from Rietveld refinement and the average particle diameter of Pt from TEM of all PZB composites are presented in Table S1 (ESI†).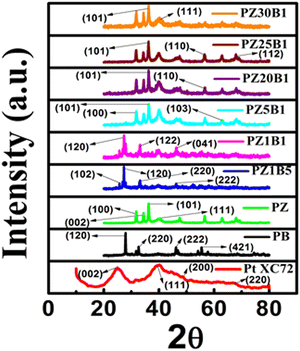 | ||
| Fig. 1 (a) PXRD patterns of the synthesized Pt–Bi2O3 (PB), Pt–ZnO (PZ) and various compositions of Pt–ZnO–Bi2O3 (PZB) nanocatalysts. | ||
The goodness of factor (GOF) value 1.1 indicates a well-fitting experimental profile with the theoretical one. The peaks at 2θ (/degree) = 24.98, 39.94, 46.35, and 67.74 are ascribed to the diffraction from the (002) plane of carbon, and (111), (200), and (220) planes of the face-centered Pt nanoparticles, respectively (JCPDS no. 04-0802).13,49 The peaks at an angle (2θ/degree) of 25.2, 27.9, 31.95, 32.78, 33.71, 35.12, 46.25, 52.56 and 66.57 correspond to the diffractions from the (102), (201), (002), (220), (122), (210), (222), (321) and (341) planes, respectively, of the monoclinic Bi2O3 (α phase) (JCPDS no. 72-0398) and the peaks (2θ/degree) at 31.93, 34.56, 36.25, 47.30, 56.39, 62.90, 67.87, 69.16 and 77.19 are allocated to the (100), (002), (101), (102), (110), (103), (112), (201) and (202) diffraction planes, respectively, of hexagonal ZnO (JCPDS no. 89-7102). Thus, the existence of peaks of Bi2O3, ZnO, and Pt supports the formation of ternary hetero-junction.
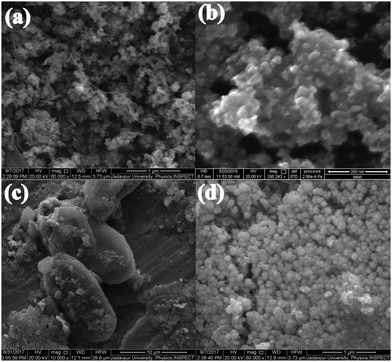
As shown in Fig. 2(a), the FESEM image of the PB composite appeared like a bunch of grapes on a peduncle. Fig. 2(b), FESEM image of the as-prepared PZ nanocomposite, revealed the formation of hexagonal arrangement nanoparticles of diameter 20 nm to 41 nm. Fig. 2(c) illustrates the hexagonal growth of ZnO with an average diameter of 6.24 μm and length of 14.32 μm (PZ5B1), whereas Fig. 2(d) exhibits the spherical particle of diameter 70 nm to 160 nm formed in PZ25B1.
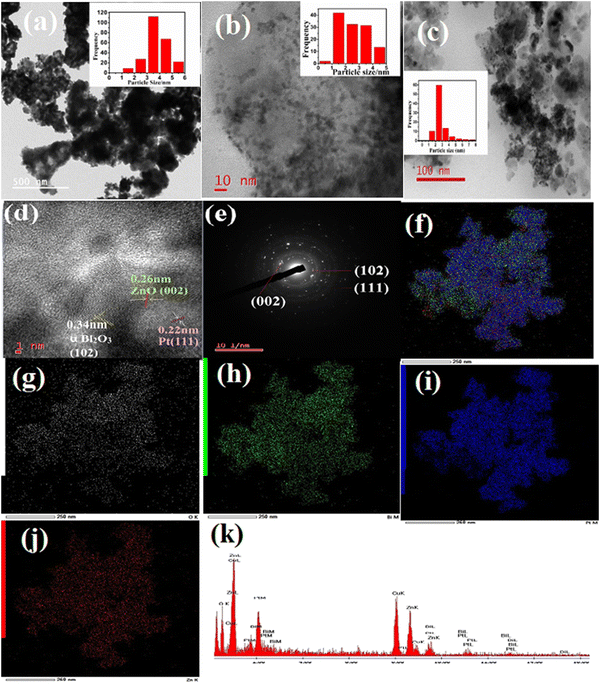
The TEM image of PB in Fig. 3(a) displays the formation of flake-type nanocomposites and the inset represents the particle size distribution graph (PSD) of Pt in a bismuth oxide catalyst. The average particle diameter of Pt in PB is 3.51 nm. The morphology of PZ in Fig. 3(b) exhibits the formation of porous ZnO and the PSD graph (inset) shows an average size of 2.13 nm and spreads as black dots on the entire surface of ZnO. The TEM image of PZ25B1 is exhibited in Fig. 3(c). From the inset graph, it is delineated that the spherical Pt particles are of 2.51 nm in average diameter spread over the surface of the zinc oxide–bismuth oxide heterojunction in the diameter range of 19 nm to 34 nm. The lattice fringe with interplaner spacings of 0.22 nm, 0.34 nm, and 0.26 nm are attributed to the (111), (102), and (002) planes of fcc Pt, monoclinic (α) Bi2O3, and hexagonal ZnO, respectively, as obtained from the HRTEM image of PZ25B1shown in Fig. 3(d). Fig. 3(e) manifests the SAED pattern of PZ25B1, which is well-matching the XRD data. Elemental mappings of PZ25B1 (Fig. 3(f)–(j)) show good coexistence, and close contact of the constituting elements: O, Bi, Pt, Zn of the composite and thus also confirm the formation of Pt, ZnO, and Bi2O3 nanoparticles in close proximity, that makes stronger interaction between Pt and metal oxides with each other. The representative EDX data of the TEM image in Fig. 3(k) supports the formation of a ternary heterojunction of appropriate molar ratio. Thus, mapping analysis indicates that Pt, ZnO, and Bi2O3 mainly form a heterostructure and Pt is distributed over the surface of metal oxides. To find out the average particle size and state of the particle dispersion of Pt on the surface of other PZB composites along with the PtXC72 catalyst, TEM analysis were performed on all catalysts and the data are depicted in Fig. S2(a)–(f). This exhibits Pt size ca. 1–5 nm dispersed on the surface of the catalysts.
To confirm the chemical states, composition, and interaction present on the surface of the synthesized heterojunction, XPS of the representative ternary heterojunction PZ25B1 was studied. Fig. 4(a) presents the wide-range XPS spectrum of the PZ25B1 catalyst, where Zn, O, Bi, Pt, and C elements were found. From the binding energy (BE) of C 1s (284.8 eV), BE of other elements was calibrated.50
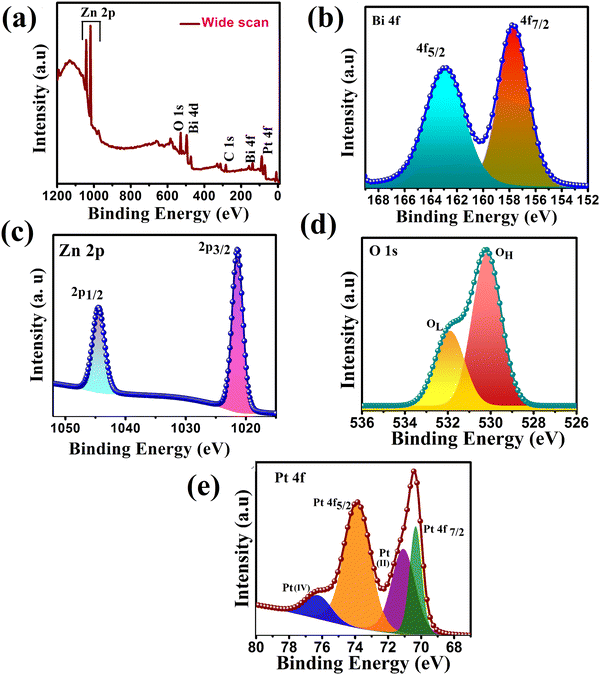 | ||
| Fig. 4 XPS spectra of PZ25B1 composite: (a) wide range energy spectrum (b) Bi 4f (c) Zn 2p (d) O 1s (e) Pt 4f. | ||
For the PZ25B1 system, signals for Bi 4f7/2 and Bi 4f5/2 were observed at binding energies 157.7 and 162.9 eV belonging to Bi3+ of Bi2O3 (Fig. 4(b)). The reported XPS data of Bi2O3 are 157.1 and 162.5 eV,51 respectively. Again, the deconvoluted XPS spectrum of PB (Fig. S3 and Table S2, ESI†) shows the peaks at 157.9 and 163.2 eV for Bi 3+ of α-Bi2O3. This shows the upward shift of Bi3+ in PB and PZ25B1 heterojunctions compared to bare Bi2O3. In the PZ component, the deconvoluted Zn 2p spectrum in Fig. 4(c), Zn 2p1/2, and Zn2p3/2 peaks are observed at around 1045.37 and 1022.29 eV, respectively, (Table S3, ESI†) and for PZ25B1 its values become 1044 and 1021 eV, respectively (Table S4, ESI†). Correlating the BEs value of Zn2p3/2 (1022.4 eV) from the handbooks of XPS52,53 and table of PZ (Table S3, ESI†), we confirm that Zn remains in the Zn2+ state and the spectrum has a negative shift of 1 eV. The PZ25B1 heterojunction comprised a positive shift of Bi2O3 and a negative shift of ZnO. Thus, the increase in binding energy (positive shift), i.e., decreased electron concentration of Bi2O3, and decrease in binding energy (negative shift), i.e., increased electron concentration of ZnO is because of the rapid interfacial charge transfer and the strong interaction present on the surface.54–56 From Fig. 4(d) and Table S4 (ESI†), it can be seen that two peaks at BEs 530.18 and 531.90 eV are due to the lattice oxygen (OL) of ZnO and chemically adsorbed oxygen (OH), respectively.55,57 The binding energies of the two pairs of doublets (4f7/2 and 4f5/2) in Fig. 4(e) located at 70.33, 73.87 eV are assigned to Pt (0), 71.07 and 76.22 eV as PtO or Pt(OH)2 and PtO2, respectively. The binding energy curves of Pt 4f for the PZB composite shift downward by 0.9 eV and 0.13 eV compared to these of metallic Pt (71.2 eV, 74 eV), which renders the linkage of Pt with Zn or Bi atom on the surface.22
The presence of Pt(0), PtO or Pt(OH)2, and PtO2 state on the surface of the ZnO–Bi2O3 heterojunction enhances visible light harvest, decreases band gap, and plays an important role in the increment of photo-electrocatalytic activity.58–61 It is now believed that the species, Pt(OH)2 and Pt–OHads assist in CO removal and allow for further methanol oxidation.62,63
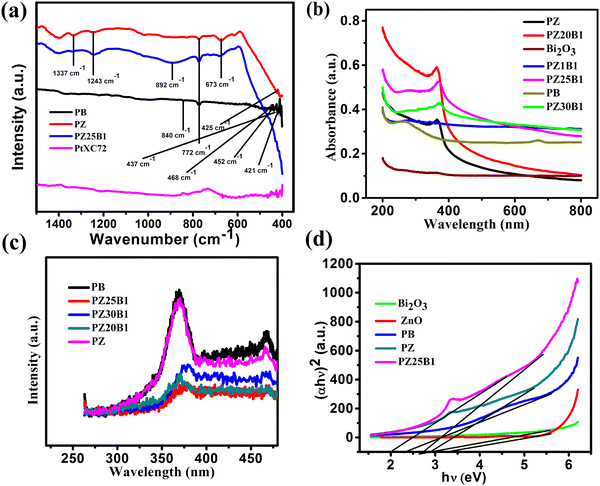
The FTIR spectra of PB, PZ PZ25B1, and PtXC72 are shown in Fig. 5(a). The band at 840 cm−1 arises from the stretching vibration of Bi–O bonds in the BiO6 octahedron64 and the peaks around 437 and 483 cm−1 are also ascribed to Bi–O stretching vibration that confirms the formation of α-Bi2O3.65 The band at 772 cm−1 arises from the vibration of the metal–oxygen bond.66 The peak at 425 cm−1 shows a distinct stretching band of the ZnO crystal.67,68 The origin of the stretching vibration of –C–O (1337 cm−1) and bending vibration of −C–H (1243 cm−1) are due to the use of ethanol as a solvent.69 The band at 892 cm−1 is due to the Zn–O–Bi stretching vibration.70,71
The optical properties of Pt–Bi2O3, Pt–ZnO, and Pt–ZnO–Bi2O3 composites were inspected by UV-vis absorption and photoluminescence (PL) spectroscopy. The absorption spectra of Bi2O3, Pt–ZnO, Pt–Bi2O3, and Pt–ZnO–Bi2O3 are presented in Fig. 5(b). It indicates that the ZnO–Bi2O3 heterojunction shows strong absorbance at 371 nm (redshift of absorption edge) compared to ZnO (272 nm) and Bi2O3 (254 nm) and tail absorption was noticed in the visible region because of the Pt deposition in Bi2O3 and all ZnO–Bi2O3 catalysts.59,72–74 The inclusion of Pt to ZnO also induces light absorption towards the visible zone.75,76 This might be due to the presence of a small amount of impurity in metallic Pt, i.e., PtO or Pt(OH)2, and PtO2 on the surface of ZnO–Bi2O3.59 Some researchers have confirmed that the coexistence of three Pt species on the surface of metal oxide catalyst played a major role in the enhancement of the photocatalytic performance.77–79 Previous studies also indicated that Pt nanoparticles act as a mediating role to transfer electrons directly from one photoexcited semiconductor to another semiconductor. The ternary heterojunction, PZ25B1 shows higher photoactivity because the loading of Pt enhances the transfer of electrons from ZnO to Bi2O3 and easily separates the photogenerated electron–hole pairs.33,54,55,80
The recombination efficiency of the photoexcited electrons and holes is supported by the PL spectra and exhibited in Fig. 5(c). All the spectra were obtained by excitation at 254 nm and show two emissions at 370 nm and 468 nm. The sharper band at 370 nm is allocated to the near band edge emission of ZnO and the band 468 nm is recognized as the recombination of charge carriers and intrinsic defects like Zn interstitial or impurities, and oxygen vacancies.81–83 The decrease of the PL intensity of Pt–ZnO–Bi2O3 compared to PB or PZ demonstrates the inhibition of electron–hole recombination and thus increases the photocatalytic activity.
The optical direct bandgap energy (Eg) of the prepared composite was estimated by plotting (αhν)2versus hν using the Tauc equation (αhν)2 = A(hν – Eg) where α, hν, Eg, A are the absorption coefficient, the energy of light, optical band gap and a constant, respectively. The values of the bandgaps are summarized in Table 1. From Fig. 5(d) and Fig. S4 (ESI†), it is seen that two straight lines can be formed in the p–n heterojunction unlike for pure samples8,38 and the bandgap values are 2.71, 3.38 for pure Bi2O3, pure ZnO (Fig. S4, ESI†), and two values, 2.05, 2.81 (first one concerning Bi2O3 and later is for ZnO) for the PZ25B1 nanocatalyst. Therefore, it can be said that the introduction of Pt (along with a small amount of PtOx, x = 1, 2) in the p–n junction (PZ25B1) effectively decreases the bandgap of the semiconductor and becomes a more attractive visible light photocatalyst.
| Catalyst | Bandgap (Eg)/eV | Onset potential (V) (dark) | Forward peak current density in dark (mA mg−1 of Pt) | Onset potential (V) (light) | Forward peak current density in light (mA mg−1 of Pt) | Average enhancement of current density (mA mg−1 of Pt) |
|---|---|---|---|---|---|---|
| Pt–Bi2O3 | 2.25 | −0.618 | 95.4 ± 2.2 | −0.621 | 169± 3 | 73.6 |
| Pt–ZnO | 2.95 | −0.652 | 168 ± 2.4 | −0.739 | 228.8± 6 | 60.8 |
| PZ1B1 | 2.23, 2.87 | −0.604 | 253 ± 3.1 | −0.612 | 377± 1.1 | 124 |
| PZ1B5 | 2.36, 2.94 | −0.594 | 127 ± 4.9 | −0.604 | 176.5± 5.2 | 49.5 |
| PZ5B1 | 2.20, 2.83 | −0.675 | 932.8 ± 1.1 | −0.744 | 969.3± 1.8 | 36.5 |
| PZ20B1 | 2.11, 2.61 | −0.668 | 666.5 ± 2.6 | −0.722 | 873± 3.4 | 206.5 |
| PZ25B1 | 2.05, 2.81 | −0.646 | 496.8 ± 2.8 | −0.735 | 797.8± 4.3 | 301 |
| PZ30B1 | 2.23, 2.72 | −0.650 | 608 ± 1.7 | −0.716 | 748± 5.6 | 140 |
Photo-catalytic activity toward MeOH oxidation
The methanol oxidation reaction (MOR) activities of the unplatinised support with Bi2O3, ZB15 (ZnO![[thin space (1/6-em)]](https://www.rsc.org/images/entities/char_2009.gif) :
:![[thin space (1/6-em)]](https://www.rsc.org/images/entities/char_2009.gif) Bi2O3 = 1
Bi2O3 = 1![[thin space (1/6-em)]](https://www.rsc.org/images/entities/char_2009.gif) :
:![[thin space (1/6-em)]](https://www.rsc.org/images/entities/char_2009.gif) 5), ZB51 (ZnO
5), ZB51 (ZnO![[thin space (1/6-em)]](https://www.rsc.org/images/entities/char_2009.gif) :
:![[thin space (1/6-em)]](https://www.rsc.org/images/entities/char_2009.gif) Bi2O3 = 5
Bi2O3 = 5![[thin space (1/6-em)]](https://www.rsc.org/images/entities/char_2009.gif) :
:![[thin space (1/6-em)]](https://www.rsc.org/images/entities/char_2009.gif) 1,) and ZB251 (ZnO
1,) and ZB251 (ZnO![[thin space (1/6-em)]](https://www.rsc.org/images/entities/char_2009.gif) :
:![[thin space (1/6-em)]](https://www.rsc.org/images/entities/char_2009.gif) Bi2O3 = 25
Bi2O3 = 25![[thin space (1/6-em)]](https://www.rsc.org/images/entities/char_2009.gif) :
:![[thin space (1/6-em)]](https://www.rsc.org/images/entities/char_2009.gif) 1,) with and without illumination were investigated and the data are shown in Fig. 6(a)–(d). From the figure we observed that the peak current density at the potential −0.28 V (0.78 V vs. RHE) follows the order ZB51 > ZB251> ZB15 > Bi2O3. This indicates that the peak current density first increases, gets maximum at a fixed composition, ZnO
1,) with and without illumination were investigated and the data are shown in Fig. 6(a)–(d). From the figure we observed that the peak current density at the potential −0.28 V (0.78 V vs. RHE) follows the order ZB51 > ZB251> ZB15 > Bi2O3. This indicates that the peak current density first increases, gets maximum at a fixed composition, ZnO![[thin space (1/6-em)]](https://www.rsc.org/images/entities/char_2009.gif) :
:![[thin space (1/6-em)]](https://www.rsc.org/images/entities/char_2009.gif) Bi2O3 = 5
Bi2O3 = 5![[thin space (1/6-em)]](https://www.rsc.org/images/entities/char_2009.gif) :
:![[thin space (1/6-em)]](https://www.rsc.org/images/entities/char_2009.gif) 1, and then decreases on the addition of ZnO to Bi2O3. However, only a slight increment of the current was observed under visible light irradiation in each case. These findings are not unexpected for the semiconductor material. In the case of an unplatised catalyst, electron–hole recombination will be more favorable and methanol adsorption on the electrode surface is expected to be low. Thus, the overall MOR activity on these supports is low.13 The catalytic performance of our synthesized composites towards MOR was also compared with that of commercial Pt. 10 wt% commercial Pt-XC72 (Pt/C) was used in the oxidation of 0.5 M methanol in 1 M NaOH and it achieved a current density of 266.4 mA mg−1 of Pt (Fig. 6(e)), which is well consistent with the previous study.33,49
1, and then decreases on the addition of ZnO to Bi2O3. However, only a slight increment of the current was observed under visible light irradiation in each case. These findings are not unexpected for the semiconductor material. In the case of an unplatised catalyst, electron–hole recombination will be more favorable and methanol adsorption on the electrode surface is expected to be low. Thus, the overall MOR activity on these supports is low.13 The catalytic performance of our synthesized composites towards MOR was also compared with that of commercial Pt. 10 wt% commercial Pt-XC72 (Pt/C) was used in the oxidation of 0.5 M methanol in 1 M NaOH and it achieved a current density of 266.4 mA mg−1 of Pt (Fig. 6(e)), which is well consistent with the previous study.33,49
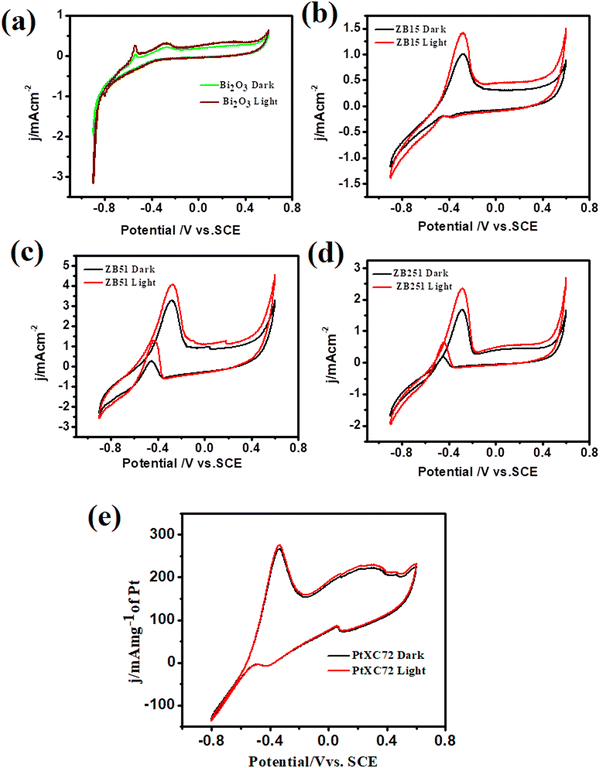 | ||
Fig. 6 Cyclic voltammograms of unplatinised supports in 0.5 M MeOH + 1 M NaOH solution at 25 °C (a) Bi2O3 (b) ZnO![[thin space (1/6-em)]](https://www.rsc.org/images/entities/char_2009.gif) : :![[thin space (1/6-em)]](https://www.rsc.org/images/entities/char_2009.gif) Bi2O3 (1 Bi2O3 (1![[thin space (1/6-em)]](https://www.rsc.org/images/entities/char_2009.gif) : :![[thin space (1/6-em)]](https://www.rsc.org/images/entities/char_2009.gif) 5) (c) ZnO 5) (c) ZnO![[thin space (1/6-em)]](https://www.rsc.org/images/entities/char_2009.gif) : :![[thin space (1/6-em)]](https://www.rsc.org/images/entities/char_2009.gif) Bi2O3 (5 Bi2O3 (5![[thin space (1/6-em)]](https://www.rsc.org/images/entities/char_2009.gif) : :![[thin space (1/6-em)]](https://www.rsc.org/images/entities/char_2009.gif) 1) (d) ZnO 1) (d) ZnO![[thin space (1/6-em)]](https://www.rsc.org/images/entities/char_2009.gif) : :![[thin space (1/6-em)]](https://www.rsc.org/images/entities/char_2009.gif) Bi2O3 (25 Bi2O3 (25![[thin space (1/6-em)]](https://www.rsc.org/images/entities/char_2009.gif) : :![[thin space (1/6-em)]](https://www.rsc.org/images/entities/char_2009.gif) 1) with and without irradiation. 1) with and without irradiation. | ||
To test the MOR activity of the platinized catalyst with ZnO–Bi2O3 support, cyclic voltammograms (CVs) were collected for PB, PZ, and the various composites of PZB-modified electrodes for photo-electrocatalytic methanol oxidation in alkali under visible light irradiation.
The CV profiles of the PZ25B1 electrode in 1 M NaOH solution at a scan rate 0.05 V s−1 in the absence and presence of light (Fig. S5, ESI†) showed almost no change in the current values in dark and illuminated conditions, indicating that light irradiation on the PZ25B1 electrode has no effect on NaOH solution and only MeOH is photoresponsive in the presence of the heterojunction electrodes. The thermodynamic potential, E0 of MOR (−0.81 V), and water-splitting reaction (−1.23 V vs. SHE) indicate that MOR is thermodynamically more favorable than the water-splitting reaction.33
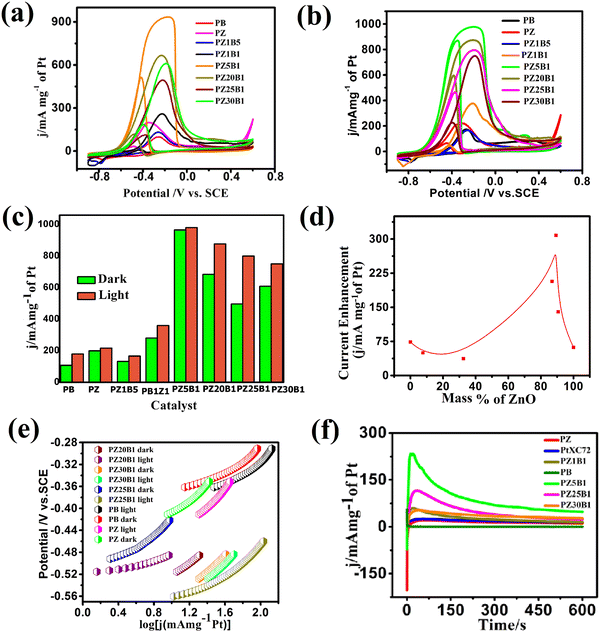
In our previous work,45 methanol oxidation on PB, PZ, and various PZB composites was studied without light. It was seen that the forward peak potential arises in the range −0.17 V (0.89 V vs. RHE) to −0.35 V (0.71 V vs. RHE) for methanol electrooxidation and the backward peak potential developed in the range −0.38 V (0.68 V vs. RHE) to −0.55 V (0.51 V vs. RHE) was due to the removal of carbonaceous intermediates produced from incomplete oxidation of methanol. The current densities at the peak potential (mA mg−1 of Pt) for MOR under dark conditions accompanied the increasing order PB (95.4 ± 2.2) < PZ1B5 (127 ± 4.9) < PZ (168 ± 2.4) < PZ1B1 (253 ± 3.1) < PZ25B1 (496.8 ± 2.8) < PZ20B1 (666.5 ± 2.6) < PZ5B1 (932.8 ± 1.1), implying PZ5B1 as the best electrode for MOR (Fig. 7(a)).
This study illustrates the MOR under visible light irradiation on the modified electrodes. The CV profiles of the modified electrodes in 0.5 M MeOH + 1 M NaOH solution in visible light are shown in Fig. 7(b). We observed that the current densities at peak potential (mA mg−1 of Pt) for MOR under light illumination followed the order PZ1B5 (176.5 ± 5.2) < PB (169 ± 3) < PZ (228.8 ± 6) < PZ1B1 (377 ± 1.1) < PZ30B1 (748 ± 5.6) < PZ25B1 (797.8 ± 4.3) < PZ20B1 (873 ± 3.4) < PZ5B1 (969.3 ± 1.8). Notably, the order of the improvement of catalytic capability on changing the composition was almost the same for the electrodes under light and dark conditions. The only exception is the reverse order of PZ1B5 and PB under illumination, as compared to that in the absence of light. The higher peak current density value of PB compared to PZ1B5 in the presence of light is due to the greater capability of light absorption of Bi2O3 compared to ZnO. The greater light absorption causes a greater photo-induced current.
The superiority of the electrode PZ5B1 among the electrodes examined in MOR under visible light was noticed just as in our previous study performed in the dark.45 It exhibits a peak current density of 969.3 (in mA mg−1 of Pt), which is 5.7, 4.2, and 3.6 times larger than that of PB (169), PZ (228.8), and PtXC72 (266.4). The reason behind the synergistic improvement of peak current density (catalytic capability) of the ternary heterojunction over binary junction is the transfer of an electron from ZnO and Bi2O3 to Pt causing more Pt(0) state at the surface and greater adsorption and oxidation of methanol, as described in our previous study.45 Moreover, XPS studies8,45 revealed that ZnO provides a more oxidizing surface than Bi2O3 because of less oxygen anion from the formers. Thus, an increase in the content of ZnO in PZB ternary heterojunctions causes an increase in the catalytic capability up to a certain limit of the ratio, ZnO![[thin space (1/6-em)]](https://www.rsc.org/images/entities/char_2009.gif) :
:![[thin space (1/6-em)]](https://www.rsc.org/images/entities/char_2009.gif) Bi2O3 = 5
Bi2O3 = 5![[thin space (1/6-em)]](https://www.rsc.org/images/entities/char_2009.gif) :
:![[thin space (1/6-em)]](https://www.rsc.org/images/entities/char_2009.gif) 1. For all the electrodes, the peak current density increases on light exposure. This indicates that the light energy is beneficial for this semiconductor-based heterojunction, although the rate of the thermal reaction in the dark is decreased on further addition of ZnO in PZ5B1. Light energy is beneficial for MOR because it is utilized in a different mechanism with different product selectivity in the presence of light in comparison to the dark. Although the catalytic performance of the electrodes in MOR is of the same order with and without light illumination, the enhancement of the photocatalytic activity was observed for all electrodes. A greater enhancement of the catalytic activity due to photo-irradiation was found for the PZ25B1 electrode. The order of overall catalytic activity followed exactly the same sequence. Due to the transfer of electrons from ZnO to Pt and from Pt to Bi2O3 and reverse transfer of holes, the separation of electron–hole pairs in the composite occurred, and on successive addition of ZnO in PZB heterojunctions, the lowest band gap was obtained in PZ25B1. As such, maximum light absorption and hence light response was found for the catalyst.
1. For all the electrodes, the peak current density increases on light exposure. This indicates that the light energy is beneficial for this semiconductor-based heterojunction, although the rate of the thermal reaction in the dark is decreased on further addition of ZnO in PZ5B1. Light energy is beneficial for MOR because it is utilized in a different mechanism with different product selectivity in the presence of light in comparison to the dark. Although the catalytic performance of the electrodes in MOR is of the same order with and without light illumination, the enhancement of the photocatalytic activity was observed for all electrodes. A greater enhancement of the catalytic activity due to photo-irradiation was found for the PZ25B1 electrode. The order of overall catalytic activity followed exactly the same sequence. Due to the transfer of electrons from ZnO to Pt and from Pt to Bi2O3 and reverse transfer of holes, the separation of electron–hole pairs in the composite occurred, and on successive addition of ZnO in PZB heterojunctions, the lowest band gap was obtained in PZ25B1. As such, maximum light absorption and hence light response was found for the catalyst.
The peak potential and peak current density values of all the examined electrodes are presented in Table 1. We observed that the onset potential of the as-synthesized PB, PZ and various PZB heterojunctions was shifted negatively (cathodically) on light illumination, indicating easier methanol oxidation in the presence of light. The result showed that all the above electrodes enhanced the MOR in visible light. Table 1 reveals the significant improvement of the peak current density of the PZ25B1 electrode in light, displaying a current density of 797.8 mA mg−1 of Pt, which is 1.62 times greater than in the dark (489.6 ± 2.8 mA mg−1 of Pt). To express the activities of all the electrodes in dark and light clearly, a histogram plot is exhibited in Fig. 7(c). The plot of the current enhancement in light vs. mass % of ZnO is shown in Fig. 7(d). It revealed that the light response gradually increases with the increasing mass percentage of ZnO and after a maximum value, it again decreases. The best visible light-responsive ternary composite PZ25B1/C has a peak current density of 797.8 (±4.3) mA mg−1 of Pt, which is 4.7, 3.4, and 2.9 times higher compared to PB/C, PZ/C, and PtXC72/C, respectively, indicating an enhanced and synergistic effect in photo-assisted electrocatalytic methanol oxidation. The photo-electrocatalytic activity of MOR can be guided by the electrochemically active specific surface area (ECSA) of Pt in the catalysts, particle dispersion in the surface, the interaction of Pt with metal oxide, and bandgap of the heterojunctions.13,24,26,46 For all the PZB heterojunctions, the smaller the size of Pt (from TEM), the larger the surface area of catalysts. The ECSA (m2 g−1) calculated from the reduction of PtO monolayer22 from cyclic voltammogram using 1 M NaOH solution (supporting document S1, Fig. S6, and Table S5, ESI†) decreases in the order: PZ5B1 (40.5) > PZ20B1 (32.5) > PZ25B1 (30.9) > PZ30B1 (24.6) > PZ1B1 (20.9) > PZ (18.5) > PZ1B5 (17.9) > PB (14). The data are consistent with the peak current densities from the CV study, found under dark conditions.
The Peak current density of PtXC72 (Pt size ca. 1.81 ± 1.9 nm) is greater than that of PZ (Pt size ca. 2.13 ± 0.4 nm) in the dark but the current enhancement in PZ is high compared to PtXC72 under visible light. This can be attributed to the negative shift of the onset potential of CO oxidation on the addition of ZnO to Pt in the presence of light, indicating CO removal from Pt surfaces and giving more surface area for further MOR. It can be understood that there is a linear relationship between ECSA and photo-enhanced methanol oxidation activity.46,84 The lower photo-electrooxidation (MOR) activity of PZ1B5 is due to the large Pt size (ca. 4.35 ± 0.7 nm), nonuniform particle distribution, and high bandgap energy. PB with Pt size ca. 3.51 ± 0.27 nm and low ECSA also accounts for its lowest efficiency. The PZ5B1 small Pt size (ca. 2.84 ± 0.30 nm) and the highest ECSA (40.5 m2 g−1) exhibit the highest peak current density in MOR but the enhancement of peak current under visible light illumination is very small. PZ25B1 composite having the smallest size of Pt (ca. 2.51 ± 0.44 nm) with ECSA 30.9 m2 g−1 increases methanol adsorption and the small band gap (2.05, 2.81 eV, Table 1) and also helps absorb more visible light and generates a greater number of holes that make the methanol oxidation faster under illumination. In PZ30B1, the average size of Pt increases, ECSA decreases, and the bandgap of bismuth oxide increases, consequently photo response is decreased.
To determine the charge transfer kinetic behavior of all the binary and ternary electrodes under visible light illumination, the Tafel slope of each electrode was calculated using the Tafel equation.8,85 The equilibrium potential of complete methanol oxidation was calculated based on the effect of pH and shift of potential between SCE and NHE in 1 M NaOH and was found as −1.0986 V.8,33,45,86 The Tafel plots of all the synthesized binary and ternary heterojunctions are shown in Fig. 7(e). The apparent exchange current density and slope of the simultaneous parallel oxidation of methanol indicated that the electrodes are better in the presence of light at the near equilibrium regions whereas these are not so good at comparatively higher potential.
The CA profiles of the synthesized catalysts in Fig. 7(f) exhibit an initial increase, then rapid decay accompanied by the successive achievement of the steady current. The fast fall of current is due to the aggregation of persistent intermediates on the surface of the electrode during oxidation and diffusion of methanol through the boundary layers.34,66,87 The steady current density obtained from the CA study is in the order: PB < PZ < PtXC72 < PZ1B1 < PZ30B1 < PZ25B1< PZ5B1 and ternary catalysts PZ25B1 and PZ5B1 are 2.9 and 4.7 times greater current density, respectively, than PB. From Table S6 (ESI†), it can be concluded that the Tafel slope of PB, PZ, and PZ25B1 composites in dark and light are different. This revealed that methanol oxidation by different binary and ternary catalysts under dark and light illumination passes through different reaction mechanisms with different selectivities of products.
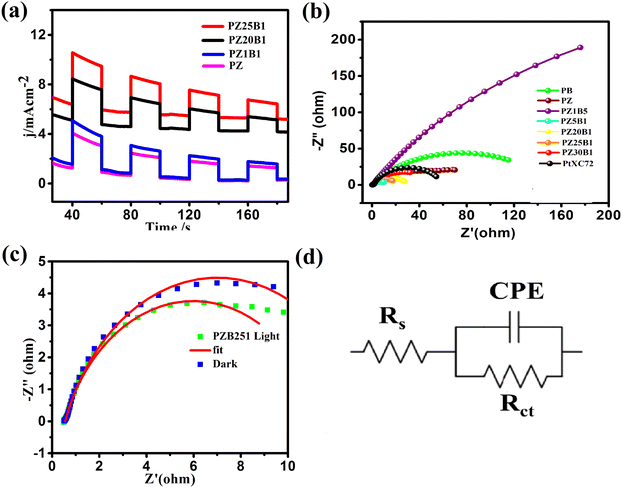
To evaluate the photo-electrocatalytic performance of the electrodes, the responsive photocurrents were measured under visible light irradiation. Fig. 8(a) exhibits the photo current–time (I–t) profile of PZ and a few PZB electrodes operated at −0.3 V (0.76 V vs. RHE) potential by interrupting light with a duration of 40 s. There are responsive photocurrents of intensity 3.88, 5.0, 8.45, and 10.58 mA cm−2 on the PZ, PZ1B1, PZ20B1and PZ25B1 electrodes, respectively, under illumination and the photocurrent response diminished promptly once the light irradiation was turned off. The photocurrent response of PZ25B1 displayed the highest current density, which was 2.7 times greater than the PZ electrode, suggesting a more efficient interfacial charge transfer in the methanol photo-oxidation.26
Moreover, EIS was studied in the 0.05 M CH3OH+ 1 M NaOH solution, and the data is recorded in the frequency range 0.1 Hz–100 kHz and interpreted for Nyquist plots to certify the interfacial charge transfers and internal resistance in the catalysts with and without light. Fig. 8(b) reveals that the diameter of the semicircle arc of the ternary PZB electrodes is smaller compared to the binary PB and PZ electrodes and exhibits the smallest diameter of PZ5B1, indicating higher and synergistic interfacial charge transfer in the ternary junction.
The corresponding equivalent circuit was fitted with the EIS data and various parameters such as charge transfer resistance (Rct), solution resistance (Rs), and constant phase element (CPE)88–90 are summarized in Table 2.
| Sample name | R s (Ω) (ESR) | R ct (Ω) (charge transfer resistance) | CPE-T (F cm−2) (Q) | CPE-P (n) |
|---|---|---|---|---|
| PB | 0.65913 | 150 | 0.003775 | 0.67429 |
| PZ | 0.68467 | 52.30 | 0.020366 | 0.75709 |
| PtXC72 | 0.6784 | 92.4 | 0.002436 | 0.7545 |
| PZ1B5 | 0.60472 | 795 | 0.004398 | 0.7128 |
| PZ5B1 | 0.54220 | 9.68 | 0.05036 | 0.75713 |
| PZ20B1 | 0.830 | 21.69 | 0.02864 | 0.76012 |
| PZ25B1 | 0.54909 | 12.92 | 0.054972 | 0.77391 |
| PZ30B1 | 0.85659 | 29.62 | 0.0098324 | 0.73835 |
The charge transfer resistance (Rct) follows the order: PZ1B5 >PB > PZ > PtXC72 > PZ30B1 > PZ20B1 > PZ25B1> PZ5B1. The Rct value of PtXC72 is lower than that of PB, suggesting a faster rate of MOR compared to PB.13,49 The PZ5B1 catalyst demonstrated the smallest semi-circular diameter (Rct = 9.68 Ω) among all the catalysts studied in the experiment. This indicates that the introduction of ZnO to Pt–Bi2O3 facilitates higher conductance of charges, thereby enhancing efficiency. The EIS plots of the representative ternary catalyst PZ25B1 under dark and light conditions are exhibited in Fig. 8c and the equivalent circuit in Fig. 8(d). It shows that the radius of the semicircle arc in light is smaller than that in the dark and the charge transfer conductance, Rct−1 value is 1.86 (24/12.92) times greater in the former than in the latter. This confirms that the light illumination enhanced the charge mobility of the electrode surface and thereby boosted the electro-catalytic reaction rate.
We also examined the function of photo-irradiation towards MOR by researching the effects of scan rates on the forward peak current density under visible light (Fig. S7 and Supporting document S2, ESI†). The study exhibits a linear variation in the ipversus v1/2 plot. Moreover, increased forward methanol oxidation peak and negative shift of the potential with the increase of potential scan rate (V) suggested that the MOR based on the Pt–ZnO–Bi2O3 electrode is also diffusion controlled multi-step process.91
Stability of the catalyst
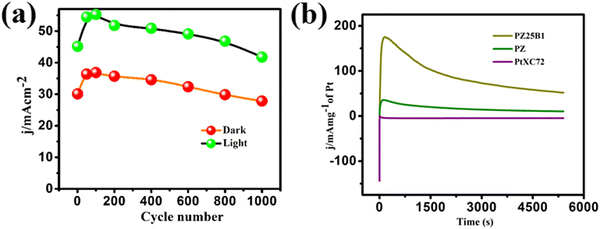
Multi-scan cycling of CV experiments and chronoamperometric curves are often used to check the catalyst stability. We operated a multi-scan CV test of 1000 cycles with the PZ25B1 electrode at 50 mV s−1 in the presence and absence of light. Fig. 9(a) displays that the forward peak current density of the PZ25B1/C electrode increases regularly up to 90 cycles and attains a maximum current of 36.85 and 55.27 mA cm−2 in dark and light, respectively. After that, the current density decreases slowly under dark conditions and relatively rapidly in the presence of light. The peak current density at the 1000th cycle in light is 50.23%, greater than its dark value, and retains 77.9% and 75.6% peak currents relative to the maximum values in dark and light, respectively. The results suggest that the visible light illumination on the ternary heterojunction catalyst can boost the electrocatalytic activity and stability in MOR.To establish the high stability, chrono-amperometry of PtXC72, PZ, and PZ25B1 electrodes was executed in the alkaline methanol solution under light irradiation at a potential −0.3 V (0.76 V vs. RHE) up to 5400 s. The rapid decline rate of the current density in chrono-amperometry indicates more poisoning of the catalyst by carbonaceous intermediates (mainly CO) during MOR. Fig. 9(b) shows that the PZ25B1 electrode has greater quasi-stationary current density and is highly stable up to 5400 s compared to both PtXC72 and PZ under light illumination. This further reveals that the combination of Bi2O3 and ZnO to Pt is beneficial for excellent stability and tolerance of CO, owing to the synergistic effects for both electrocatalytic and photo-electrocatalytic properties.92,93
To understand the surface poisoning effect and evaluate the CO tolerance of the synthesized binary and ternary catalysts, a CO oxidation experiment was performed under dark and light conditions. Fig. 10(a)–(d) shows the peak potential of CO oxidation. All these potentials were relative to SCE and bracket values of the potential are presented in the RHE scale. The potentials −0.196 (0.864), −0.193 (0.867), −0.167 (0.893) and −0.168 V (0.892 V) in the dark and the corresponding light values are −0.229 (0.831), −0.195 (0.865), −0.205 (0.855) and −0.196 V (0.864 V) for PZ, PtXC72, PZ25B1 and PZ30B1, respectively. From the figure, it is speculated that the irradiation of light leads to a negative shift in the peak potential values of PZ25B1 and PZ30B1 for CO oxidation. This reveals that ZnO–Bi2O3 support accelerates the oxidative removal of CO from the Pt surface and offeres an abundant hydroxyl source for the oxidation of CO and released active sites of Pt for further CO or methanol oxidation by visible light illumination.25,92–94 Pt–ZnO (PZ) has a lower peak potential compared to PtXC72 in both dark and light, indicating the higher anti-poisoning ability of PZ.13 The ECSA was calculated from CO stripping experiments (Fig. S8, ESI†) and the surface area determined by both the reduction of the PtO monolayer from cyclic voltammogram and CO stripping experiments followed the same order. The sequence of ECSA (m2 g−1): PZ5B1 (46 ± 3) > PZ25B1 (35.4 ± 2.5) > PZ30B1 (29.3 ± 3.3) > PtXC72 (27.1 ± 4.4) > PZ1B1 (21.8 ± 0.19) > PZ (20.7 ± 2.17) > PB (16.5 ± 2.43) is in good agreement with the MOR catalytic activity.
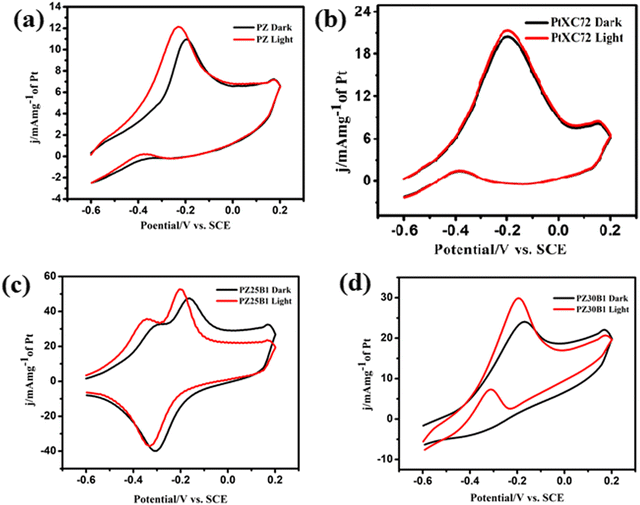 | ||
| Fig. 10 CO oxidation of catalysts (a) PZ (b) PtXC72 (c) PZ25B1 (d) PZ30B1 with and without light irradiation in the 0.5 M NaOH solution using a scan rate of 50 mV s−1 at 25 °C. | ||
Identification of methanol oxidation products
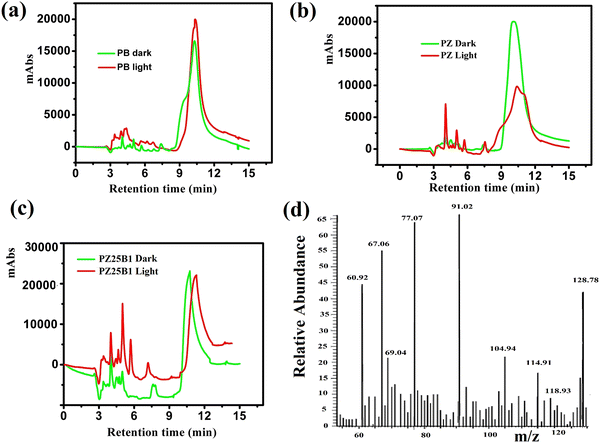
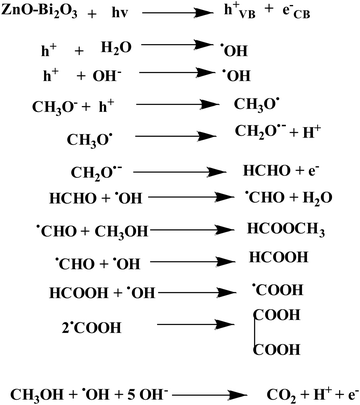
Fig. 11(a)–(c) shows the HPLC profiles of methanol oxidation products using PB, PZ, and PZ25B1 electrode catalysts, respectively, under dark and illuminated conditions. The retention times of 3.38, 3.88, 4.98, 6.64, and 10.08 min refer to the formation of oxalic acid, methyl formate, formaldehyde, carbonate, and formate, respectively.8,33,45 The retention time of each compound was also checked using its definite concentration for evidence and exhibited in Fig. S9 (ESI†). The products of the methanol oxidation reaction were also identified by GC-MS, as shown in Fig. 11(d) and Fig. S10 (ESI†). The m/z values 60, 68, 77, 90, and 127 corresponded to methyl formate (HCOOCH3), sodium formate (HCOONa), dimethoxy methane (C3H8O2), oxalic acid (C2H2O4), and sodium carbonate (Na2CO3), respectively.8 From HPLC and GCMS profiles, it revealed that sodium formate and carbonates are facilitated in the dark and light in PB. In PZ, the formation of HCHO is greater in the dark and the generated HCHO might react with CH3OH to form a greater amount of HCOOCH3 in the presence of light. But in the ternary heterojunction (PZ25B1), the tendency for the formation of methyl formate, oxalic acid, and sodium formate is high compared to the carbonate under light conditions.This suggests that the mechanism in light follows a distinct path from that in the dark. In the dark, carbonate is developed either from HCOONa or Pt–CO intermediates, but in the presence of light, the generation of holes occurs and the reaction of holes with the surface adsorbed OH−/H2O produces ˙OH radicals. Since the methoxy ion is a better hole scavenger than water, it forms CH3O˙ radical. This radical again produces CH2O˙− radical, which reacts with ˙OH radicals to form HCOOH, HCOOCH3, CH2(OCH3)2, CH3OCH3, C2H2O4, and carbonate by following the equations represented in Scheme 3 and Fig. 12.
Mechanism of oxidation
In dark conditions, CH3OH may adsorb dissociatively on the active sites of Pt to form Pt–CH2OH and after the gradual loss of the H atom produces CO32− through Pt–CO intermediates. Indeed, Pt–CH2OH may react with MOH (M = Zn, Bi) to form Pt–CH2OM, which further reacts with OH− and produces HCHO, HCOOH, and CO32− according to Scheme 2. The adsorbed intermediate Pt–CH2OM reacts with CH3OH to produce HCOOCH3, which is discussed in detail in our previous work.45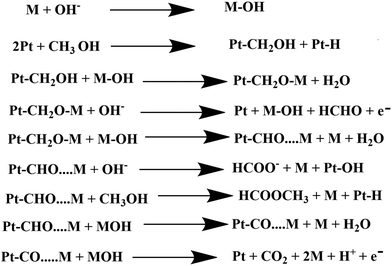 | ||
| Scheme 2 Electrocatalytic oxidation of methanol by the synthesized heterojunction in the dark condition. | ||
The superior performance of the ternary catalyst is ascribed to the two types of catalytic process: (1) electrocatalysis on the Pt surface and (2) photocatalysis on the ZnO–Bi2O3 surfaces. Upon irradiation of visible light on PZB heterojunctions, photoinduced electrons and holes are accumulated in the conduction bands and valence bands of Bi2O3 and ZnO, respectively.
The CB and VB edge potentials of p-Bi2O3, n-ZnO, and p–n junction (PZ25B1) were estimated by Mulliken electronegativity theory as follows:
| EVB = χ − Ec + 0.5 Eg |
| ECB = EVB − Eg |
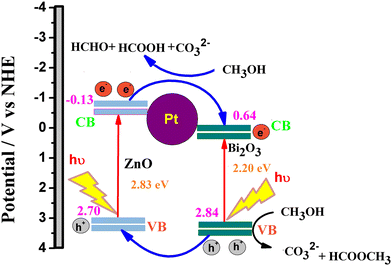
In the literature, absolute electronegativity values of ZnO and Bi2O3 are 5.79 and 6.24 eV, respectively.95,96 Based on the above equations, the computed VB values of ZnO and Bi2O3 are 2.98 eV and 3.09 eV, and the corresponding CB values are −0.40 eV and 0.38 eV, respectively. In the Pt–ZnO–Bi2O3 composite, n-type ZnO is made to contact with p-type Bi2O3 to form the p–n junction of ZnO–Bi2O3. In the PZ25B1 heterojunction, the bottom of CB and the top of VB in ZnO lie at −0.13 eV and 2.7 eV, and the corresponding band edges lie at 0.64 eV and 2.84 eV, respectively, for Bi2O3. Therefore, the decrease of the band gap values of ZnO and Bi2O3 occurs after the formation of the junction, and migration of the photogenerated electrons and holes becomes easier upon visible light illumination. The energy band structure diagram is schematically illustrated in Fig. 12. The work functions of Bi2O3, Pt, and ZnO are 6.33, 5.68, and 5.2 eV, respectively.8,97 This indicates that the value of the work function of Pt is greater than that of the n-type semiconductor ZnO but smaller than the p-type semiconductor Bi2O3. This difference in the work function causes an easy electron transfer from the CB band of ZnO to noble metal Pt and again transfer of an electron from Pt to the CB band of Bi2O3 to equilibrate the electron Fermi distribution at their interfaces and holes diffuse from the VB of Bi2O3 to the VB of ZnO, resulting in accumulation of negative charge and positive charge on Bi2O3 and ZnO regions, near the junction, respectively. Thus, light illumination enhances the formation of the Schottky barrier and dynamic interfacial electronic effect98 in the metal-semiconductor oxide interface, which leads to the reduction of the charge recombination and improved separation and circulation of electron–hole pairs and contributes to the boosting performance of MOR. The mechanism of MOR under visible light illumination is expressed in Scheme 3.
4. Conclusions
We successfully synthesized Pt decorated (1–5 nm) ZnO–Bi2O3 hetero-junctions of various compositions without any special capping agent and investigated their photo-electrocatalytic activity compared to electro-catalytic activity in the methanol oxidation reaction under visible light illumination. The formation of the ZnO–Bi2O3 heterojunction and the presence of Pt(0), PtO or Pt(OH)2, and PtO2 states on its surface shift the absorption edge from 254 nm to 371 nm in UV-visible spectra and the upward shift of the binding energy of Bi2O3 and downward shift of ZnO in XPS is due to the addition of ZnO to Pt–Bi2O3 indicating different Physico-chemical characteristics of the synthesized catalysts and the interaction of Pt impurity with the ZnO–Bi2O3 system. The optimum composition of the ternary system to have the maximum light activity is achieved when the mole ratio of ZnO and Bi2O3 is 25![[thin space (1/6-em)]](https://www.rsc.org/images/entities/char_2009.gif) :
:![[thin space (1/6-em)]](https://www.rsc.org/images/entities/char_2009.gif) 1, which is different from the best composition (5
1, which is different from the best composition (5![[thin space (1/6-em)]](https://www.rsc.org/images/entities/char_2009.gif) :
:![[thin space (1/6-em)]](https://www.rsc.org/images/entities/char_2009.gif) 1) for obtaining maximum current in the dark. The peak current density of the best ternary heterojunction was 1.6 times higher than the corresponding value in the dark during CV experiments under light illumination. The product study by GCMS and HPLC revealed the formation of more carbonate on Pt–Bi2O3 and formate on the Pt–ZnO electrode under dark conditions, but the additional formation of various products such as HCOOCH3, CH2(OCH3)2, and oxalic acid is increased under illuminated conditions, plausibly due to radical generation. Thus, the selectivity among the products in the two pathways suggests different and superimposed mechanisms in the oxidation of methanol in the presence of light. With the support of h+, the kinetics in light is faster than that in the dark for all compositions of the catalyst systems. Overall, the work demonstrated that the visible light active Bi2O3-based material is a potential alternative to accelerate the MOR.
1) for obtaining maximum current in the dark. The peak current density of the best ternary heterojunction was 1.6 times higher than the corresponding value in the dark during CV experiments under light illumination. The product study by GCMS and HPLC revealed the formation of more carbonate on Pt–Bi2O3 and formate on the Pt–ZnO electrode under dark conditions, but the additional formation of various products such as HCOOCH3, CH2(OCH3)2, and oxalic acid is increased under illuminated conditions, plausibly due to radical generation. Thus, the selectivity among the products in the two pathways suggests different and superimposed mechanisms in the oxidation of methanol in the presence of light. With the support of h+, the kinetics in light is faster than that in the dark for all compositions of the catalyst systems. Overall, the work demonstrated that the visible light active Bi2O3-based material is a potential alternative to accelerate the MOR.
Author contributions
Kamal Kanti Bera: conceptualization, methodology, validation, investigation, visualization, data curation, formal analysis, writing the original draft and manuscript revision; Malay Chakraborty: visualization, resources; Shyamal Kanti Bera: Investigation, resources; Anupam Chowdhury: investigation; Mahima Ranjan Das: resources; Mousumi Mandal: resources; Swapan Kumar Bhattacharya: supervision, methodology, formal analysis, writing – review and editing.Conflicts of interest
The authors declare no known conflicts of interest.Acknowledgements
The authors acknowledge Jadavpur University, Kolkata and National Institute of Science Education and Research (NISER), Bhubaneswar, India for all instrumental supports and one of the authors, Bera KK, admits the financial support from University Grant Commission (UGC, Grant no. 2121510262) Delhi, India. We confess gratitude to Prof. S. Das, Dept. of chemistry, JU for Chromatographic analysis.Notes and references
- Q. Lu, J. Huang, C. Han, L. Sun and X. Yang, Electrochim. Acta, 2018, 266, 305–311 CrossRef CAS
.
- J. Zheng, D. A. Cullen, R. V. Forest, J. A. Wittkopf, Z. Zhuang, W. Sheng, J. G. Chen and Y. Yan, ACS Catal., 2015, 5, 1468–1474 CrossRef CAS
.
- H. Jia, G. Chang, H. Shu, M. Xu, X. Wang, Z. Zhang, X. Liu, H. He, K. Wang, R. Zhu and Y. He, Int. J. Hydrogen Energy, 2017, 42, 22100–22107 CrossRef CAS
.
- K. S. Lee, H. Y. Park, H. C. Ham, S. J. Yoo, H. J. Kim, E. Cho, A. Manthiram and J. H. Jang, J. Phys. Chem. C, 2013, 117, 9164–9170 CrossRef CAS
.
- N. Kakati, J. Maiti, S. H. Lee, B. Viswanathan and Y. S. Yoon, Chem. Rev., 2014, 114, 12397–12429 CrossRef CAS PubMed
.
- A. Serov and C. Kwak, Appl. Catal., B, 2009, 90, 313–320 CrossRef CAS
.
- C. Roth, A. J. Papworth, I. Hussain, R. J. Nichols and D. J. Schiffrin, J. Electroanal. Chem., 2005, 581, 79–85 CrossRef CAS
.
- K. K. Bera, M. Chakraborty, S. K. Bera, M. Mondal, S. Chatterjee and S. K. Bhattacharya, ChemistrySelect, 2021, 6, 6586–6596 CrossRef
.
- M. Chakraborty, T. Dey, K. K. Bera and S. K. Bhattacharya, J. Mater. Sci., 2022, 57, 2021–2038 CrossRef CAS
.
- C. Zhai, M. Zhu, F. Pang, D. Bin, C. Lu, M. C. Goh and Y. Du, ACS Appl. Mater. Interfaces, 2016, 8, 5972–5980 CrossRef CAS PubMed
.
- S. Roy, S. Payra, S. Challagulla, R. Arora, S. Roy and C. Chakraborty, ACS Omega, 2018, 3, 17778–17788 CrossRef CAS PubMed
.
- Z. Li, S. Xu, Y. Shi, X. Zou, H. Wu and S. Lin, Chem. Eng. J., 2021, 414, 128814 CrossRef CAS
.
- C. Odetola, L. N. Trevani and E. B. Easton, Appl. Catal., B, 2017, 210, 263–275 CrossRef CAS
.
- A. S. Crampton, L. Cai, N. Janvelyan, X. Zheng and C. M. Friend, J. Phys. Chem. C, 2017, 121, 9910–9919 CrossRef CAS
.
- C. Zhai, M. Zhu, D. Bin, H. Wang, Y. Du, C. Wang and P. Yang, ACS Appl. Mater. Interfaces, 2014, 6, 17753–17761 CrossRef CAS PubMed
.
- C. Y. Su, Y. C. Hsueh, C. C. Kei, C. T. Lin and T. P. Perng, J. Phys. Chem. C, 2013, 117, 11610–11618 CrossRef CAS
.
- S. Jayaraman, T. F. Jaramillo, S. H. Baeck and E. W. McFarland, J. Phys. Chem. B, 2005, 109, 22958–22966 CrossRef CAS PubMed
.
- Y. Zhao, F. Wang, J. Tian, X. Yang and L. Zhan, Electrochim. Acta, 2010, 55, 8998–9003 CrossRef CAS
.
- A. A. Melvin, V. S. Joshi, D. C. Poudyal, D. Khushalani and S. K. Haram, ACS Appl. Mater. Interfaces, 2015, 7, 6590–6595 CrossRef CAS PubMed
.
- T. Maiyalagan and F. K. Nawaz, Catal. Commun., 2009, 10, 433–436 CrossRef CAS
.
- Y. Li, D. Deng, N. Chen, X. Xing, X. Xiao and Y. Wang, RSC Adv., 2016, 6, 83870–83879 RSC
.
- S. Sarkar, R. Jana, H. Vadlamani, S. Ramani, D. Mumbaraddi and S. C. Peter, ACS Appl. Mater. Interfaces, 2017, 9, 15373–15382 CrossRef CAS PubMed
.
- I. Jiménez-Morales, S. Cavaliere, D. Jones and J. Rozière, Phys. Chem. Chem. Phys., 2018, 20, 8765–8772 RSC
.
- M. Chakraborty, K. K. Bera, M. Mandal, A. Ray, S. Das and S. K. Bhattacharya, Solid State Sci., 2022, 129, 106903 CrossRef CAS
.
- L. Ye, Z. Li, X. Zhang, F. Lei and S. Lin, J. Mater. Chem. A, 2014, 48, 21010–21019 RSC
.
- H. Zhang, C. Zhai, P. Yang, C. Yuan, N. Fu and M. Zhu, Energy Technol., 2020, 8, 1900731 CrossRef CAS
.
- F. Lei, Z. Li, L. Ye, Y. Wang and S. Lin, Int. J. Hydrogen Energy, 2016, 41, 255–264 CrossRef CAS
.
- K. V. Özdokur, B. B. Çırak, B. Caglar, Ç. Çırak, S. M. Karadeniz, T. Kılınç, Y. Erdoğan and A. E. Ekinci, Vacuum, 2018, 155, 242–248 CrossRef
.
- M. Sun, J. Hu, C. Zhai, M. Zhu and J. Pan, Electrochim. Acta, 2017, 245, 863–871 CrossRef CAS
.
- Z. Li, L. Ye, F. Lei, Y. Wang, S. Xu and S. Lin, Electrochim. Acta, 2016, 188, 450–460 CrossRef CAS
.
- X. Bi, P. Bai, J. Lv, T. Yang, Z. Chai, X. Wang and C. Wang, Dalton Trans., 2019, 48, 3061–3073 RSC
.
- K. Drew, G. Girishkumar, K. Vinodgopal and P. V. Kamat, J. Phys. Chem. B, 2005, 109, 11851–11857 CrossRef CAS PubMed
.
- M. Chakraborty, K. K. Bera, M. Mandal, K. Ghorai, N. Sepay, M. R. Das and S. K. Bhattacharya, Appl. Surf. Sci., 2020, 148450 Search PubMed
.
- X. Hu, C. Ge, N. Su, H. Huang, Y. Xu, J. Zhang and N. Saito, J. Alloys Compd., 2017, 692, 848–854 CrossRef CAS
.
- K. W. Park, B. Han and J. M. Lee, Electrochem. Commun., 2007, 9, 1578–1581 CrossRef CAS
.
- M. Zlamal, J. M. Macak and P. Schmuki, Electrochem. Commun., 2007, 9, 2822–2826 CrossRef CAS
.
- A. Hameed, V. Gombac, T. Montini, M. Graziani and P. Fornasiero, Chem. Phys. Lett., 2009, 483, 254–261 CrossRef CAS
.
- K. K. Bera, R. Majumdar, M. Chakraborty and S. K. Bhattacharya, J. Hazard. Mater., 2018, 352, 182–191 CrossRef CAS PubMed
.
- S. Dutta, S. Chattopadhyay, A. Sarkar, M. Chakrabarti, D. Sanyal and D. Jana, Prog. Mater. Sci., 2009, 54, 89–136 CrossRef CAS
.
- K. Han, M. Xie, L. Zhang, L. Yan, J. Wei, G. Ji, Q. Luo, J. Lin, Y. Hao and C. Q. Ma, Sol. Energy Mater. Sol. Cells, 2018, 185, 399–405 CrossRef CAS
.
- C. B. Ong, L. Y. Ng and A. W. Mohammad, Renewable Sustainable Energy Rev., 2018, 81, 536–551 CrossRef CAS
.
- G. Kartopu, D. Turkay, C. Ozcan, W. Hadibrata, P. Aurang, S. Yerci, H. E. Unalan, V. Barrioz, Y. Qu, L. Bowen, A. K. Gürlek, P. R. Turan and S. J. C. Irvine, Sol. Energy Mater. Sol. Cells, 2018, 176, 100–108 CrossRef CAS
.
- C. A. Jaramillo-Páez, J. A. Navío, M. C. Hidalgo and M. Macías, Catal. Today, 2018, 313, 12–19 CrossRef
.
- J. Yi, P. Liang, X. liu, K. Wu, Y. Liu, Y. Wang, Y. Xia and J. Zhang, Energy Environ. Sci., 2018, 11, 3075–3095 RSC
.
- K. K. Bera, M. Chakraborty, S. R. Chowdhury, A. Ray, S. Das and S. K. Bhattacharya, Electrochim. Acta, 2019, 322, 134775 CrossRef CAS
.
- C. Odetola, L. N. Trevani and E. B. Easton, Energy Technol., 2018, 6, 1820–1825 CrossRef CAS
.
- M. C. L. Santos, C. A. Ottoni, R. F. B. de Souza, S. G. da Silva, M. H. M. T. Assumpção, E. V. Spinacé and A. O. Neto, Electrocatalysis, 2016, 7, 445–450 CrossRef CAS
.
- K. K. Bera, M. Chakraborty, M. Mondal, S. Banik and S. K. Bhattacharya, Ceram. Int., 2020, 46, 7667–7680 CrossRef CAS
.
- M. F. R. Hanifah, J. Jaafar, M. Aziz, M. H. D. Othman, A. F. Ismail, M. A. Rahman and S. Z. Salleh, Mater. Today: Proc., 2021, 46, 1889–1894 CAS
.
- S. Balachandran and M. Swaminathan, J. Phys. Chem. C, 2012, 116, 26306–26312 CrossRef CAS
.
- Y. Shi, L. Lijun, Y. Zhang, Y. Chen, S. Wang, L. Li, Y. Long and F. Jiang, Ceram. Int., 2017, 43, 7627–7635 CrossRef CAS
.
-
W. M. Riggs, L. E. Davis, J. F. Moulder and G. E. Muilenberg, Handbook of X-ray Photoelectron Spectroscopy, PerkinElmer, Eden Prairie, 1979 Search PubMed
.
-
J. F. Moulder, W. F. Stickle, P. E. Sobol and K. D. Bomben, Handbook of X-ray Photoelectron Spectroscopy, PerkinElmer, Eden Prairie, 1992 Search PubMed
.
- J. A. Horsley, J. Am. Chem. Soc., 1979, 101, 2870–2874 CrossRef CAS
.
- S. Balachandran, N. Prakash and M. Swaminathan, RSC Adv., 2016, 6, 20247–20257 RSC
.
- Z. Awaludin, M. Suzuki, J. Masud, T. Okajima and T. Ohsaka, J. Phys. Chem. C, 2011, 115, 25557–25567 CrossRef CAS
.
-
C. D. Wagner, W. M. Riggs, L. E. Davis and J. F. Moulder, Handbook of X-ray Photoelectron Spectroscopy, PerkinElmer, Eden Prairie, 1979 Search PubMed
.
- Y. Hu, X. Song, S. Jiang and C. Wei, Chem. Eng. J., 2015, 274, 102–112 CrossRef CAS
.
- F. B. Li and X. Z. Li, Chemosphere, 2002, 48, 1103–1111 CrossRef CAS PubMed
.
- M. S. H. Khan, M. S. Islam, M. R. Islam, A. Iskanderani, I. M. Mehedi and M. T. Hasan, IEEE Access, 2021, 9, 109510 Search PubMed
.
- A. Alshehri and K. Narasimharao, J. Mater. Res. Technol., 2020, 9, 14907–14921 CrossRef CAS
.
- X. N. Ren, Z. Y. Hu, J. Jin, L. Wu, C. Wang, J. Liu and B. L. Su, ACS Appl. Mater. Interfaces, 2017, 9, 29687–29698 CrossRef CAS PubMed
.
- D. Y. Chung, K. J. Lee and Y. E. Sung, J. Phys. Chem. C, 2016, 120, 9028–9035 CrossRef CAS
.
- F. He, J. Wang and D. Deng, J. Alloys Compd., 2011, 509, 6332–6336 CrossRef CAS
.
- H. Y. Jiang, J. Liu, K. Cheng, W. Sun and J. Lin, J. Phys. Chem. C, 2013, 117, 20029–20036 CrossRef CAS
.
- S. Wang, Y. Guan, L. Wang, W. Zhao, H. He, J. Xiao, S. Yang and C. Sun, Appl. Catal., B, 2015, 168, 448–457 CrossRef
.
- S. Ramachandran and S. Arumugam, ACS Omega, 2018, 3, 4798–4809 CrossRef CAS PubMed
.
- J. Wang, P. Liu, X. Fu, Z. Li, W. Han and X. Wang, Langmuir, 2008, 25, 1218–1223 CrossRef PubMed
.
- C. Wang, C. Shao, L. Wang, L. Zhang, X. Li and Y. Liu, J. Colloid Interface Sci., 2009, 333, 242–248 CrossRef CAS PubMed
.
- Y. Dimitriev, M. Krupchanska, Y. Ivanova and A. Staneva, J. Univ. Chem. Technol. Metall., 2010, 45, 39–42 CAS
.
- M. A. Girsova, G. F. Golovina, L. N. Kurilenko and T. V. Antropova, Glass Phys. Chem., 2015, 41, 93–97 CrossRef CAS
.
- V. Alexander, N. Evgueni, F. N. Savinov and Z. S. Jin, J. Photochem. Photobiol., A, 1999, 125, 113–117 CrossRef
.
- R. M. Mohamed, A. A. Ismail, M. W. Kadi, A. S. Alresheedi and I. A. Mkhalid, ACS Omega, 2021, 6, 6438–6447 CrossRef CAS PubMed
.
- D. Liu, J. Shen, Y. Xie, C. Qiu, Z. Zhang, J. Long and X. Wang, ACS Sustainable Chem. Eng., 2021, 9, 6380–6389 CrossRef CAS
.
- Z. Kovács, V. Márta, T. Gyulavári, Á. Ágoston, L. Baia, Z. Pap and K. Hernadi, J. Environ. Chem. Eng., 2022, 10, 107655 CrossRef
.
- N. S. Ferreira, J. M. Sasaki, R. S. Silva Jr, J. M. Attah-Baah and M. A. Macedo, Inorg. Chem., 2021, 60, 4475–4496 CrossRef CAS PubMed
.
- W. Xie, Z. Huang, R. Wang, C. Wen and Y. Zhou, J. Mater. Sci., 2020, 55, 11829–11840 CrossRef CAS
.
- A. K. Patra, V. Amoli, A. K. Sinha and D. Kim, ChemCatChem, 2020, 12, 2315–2323 CrossRef CAS
.
- H. W. Chen, Y. Ku and Y. L. Kuo, Water Res., 2007, 41, 2069–2078 CrossRef CAS PubMed
.
- G. Y. He, J. Huang, W. F. Liu, X. Q. Chen and X. Q. Sun, Mater. Technol., 2012, 27, 278–283 CrossRef CAS
.
- U. Ozgour, Y. I. Alivov, C. Liu, A. Teke, M. A. Reshchikov, S. Dogan, V. Avrutin, S. J. Cho and H. A. Morkoc, J. Appl. Phys., 2005, 98, 041301 CrossRef
.
- S. Monticone, R. Tufeu and A. V. Kanaev, J. Phys. Chem. B, 1998, 102, 2854–2862 CrossRef CAS PubMed
.
- Z. Qiu, K. S. Wong, M. Wu, W. Lin and H. Xu, Appl. Phys. Lett., 2004, 84, 2739–2741 CrossRef CAS
.
- Y. Xie, Z. Li, Y. Liu, Y. Ye, X. Zou and S. Lin, Appl. Surf. Sci., 2020, 508, 145161 CrossRef CAS
.
- S. RoyChowdhury, M. S. Banik, A. Mahajan and S. K. Bhattacharya, ChemistrySelect, 2018, 5, 9848–9856 CrossRef
.
- K. K. Bera, M. Chakraborty and S. K. Bhattacharya, IOP Conf. Ser.: Mater. Sci. Eng., 2021, 1080, 012013 CrossRef CAS
.
- S. R. Chowdhury, K. K. Bera, A. Ray, P. S. Bera, T. Maiyalagan and S. K. Bhattacharya, Int. J. Hydrogen Energy, 2020, 46, 14212–14224 CrossRef
.
- J. Datta, A. Dutta and S. Mukherjee, J. Phys. Chem. C, 2011, 115, 15324–15334 CrossRef CAS
.
- U. Rammelt and G. Reinhard, Electrochim. Acta, 1990, 35, 1045–1049 CrossRef CAS
.
- K. Kelm, S. Mathur and B. Saruhan, Chemosensors, 2014, 2, 69–84 CrossRef
.
- J. Hu, C. Zhai, C. Yu, L. Zeng, Z. Q. Liu and M. Zhu, J. Colloid Interface Sci., 2018, 524, 195–203 CrossRef CAS PubMed
.
- L. Ye, Z. Li, L. Zhang, F. Lei and S. Lin, J. Colloid Interface Sci., 2014, 433, 156–162 CrossRef CAS PubMed
.
- Y. Ye, Y. Wang, Z. Li, Y. Ye, Y. Liu, X. Zou and S. Lin, New J. Chem., 2019, 43, 17023–17032 RSC
.
- Z. Li, L. Ye, Y. Wang, S. Xu, F. Lei and S. Lin, RSC Adv., 2016, 6, 79533–79541 RSC
.
- C. Chang, H. C. Yang, N. Gao and S. Y. Lu, J. Alloys Compd., 2018, 738, 138–144 CrossRef CAS
.
- T. Ren, Z. Jin, J. Yang, R. Hu, F. Zhao, X. Gao and C. Zhao, J. Hazard. Mater., 2019, 377, 195–205 CrossRef CAS PubMed
.
- U. Ozgur, Y. I. Alivov, C. Liu, A. Teke, M. A. Reshchikov, S. Dogan, V. Avrutin, S. J. Cho and H. Morkoc, J. Appl. Phys., 2005, 98, 041301 CrossRef
.
- C. Ray and T. Pal, J. Mater. Chem. A, 2017, 5, 9465–9487 RSC
.
Footnote |
| † Electronic supplementary information (ESI) available. See DOI: https://doi.org/10.1039/d2ya00166g |
| This journal is © The Royal Society of Chemistry 2022 |

