 Open Access Article
Creative Commons Attribution 3.0 Unported Licence
Repulsive torques alone trigger crystallization of constant speed active particles†
Marine
Le Blay
* and
Alexandre
Morin
 *
*
Soft Matter Physics, Huygens-Kamerlingh Onnes Laboratory, Leiden University, P.O. Box 9504, 2300 RA Leiden, The Netherlands. E-mail: leblay@physics.leidenuniv.nl; morin@physics.leidenuniv.nl
First published on 7th April 2022
Abstract
We investigate the possibility for self-propelled particles to crystallize without reducing their intrinsic speed. We illuminate how, in the absence of any force, the competition between self-propulsion and repulsive torques determines the macroscopic phases of constant-speed active particles. This minimal model expands upon existing approaches for an improved understanding of crystallization of active matter.
Can crystals form out of constituents always in motion? Thermal systems, such as atomic and molecular matter, typically crystallize when the temperature is decreased, slowing down their constituents. This correlation between slowing down and crystallization also manifests itself in active materials,1–4 despite their constituents being self-propelled by intrinsic forces. This connection even extends to other solidification processes in such materials. A prominent example is collection of active Brownian particles which exhibit partial solidification known as motility-induced phase separation.5,6 As its name conveys, solidification in this case is entangled with speed reduction.7 Similarly, self-propelled Voronoi models8,9 describing biological tissues exhibit jamming, another solidification transition with reduction of the cells' mobility.10 All those systems share the common feature of constituents interacting through forces, inducing the reduction of their speed. Yet, active particles are also found to display rich collective behaviours when only interacting through torques. Then, only the orientation of self-propulsion is altered and their speed is preserved.11–15 From the seminal Vicsek's model,16 those systems have proved fruitful from a theoretical perspective17–20 and successful to account for living21 and synthetic22,23 systems. Since such active systems cannot, by design, comply with the above paradigm of solidification, their possibility to crystallize is intriguing. In this Communication, we prove that a minimal system of active particles interacting only via repulsive torques does crystallize. We rationalize its fluid and crystal phases through a detailed account of binary scattering collisions. We expect this system to complement force-based models for an ultimate comprehensive description of crystallization in out-of-equilibrium systems,24–30 as well as to account for experimental observations.31
Constant-speed, torque-only, model system
We introduce a minimal model of active particles moving at constant speed v0 and only interacting through repulsive torques. Particles, with instantaneous position r(t) and orientation![[p with combining circumflex]](https://www.rsc.org/images/entities/b_char_0070_0302.gif) (t) = (cos
(t) = (cos![[thin space (1/6-em)]](https://www.rsc.org/images/entities/char_2009.gif) θ, sin
θ, sin![[thin space (1/6-em)]](https://www.rsc.org/images/entities/char_2009.gif) θ), evolve in a two-dimensional box with periodic boundaries:
θ), evolve in a two-dimensional box with periodic boundaries:ṙi(t) = v0![[p with combining circumflex]](https://www.rsc.org/images/entities/b_char_0070_0302.gif) i(t), i(t), | (1) |
 | (2) |
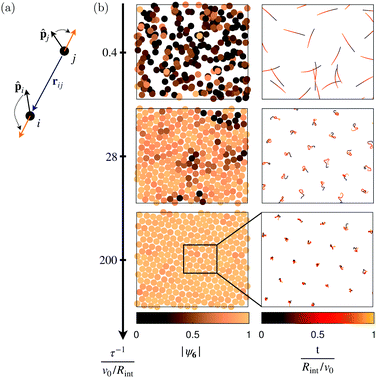
![[thin space (1/6-em)]](https://www.rsc.org/images/entities/char_2009.gif) exp(iψij), and the noise with amplitude Dθ obeys 〈ξi(t)〉 = 0 and 〈ξi(t)ξj(t′)〉 = δijδ(t − t′). We use the forward Euler method to carry out the numerical integration of eqn (1) and (2) with N = 270 particles. Particle i reorients to align in a time τ along rij away from its neighbours j located within an interaction range Rint, see Fig. 1a.
exp(iψij), and the noise with amplitude Dθ obeys 〈ξi(t)〉 = 0 and 〈ξi(t)ξj(t′)〉 = δijδ(t − t′). We use the forward Euler method to carry out the numerical integration of eqn (1) and (2) with N = 270 particles. Particle i reorients to align in a time τ along rij away from its neighbours j located within an interaction range Rint, see Fig. 1a.
Here, we focus on the competition between self-propulsion at v0 and repulsion of strength τ−1 in the limit of small noise Dθ = 0.4 × 10⁻⁴v0/Rint, thereby keeping the intrinsic persistence length constant to a value 2.5 × 10⁴Rint. This competition is parametrized by the dimensionless parameter τ−1/(v0/Rint) which compares the time for a particle to travel a distance of one interaction range Rint/v0 with the time for completion of re-orientation τ. In what follows, we express all quantities in units of Rint for lengths and Rint/v0 for times, and study the system varying its two control parameters τ−1 and the number density ρ.
Fig. 1b and Supplementary Videos (ESI†) illustrate that varying τ−1 at constant density ρ = 1.03 alters the nature of the macroscopic state of the system: it spontaneously transitions from a liquid state to a hexagonal crystal state. Indeed as τ−1 increases, the system structures itself and local orientational order builds up, as shown in Fig. 1b. The local bond-orientational order parameter defined as ψi6 = 〈ei6ψij〉j∈![[scr N, script letter N]](https://www.rsc.org/images/entities/char_e52d.gif) i goes from a broad distribution peaked around |ψ6| ≃ 0.4 at τ−1 = 0.4 to a narrowly peaked distribution at |ψ6| ≃ 1 at τ−1 = 200.‡ Together with this structuring, the dynamics of the constant-speed particles localize, as illustrated by the equal-duration trajectories shown in Fig. 1b.
i goes from a broad distribution peaked around |ψ6| ≃ 0.4 at τ−1 = 0.4 to a narrowly peaked distribution at |ψ6| ≃ 1 at τ−1 = 200.‡ Together with this structuring, the dynamics of the constant-speed particles localize, as illustrated by the equal-duration trajectories shown in Fig. 1b.
In this Communication, we explore first the properties of these liquid and crystal states as τ−1 increases, and then the mechanisms that shape the full two-dimensional phase diagram shown in Fig. 6.
Fluid phase and binary collisions
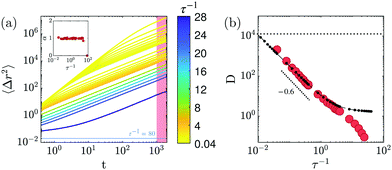
We first characterize the properties of the fluid phase occuring at low τ−1 and constant ρ = 1.03 and elucidate their microscopic origin. We quantify the dynamics of the particles by measuring their mean-squared displacement 〈Δr2〉 (t) = 〈(ri(t + t0) − ri(t0))2〉i,t0, shown in Fig. 2a. For all τ−1 < 28, the dynamics is diffusive at long times: 〈Δr2〉 = 4Dtα with α = 1, see Fig. 2a inset. The dynamics, however, slow down as τ−1 increases, which is captured by the decrease of the diffusion coefficient D on Fig. 2b. Note that any value of D is much lower than the translational diffusion caused by the orientationnal noise of eqn (2). This intrinsic diffusivity Dnoise![[triple bond, length as m-dash]](https://www.rsc.org/images/entities/char_e002.gif) v02/(2Dθ) = 1.25 × 10⁴ does not explain the liquid properties which can follow only from the interactions between particles. Interestingly, the diffusion coefficient decays algebraically as D ∼ (τ−1)−0.6, see Fig. 2b, thereby suggesting a unique origin for this decrease.
v02/(2Dθ) = 1.25 × 10⁴ does not explain the liquid properties which can follow only from the interactions between particles. Interestingly, the diffusion coefficient decays algebraically as D ∼ (τ−1)−0.6, see Fig. 2b, thereby suggesting a unique origin for this decrease.
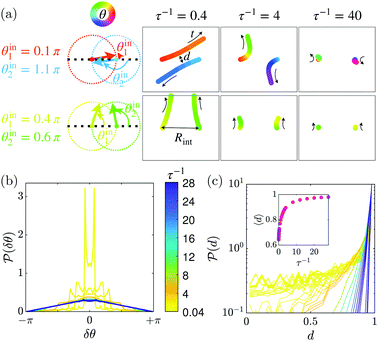
A naive but simple hypothesis is that particles experience uncorrelated binary scattering events alone. In this case, the diffusion coefficient would be given by the variance δθ2 of the scattering angle distribution as D = v02/(2v0Rintρδθ2).12 To assess the validity of this description, we investigate scattering events numerically. We integrate the trajectories of two particles upon collisions, with initial distance Rint and orientations θin1 and θin2 both uniformly distributed in [−π, +π]. Fig. 3a illustrates such collisions for three different values of τ−1 and two sets of initial orientations. Fig. 3b shows that increasing τ−1 broaden the distribution of scattering angles δθ = θouti − θini, with θouti the orientation after collision. The diffusion coefficients computed from the variance of these distributions collapse on the fluid coefficients up to τ−1 ≃ 5, as shown in Fig. 2b. This agreement proves that the properties of the fluids are quantitatively captured by uncorrelated binary collisions, a surprising result given their relatively high density ρ = 1.03.
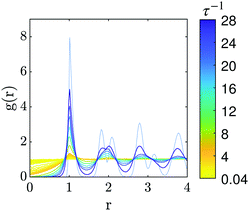
Above τ−1 > 5, however, the diffusion coefficient deviates from this simplified dynamics. The observation of binary scattering trajectories of Fig. 3a gives a hint into the mechanism at play: as τ−1 increases, not only scattering is enhanced but particles also stay further apart upon colliding. This observation is quantified in Fig. 3c through the distributions of the minimal distance during collision  . These distributions reveal that, around τ−1 ≃ 5, an excluded area around the particle position emerges: they virtually never come at contact,
 ![[scr P, script letter P]](https://www.rsc.org/images/entities/char_e52f.gif) (d = 0) ≃ 0. Importantly, this change in binary collision behaviour survives at the scale of the many-body system where depleted area forms and strengthen around each particles, as captured by the pair-correlation function g(r) in Fig. 4. Driven by this exclusion effect, the fluid evolves from an uncorrelated gas to a more and more structured liquid as τ−1 increases.
(d = 0) ≃ 0. Importantly, this change in binary collision behaviour survives at the scale of the many-body system where depleted area forms and strengthen around each particles, as captured by the pair-correlation function g(r) in Fig. 4. Driven by this exclusion effect, the fluid evolves from an uncorrelated gas to a more and more structured liquid as τ−1 increases.
Altogether, the slowing down of the dynamics and the structuring of the system result from the specifics of collisions between pairs of constant-speed particles repelling via torques. They put the system on the path of crystallization.
Crystal phase and effective mean-field cages
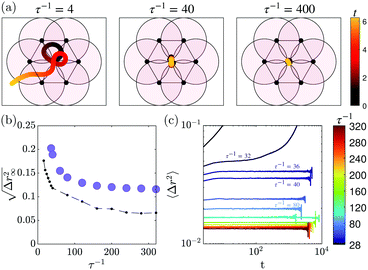
Crystallization indeed occurs at high τ−1, as captured by both structural and dynamical features. Bond-orientational order (Fig. 1) and positional order (Fig. 4) extend over the whole system size. The dynamics of the particles localize as shown by the saturation of the mean-squared displacement at τ−1 = 80 in Fig. 2a.The spontaneous formation of a stable yet dynamical crystal is quite unexpected. Indeed, a constant-speed particle interacting via repulsive torques with random lattices of quenched obstacles does never localize.12,13 We note two main differences between the many-body system described by eqn (1) and (2) and these isolated dynamics: particles are interacting with (i) constantly moving particles, which, (ii) assemble into a crystalline lattice instead of being randomly positioned. To elucidate which of this two differences accounts for the successful localization of the particles dynamics, we now introduce a mean-field description of the system in its crystalline state. We investigate the dynamics of a constant-speed particle initially positioned within a mean-field unit cell consisting of a regular hexagon of quenched particles. This configuration is depicted in Fig. 5a where typical trajectories are displayed for various values of τ−1. At low τ−1 particles escape the cell whereas at high τ−1 the cell act as an efficient trap. To assess the validity of this mean-field description, we quantify the localization of the dynamics through the typical cage sizes  , measured both from 103 mean-field trajectories and from many-body systems initialized into crystalline configurations, see Fig. 5b. Overall, the mean-field description predicts well the variations of the cage sizes in the crystal; with fluctuations in the positions of particles further accounting for the slightly larger sizes in the latter case. Besides, the threshold for efficient caging τc−1 = 16 agrees with the value yielding the loosest, possibly metastable, crystals, τ−1 = 36, see Fig. 5b and c.
Together, these results indicate that trapping by quenched crystalline lattices suffices to explain the localization of particles dynamics in the crystal phase. In particular, no emergent correlation between particles' velocities is required for crystallization.
Mechanisms of crystallization
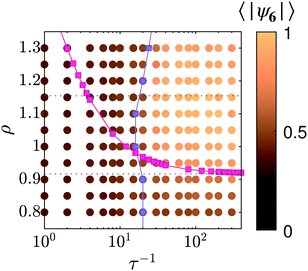
The above analyses put two mechanisms forward for the spontaneous crystallization: the increase of excluded-volume and the efficient caging within hexagonal cells. Which of this two mechanisms sets the onset of crystallization?To elucidate the role of each mechanism, we systematically construct the two-dimensional phase diagram varying the density ρ and the repulsion strength τ−1, see Fig. 6. It shows that crystals emerge in a confined region of the phase diagram.
First, we rely on the measure of the mean minimal distance upon binary collision (see Fig. 3c) to estimate excluded volume effects. Precisely, we map our system of soft particles onto hard disks of effective radius Reff(τ−1) = 〈d〉(τ−1) and define the effective density ρeff(τ−1) = ρHD/Reff2, where ρHD ≈ 0.92 is the number density of crystallization in hard-disk systems.32 Plotting the curve ρ = ρeff in Fig. 6 defines a region where crystallization would occur were the excluded-volume effect to trigger the transition. At high τ−1 ≥ 102, and upon increasing the density, crystallization occurs at ρeff: this perfect agreement with the hard disks description suggests that entropy dominates in this region.
In stark contrast, this hard-disk ansatz does not hold at smaller τ−1. This discrepancy is elucidated by accounting for efficient caging instead. Repeating the mean-field analysis for various densities we determine the threshold for caging τc−1(ρ), which varies little with ρ, see Fig. 6. This criterion based on interactions with nearest neighbours accurately defines the onset of crystallization in this region.
Overall, the above analysis evidences that the spontaneous crystallization of the system requires that both mechanisms, excluded-volume and efficient caging, simultaneously operate. These two simple lines of arguments, based on binary exclusion and mean-field caging, perform remarkably well to locate the crystallization region in the (ρ, τ−1)-plane.
Considering how the crystal accommodates densities higher than closed-packed hard disks value shows how non-trivial this agreement is. At those densities, the crystal does not reduce its lattice spacing. Instead some lattice positions get occupied by pairs of particles, leading to a small reduction of 〈|ψ6|〉, see Fig. 6. This genuine manifestation of the softness of the interactions between particles stresses the emergent character of the system crystallization.
Conclusion
Active particles moving at constant speed and interacting only through repulsive torques transition from fluids to crystals at high density and high repulsion strength (or, equivalently, low speeds). The properties of the fluid phase follow from the specifics of the binary collisions: scattering sets the diffusion up until the structuring of the fluid originating from exclusion during collisions. While the individual particles always keep their constant speed, they crystallize through the interplay of two mechanisms: sufficient excluded volume and efficient caging by the lattice neighbours.By demonstrating the crystallization of a minimal system of constant-speed active particles and gaining insights into the microscopic origins of its various states, we provide an approach complementary to repulsive-force systems, such as active Brownian particles, for investigating out-of-equilibrium melting. Refining the transition region and looking for possible hexatic32 or other24 intermediate phases are sensible next steps in this direction but require accessing larger system sizes and thus appropriate computational resources. Besides this fundamental perspective, this simple model can serve as a starting point to build and decipher eventual experimental realizations.
Author contributions
M. L. B. and A. M. designed and performed the research, and wrote the manuscript.Conflicts of interest
There are no conflicts to declare.References
- A. M. Menzel and H. Löwen, Phys. Rev. Lett., 2013, 110, 055702 CrossRef PubMed.
- C. A. Weber, C. Bock and E. Frey, Phys. Rev. Lett., 2014, 112, 168301 CrossRef PubMed.
- G. Briand and O. Dauchot, Phys. Rev. Lett., 2016, 117, 098004 CrossRef CAS PubMed.
- S. E. Moran, I. R. Bruss, P. Shoenhofer and S. C. Glotzer, Soft Matter, 2022, 18, 1044–1053 RSC.
- M. E. Cates and J. Tailleur, Annu. Rev. Condens. Matter Phys., 2015, 6, 219–244 CrossRef CAS.
- G. S. Redner, M. F. Hagan and A. Baskaran, Phys. Rev. Lett., 2013, 110, 055701 CrossRef PubMed.
- Y. Fily and M. C. Marchetti, Phys. Rev. Lett., 2012, 108, 235702 CrossRef PubMed.
- A. Pasupalak, L. Yan-Wei, R. Ni and M. P. Ciamarra, Soft Matter, 2020, 16, 3914–3920 RSC.
- S. Henkes, K. Kostanjevec, J. M. Collinson, R. Sknepnek and E. Bertin, Nat. Commun., 2020, 11, 1–9 CrossRef PubMed.
- D. Bi, X. Yang, M. C. Marchetti and M. L. Manning, Phys. Rev. X, 2016, 6, 021011 Search PubMed.
- H. Chaté, F. Ginelli, G. Grégoire and F. Raynaud, Phys. Rev. E, 2008, 77, 046113 CrossRef PubMed.
- O. Chepizhko and F. Peruani, Phys. Rev. Lett., 2013, 111, 160604 CrossRef PubMed.
- A. Morin, D. L. Cardozo, V. Chikkadi and D. Bartolo, Phys. Rev. E, 2017, 96, 042611 CrossRef.
- N. Bain and D. Bartolo, Nat. Commun., 2017, 8, 1–6 CrossRef PubMed.
- Y. Zhao, T. Ihle, Z. Han, C. Huepe and P. Romanczuk, Phys. Rev. E, 2021, 104, 044605 CrossRef CAS PubMed.
- T. Vicsek, A. Czirók, E. Ben-Jacob, I. Cohen and O. Shochet, Phys. Rev. Lett., 1995, 75, 1226 CrossRef CAS PubMed.
- J. Toner and Y. Tu, Phys. Rev. E: Stat. Phys., Plasmas, Fluids, Relat. Interdiscip. Top., 1998, 58, 4828 CrossRef CAS.
- A. Peshkov, E. Bertin, F. Ginelli and H. Chaté, Eur. Phys. J.: Spec. Top., 2014, 223, 1315–1344 Search PubMed.
- A. P. Solon, J.-B. Caussin, D. Bartolo, H. Chaté and J. Tailleur, Phys. Rev. E: Stat., Nonlinear, Soft Matter Phys., 2015, 92, 062111 CrossRef PubMed.
- R. Kürsten and T. Ihle, Phys. Rev. Lett., 2020, 125, 188003 CrossRef PubMed.
- W. Bialek, A. Cavagna, I. Giardina, T. Mora, E. Silvestri, M. Viale and A. M. Walczak, Proc. Natl. Acad. Sci. U. S. A., 2012, 109, 4786–4791 CrossRef CAS PubMed.
- A. Bricard, J.-B. Caussin, N. Desreumaux, O. Dauchot and D. Bartolo, Nature, 2013, 503, 95–98 CrossRef CAS PubMed.
- A. Morin and D. Bartolo, Phys. Rev. X, 2018, 8, 021037 CAS.
- J. Bialké, T. Speck and H. Löwen, Phys. Rev. Lett., 2012, 108, 168301 CrossRef PubMed.
- J. U. Klamser, S. C. Kapfer and W. Krauth, Nat. Commun., 2018, 9, 1–8 CrossRef CAS PubMed.
- G. Briand, M. Schindler and O. Dauchot, Phys. Rev. Lett., 2018, 120, 208001 CrossRef CAS PubMed.
- P. Digregorio, D. Levis, A. Suma, L. F. Cugliandolo, G. Gonnella and I. Pagonabarraga, J. Phys.: Conf. Ser., 2019, 012073 CrossRef CAS.
- E. S. Bililign, F. Balboa Usabiaga, Y. A. Ganan, A. Poncet, V. Soni, S. Magkiriadou, M. J. Shelley, D. Bartolo and W. Irvine, Nat. Phys., 2021, 1–7 Search PubMed.
- C. J. Reichhardt and C. Reichhardt, Nat. Phys., 2021, 1–2 Search PubMed.
- P. Digregorio, D. Levis, L. F. Cugliandolo, G. Gonnella and I. Pagonabarraga, Soft Matter, 2022, 18, 566–591 RSC.
- J. Zhang, R. Alert, J. Yan, N. S. Wingreen and S. Granick, Nat. Phys., 2021, 17, 961–967 Search PubMed.
- E. P. Bernard and W. Krauth, Phys. Rev. Lett., 2011, 107, 155704 CrossRef PubMed.
Footnotes |
| † Electronic supplementary information (ESI) available: Videos. See DOI: 10.1039/d2sm00256f |
‡ The average is performed over the neighbourhood ![[scr N, script letter N]](https://www.rsc.org/images/entities/char_e52d.gif) i given by Delaunay triangulation. i given by Delaunay triangulation. |
| This journal is © The Royal Society of Chemistry 2022 |

