In-materio reservoir working at low frequencies in a Ag2S-island network†
Motoharu
Nakajima
a,
Kazuki
Minegishi
a,
Yosuke
Shimizu
a,
Yuki
Usami
bc,
Hirofumi
Tanaka
 bc and
Tsuyoshi
Hasegawa
 *a
*a
aDepartment of Pure and Applied Physics, Graduate School of Advanced Science and Engineering, Waseda University, 3-4-1 Okubo, Shinjuku-ku, Tokyo 169-8555, Japan. E-mail: thasega@waseda.jp
bDepartment of Human Intelligence Systems, Graduate School of Life Science and Systems Engineering, Kyushu Institute of Technology, 2-4 Hibikino, Wakamatsu, Kitakyushu 808-0196, Japan
cResearch Center for Neuromorphic AI Hardware, Kyushu Institute of Technology, Japan
First published on 5th May 2022
Abstract
A Ag2S-island network is fabricated with surrounding electrodes to enable it to be used as a reservoir for unconventional computing. Local conductance change occurs due to the growth/shrinkage of Ag filaments from/into each Ag2S island in the reservoir. The growth/shrinkage of Ag filaments is caused by the drift of Ag+ cations in each Ag2S island, which results in a unique non-linear response as a reservoir, especially at lower frequencies. The response of the reservoir is shown to depend on the frequency and amplitude of the input signals. So as to evaluate its capability as a reservoir, logical operations were performed using the subject Ag2S-island network, with the results showing an accuracy of greater than 99%.
Introduction
Artificial intelligence, such as Deep Learning, has become a widely used conventional technique in our present-day information society. The remarkable progress of artificial intelligence, which has been achieved mainly by software-based systems running on von-Neumann computers,1 has enabled functions such as image recognition and voice recognition.2 However, there is some concern that von-Neumann computing is approaching its performance limits,3,4 which will in turn limit further progress in artificial intelligence. The development of hardware-based neuromorphic computers is one of the solutions to this problem.5Recently, much attention is being directed at reservoir computing (RC); an emerging computing method based on biological recurrent neural networks.6–8 Information processing in RC systems can be divided into two parts. In the first part, time-series signals are input into a reservoir, in which input signals are non-linearly transformed and output. In the second part, the output signals from a reservoir are linearly combined by multiplying a weight to give a computing result. In RC, what should be optimized by learning are the weights connecting a reservoir and the output layer, which is much different from deep learning where weights between all neighboring layers have to be optimized.9–11 In addition, research into materials-based RC systems is accelerating as a result of the ability of various physical and chemical systems to work as reservoirs,12 including the use of nanoparticles of Au,13–16 SnOx17,18 and Ag–Ag2S (core–shell).19,20 Nanowires have also been used to form reservoirs, as has been demonstrated by the use of networks of Ag–Ag2S nanowires9,21–23 and molecule-adsorbed carbon nanotubes.24–26 In previous studies, several systems9,19–23 have utilized atomic switch technology, which controls the growth and shrinkage of a Ag filament from Ag2S.27 In conventional atomic switch operation, a Ag filament grows in a gap between a Ag2S electrode and a counter metal electrode. By using the gap size and the Ag2S electrode size as the parameters, operating characteristics such as switching speed,28 volatile/nonvolatile operation29 and short-term plasticity/long-term potentiation30 can be controlled. For example, when being used as a single device, small gaps on the order of 1 nm enable faster nonvolatile switching, while large gaps on the order of 100 nm cause slower volatile/nonvolatile selective switching.31
In previous studies, Ag2S-based reservoirs used smaller gaps of molecules surrounding Ag2S nano-particles19,20 or an electrolyte between Ag2S nanowires.21–23 The frequency of input signals was on the order of 10 Hz or higher, depending on the gap size and the materials used in a given gap. When we use a reservoir as an edge-computing device, such as would be used for environment monitoring, it should respond to frequencies specific to the phenomenon to be detected. For instance, earthquakes are characterized by frequencies of 10 Hz or lower. It has recently been pointed out that monitoring ultra-low-frequency vibrations of about 0.01 Hz–0.1 Hz, which are caused by the slow slip phenomenon at plate boundaries,32,33 is important in detecting the premonitory symptoms of large-scale earthquakes.34 We have successfully developed a reservoir that can respond to the characteristic lower frequencies of earthquakes, which is just one example of the phenomena needing to be monitored.
In this study, a Ag2S-island network is used as a reservoir, in which network conductive channels are formed by Ag filaments grown from Ag2S islands,35 as schematically shown in Fig. 1. Ag filament growth also causes a change in the conductance of each Ag2S island, depending on the growth length of a given Ag filament and the size of a given Ag2S island,36 which also contributes to modify the conductance of each channel. Moreover, input signals induce gradients of Ag+ cations in Ag2S islands, which results in the formation of an inner electric potential in each Ag2S island. Namely, each Ag2S island works as a nano-battery.37 Due to these effects, Ag2S island networks show unique characteristics as reservoirs.
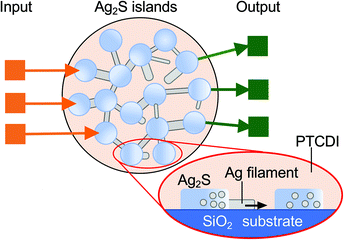 | ||
| Fig. 1 Schematic of a Ag2S island network-based reservoir. Ag filaments grown from Ag2S islands make conductive channels in the network. | ||
Experimental
In order to have a larger time constant in the reservoir operation, we made gaps larger than those used in previous studies.19,20 The Ag2S reservoir used in this experiment was fabricated as follows.First, surrounding Au electrodes were fabricated on a SiO2 substrate by EB-lithography. Two types of electrodes were created. One has four electrodes surrounding a circular reservoir area with a diameter of about 1 μm (Fig. 2a), the other has sixteen electrodes surrounding a circular reservoir area with a diameter of 30 μm. The smaller four-electrode sample was used to evaluate the fundamental characteristics, while the sixteen-electrode sample was used to demonstrate the logic operations.
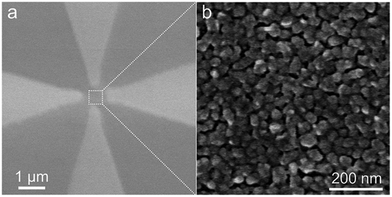 | ||
| Fig. 2 (a) SEM image of four electrodes surrounding the Ag2S island network. (b) Magnified SEM image of Ag2S islands. | ||
After the electrodes were made, Ag was thermally deposited onto the substrate annealed at 130 °C, while monitoring the current flowing between two of the electrodes with a bias application of 10 mV.38,39 When the monitored current increased to a few nA as a result of the tunneling current flowing among the Ag islands, the Ag deposition was stopped. The thickness of the Ag films deposited by this method was an average of 9.5 nm, which resulted in the formation of Ag islands 50–100 nm in size, with a spacing of a few nm between them.
Then, the Ag islands were sulfurized with sulfur vapor in a vacuum heating furnace at 70 °C for 20 min. During the process of crystalizing into Ag2S, Ag islands change their morphology, which usually widens the spacing between the islands. Since the growth of Ag filaments requires a small number of electrons,40,41 we deposited molecules of N,N′-dioctyl-3,4,9,10-perylenedicarboximide (PTCDI-C8) on the whole surface in order to ensure the presence of a small current, of less than 1 nA, to enable the Redox reaction (Ag+ + e− ↔ Ag). The thickness of the said molecular film was 3 nm. Fig. 2b shows an example of Ag2S islands observed by SEM before the deposition of PTCDI-C8. Sulfurization changed the morphology of the islands, that made gaps wider such as up to 10 nm although several adjacent islands were connected due to the morphology change.
The other techniques for fabricating a cation-migration based reservoir have also been reported, such as co-deposition of Ag and SiO2 for Ag+ cations’ migration in an amorphous SiO2 matrix.42,43 However, in this study, we needed crystalized Ag2S islands, in which Ag+ cations easily migrate, resulting in the employment of the abovementioned method.
Results and discussion
Basic characteristics of a Ag2S-island network
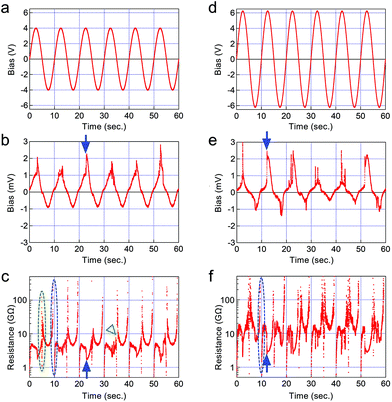
Non-linear transformation of input signals is the most important function performed by a reservoir. Fig. 3 shows the experimental results of non-linear transformation using the four electrode devices, where a sinusoidal wave Vin of 0.1 Hz was input with input amplitudes of (a) 4 V and (d) 6.2 V. The change in output signals Vout measured at one of the three electrodes are shown in Fig. 3b and e, respectively. Change in the resistance of the reservoir Rreservoir, which was calculated with a reference resistance R0 of 1 MΩ and eqn (1) where we assumed the inner potential Vinner was zero, are shown in Fig. 3c and f, respectively. | (1) |
The shape of the output waves Vout completely changed from those of the input signals, indicating that the Ag2S-island network has a non-linear transformation function. It can be seen that the larger amplitude (6.2 V) modified the input wave more than did the smaller amplitude (4 V). More interestingly, steep increases in output were frequently observed, such as those indicated by the blue arrows in Fig. 3b and e. These remarkable increases are assumed to be caused by the completion of the formation of Ag filaments that connect Ag2S islands. As observed in the operation of a single atomic switch, they also resulted in a steep decrease in resistance in the Ag2S-island network, as indicated by the blue arrows in Fig. 3c and f, where the resistance decreased (c) 3 GΩ and (f) 8 GΩ, respectively. Although the shape of the output signals changes a little in each period, non-linear transformations were repeatedly carried out, which is a requirement for time series prediction by RC.44,45
In the calculation of Rreservoir, we assumed that the inner potential Vinner is zero, which results in disconnection of the curves in Fig. 3c and f, as indicated by the dotted blue ellipses. Since the inner potential should be not so large, it was expected from eqn (1) that the disconnection caused by the neglect of Vinner happens only when Vin and Vout become small, e.g., every five sec. However, it was observed every ten sec. For instance, at 5 s in Fig. 3c, disconnection is not so visible, as indicated by the dotted green ellipse. These differences can be understood to be caused by the remaining Ag+ cations in a Ag2S island. When the polarity of Vin changes from positive to negative, such as at 5 s in Fig. 3a and d, Ag filaments will shrink. In other words, any Ag filament that still exists on a Ag2S island at that time causes the number of Ag+ cations in the Ag2S island to be smaller than it was before the growth of said Ag filament. Such small number of Ag+ cations can only form a smaller inner potential. On the other hand, when the polarity of Vin changes from negative to positive, such as at 10 s in Fig. 3a and d, Ag filaments will grow, meaning that almost all the Ag+ cations are still in a Ag2S island, and with a higher density at the side exhibiting growing. The larger number of Ag+ cations in such distribution can form a larger inner potential. By smoothly connecting the curves, it is expected that an inner potential, with a maximum of about 1 V, will be formed in the Ag2S-island network. When repeating the bias application, disconnection is also observed at a timing of every 5 s, as indicated by the green arrow in Fig. 3c. As can be seen in Fig. 3f, this becomes more visible when using a larger input bias, which can make a larger slope in the distribution of Ag+ cations in a Ag2S island.
Dependence on amplitude and frequency of input signals
We measured the change in resistance ΔR when a steep increase in the output bias was observed, as shown in Fig. 3b and e, because ΔR indicates the degree of Ag filament growth in a Ag2S-island network. Fig. 4a shows the change in ΔR as a function of input frequency. With both input amplitudes of 4 V and 6.2 V, ΔR decreases with increase in the input frequency, and becomes almost zero at around 0.5 Hz. This frequency range is much different from those of previous studies, in which frequencies of around 10 Hz were used,19–23 suggesting that the spacings between the Ag2S islands in this study were much larger than observed in those used in previous studies.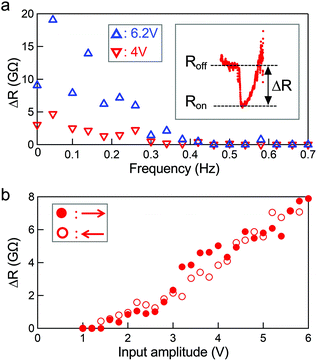 | ||
| Fig. 4 Dependence of ΔR on the frequency (a) and on the input amplitude (b). The definition of ΔR is shown in the inset. | ||
Fig. 4b shows the dependence of ΔR on the amplitude of a sinusoidal input wave of 0.1 Hz. As can be seen, ΔR increases with increase in the input amplitude, indicating that Ag filaments grow longer and/or thicker at larger input wave amplitudes. The measurements were done both from 1 V to 6 V and vice versa. Because no dependence on the measuring sequence was observed, we were able to conclude that Ag filament growth was stably repeated, at least in the bias range up to 6 V. Here, it should be noted that ΔR is almost zero when the input amplitude is less than 1.4 V or the input frequency is higher than 0.5 Hz. This should not be taken to mean that Ag2S-island networks function only with restricted conditions, which is not the case. Non-linear transformation is carried out even when ΔR is almost zero, as we were able to show by demonstrating logic operations in such condition (see ESI†).
Power spectral density
In the human brain, spike firing occurs with a temporal correlation of several hundred milliseconds,46,47 which is characterized by 1/f noise.48 Similar spatiotemporal fluctuations have been observed in various other systems, including physical reservoirs.21–23 Analysis of power spectral density (PSD) often reveals the characteristics of the phenomena that occurred inside. For instance, PSD analysis on a network of Ag nanowires coated with polyvinilpirrolydone (PVP) revealed the existence of two mechanisms that cause switching; one being low-frequency switching due to changes in connectivity across domains, and the other high-frequency switching due to Ag filament growth in the PVP film at individual junctions.49In this study, the PSD of a Ag2S-island network was measured by applying a constant voltage of 4 V between two electrodes at opposite sites, the result of which measurement is shown in Fig. 5. Fitting the spectrum to f−α gives α = 1.44, indicating the existence of interactive change in resistance in the Ag2S-island network. Namely, one Ag filament growth induces another Ag filament growth/shrinkage, in what amounts to a chain reaction, across the Ag2S-island network. When Ag filaments bridge Ag2S islands, the distribution of an electric potential in the Ag2S-island network can change remarkably, causing a highly interactive phenomena characterized by α larger than 1. No significant Ag filament growth is observed at frequencies higher than 10 Hz. As a result, resistance change in one area does not affect other areas. Then, α becomes small due to independent random switching in the network, such as 0.76 in this measurement. Because of such characteristics, Ag2S-island networks are more responsive to signals with lower frequencies.
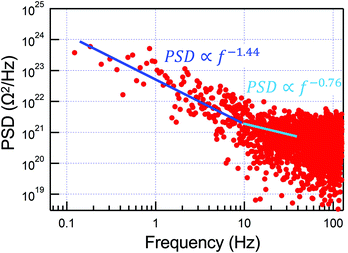 | ||
| Fig. 5 Power spectral density (PSD) measured by applying a constant bias of 4 V to a Ag2S island network. | ||
The PSD indicates Ag filament growth/shrinkage happens with various frequencies even at constant bias application, suggesting the stochastic switching in a Ag2S-island network. Actually, stochasticity in Ag filament growth was observed in a single device.49 By reducing the number of Ag2S islands between electrodes, stochasticity could be more visible for utilization in a reservoir computing. In order to eliminate the effect, the number of Ag2S islands between electrodes should be larger. These should depend on an application.
It has been reported that humidity often affects switching properties of cation-migration based memristive devices, where water molecules in a metal oxide layer enhance the diffusion of Ag+ cations50,51 and reduce the activation energy for Redox reactions.52 In this study, we did not observe such an effect while we did the measurements both in air and in vacuum. This may be due to the inherently larger diffusion constant of Ag+ cations in Ag2S53 and smaller activation energy for Redox reactions,54 comparing to the metal oxide-based systems such as used in ReRAMs.
Logic operation
Logic operation is demonstrated using a Ag2S-island network with 16 surrounding electrodes, as schematically shown in Fig. 6(a). The area of the Ag2S-island reservoir was expanded to 30 μm in diameter in order to arrange the 16 electrodes with a certain number of Ag2S islands, even in between adjacent electrodes. The 30 μm network also showed characteristics similar to those of a 1 μm-network, e.g., frequency and amplitude of input dependent non-linear transformation, as described in ESI.† We input the two binary signals Vin1 and Vin2, as shown in Fig. 6(b), to two electrodes located apart from each other, and the output signals, O1–O14, were measured at the remaining fourteen electrodes. Fig. 6(c) shows the fourteen measured output signals. Several output signals gradually changed over a few seconds, after the change in input signals, indicating the larger time constant of the Ag2S island network.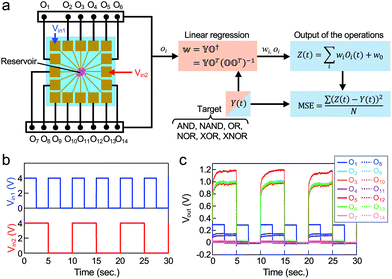 | ||
| Fig. 6 (a) Schematic of a reservoir used for logic operations. (b) Input signals. (c) Output signals. | ||
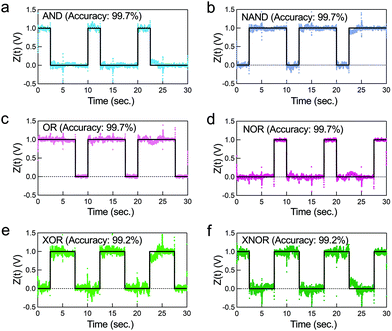
A linear combination Z(t) was made by eqn (2) using the fourteen outputs, the weights, w1–w14, and the bias, w0, where the weights and the bias were calculated by linear regression. The mean square error (MSE) between Z(t) and the target Y(t) was calculated by eqn (3), where N is 15![[thin space (1/6-em)]](https://www.rsc.org/images/entities/char_2009.gif) 000 in this experiment. We demonstrated six logic operations, i.e., AND, NAND, OR, NOR, XOR, and XNOR. The accuracy of each logic operation was calculated by eqn (4).55
000 in this experiment. We demonstrated six logic operations, i.e., AND, NAND, OR, NOR, XOR, and XNOR. The accuracy of each logic operation was calculated by eqn (4).55
 | (2) |
 | (3) |
| Accuracy = ((1 − MSE) × 100)% | (4) |
Fig. 7 shows the results of linear combinations to synthesize the six logic operations, with the target signals indicated by a solid black line in each panel. Including XOR and XNOR, which are difficult to synthesize due to the requirement of higher non-linearity in the transformation,17,38 all logic operations are carried out with a very high accuracy of over 99%. The fourteen outputs of O1–O14 are individually shown in ESI.† The optimized weights of w1–w14 for each logic operation are also found in ESI.† The results clearly suggest that Ag2S-island networks act as reservoirs capable of outputting high-dimensional representations of inputs.
We also did the same measurements by changing the two electrodes for input and using other fourteen electrodes for output. Regardless the selection, all the logic operations were achieved with the accuracy higher than 98%.
Conclusions
In this study, we developed an RC device using a Ag2S-island network as a reservoir, in which Ag filament growth from Ag2S islands, as a result of electrochemical reactions, causes a change in resistance between electrodes. Due to the longer time constant of the Ag filament growth compared to electron movement, a Ag2S-island network reservoir is more sensitive to frequencies lower than 0.5 Hz. The subject Ag2S-island network reservoir shows a non-linear transformation that depends on the frequency and amplitude of the input signals. Power spectral density analysis clearly indicates that the Ag filament growth induces interactive responses in a Ag2S-island network at said lower frequencies, while local resistance change independently occurs at higher frequencies. However, regardless of the frequencies, the Ag2S-island network reservoir non-linearly transforms input signals, as confirmed by the OR, AND, XOR, NOR, NAND, and XNOR logic operations at an high accuracy of over 99%. There are several phenomena characterized by lower frequencies, including low-frequency earthquakes, which it would be extremely beneficial to detect using edge devices in actual environments. The technique demonstrated in this study would contribute to develop of such systems.Author contributions
M. Nakajima and T. Hasegawa designed the whole part of the experiments and wrote the manuscript. M. Nakajima performed all the experiments. T. Hasegawa supervised the whole part of this study. K. Minegishi and Y. Shimizu analysed the experimental data. Y. Usami and H. Tanaka designed the experiments of logic operation. All authors reviewed and contributed to the manuscript.Conflicts of interest
There are no conflicts to declare.Acknowledgements
Part of this work was supported by JST/CREST Grant No. JPMJCR21B5.References
- W. Yi, K. K. Tsang, S. K. Lam, X. Bai, J. A. Crowell and E. A. Flores, Nat. Commun., 2018, 9, 4661 CrossRef PubMed.
- Y. LeCun, Y. Bengio and G. Hinton, Nature, 2015, 521, 436–444 CrossRef CAS PubMed.
- D. J. Frank, IBM J. Res. Dev., 2002, 46, 235–244 Search PubMed.
- A. Barabasi, Science, 2009, 325, 412–413 CrossRef CAS PubMed.
- L. A. Camunas-Mesa, B. Linares-Barranco and T. Serrano-Gotarredona, Materials, 2019, 12, 2745 CrossRef PubMed.
- M. Inubushi and K. Yoshimura, Sci. Rep., 2017, 7, 10199 CrossRef PubMed.
- W. Maass, T. Natschläger and H. Markram, Neural Comput., 2002, 14, 2531–2560 CrossRef PubMed.
- C. Gallicchio, A. Micheli and L. Pedrelli, Neurocomputing, 2017, 268, 87–99 CrossRef.
- H. O. Sillin, R. Aguilera, H.-H. Shieh, A. V. Avizienis, M. Aono, A. Z. Stieg and J. K. Gimzewski, Nanotechnology, 2013, 24, 384004 CrossRef PubMed.
- C. Du, F. Cai, M. A. Zidan, W. Ma, S. H. Lee and W. D. Lu, Nat. Commun., 2017, 8, 2204 CrossRef PubMed.
- M. Lukoševičius and H. Jaeger, Comput. Sci. Rev., 2009, 3, 127–149 CrossRef.
- K. Vandoorne, P. Mechet, T. V. Vaerenbergh, M. Fiers, G. Morthier, D. Verstraeten, B. Schrauwen, J. Dambre and P. Bienstman, Nat. Commun., 2014, 5, 3541 CrossRef PubMed.
- C. Minnai, A. Bellacicca, S. A. Brown and P. Milani, Sci. Rep., 2017, 7, 7955 CrossRef PubMed.
- M. Mirigliano, F. Borghi, A. Podestá, A. Antidormi, L. Colombo and P. Milani, Nanoscale Adv., 2019, 1, 3119 RSC.
- M. Mirigliano, D. Decastri, A. Pullia, D. Dellasega, A. Casu, A. Falqui and P. Milani, Nanotechnology, 2020, 31, 234001 CrossRef CAS PubMed.
- Y. Viero, D. Guérin, A. Vladyka, F. Alibart, S. Lenfant, M. Calame and D. Vuillaume, Adv. Funct. Mater., 2018, 28, 1801506 CrossRef.
- S. K. Bose, J. B. Mallinson, R. M. Gazoni and S. A. Brown, IEEE Trans. Electron Devices, 2017, 64, 5194 CAS.
- P. Y. Le, B. J. Murdoch, A. J. Barlow, A. S. Holland, D. G. McCulloch, C. F. McConville and J. G. Partridge, Adv. Electron. Mater., 2020, 6, 2000081 CrossRef CAS.
- Hadiyawarman, M. Eguchi and H. Tanaka, Jpn. J. Appl. Phys., 2020, 59, 015001 CrossRef CAS.
- Hadiyawarman, Y. Usami, T. Kotooka, S. Azhari, M. Eguchi and H. Tanaka, Jpn. J. Appl. Phys., 2021, 60, SCCF02 CrossRef CAS.
- A. V. Avizienis, H. O. Sillin, C. Martin-Olmos, H.-H. Shieh, M. Aono, A. Z. Stieg and J. K. Gimzewski, PLoS One, 2012, 7, e42772 CrossRef CAS PubMed.
- E. C. Demis, R. Aguilera, K. Scharnhorst, M. Aono, A. Z. Stieg and J. K. Gimzewski, Jpn. J. Appl. Phys., 2016, 55, 1102B2 CrossRef.
- K. S. Scharnhorst, J. P. Carbajal, R. C. Aguilera, E. J. Sandouk, M. Aono, A. Z. Stieg and J. K. Gimzewski, Jpn. J. Appl. Phys., 2018, 57, 03ED02 CrossRef.
- H. Tanaka, M. Akai-Kasaya, A. T. Yousefi, L. Hong, L. Fu, H. Tamukoh, D. Tanaka, T. Asai and T. Ogawa, Nat. Commun., 2018, 9, 2693 CrossRef PubMed.
- Y. Usami, B. van de Ven, D. G. Mathew, T. Chen, T. Kotooka, Y. Kawashima, Y. Tanaka, Y. Otsuka, H. Ohoyama, H. Tamukoh, H. Tanaka, W. G. van der Wiel and T. Matsumoto, Adv. Mater., 2021, 33, 2102688 CrossRef CAS PubMed.
- D. Banerjee, T. Kotooka, S. Azhari, Y. Usami, T. Ogawa, J. K. Gimzewski, H. Tamukoh and H. Tanaka, Adv. Intell. Syst., 2022, 2100145 CrossRef.
- K. Terabe, T. Hasegawa, T. Nakayama and M. Aono, Nature, 2005, 433, 47 CrossRef CAS PubMed.
- A. Nayak, T. Tsuruoka, K. Terabe, T. Hasegawa and M. Aono, Nanotechnology, 2011, 22, 235201 CrossRef PubMed.
- T. Hino, T. Hasegawa, H. Tanaka, T. Tsuruoka, K. Terabe, T. Ogawa and M. Aono, Nanotechnology, 2013, 24, 384006 CrossRef CAS PubMed.
- T. Ohno, T. Hasegawa, T. Tsuruoka, K. Terabe, J. K. Gimzewski and M. Aono, Nat. Mater., 2011, 10, 591 CrossRef CAS PubMed.
- M. Araki and T. Hasegawa, Jpn. J. Appl. Phys., 2020, 59, 040605 CrossRef CAS.
- N. Poiata, J.-P. Vilotte, N. M. Shapiro, M. Supino and K. Obara, J. Geophys. Res.: Solid Earth, 2021, 126, e2021JB022138 Search PubMed.
- K. Matsuda, S. Ide, K. Ohta and T. Matsuzawa, Earth, Planets Space, 2020, 72, 47 CrossRef.
- K. Obara and A. Kato, Science, 2016, 353, 253–257 CrossRef CAS PubMed.
- K. Ojima, T. Hasegawa, Y. Naitoh, H. Shima and H. Akinaga, Jpn. J. Appl. Phys., 2020, 59, SN1011 CrossRef CAS.
- N. Mishima, T. Tsuruoka and T. Hasegawa, Jpn. J. Appl. Phys., 2021, 60, SE1001 CrossRef CAS.
- I. Valov, E. Linn, S. Tappertzhofen, S. Schmelzer, J. van den Hurk, F. Lentz and R. Waser, Nat. Commun., 2013, 4, 1771 CrossRef CAS PubMed.
- Y. Naitoh, K. Albrecht, Q. Wei, K. Yamamoto, H. Shima and T. Ishida, RSC Adv., 2017, 7, 53503 RSC.
- K. Shinotsuka, L. Shen, K. Dai, H. Tokuno, S. Miura, T. Segawa, M. Kondo and Y. Hatta, Jpn. J. Appl. Phys., 2019, 58, 032001 CrossRef CAS.
- T. Hasegawa, K. Terabe, T. Tsuruoka and M. Aono, Adv. Mater., 2012, 24, 252–267 CrossRef CAS PubMed.
- K. Terabe, T. Nakayama, T. Hasegawa and M. Aono, J. Appl. Phys., 2002, 91, 10110 CrossRef CAS.
- Z. Wang, S. Joshi, S. E. Savel'ev, H. Jiang, R. Midya, P. Lin, M. Hu, N. Ge, J. P. Strachan, Z. Li, Q. Wu, M. Barnell, G.-L. Li, H. L. Xin, R. S. Williams, Q. Xia and J. J. Yang, Nat. Mater., 2017, 16, 101–108 CrossRef CAS PubMed.
- R. Midya, Z. Wang, S. Asapu, X. Zhang, M. Rao, W. Song, Y. Zhuo, N. Upadhyay, Q. Xia and J. J. Yang, Adv. Intell. Syst., 2019, 1, 1900084 CrossRef.
- E. Bollt, Chaos, 2021, 31, 013108 CrossRef CAS PubMed; D. J. Gauthier, E. Bollt, A. Griffith and W. A. S. Barbosa, Nat. Commun., 2021, 12, 5564 CrossRef PubMed.
- J. R. Manning, J. Jacobs, I. Fried and M. J. Kahana, J. Neurosci., 2009, 29, 13613–13620 CrossRef CAS PubMed.
- K. J. Miller, L. B. Sorensen, J. G. Ojemann and M. den Nijs, PLoS Comput. Biol., 2009, 5, e1000609 CrossRef PubMed.
- A. Mazzoni, F. D. Broccard, E. Garcia-Perez, P. Bonifazi, M. E. Ruaro and V. Torre, PLoS One, 2007, 2, e439 CrossRef PubMed.
- A. Diaz-Alvarez, R. Higuchi, P. Sanz-Leon, I. Marcus, Y. Shingaya, A. Z. Stieg, J. K. Gimzewski, Z. Kuncic and T. Nakayama, Sci. Rep., 2019, 9, 14920 CrossRef PubMed.
- C. Arima, A. Suzuki, A. Kassai, T. Tsuruoka and T. Hasegawa, J. Appl. Phys., 2018, 124, 152114 CrossRef.
- M. Mikami, N. Tanahashi, T. Tsuruoka and T. Hasegawa, Jpn. J. Appl. Phys., 2021, 60, SCCF05 CrossRef CAS.
- B. Xiao and S. Watanabe, Sci. Technol. Adv. Mater., 2019, 20, 580–588 CrossRef CAS PubMed.
- I. Valov and T. Tsuruoka, J. Phys. D: Appl. Phys., 2018, 51, 4134001 CrossRef.
- Y. H. Ohashi, K. Ohashi, M. Terada and Y. Ohba, J. Phys. Soc. Jpn., 1985, 54, 752–761 CrossRef CAS.
- A. Nayak, T. Tamura, T. Tsuruoka, K. Terabe, S. Hosaka, T. Hasegawa and M. Aono, J. Phys. Chem. Lett., 2010, 1, 604–608 CrossRef CAS.
- D. Banerjee, S. Azhari, Y. Usami and H. Tanaka, Appl. Phys. Express, 2021, 14, 105003 CrossRef CAS.
Footnote |
| † Electronic supplementary information (ESI) available. See DOI: https://doi.org/10.1039/d2nr01439d |
| This journal is © The Royal Society of Chemistry 2022 |

