 Open Access Article
Creative Commons Attribution 3.0 Unported Licence
Computational characterization of charge transport resiliency in molecular solids†
Balaji Sesha Sarath
Pokuri
 a,
Sean M.
Ryno
 b,
Ramin
Noruzi
a,
Chad
Risko
 *b and
Baskar
Ganapathysubramanian
 *a
*a
aDepartment of Mechanical Engineering, Iowa State University, Ames, Iowa, USA. E-mail: baskarg@iastate.edu
bDepartment of Chemistry, University of Kentucky, Lexington, Kentucky, USA. E-mail: chad.risko@uky.edu
First published on 1st March 2022
Abstract
Organic semiconductors have found utility in a diverse array of applications. A key property impacting device performance is the charge transport mobility of the molecular solids making up the active layer in these devices. There is increasing interest in accessing, quantifying, and understanding the resilience of charge transport mobility to thermal, mechanical, and chemical perturbations in molecular solids. Here, we integrate molecular simulations with graph characterization to quantify the resilience of charge transport. We consider all-atom simulations of the PTB7 system and build on earlier graph approaches to rapidly characterize the charge mobility of the PTB7 molecular simulations. We introduce graph centrality measures to rank order monomers in the molecular solid in terms of their importance to charge transport. We then systematically quantify the impact of ‘deactivating’ an increasing number of monomers on the overall charge transport mobility. This provides a measure of the resiliency of the molecular solid to increasing amounts of structural perturbations. We find that charge transport in the PTB7 system considered here is surprisingly resilient to significant amounts of monomers removed from participation in charge transport. This method provides a quantitative approach to reason about charge transport resilience and can be used to design resilient molecular solids.
Design, System, ApplicationWe utilize graph theoretic approaches to rapidly and efficiently characterize the transport properties of molecular solids. The graph theoretic approach naturally assimilates and accounts for a wide variety of constraints impacting charge transport (inter-chain vs. intra-chain, impact of chain rotation, impact of geometric slip). We subsequently utilize notions of graph centrality measures to identify the most (and least) important monomer impacting charge transport and systematically quantify the resilience of the charge transport in the molecular solid by removing an increasing number of monomers from participating in charge transport. This approach provides a fast, rigorous and systematic framework for evaluating the resilience of molecular solids and could be used for molecular design for resilient transport under mechanical, thermal and chemical perturbations. |
1 Introduction
Organic semiconductors (OSC), in particular OSC derived from π-conjugated polymers (pOSC), offer promise for flexible and stretchable electronics due to the inherent mechanical properties often associated with plastics. pOSC have seen utility across a diverse array of applications including solar cells, thermoelectrics, batteries, chemical, radiological, and biological sensors, electronic skins, displays and lighting, and neuromorphic computing. In all these applications, a key figure of merit that is optimized is the charge carrier efficiency and its behavior under various stimuli (for instance, mechanical stress, thermal effects, and oxidation). However, description of charge-carrier transport in pOSC remains a challenge,1–7 limiting technological advances in this field.A critical issue in the endeavor to describe charge-carrier transport in pOSC is the multi-scale nature of the aspects that impact charge-carrier transport and the fact that the degree of order (or disorder) can vary substantially over these scales. Models to describe charge-carrier transport in pOSC have been adopted from both ideally ordered (i.e., band structure) and disordered (i.e., charge-hopping or polaron-based models) systems and combinations thereof. This duality arises because regions in a pOSC can be treated as having large degrees of order – i.e., in the crystalline regions in a semi-crystalline polymer or along an (uninterrupted) single polymer chain – or they can be completely disordered – i.e., in amorphous regions. Importantly, the relative degree of order accessed by a pOSC can be influenced both by the polymer synthesis (e.g., polymer dispersity and molecular weight) and processing of the pOSC, such that the same material can lead to very different performance metrics in device applications. Additionally, this can change as a function of operating conditions, including via mechanical stimuli (stretching and bending), thermal fluctuations, and oxidation.
While there exist molecular-scale design rules that can be used to describe polymers (up to 10s of nanometers) that comprise pOSC (100s of nanometers),8 the lack of multi-scale structure–function relationships and limited insight into how charge-carriers are transported hinder the a priori design of pOSC with robust semiconductor performance metrics. Recent work on (near) device scale modeling using kinetic Monte Carlo based approaches9 suggests a very promising avenue of analysis, but such approaches are currently limited to a small number of sample evaluations due to the associated computational costs. This precludes computational assessment of the robustness of the structure of molecular solids when considering charge-carrier transport.
Motivated by these challenges, this work seeks to extend our previous work10 on using graph theory approaches to quantify the resiliency/robustness of molecular structures to charge-carrier transport. This approach is based on representing the structure of molecular solids as a graph, where each monomer (or voxel) is represented as a node on the graph and local charge-carrier transport events (hops) between nodes are represented by weighted, directed edges. Representing the structure of a molecular solid as an equivalent graph allows deploying a rich array of graph algorithms to quantitatively extract a diverse array of features. Graph theory is particularly appealing for modeling transport as it enables (a) abstracting out material specific details into a small set of features (graph edge weights, graph connectivity, and graph node color), thus allowing generalization across material systems, geometries, and dimensions, (b) utilization of sophisticated, highly optimized graph algorithms that enable computationally efficient assessment of large systems, and (c) natural extensions to account for more complex effects including first-principles based inputs like overlap integrals. Graph methods have recently been used to efficiently extract and analyze a diverse array of atomistic features (representing, for instance, correlations, shape/size/orientation distributions, and topology) related to electronic phenomena in molecular solids both in ordered and disordered structures,11 as well as ionic solutions.12,13
While previous graph characterization studies have focused on quantifying various transport features of molecular solids,14,15 here, we focus instead on quantifying how robust (or resilient) the charge-carrier transport features of a polymer solid are to perturbations in structure. We utilize notions of graph centrality measures that have been extensively utilized in graph and network analysis (for instance, social networks, epidemiological studies, and transportation and logistics networks, as well as brain networks) to identify the most important (and least important) monomers in a polymer solid consisting of chains of a high-performance donor molecule, PTB7, poly[[4,8-bis[(2-ethylhexyl)oxy]benzo[1,2-b:4,5-b′]dithiophene-2,6-diyl][3-fluoro-2-[(2-ethylhexyl)carbonyl]thieno[3,4-b]thiophenediyl]]. This graph theory based resiliency analysis provides quantitative evidence of the resilience of the charge transport characteristics of molecular solids to fairly significant perturbations.
2 Methods
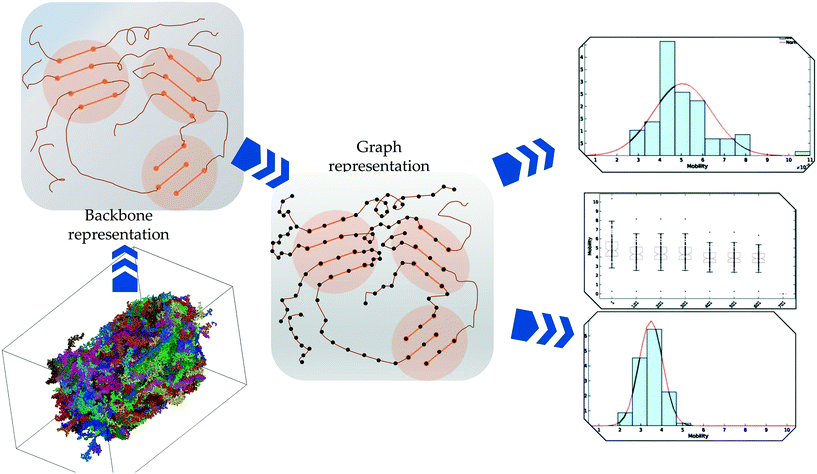
The overall procedures are presented in Fig. 1. Each of the stages in the procedure is elaborated below:2.1 Molecular dynamics simulations of PTB7
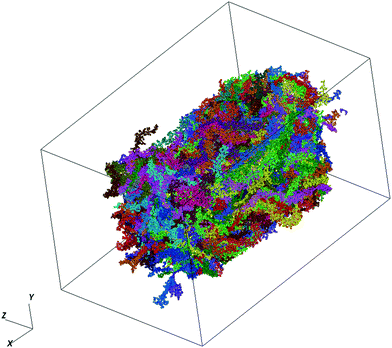
We make use of PTB7 as the chemical constituent making up the pOSC solid. The molecular solid is the outcome of a fully atomistic molecular dynamics (MD) simulation of the local solid-state structure of PTB7. This simulation was originally reported by Ryno et al.16 and is used here as input for the graph-based approach. For completeness of this work, we report key parameters from those simulations.The MD simulations were completed using the GROMACS 2016 software suite with force-field parameters created following the OPLS-AA (optimized potentials for liquid simulations - all atom) format.17–25 Initial parameters for PTB7 were adopted from Jackson et al.26 before being re-tuned via recalculation of atomic charges. Unique atomic charges for head, tail, and repeat units were calculated at the ωB97X-D/6-31G(d) level within the Charge Model 5 (CM5) framework using a geometry optimized PTB7 trimer.27,28 All density functional theory (DFT) calculations were completed using the Gaussian09 Rev. E.01 software package.29 The PTB7 trimer geometry was optimized at the ωB97X-D/6-31G(d) level before non-empirical gap tuning was applied to optimize the value of ω and then followed by an additional geometry optimization step.30,31 An optimized ω value of 0.108 bohr−1 was obtained and used for all subsequent single-point calculations to generate CM5 atom-centered charges. The MD simulations consisted of 338 PTB7 chains, each with 30 monomers. These chains are within the realm of Mw that are generally synthesized. This is generally a departure from other MD-based studies of conjugated polymers that use chains that are much shorter (for computational efficiency). At 300 K, the final density (1.13 g cm−3) of the simulation box was within 4% of the experimentally determined density of a PTB7 film (1.17 g cm−3).32 A time snapshot of the MD simulation produced in this study is visualized in Fig. 2.
2.2 MDGraph: converting the MD system into an equivalent graph
To quantitatively characterize charge transport across the molecular solid, we convert the MD point cloud data into an equivalent graph. We consider charge-carrier transport in the pSOC solid from the source electrode to the drain electrode defined as the x (or y or z) bounding planes of the solid (see Fig. 3, top row). Transport is then considered to occur in the pOSC active layer from primarily two modes – (a) along a single chain (intramolecular) or (b) between chains (intermolecular). We note that since the PTB7 model derived from the MD simulations is of an amorphous, glassy-like system, we work under the approximation herein of charge-carrier hopping. Since the predominant transport is by diffusion with different modes, it is natural to treat the MD system as a graph, i.e., a set of nodes (charge sites) connected by edges (hop pathway33). Since the hop rates between the above two modes of transport can be vastly different, we naturally use a weighted graph representation of the MD system.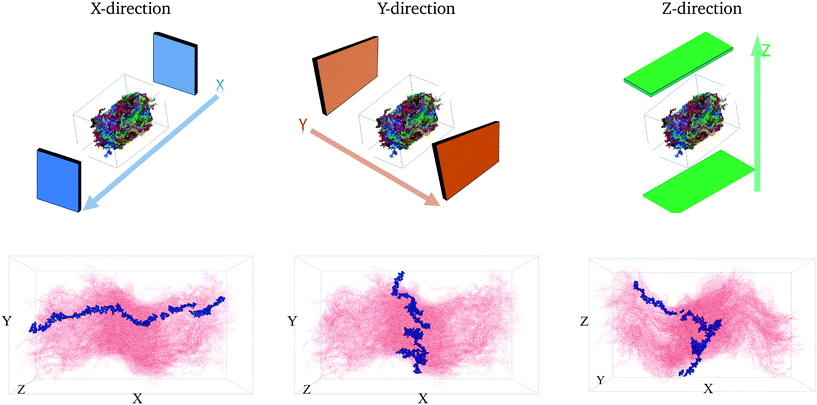 | ||
| Fig. 3 The first row shows the respective source and drain electrodes in each direction. The second row shows the corresponding representative pathways in each direction. | ||
2.3 Characterizing charge-carrier transport in MDGraph
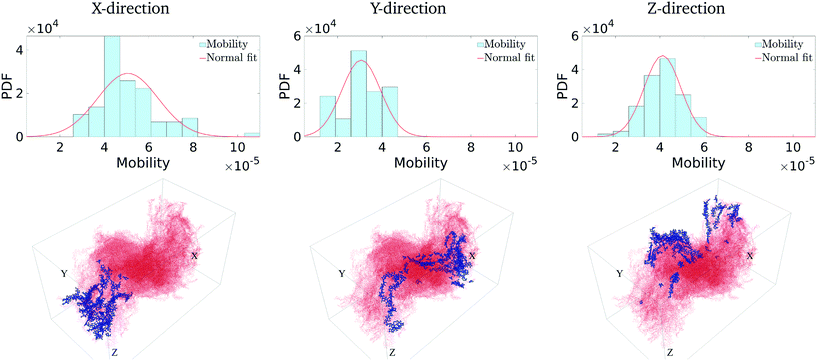
The above conversion of a molecular system to an equivalent graph qualitatively preserves the charge-carrier transport characteristics40 of the system. Specifically, the (inverse) equivalence between the ease of charge transport across monomers and the weight of edges between nodes in the graph construct allows us to characterize the charge mobility using graph algorithms. To do so, we first define the source and destination electrodes. We consider transport across x-, y- and z- directions individually. For each of these cases, we consider monomers within 5% of the (left) plane of the bounding box to be the source electrode, and those within 5% of the (right) plane of the bounding box to be the destination electrode. There are several other possible ways of defining the electrodes, which are detailed in the ESI† (section 5.2). With this definition of the electrodes, we calculate the shortest paths between various locations from the source electrode to the destination electrode. Each shortest path – calculated using very efficient graph algorithms39 – gives an estimate of the time it takes for a charge to travel from the source to the destination electrode (equivalent to a normalized hopping time); see Fig. 3 (bottom row) for a representative shortest path. The effective charge-carrier mobility (in a particular direction) is then calculated as the inverse of the shortest graph path calculated above.1 By considering a large number of source nodes and evaluating the shortest paths that charges take, we construct a distribution of charge mobilities; see Fig. 4 (middle row). We repeat this exercise for source and destination electrodes placed in the other directions (y- and z-).2.4 Characterizing resiliency in MDGraph
By considering charge transport – and defining charge mobility – as ‘flow’ across a graph, one can naturally frame and identify nodes in the graph that are ‘hotspots’ of transport pathways. In other words, the pathways may be critically dependent on a fraction of the monomers and not at all dependent on certain other monomers. This is akin to identifying central hubs in transportation networks or key influencers in social networks. There are several concepts in graph theory and network analysis that allow quantitatively identifying such key nodes in a graph. We use these notions to ask the following question: How much is charge mobility affected when such ‘hotspot’ monomers are removed from participation in charge transport?, which allows us to quantitatively reason about a broader question: How resilient is charge transport in a particular molecular solid to physical and chemical damage?We address these questions through the use of centrality measures of a graph. Centrality measures allow quantitative identification of the most influential nodes of the graph – based on specific features. There exist several different centrality measures that focus on different graph properties to identify and rank order nodes (degree centrality, betweenness centrality, eigenvector centrality, and closeness centrality, among others). The simplest centrality measure, degree centrality, identifies nodes in the graph with the largest connections (or coordination). It is usually quantified using a number of edges associated with a particular node. A particularly useful measure is the betweenness centrality, which identifies the node with the maximum information/flow passing through it, usually quantified through the number of shortest paths through that particular node. Other measures include closeness centrality which identifies nodes which are closest to all other nodes in the graph.
In this work, there is a natural correspondence between how we define charge transport (via the shortest paths through graphs) and the betweenness centrality measure (which rank orders nodes based on the number of shortest paths passing through a given node). We therefore utilize the betweenness centrality measure to identify the most important (‘hotspot’) nodes through which a large fraction of charge transport pathways go through. This allows us to systematically explore the resilience of charge carrier mobility to the deactivation of these ‘hotspot’ nodes. A resilient system should not show a large drop in the charge carrier mobilities when several nodes are disabled (chemically or mechanically). In this work we consider “damage” at a very local level. There are, for instance, types of mechanical damage that would be much larger than the simulation sizes here. However, damage in a polymer semiconductor can be at a molecular scale, driven by chemical reactions (e.g., oxidation) or even poor morphology. On the other hand, a low-resiliency system will show a significant drop in mobility even with small perturbations. We evaluate resiliency by plotting how the charge carrier mobility degrades when we (a) disable an increasing number of the most important (‘hotspot’) nodes and (b) disable an increasing number of the least important nodes.
3 Results and discussion
3.1 Charge mobility distribution in MDGraph
We first calculate the effective charge-carrier mobility in each direction. Fig. 3(b) shows representative shortest pathways in each direction. These are the paths with lowest cumulative edge weight or equivalently with the highest cumulative charge-carrier hopping probability. It should be noted here that the pathways are not straight and undergo substantial bends. This phenomenon is primarily due to the difference in the intermolecular and intramolecular charge-carrier hop rates, as well as the increasing sparsity of chains. This observation is more pronounced in the Z-direction: (a) where pathways are sparse, i.e., overlaps are smaller compared to other directions and (b) require a larger number of intermolecular hops. So, a charge-carrier prefers to take a slightly circuitous path with a larger number of intramolecular hops over a straighter path with a larger number of intermolecular hops. It should also be noted that this analysis also allows for (slight) backflow of charges, i.e., against the electric field, when the intermolecular hop probability is very low.Next, once the shortest paths are identified, we approximate the charge-carrier mobility as the inverse of the cumulative edge weight of the shortest paths, normalized by the bounding box length in the respective directions. This is shown in Fig. 4 (top row). One can observe a nearly isotropic average mobility in the system, with a slightly lower mobility in the Y-direction. However, the largest mobile charge-carrier pathways of the system are in the X-direction, in which the mobility is nearly double compared to the average mobility in any direction. This is due to the fact that most of the chains are aligned along the X-direction, thereby increasing the intramolecular hops and hence increasing the effective mobility.
Finally, in Fig. 4 (bottom row), we identify the 50 most important monomers that contribute to a large fraction of charge transport pathways. These nodes are identified by evaluating the betweenness centrality measure of each of the monomers. We see that most of the high centrality monomers are concentrated near the destination electrode. This suggests that while there are many similarly weighted pathways in the bulk of the solid, most of these pathways pass through a small number of monomers just before being collected at the destination electrode. Hence these monomers become critical in charge transport in the respective directions. Any modification/damage to these monomers will impact the effective charge transport in the system.
3.2 Resiliency of MDGraph
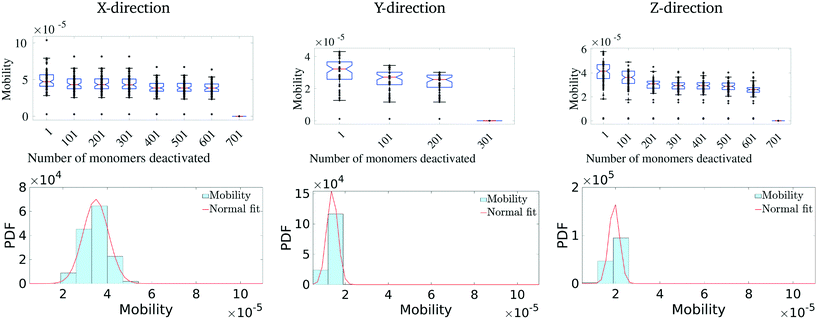
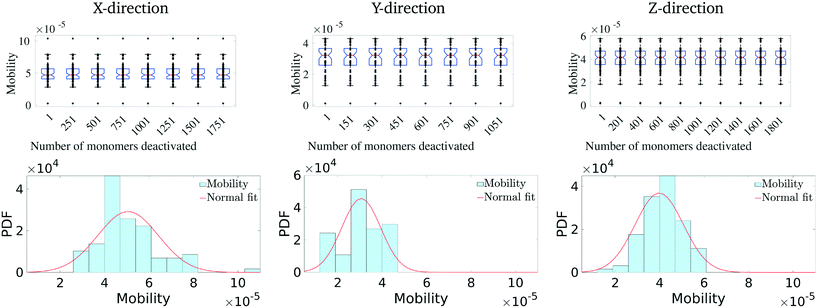
Having identified the most critical monomers in the present MD system, we next look at quantifying how much these (critical) monomers contribute to the effective charge-carrier transport of the MD system. For this, we first rank order all the monomers in terms of their betweenness centrality measure. Then we cumulatively and successively remove each monomer and probe the effective charge-carrier mobility in the system. In other words, we disable these critical monomers and re-calculate the mobility distribution (as described above) of the system.It should be noted here that it is important to check not just the average mobility but also the peak mobility of the system, as these are the most important pathways for charge-carrier mobility. The results of the removal of the most critical monomers are shown in Fig. 5. Here, we remove/disable the monomers one-by-one cumulatively until no more pathways exist between the electrodes. In Fig. 5 (top row), we show the average mobility of the system as a function of disabling an increasing number of the most important nodes. Additionally, Fig. 5 (bottom row) shows the charge mobility distribution for the case where monomers are disabled until there is a single connection with the destination electrode. From Fig. 5 (top row), we observe that there is not a significant decrease (i.e., no multiple orders of magnitude decrease) in the average mobility of the system due to disabling of these monomers, and from Fig. 5 (bottom row) we notice that the variance of the mobility distribution decreases. While it seems obvious that the effective mobility decreases when monomers are disabled, we note that even with a significant fraction (up to 6%) of the important monomers being disabled (in fact leaving only a single connection with the destination electrode), the molecular solid can sustain a significant amount of transport through. This indicates that such molecular solids are highly resilient to significant amounts of mechanical/chemical defects. We observe that the maximum reduction in the charge-carrier mobility is seen when the monomers with the highest centrality measure are removed. This is true in all the three directions. We also observe that the system attains an asymptotic charge-carrier mobility before finally becoming non-conductive. This is also true in all the three directions.
We similarly remove the least important monomers successively from the original system and explore its impact on the mobility distribution. The results are presented in Fig. 6. In this scenario, we observe that there is hardly any effect on the mobility distribution, even when 20% of the least important monomers are disabled. This suggests that a good fraction of the molecular solid does not play a critical path in charge transport, with multiple redundant pathways existing to accommodate significant perturbations to the structure. Overall, these results suggest that pOSC molecular solids exhibit an impressive resiliency of charge mobility. This is due to the existence of several, degenerate charge carrier transport pathways that pass through a small number of monomers. An interesting consequence of this is that a considerable portion of the material can suffer damage (e.g., chemical, thermal, and mechanical) before charge-carrier transport is reduced.
4 Conclusions
In this work, we present a novel technique to computationally quantify charge-carrier transport and resiliency in a molecular solid. We convert the complex molecular system into an equivalent directed weighted graph and draw equivalence between charge-carrier transport in pOSC solids and graph components. Using this equivalence, we quantify charge-carrier mobility in terms of the shortest paths (the highest charge hop probability) between the electrodes. We develop a formalization to assign, for the first time, a notion of relative importance to the constituent monomers for charge transport, using graph centrality measures. Using betweenness centrality, we rank order the constituent monomers in terms of their contribution to the charge transport in the system. We utilize this ranking order to perform in silico ablative experiments – the effective mobility of the system is marginally reduced when these highly ranked monomers are disabled for charge transport. In contrast, the low ranked monomers have nearly no effect on the charge-carrier transport. Based on these observations, we can define and computationally quantify resiliency and show that the charge mobility of the PTB7 molecular solid considered in this work is highly resilient to defects. It should be noted here that Mw plays a considerable role in the polymer structure (e.g., rigid rod, globule, etc.), which would in turn impact polymer packing in the glass. One might, for instance, expect more rigid chains to pack in fiber-like structures that could enhance transport along the backbone of the chain; or, if the chains were considerably globule-like in structure, then transport along a chain could be hampered and transport among globules would also be important. The present framework can be easily extended to perform such analysis and quantify the effects of parameters like Mw on charge transport resiliency.There are several ways in which one can utilize quantitative and fast characterization of charge resiliency. Firstly, this framework can be naturally extended to incorporate interconnectedness of crystallite domains, tie chains, and amorphous regions. An example of this extension is demonstrated in ref. 40. Next, one can use this to develop a detailed design strategy for developing highly resilient systems. Considering molecular point cloud data, one can start designing molecular configurations that produce geometrically well distributed central nodes (see Fig. 4). This ensures that there is no single point of failure during charge transport. An example of such configuration generation based on spatial metrics is available in ref. 41. Alternatively, one can construct a figure of merit based on the slope of the drop in mobility with increasing non-participating monomers (see Fig. 5). Creating molecular configurations that produce slow drop-offs will provide design rules for charge resiliency. Another approach is to explore how changing the weights of the graph (inter-chain vs. intra-chain transport) affects the resiliency of the system. This provides a direct route to designing molecular architectures that provide longer range resiliency. Other applications include quantitative comparison of the impact of processing conditions on the charge transport resilience. Finally, this resiliency quantification can be used at the morphology scale to design morphologies that show charge transport resilience. Preliminary work along these lines is shown in ref. 41. In particular, we hypothesize that coupling this approach with recent advances in generative (machine learning) models that rapidly create molecular/morphology configurations could produce novel design constructs.42 This work lays the foundation for systematic considerations of resilience and rapid analysis of charge-carrier transport in pOSC. We envision extending this approach to incorporate additional effects including transient charge-carrier transport, traps, stochastic charge mobility, and charge delocalization.
Conflicts of interest
There are no conflicts to declare.Acknowledgements
The work at the University of Kentucky was supported in part by the Office of Naval Research (Award Number N00014-16-1-2985) and the National Science Foundation (Award Number CMMI 1563412). The work at Iowa State University was supported in part by NSF CMMI 1563359 and the Office of Naval Research under Award N00014-19-1-2453.References
- S. Fratini, M. Nikolka, A. Salleo, G. Schweicher and H. Sirringhaus, Charge transport in high-mobility conjugated polymers and molecular semiconductors, Nat. Mater., 2020, 190(5), 491–502 CrossRef PubMed.
- V. Coropceanu, J. Cornil, D. A. da Silva Filho, Y. Olivier, R. Silbey and J.-L. Brédas, Charge transport in organic semiconductors, Chem. Rev., 2007, 1070(4), 926–952, DOI:10.1021/cr050140x.
- M. Jaiswal and R. Menon, Polymer electronic materials: a review of charge transport, Polym. Int., 2006, 550(12), 1371–1384, DOI:10.1002/pi.2111.
- J. Lee, Physical modeling of charge transport in conjugated polymer field-effect transistors, J. Phys. D: Appl. Phys., 2021, 540(14), 143002, DOI:10.1088/1361-6463/abd271.
- J. F. Rubinson and Y. P. Kayinamura, Charge transport in conducting polymers: insights from impedance spectroscopy, Chem. Soc. Rev., 2009, 380(12), 3339, 10.1039/b904083h.
- A. Salleo, Charge transport in polymeric transistors, Mater. Today, 2007, 100(3), 38–45, DOI:10.1016/s1369-7021(07)70018-4.
- R. Noriega, J. Rivnay, K. Vandewal, F. P. V. Koch, N. Stingelin, P. Smith, M. F. Toney and A. Salleo, A general relationship between disorder, aggregation and charge transport in conjugated polymers, Nat. Mater., 2013, 12(11), 1038–1044, DOI:10.1038/nmat3722 , ISSN 1476-1122.
- H. Bronstein, C. B. Nielsen, B. C. Schroeder and I. McCulloch, The role of chemical design in the performance of organic semiconductors, Nat. Rev. Chem., 2020, 40(2), 66–77 CrossRef.
- H. Li, G. Sini, J. Sit, A. J. Moulé and J.-L. Bredas, Understanding charge transport in donor/acceptor blends from large-scale device simulations based on experimental film morphologies, Energy Environ. Sci., 2020, 130(2), 601–615 RSC.
- C.-K. Lee, O. Wodo, B. Ganapathysubramanian and C.-W. Pao, Electrode materials, thermal annealing sequences, and lateral/vertical phase separation of polymer solar cells from multiscale molecular simulations, ACS Appl. Mater. Interfaces, 2014, 60(23), 20612–20624 CrossRef PubMed.
- N. E. Jackson, L. X. Chen and M. A. Ratner, Charge transport network dynamics in molecular aggregates, Proc. Natl. Acad. Sci. U. S. A., 2016, 1130(31), 8595–8600 CrossRef PubMed.
- J.-H. Choi, H. Lee, H. R. Choi and M. Cho, Graph theory and ion and molecular aggregation in aqueous solutions, Annu. Rev. Phys. Chem., 2018, 69, 125–149 CrossRef CAS PubMed.
- D. M. Pesko, M. A. Webb, Y. Jung, Q. Zheng, T. F. Miller III, G. W. Coates and N. P. Balsara, Universal relationship between conductivity and solvation-site connectivity in ether-based polymer electrolytes, Macromolecules, 2016, 490(14), 5244–5255 CrossRef.
- B. M. Savoie, K. L. Kohlstedt, N. E. Jackson, L. X. Chen, M. O. De La Cruz, G. C. Schatz, T. J. Marks and M. A. Ratner, Mesoscale molecular network formation in amorphous organic materials, Proc. Natl. Acad. Sci. U. S. A., 2014, 1110(28), 10055–10060 CrossRef PubMed.
- N. E. Jackson, B. M. Savoie, L. X. Chen and M. A. Ratner, A simple index for characterizing charge transport in molecular materials, J. Phys. Chem. Lett., 2015, 60(6), 1018–1021 CrossRef PubMed.
- S. M. Ryno and C. Risko, Deconstructing the behavior of donor–acceptor copolymers in solution & the melt: the case of ptb7, Phys. Chem. Chem. Phys., 2019, 210(15), 7802–7813 RSC.
- M. J. Abraham, T. Murtola, R. Schulz, S. Páll, J. C. Smith, B. Hess and E. Lindahl, Gromacs: High performance molecular simulations through multi-level parallelism from laptops to supercomputers, SoftwareX, 2015, 1, 19–25, DOI:10.1016/j.softx.2015.06.001.
- W. L. Jorgensen, D. S. Maxwell and J. Tirado-Rives, Development and testing of the opls all-atom force field on conformational energetics and properties of organic liquids, J. Am. Chem. Soc., 1996, 1180(45), 11225–11236 CrossRef.
- D. Van Der Spoel, E. Lindahl, B. Hess, G. Groenhof, A. E. Mark and H. J. C. Berendsen, Gromacs: fast, flexible, and free, J. Comput. Chem., 2005, 260(16), 1701–1718 CrossRef PubMed.
- B. Hess, C. Kutzner, D. Van Der Spoel and E. Lindahl, Gromacs 4: algorithms for highly efficient, load-balanced, and scalable molecular simulation, J. Chem. Theory Comput., 2008, 40(3), 435–447 CrossRef PubMed.
- S. Pronk, S. Páll, R. Schulz, P. Larsson, P. Bjelkmar, R. Apostolov, M. R. Shirts, J. C. Smith, P. M. Kasson and D. Van Der Spoel, et al., Gromacs 4.5: a high-throughput and highly parallel open source molecular simulation toolkit, Bioinformatics, 2013, 290(7), 845–854 CrossRef PubMed.
- M. J. Abraham, T. Murtola, R. Schulz, S. Páll, J. C. Smith, B. Hess and E. Lindahl, Gromacs: High performance molecular simulations through multi-level parallelism from laptops to supercomputers, SoftwareX, 2015, 1, 19–25 CrossRef.
- E. Lindahl, B. Hess and D. Van Der Spoel, Gromacs 3.0: a package for molecular simulation and trajectory analysis, J. Mol. Model., 2001, 70(8), 306–317 CrossRef.
- H. J. C. Berendsen, D. van der Spoel and R. van Drunen, Gromacs: a message-passing parallel molecular dynamics implementation, Comput. Phys. Commun., 1995, 910(1–3), 43–56 CrossRef.
- S. Páll, M. J. Abraham, C. Kutzner, B. Hess and E.s Lindahl, Tackling exascale software challenges in molecular dynamics simulations with gromacs. In International conference on exascale applications and software, Springer, 2014, pp. 3–27 Search PubMed.
- N. E. Jackson, K. L. Kohlstedt, B. M. Savoie, M. O. de la Cruz, G. C. Schatz, L. X. Chen and M. A. Ratner, Conformational order in aggregates of conjugated polymers, J. Am. Chem. Soc., 2015, 1370(19), 6254–6262 CrossRef PubMed.
- A. V. Marenich, S. V. Jerome, C. J. Cramer and D. G. Truhlar, Charge model 5: An extension of hirshfeld population analysis for the accurate description of molecular interactions in gaseous and condensed phases, J. Chem. Theory Comput., 2012, 80(2), 527–541 CrossRef PubMed.
- J.-D. Chai and M. Head-Gordon, Long-range corrected hybrid density functionals with damped atom–atom dispersion corrections, Phys. Chem. Chem. Phys., 2008, 100(44), 6615–6620 RSC.
- M. J. Frischand, G. W. Trucks, H. B. Schlegel, G. E. Scuseria, M. A. Robb, J. R. Cheeseman, G. Scalmani, V. Barone, G. A. Petersson, H. Nakatsuji, X. Li, M. Caricato, A. V. Marenich, J. Bloino, B. G. Janesko, R. Gomperts, B. Mennucci, H. P. Hratchian, J. V. Ortiz, A. F. Izmaylov, J. L. Sonnenberg, F. Ding Williams, F. Lipparini, F. Egidi, J. Goings, B. Peng, A. Petrone, T. Henderson, D. Ranasinghe, V. G. Zakrzewski, J. Gao, N. Rega, G. Zheng, W. Liang, M. Hada, M. Ehara, K. Toyota, R. Fukuda, J. Hasegawa, M. Ishida, T. Nakajima, Y. Honda, O. Kitao, H. Nakai, T. Vreven, K. Throssell, J. A. Montgomery Jr., J. E. Peralta, F. Ogliaro, M. J. Bearpark, J. J. Heyd, E. N. Brothers, K. N. Kudin, V. N. Staroverov, T. A. Keith, R. Kobayashi, J. Normand, K. Raghavachari, A. P. Rendell, J. C. Burant, S. S. Iyengar, J. Tomasi, M. Cossi, J. M. Millam, M. Klene, C. Adamo, R. Cammi, J. W. Ochterski, R. L. Martin, K. Morokuma, O. Farkas, J. B. Foresman and D. J. Fox, Gaussian 09 revision d. 01, http://www.gaussian.com/, 2016.
- H. Sun, C. Zhong and J.-L. Bredas, Reliable prediction with tuned range-separated functionals of the singlet–triplet gap in organic emitters for thermally activated delayed fluorescence, J. Chem. Theory Comput., 2015, 110(8), 3851–3858 CrossRef PubMed.
- H. Sun, S. Ryno, C. Zhong, M. K. Ravva, Z. Sun, T. Korzdorfer and J.-L. Bredas, Ionization energies, electron affinities, and polarization energies of organic molecular crystals: quantitative estimations from a polarizable continuum model (pcm)-tuned range-separated density functional approach, J. Chem. Theory Comput., 2016, 120(6), 2906–2916 CrossRef PubMed.
- O. Dyck, S. Hu, S. Das, J. Keum, K. Xiao, B. Khomami and G. Duscher, Quantitative phase fraction detection in organic photovoltaic materials through eels imaging, Polymer, 2015, 70(11), 2446–2460 Search PubMed.
- S. D. Baranovskii, Theoretical description of charge transport in disordered organic semiconductors: Charge transport in disordered organic semiconductors, Phys. Status Solidi B, 2014, 2510(3), 487–525, DOI:10.1002/pssb.201350339 , ISSN 03701972.
- J.-L. Brédas, J. P. Calbert, D. A. da Silva Filho and J. Cornil, Organic semiconductors: A theoretical characterization of the basic parameters governing charge transport, Proc. Natl. Acad. Sci. U. S. A., 2002, 990(9), 5804–5809 CrossRef PubMed.
- D. Beljonne, G. Pourtois, C. Silva, E. Hennebicq, L. M. Herz, R. H. Friend, G. D. Scholes, S. Setayesh, K. Müllen and J.-L. Brédas, Interchain vs. intrachain energy transfer in acceptor-capped conjugated polymers, Proc. Natl. Acad. Sci. U. S. A., 2002, 990(17), 10982–10987 CrossRef PubMed.
- K. Wang, H. Chen, S. Li, J. Zhang, Y. Zou and Y. Yang, Interplay between intrachain and interchain excited states in donor–acceptor copolymers, J. Phys. Chem. B, 2021, 1250(27), 7470–7476 CrossRef PubMed.
- F. Segatta, G. Lattanzi and P. Faccioli, Predicting charge mobility of organic semiconductors with complex morphology, Macromolecules, 2018, 510(21), 9060–9068 CrossRef.
- K. Gu and Y.-L. Loo, The polymer physics of multiscale charge transport in conjugated systems, J. Polym. Sci., Part B: Polym. Phys., 2019, 570(23), 1559–1571 CrossRef.
- E. W. Dijkstra, A note on two problems in connexion with graphs, Numer. Math., 1959, 10(1), 269–271 CrossRef.
- R. Noruzi, E. Lim, B. S. S. Pokuri, M. Chabinyc and B. Ganapathysubramanian, A graph based approach to model charge transport in semiconducting polymers, Npj Comput. Mater., 2022 DOI:10.1038/s41524-022-00714-w.
- P. Du, A. Zebrowski, J. Zola, B. Ganapathysubramanian and O. Wodo, Microstructure design using graphs, npj Comput. Mater., 2018, 40(1), 1–7 Search PubMed.
- A. Joshi, M. Cho, V. Shah, B. Pokuri, S. Sarkar, B. Ganapathysubramanian and C. Hegde, Invnet: encoding geometric and statistical invariances in deep generative models. In Proceedings of the AAAI Conference on Artificial Intelligence, 2020, vol. 34, pp. 4377–4384 Search PubMed.
Footnote |
| † Electronic supplementary information (ESI) available. See DOI: 10.1039/d1me00163a |
| This journal is © The Royal Society of Chemistry 2022 |

