
 Open Access Article
 This Open Access Article is licensed under a
 Creative Commons Attribution 3.0 Unported Licence
Coupled proton vibrations between two weak acids: the hinge complex between formic acid and trifluoroethanol†
Sophie M.
Schweer
 ,
Arman
Nejad
and
Martin A.
Suhm
*
,
Arman
Nejad
and
Martin A.
Suhm
*
Institute of Physical Chemistry, University of Goettingen, Tammannstr. 6, 37077 Goettingen, Germany. E-mail: sschwee@gwdg.de; anejad@chemie.uni-goettingen.de; msuhm@gwdg.de
First published on 20th October 2022
Abstract
When formic acid and 2,2,2-trifluoroethanol are co-expanded through a slit nozzle into vacuum, a single dominant, hinge-like 1![[thin space (1/6-em)]](https://www.rsc.org/images/entities/char_2009.gif) :1 complex is formed in significant amounts and its two OH stretching fundamentals separated by 100 cm−1 can be unambiguously assigned by a combination of infrared absorption and Raman scattering. Quantum chemical calculations at different levels reproduce this finding in a satisfactory way and suggest that in-phase (Raman-sensitive and lower wavenumber) OH stretch excitation more or less along the concerted degenerate proton transfer coordinate in the hydrogen-bonded ring stays below the barrier for this concerted exchange. Anharmonic calculations indicate only weak intensity sharing with dark states coming into reach due to the hydrogen bond downshift of the OH stretching vibration. This well-behaved system sets the stage for acid combinations with more basic alcohols, where the in-phase OH stretching vibration is more difficult to detect, possibly due to fast intra-complex vibrational dynamics. It thus provides a benchmark point from which one can explore the evolution of vibrational resonances when the acidic proton meets a more electron-rich alcoholic oxygen.
:1 complex is formed in significant amounts and its two OH stretching fundamentals separated by 100 cm−1 can be unambiguously assigned by a combination of infrared absorption and Raman scattering. Quantum chemical calculations at different levels reproduce this finding in a satisfactory way and suggest that in-phase (Raman-sensitive and lower wavenumber) OH stretch excitation more or less along the concerted degenerate proton transfer coordinate in the hydrogen-bonded ring stays below the barrier for this concerted exchange. Anharmonic calculations indicate only weak intensity sharing with dark states coming into reach due to the hydrogen bond downshift of the OH stretching vibration. This well-behaved system sets the stage for acid combinations with more basic alcohols, where the in-phase OH stretching vibration is more difficult to detect, possibly due to fast intra-complex vibrational dynamics. It thus provides a benchmark point from which one can explore the evolution of vibrational resonances when the acidic proton meets a more electron-rich alcoholic oxygen.
1 Introduction
The dynamics and reactivity between carboxylic acids and alcohols has two interesting aspects. One is ester formation under elimination of water, a multi-step equilibrium reaction1 which is catalysed by protonation of the C![[double bond, length as m-dash]](https://www.rsc.org/images/entities/char_e001.gif) O group.2 The other is an equilibrium in the doubly hydrogen-bonded neutral 1:1 complex, where the acid transfers its proton to the alcohol or another OH bond while the latter back-protonates the CO group.3–5 The net effect of this concerted proton exchange between the acid and the alcohol is at least an inversion of the handedness of the original asymmetric complex and at most a different conformation in the constituting alcohol, with no significant charge shift in the complex.
O group.2 The other is an equilibrium in the doubly hydrogen-bonded neutral 1:1 complex, where the acid transfers its proton to the alcohol or another OH bond while the latter back-protonates the CO group.3–5 The net effect of this concerted proton exchange between the acid and the alcohol is at least an inversion of the handedness of the original asymmetric complex and at most a different conformation in the constituting alcohol, with no significant charge shift in the complex.
The double role of such neutral 1:1 complexes between acids and alcohols as non-reactive arrangements of the two esterification components and as pre-reactive arrangements for concerted double proton exchange suggests that their structure should be investigated in detail in vacuum isolation, best by rotational spectroscopy, before any dynamical aspects are addressed. The reason is that rotational structure determination allows for the assessment and calibration of quantum chemical methods, which can then be used to simulate the dynamics at higher excitation energy. Microwave spectroscopy permits to identify the degree of non-planarity introduced by the alcohol, which can swing from below the COOH plane to above it, in a hinge-like motion (Fig. 1) which may also correspond to stereochemical inversion.5,6 Ideally, this kind of spectroscopy can even reveal concerted tunnelling motions of the involved protons (Fig. 1) between degenerate minima, if they do not require too much heavy atom motion.
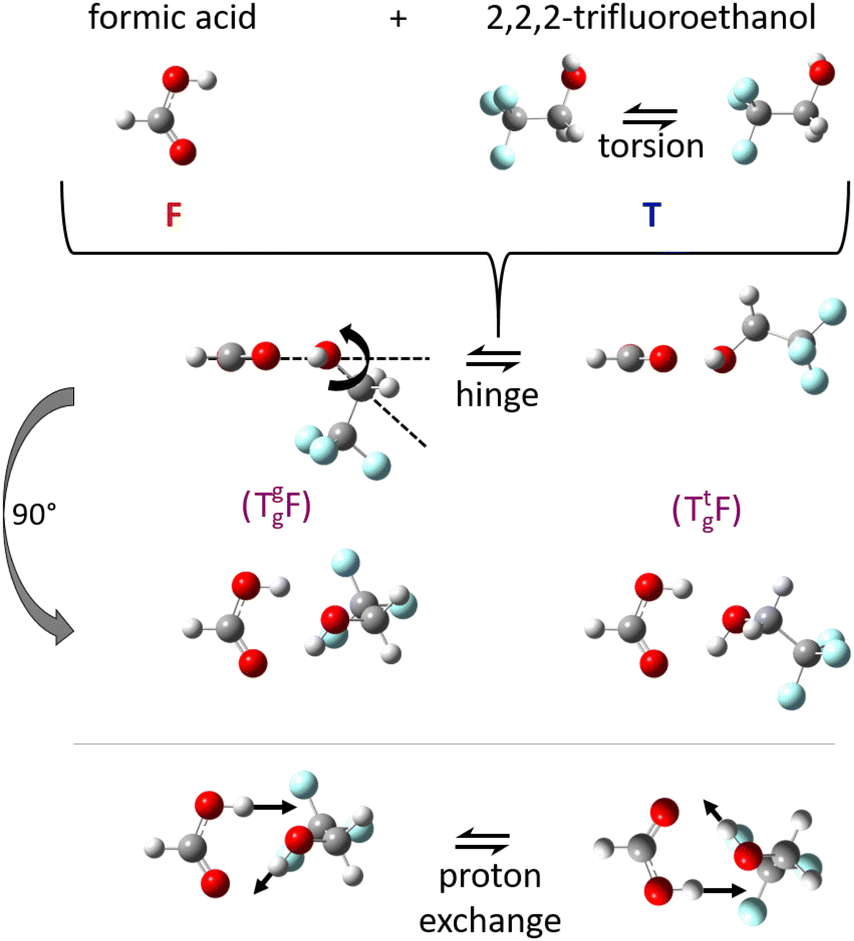 | ||
| Fig. 1 Illustration of the monomer torsion, hinge and double proton exchange pathways for the investigated complex TF between trifluoroethanol (T) and formic acid (F). The stereochemistry of T can be specified as a lower index (Tg for gauche) and the lone electron pair which it donates to F in the complex can be given as an upper index (Tg, or Tt for trans), see also Fig. S1 and S2 in the ESI.† | ||
Somewhat surprisingly, such experimental rotational characterisations of (carboxylic) acid–alcohol complexes are very scarce. One of the explanations offered in the literature for their elusiveness is the spontaneous formation of covalently bound esters even under supersonic jet mixing conditions. This was claimed for the pairs of formic acid with methanol,7 ethanol,7 2-propanol7,8 and cyclohexanol7,9 as well as for the pair of trifluoroacetic acid with methyl alcohol,10 where the ester product was unambiguously identified. Such a pronounced gas phase reactivity is surprising for neutral acid–alcohol adducts, in contrast to ion-molecule reactions involving protonated species11,12 or the reasonably slow reactivity of hydroxy acids in the liquid phase. The latter is an obstacle for polycondensation reactions which could otherwise easily lead to biodegradable polymers such as polyglycolides13 from glycolic acid.14 Only for the tertiary alcohols tert-butyl alcohol3,7 and 1-methyl-cyclopropanol,7 the neutral 1:1 complexes with formic acid could be structurally characterised in the gas phase, either exclusively or along with the ester.
To investigate this enigmatic elusiveness of neutral acid–alcohol aggregates by an alternative spectroscopic approach, we have initiated a combined FTIR and Raman jet study of the OH stretching vibrations in 1:1 complexes of different carboxylic acids and alcohols. In this work, we present a first case study where the acid–base complementarity between the acid and the alcohol is deliberately attenuated by acidifying the alcoholic OH group through inductive effects. This is achieved for 2,2,2-trifluoroethanol (T), which at the same time provides a heavy rotor frame and allows for isomerism in the complex, expected to largely quench any tunnelling dynamics. It is hoped that the weaker interaction and heavy frame reduce or prevent fast intra-complex energy flow after OH stretching excitation, thus leading to largely decoupled fundamental bands. T is combined with the simplest carboxylic acid, formic acid (F), which is also free of large amplitude methyl torsion that might interfere with the OH stretching excitation. The resulting 1:1 complex TF (Fig. 1) is thus expected to feature two isolated OH stretching fundamentals in the vibrational spectrum, a softer one for the carboxylic acid and a stiffer one for the acidic alcohol. Note that this wavenumber separation is not always present when the carboxylic OH does not interact with the alcohol, such as in monomeric glycolic acid.14 By identifying the characteristic acid–alcohol vibrational splitting, the presence of the 1:1 complexes can be proven, even in competition with ester formation which eliminates these OH groups by expelling a water molecule. A mixture of T and F in the liquid state forms the ester without additional catalyst,15 but in the gas phase, this is not expected to happen spontaneously. Pre-reactive complexes between fluorinated alcohols and acids as well as the associated esters are also of interest in the context of the unusual solubility of polyglycolides in highly fluorinated alcoholic solvents.16
The fact that our experimental methods are not size selective means that the corresponding homoaggregates of T and F must be suppressed or at least well characterised. For larger aggregates, this is achieved by high dilution, but the TT17 and FF dimers18,19 as well as the monomer signals of T20 and F21 have to be coped with. Favourably, the TF dimers are intermediate in hydrogen bond strength such that spectral overlap is minimised. TTF and TFF trimers are the main species which require careful discrimination. In addition, if there is significant ester formation in the expansion process, the corresponding hydrates of T22,23 and F24 and the complexes of the ester with the resulting water25 or with other ingredients of the expansion need to be monitored. In the present contribution, we show that all these constraints are controllable and that an unambiguous vibrational fingerprint of the OH stretching dynamics of the mixed TF complex can be obtained.
2 Methods
2.1 Vibrational spectroscopy
For challenging vibrational assignments in the gas phase, it is helpful to probe the molecular complexes by both infrared and Raman spectroscopy, due to complementary intensities even in the absence of symmetry. We thus employ two linear but still sufficiently sensitive supersonic jet spectrometers19 to record the OH infrared26 and Raman27 fingerprints of the mixed dimers and trimers formed by T and F.In brief, gas mixtures of formic acid (IR: Acros Organics, +98%, Raman: J&K Scientific, 98%) and/or trifluoroethanol (abcr, 99%) were prepared with helium (Linde, 99.996%) as carrier gas. For the FTIR measurements with 2 cm−1 resolution, the mixtures were expanded at 0.75 bar through a 0.2 × 600 mm2 slit nozzle into a vacuum chamber to build up a pulsed supersonic expansion. With a Bruker IFS 66v/S FTIR spectrometer and a 150 W tungsten lamp, the expansions were probed and the absorption detected by an InSb detector. The spectra were averaged over 360–375 scans. For the Raman measurements with 1.5 cm−1 resolution, the gas mixtures (0.7 bar) were continuously expanded through a 0.15 × 4 mm2 slit nozzle. A 532 nm continuous 25 W laser beam (Spectra Physics Millenia 25 eV) crossed the supersonic expansion parallel to the nozzle. The scattered light was collected at a 90° angle, passed a 1 m monochromator (McPherson) and got detected via a CCD-camera (Princeton, PyLoN 400, 1340 × 400 pixel). To maximise the signal-to-noise ratio, the signals were binned over 400 vertical pixels and averaged over ten 600 s exposures. Cosmic ray contributions were removed by comparing these exposures, to yield the spectra shown. For further experimental details see Tables S4 (FTIR) and S5 (Raman) in the ESI.† The spectra are publicly available.28
2.2 Harmonic DFT predictions
If the perturbation of OH bonds by hydrogen bond interaction in a molecular complex is weak, a harmonic approach to the shift of the stretching fundamentals from their monomer values and in particular between different complexes can be helpful at DFT level, because anharmonicity effects and electronic structure deficiencies largely cancel in the experimental difference quantities. Therefore, our standard approach to model the spectra involves scaled harmonic B3LYP-D3(BJ)29,30 with a def2QZVP basis set,31 as implemented in the Gaussian16 (Rev. A.03) package.32 This approach will also be applicable to larger systems in the future, once validated for the present system. However, for a rather unexplored class of compounds such as acid–alcohol gas phase complexes, it is important to perform some control calculations beyond the harmonic approximation, employing wavefunction-based methods. The most important optimised structures are publicly available.282.3 Second-order vibrational perturbation theory (VPT2)
As a substitute for pure coupled-cluster-quality quartic force fields, which are very expensive to compute, hybrid force fields with only MP2-level cubic and quartic force constants have proven themselves for modelling fundamental vibrational excitations of carboxylic acids and their clusters14,19,33–35 using second-order vibrational perturbation theory (VPT2).36,37 In this work, we combine CCSD(T)-F12a/VDZ-F1238–40 harmonic force constants, computed with Molpro version 2018,41–43 with a semi-diagonal MP2/aVTZ44,45 quartic force field (ϕi,j,k,l with four distinct indices missing), computed with Gaussian 16 Rev. A.03.32,46 When limited to finite differences of analytic Hessians32 to compute cubic and quartic force fields, hybrid force fields based on pure wavefunction methods, such as MP2, are preferable over DFT47 among others due to the absence of additional grid errors. This might change in the future with the recent development of analytical cubic and quartic DFT derivatives.48,49 Depending on the method of inserting the harmonic force constants, one arrives at different hybrid force fields.37 In this work, we use the “substituted” and “additive” approach where either the higher- or lower-level harmonic force constants are used to evaluate the anharmonic components of the (effective) VPT2 Hamiltonian, respectively.37 The Coriolis and equilibrium rotational constants are evaluated at the lower electronic structure level. To guide the construction of effective Fermi resonance Hamiltonians, we employ the well-tried Martin test (harmonic energy separation below 200 cm−1 and so-called variational-perturbational difference above 1 cm−1).50 In a recent vibrational benchmark study of the formic acid dimer (see ESI of ref. 19), it was noticed that Gaussian scales the cubic and quartic force constants if the substituted force field approach is employed since the new harmonic wavenumbers are utilised to convert the force constants from mass-weighted to dimensionless normal coordinates.51 All VPT2 results shown here were therefore computed with the GUINEA (version 3.0) module of the CFOUR program package52,53 (version 2.1) using the unscaled lower-level cubic and quartic force constants; results obtained with scaled force constants are discussed in Section 1 in the ESI.†3 Results
3.1 Vibrational spectra
Fig. 2 provides the infrared signature of co-expansions of F and T in helium carrier gas (see also Fig. S3 and S4 in the ESI†). The second trace (b, blue) shows the contributions from T, obtained without adding F.55–57 A strong monomer signal (3656 cm−1) due to the dominant, internally hydrogen-bridged gauche T conformation is followed by the two OH stretching signals of the homodimer TT, whose largely monoconformational appearance has been surprising and was recently quantified by microwave spectroscopy.23 Larger clusters are successfully suppressed under the highly diluted (0.04%) expansion conditions. The same is the case for the top trace (a, red) which involves F without adding T, with a dominant monomer signal (3570 cm−1 and some monomer side bands which are still not fully understood, see discussion in Section IV-E of ref. 58). Here, the strongly downshifted OH stretching contributions from the cyclic dimer18 (FF) are hardly discernible above the baseline due to their severely coupled nature and the high dilution (0.02% in helium). This provides an ideal setting for mixed expansions (c, different hues of red and blue, depending on whether T and F (upper) or only T (middle) or none of them has a concentration of 0.04% instead of 0.02%). There is clearly a number of new signals which depend on both species and when the spectra are scaled to the dominant band at 3408 cm−1 (d, the indicated scaling factors suggest a linear dependence on both species and thus a 1:1 complex as its origin), it is evident that a weak feature at 3441 cm−1 and a more intense signal at 3309 cm−1 scale similarly, whereas further downshifted features such as the band near 3199 cm−1 show a different scaling behaviour. The signal at 3258 cm−1 is actually known to be due to formic acid trimers.21 The 1:1 band assignments are further supported in trace e, which shows the spectrum from trace c with intermediate concentration after subtraction of the unscaled traces a and b, which nominally contain the same individual T and F concentrations. In this difference spectrum, which accumulates noise from all three components, the 3441 cm−1 band is less evident than a few weak satellites to the 3309 cm−1 band in a ±50 cm−1 window. The satellites may be due to larger mixed complexes, or contain some weaker 1:1 contributions. The latter might arise from trace isomers or from weak anharmonic resonances. With increasing hydrogen bond downshift of the OH stretching vibration, such resonances may gain in number and strength.59 As argued in the ESI† (Section 1.1), a resonance may also be the origin of the weak 3441 cm−1 signal, even across the hydrogen bond. In summary, there are two strong 1:1 complex contributions separated by about 100 cm−1 which may or may not share a small fraction of their intensity with neighbouring states, exactly as one would expect for a complex between an alcoholic and an acidic OH group. Because the alcohol monomer has a higher OH stretching wavenumber and is less acidic than the formic acid, it is likely that the higher wavenumber corresponds to more alcohol stretching character. Its prominent IR intensity is consistent with an out-of-phase normal mode, where one OH group is stretched while the other one is compressed. This results in a stronger dipole change along the on balance more antiparallel arrangement of the bonds in a cyclic hydrogen bond pattern. All this can be derived prior to any reference to quantum chemical predictions.
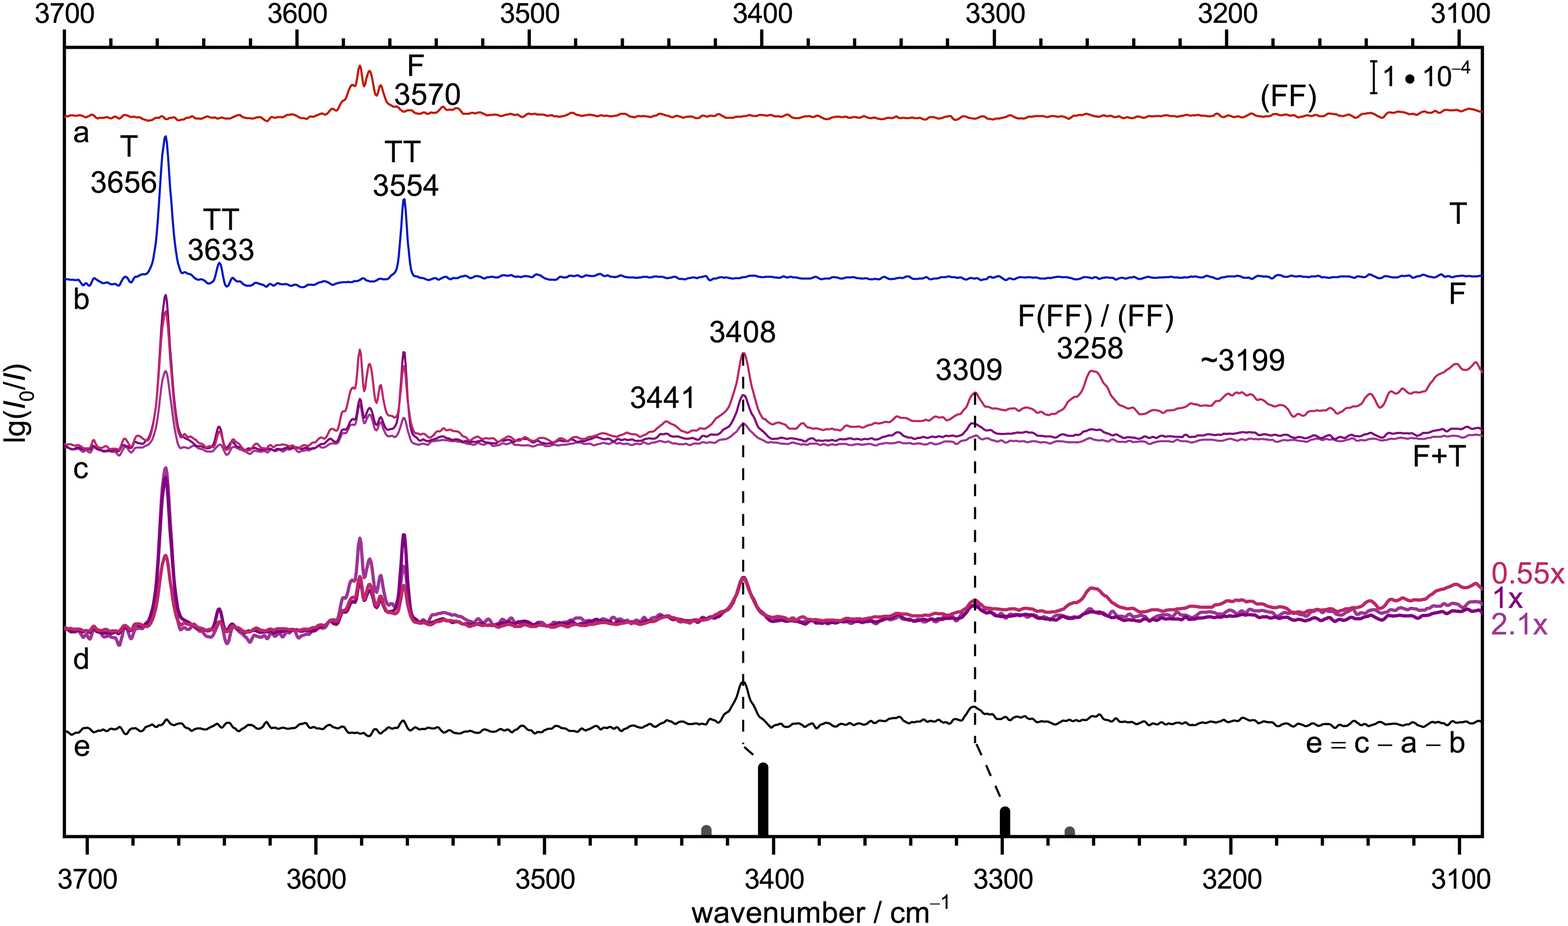 | ||
| Fig. 2 Jet FTIR spectra for He-expansions with (a) 0.02% F, (b) 0.04% T, (c) T + F at different mixing ratios (upper 0.04% + 0.04%, middle 0.04% + 0.02%, lower 0.02% + 0.02%), (d) as (c) but spectra scaled with indicated scaling factors to match for the IR dominant band at 3408 cm−1, (e) difference spectrum for the middle concentration in (c). In the lowest trace, the simulated stick spectrum for the two most stable 1:1 conformers assuming a 100 K conformational Boltzmann distribution is shown (black: (TggF), grey: (TtgF), vide infra for details), harmonic wavenumbers scaled by 0.96, stick height adjusted to match the dominant band of the complex, see Table S3 in the ESI.† Based on the concentration dependence and the simulation, the bands at 3408, 3309 and possibly also 3441 cm−1 have a common 1:1 size assignment and the conformational freezing temperature54 of the (TtgF) isomer is at most 100 K, consistent with facile interconversion to (TggF). | ||
Instead, the conclusions from the infrared spectrum shall first be checked by Raman jet spectroscopy. This is done in Fig. 3, in the same fashion as exemplified in Fig. 2. The diluted T-56 and F-only58 traces b and a are again clean in the relevant range, but show TT dimers and cyclic (FF) dimer signals outside this range. Trace c features three different relative concentrations for mixed expansions. Relative to the blueish trace, the F concentration is doubled and the T concentration halved in the reddish trace, whereas the violet trace has both concentrations halved. This already shows what intensity scaling to the main 3309 cm−1 peak in trace d further confirms: a 1:1 stoichiometry of this peak which is also consistent with the much weaker peak at 3409 cm−1, whereas all further downshifted signals show a different scaling behaviour, even when discounting some broad baseline contribution. Trace e displays the result of an appropriate subtraction of T- and F-only contributions, leaving the two features from the 1:1 complex and one significant signal near 3199 cm−1 (in analogy to the IR signal in Fig. 2) as well as a shoulder to the 3309 cm−1 peak from different complex compositions (see Fig. S5 in the ESI†). As one would expect, the lower wavenumber 1:1 signal has a much higher Raman intensity, in line with its acidic and in-phase stretching character and the associated polarisability change (see Fig. S6 in the ESI†).
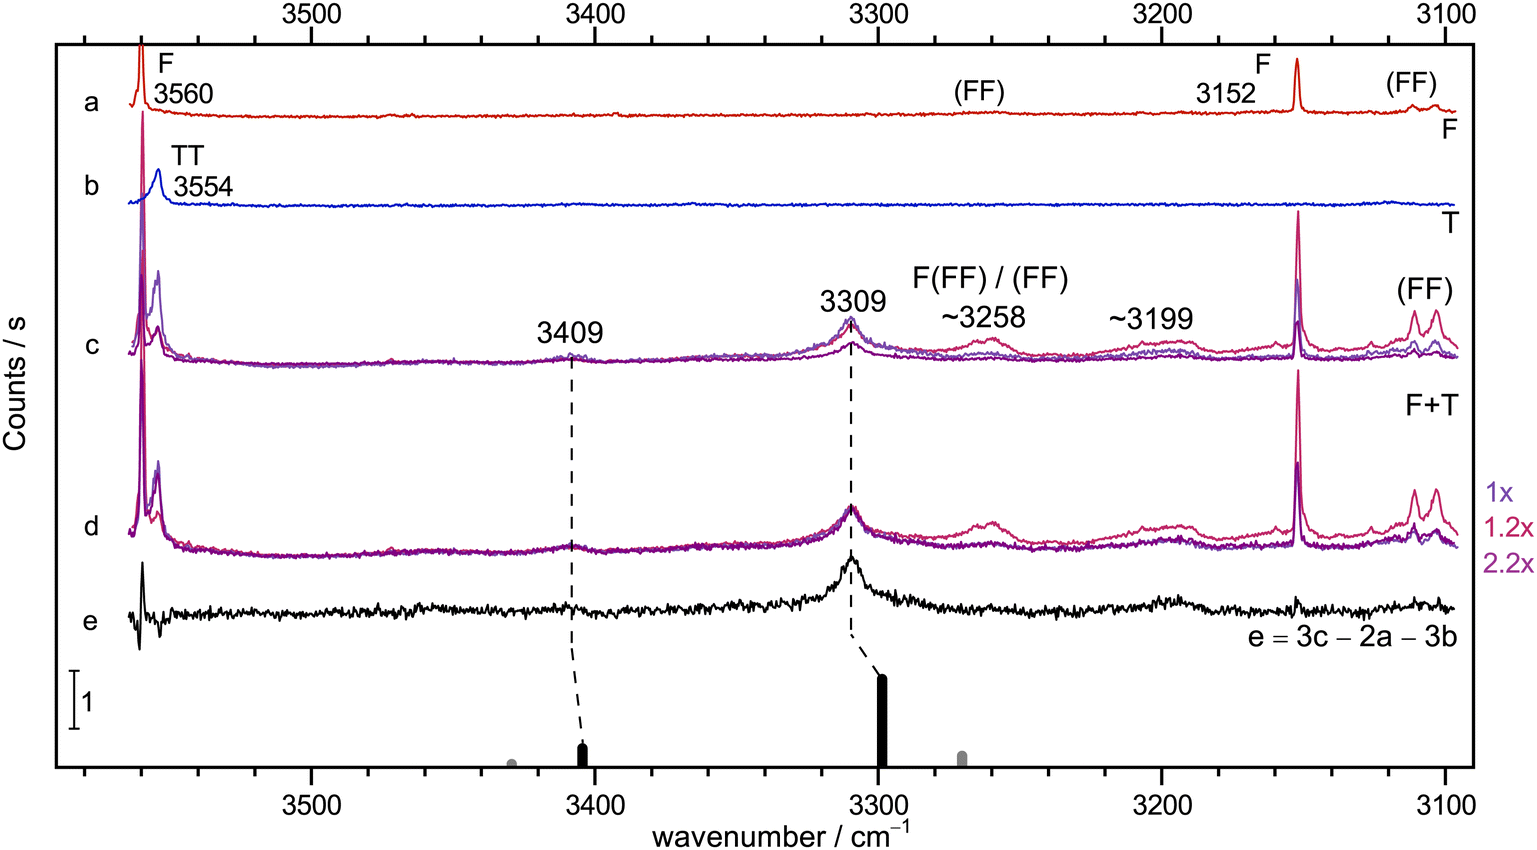 | ||
| Fig. 3 Jet Raman spectra for He-expansions. (a) F, (b) T, (c) T + F with different mixing ratios (see Table S5 in the ESI†), (d) as (c) but scaled spectra with indicated scaling factors to match the Raman dominant band at 3309 cm−1, (e) difference spectrum for the blue spectrum in (c). In the lowest trace, the simulated stick spectrum for the two most stable 1:1 conformers assuming a 100 K conformational Boltzmann distribution is shown (black: (TggF), grey: (TtgF), harmonic wavenumbers scaled by 0.96, stick height adjusted to match the dominant band of the complex, see Table S3 in the ESI†). Based on the concentration dependence and the simulation, the bands at 3409 and 3309 cm−1 have a common 1:1 size assignment and a second isomer does not exceed the noise level. A broad feature at 3199 cm−1 seems to be a result of larger clusters than dimers. | ||
If the weak peaks in the infrared difference spectrum were due to intensity stealing resonance partners of the 1:1 complex vibrations, they should appear with similar relative intensity in the Raman spectrum, in a zeroth-order bright state approximation.60 For the 3309 cm−1 satellites, this can be safely excluded. Therefore, the combination of IR and Raman spectroscopy shows that there is a single dominant 1:1 complex with two at most weakly resonance-affected, coupled OH stretching fundamentals. The slight wavenumber differences are due to calibration, temperature and resolution effects. In the following, we will assign them the IR wavenumbers 3408 and 3309 cm−1, because the IR light probes colder regions of the expansion. Evidence for a minor second isomer is circumstantial, but best for the 3441 cm−1 signal, roughly on a 10% level. This contribution shall be neglected in the following, because of evidence for a very low interconversion barrier (see Fig. 5).
3.2 Comparison to theory
To validate the experimental assignments and to develop suitable levels of theory for future, less straightforward acid–alcohol pairings, Fig. 4 compares the experimental spectra (IR/Raman OH stretching signatures in mirror representation in Fig. 4(A)) to different levels of theory. We start with the standard DFT approach which is also affordable for much larger systems, harmonic B3LYP-D3(BJ) with the def2QZVP basis set (red bars Fig. 4(B)). By using a scaling factor of 0.96, which accounts for neglected anharmonicity and electronic structure deficiencies, a remarkable match for all bands including their intensities and splitting is achieved. A switch to the aVTZ basis set which is more adequate for wave function methods (black bars) illustrates that there is still some basis set dependence for the band positions, which could be remedied by choosing a slightly different scaling factor. Rewardingly, the intensity pattern in the harmonic approximation is robust. A DFT scaling factor of 0.97 would give predictions virtually identical to those of the MP2/aVTZ approach (Fig. 4(C), now without intensity information, 0.96 scaling factor). Therefore, all three harmonic methods make the same prediction, after suitable wavenumber scaling. They all predict a splitting between the two OH oscillators which is somewhat too large, when compared to experiment.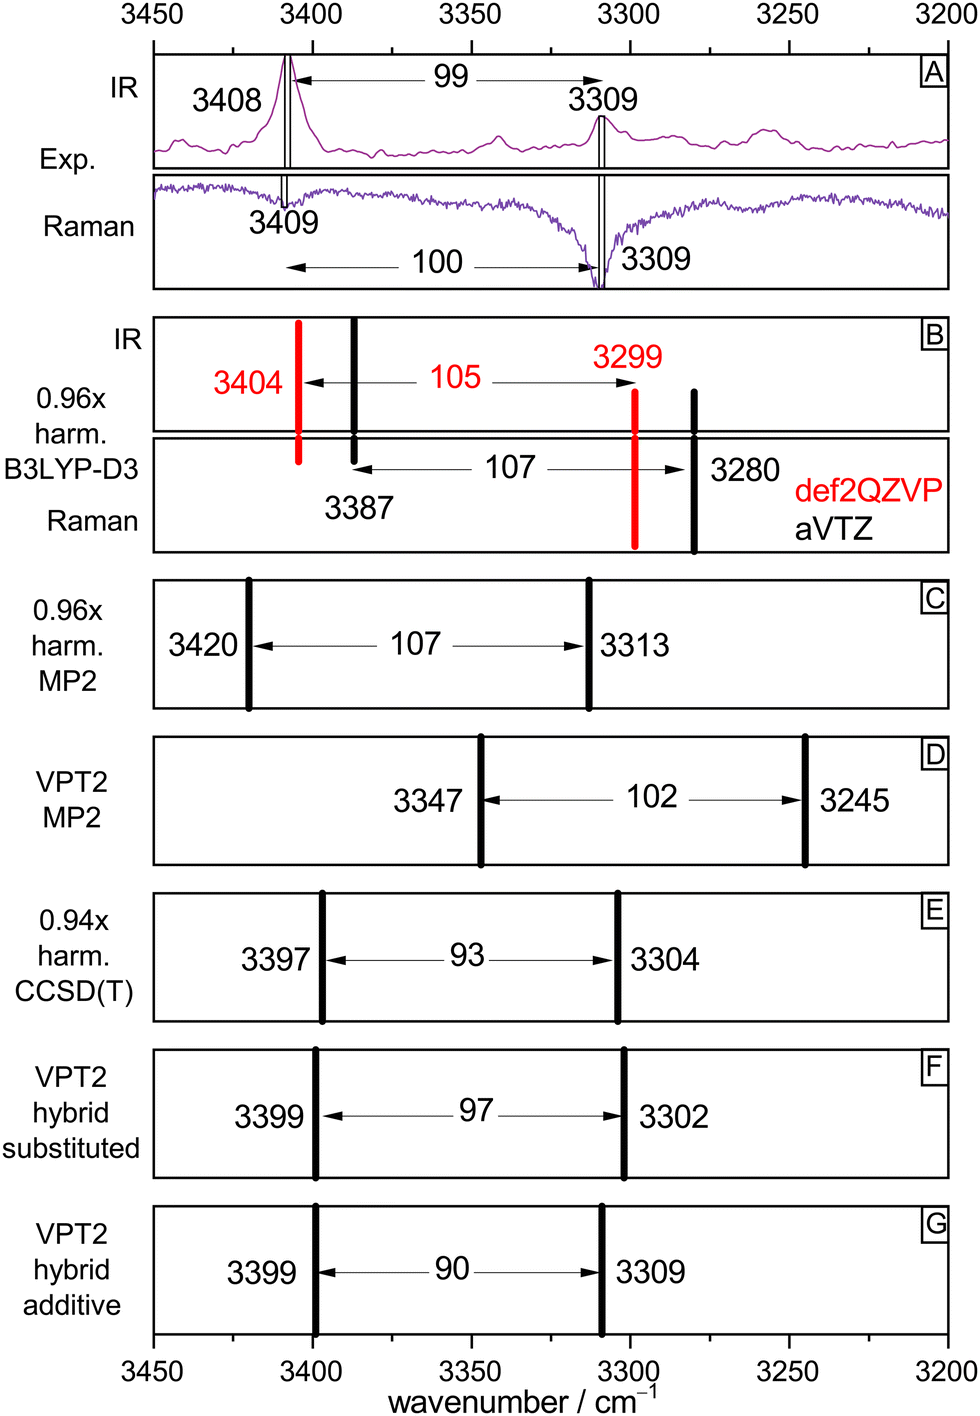 | ||
| Fig. 4 Comparison of experimental OH stretching band positions (from Fig. 2, trace c, IR and Fig. 3, trace c, Raman) and their splitting with harmonic and anharmonic predictions for the (TggF) dimer. See text for explanations. | ||
The robust success of scaled harmonic predictions in capturing the experimental spectral features could be fortuitous. Therefore, the lower part of Fig. 4 deals with the effect of anharmonic perturbation theory on these predictions. At MP2 electronic structure level, VPT2 (Fig. 4(D)) reduces the discrepancy to experiment for the splitting but actually would call for a scaling factor larger than 1.00 to match the band positions. This could be due to an overestimation of anharmonicity by the VPT2 approach or due to a deficiency in MP2. The bottom three boxes (E)–(G) suggest that the deficiency is more likely in the electronic structure level. If the harmonic MP2 contribution is replaced by the unscaled CCSD(T) prediction (which by itself requires a scaling factor of 0.94, showing that the MP2 potential is too shallow), the VPT2 prediction is almost perfect, with a slightly underestimated splitting, independent on the variant used for the hybrid CCSD(T)/MP2 approach. The effect of VPT2 is thus seen to be almost equivalent to a 0.94 scaling of harmonic CCSD(T).
In summary, the 0.96 scaling factor in our standard harmonic B3LYP-D3(BJ)/def2QZVP approach can be viewed as the product of a 0.94 scaling factor for anharmonicity and a 1.02 scaling factor for the exaggerated softness of the DFT OH stretching potential. For the involved monomers T and F, coincidentally the same (rounded) harmonic scaling factor 0.96 applies, but now it is the result of somewhat less anharmonicity (0.95) and less harmonic DFT softness exaggeration (1.01), for details see Table S2 in the ESI.† Most importantly, the analysis shows that harmonic scaling is an acceptable procedure to assign OH stretching spectra of acid–alcohol complexes of the type TF.
4 Further theory predictions after spectral validation
After the successful experimental validation of a single dominant 1:1 acid–alcohol complex conformation in the expansion, the theoretical predictions can be further analysed in terms of metastable conformations and interconversion paths.
The alcohol T offers two conformations, with the enantiomeric pair of Tg conformers being significantly lower in energy than the achiral Tt structure.56 When it acts as a hydrogen bond acceptor, one can further distinguish donor attachment to its g lone electron pair Tg or its t lone electron pair Tt. This gives rise to two energetically attractive TF complexes which have been mentioned before, (TggF) and (TtgF), where the parentheses symbolise a cyclic or closed hydrogen bond pattern. Their interconversion via a kind of hinge motion is illustrated in Fig. 5. The barrier from the metastable structure to the most stable structure is quite small electronically and essentially vanishes when zero-point energy (ZPE, without the imaginary components) is added to the stationary points. Therefore, rather complete relaxation is expected in a supersonic jet expansion, consistent with the experimental finding of at best circumstantial evidence for (TtgF). The hinge-like degree of freedom does not add further complexity to the spectrum, which is welcome and can be exploited in later work for molecular recognition phenomena between the distant alcohol and acid substituents in the spirit of an intermolecular balance.54 Other isomers (ESI,† Fig. S2) are too high in energy to be relevant for our experiment.
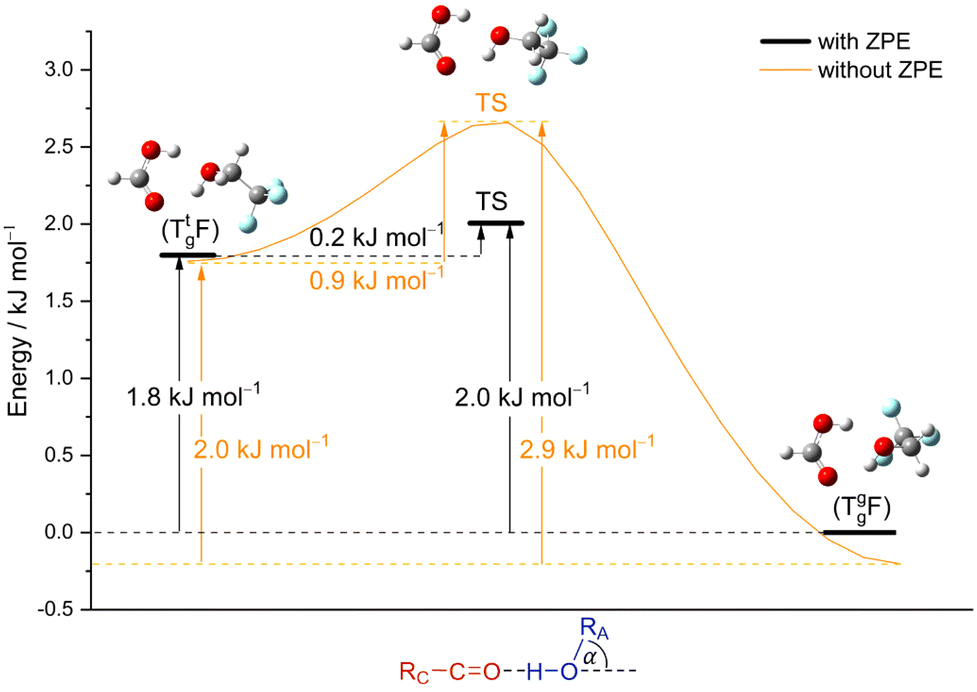 | ||
| Fig. 5 Energy profile calculated at B3LYP-D3(BJ)/def2QZVP level for the isomerism of the metastable (TtgF) complex on the left to the global minimum (TggF) structure on the right (lone pair switch) along the hinge angle. Shown with and without zero-point vibrational energy. | ||
Another relevant issue is whether symmetric OH stretching excitation (experimentally 3309 cm−1, hybrid VPT2 3302–3315 cm−1, best harmonic 3515 cm−1, harmonic B3LYP-D3(BJ)/def2QZVP 3436 cm−1) comes close to or even exceeds the barrier for concerted proton exchange, which involves a similar hydrogen motion. This is illustrated in Fig. 6 as a function of the difference between the two proton distances from their next acidic oxygen neighbour. When this difference vanishes, a Cs saddle point is reached. One can see that this transition state is higher than the fundamental excitation of the symmetric stretching mode, when harmonic zero-point energy in the reactants and the transition state is included. Therefore, vibrational excitation cannot lead to a ballistic double proton transfer, although tunnelling mechanisms are still conceivable.61 In the experimental spectra, there is no evidence for a resolved tunnelling splitting. Instead, the spectra are still consistent with excitation within a single well and the energy flow appears to be slow enough to conserve a narrow band profile.
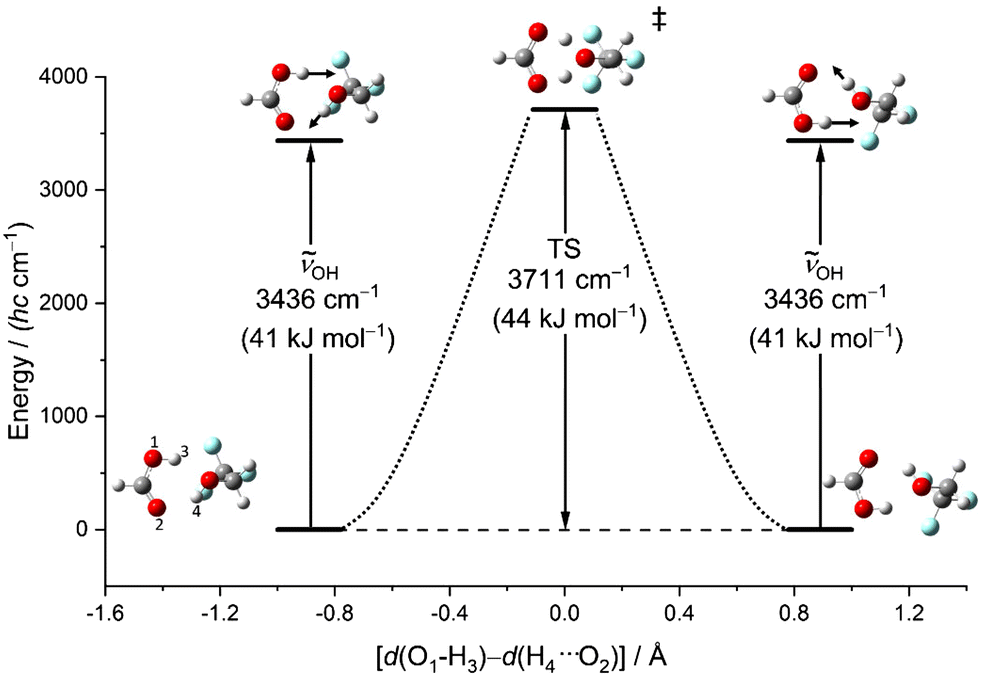 | ||
| Fig. 6 Energy profile calculated at B3LYP-D3(BJ)/def2QZVP level (ZPE corrected) for the proton exchange promoted by the symmetric OH stretch vibration in the most stable (TggF) dimer. As the exchange coordinate, the difference between the chemical and the hydrogen-bonded distances of the two jumping protons from the acid oxygens is chosen. The transition state (1620i cm−1), where this difference vanishes, has Cs symmetry. | ||
From the chirality perspective, T itself is transiently chiral and introduces chirality into the (TggF) complex with the otherwise planar formic acid. Concerted double proton exchange between the acid and the alcohol corresponds to inversion and finally racemisation of the initially chiral complex whereas the more facile hinge motion conserves chirality and thus develops a preference for one side of the acid plane. The torsional isomerisation of Tg within the complex over a Tt transition state offers two energetically almost equivalent paths to racemise without exchanging atoms between the binding partners, one via hinge isomerisation and a direct one (see Fig. 7 for the saddle points). The direct path is only about 0.2 kJ mol−1 higher in energy, well within the uncertainty of the computational level.
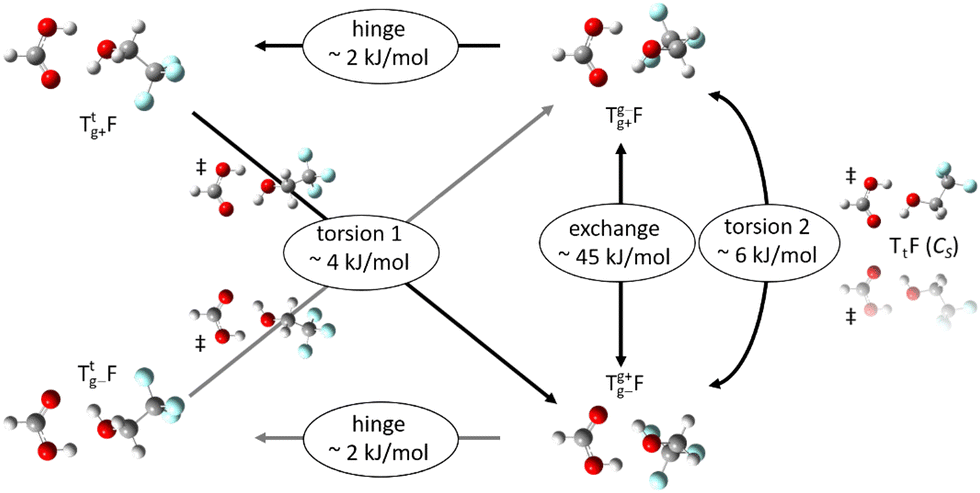 | ||
| Fig. 7 Chirality-focused overview on the isomerisation options of the TgF complex at B3LYP-D3(BJ)/def2QZVP level (ZPE corrected). Facile hinge motion conserves the Tg chirality, whereas Tg+ ↔ Tg− inversion can be achieved by alcohol torsion through a transition state with mirror plane or through an asymmetric transition state following hinge motion, and also by concerted double proton transfer through an exchange barrier above the OH stretching fundamental excitation. | ||
Finally, the theoretical intensity calculations also allow to assess the fraction of T and F engaged in 1:1 complexes in the spectra shown. As is usual in this kind of experiments, the fraction ranges between about 1% and 10%. Competing ester formation in the potentially reactive mixture cannot be strictly ruled out due to another IR chromophore window, but significant amounts would show up as mixed complexes of the acid and alcohol with the ester and with water as the byproduct. Therefore, a microwave investigation of this system with unambiguous 1:1 complex propensity may provide further insights into the elusiveness of such complexes in rotational studies.
5 Conclusions
Even without significant theory input, the experimental OH stretching spectra of co-expansions of T(rifluorethanol) and F(ormic acid) reveal a single dominant isomer (and its enantiomer), which involves a hydrogen bond from the acidic OH to the alcoholic OH and a second one back to the carboxylic group. Harmonic and even more anharmonic (VPT2) vibrational predictions for the lowest computed energy structure of the TF complex reproduce the wavenumber and intensity patterns from Raman and IR experiments very well. This suggests that theory can be trusted in the description of this strongly hydrogen bonded system, in which the alcohol component keeps its monomeric gauche preference and performs a hinge-like motion across the formic acid plane. The hinge barrier is low enough such that the best fitting alcoholic lone electron pair (gauche) is offered to the acid, but the metastable isomer engaging the trans lone electron pair is only 2 kJ mol−1 higher. If both hydrogens in the global minimum structure concertedly jump to their bonding partner, a mirror-image structure emerges in which the carbonyl and hydroxyl groups of the acid are interchanged. This solvent-assisted degenerate proton exchange has a much higher barrier, but also involves less heavy atom motion, therefore representing a plausible dynamical pathway for energy flow after initial excitation. Basically, it is a protonation of the acid CO group which might further catalyse ester formation, if it were not for the simultaneous deprotonation of the acid O–H group. It is thus a pre-reactive dynamical process, which will parallel to some extent reactivity. However, fundamental OH stretching excitation is not quite enough to overcome the barrier for the TF complex, which may contribute to the high spectral regularity of this system. A potential third isomer, in which the alcohol conformation is trans, actually represents a saddle point which allows for chirality inversion without breaking chemical bonds. This saddle point can also be avoided in favour of a pair of chiral saddle points connecting the hinge isomers via inversion (Fig. 7). These chirality aspects become more interesting when either the alcohol or the acid or both are replaced by permanently chiral species.
Now that a first acid–alcohol complex has been well characterised in its OH stretching dynamics, one can move to more electron rich OH groups which lower the concerted proton transfer barrier below the excitation threshold. Preliminary experimental evidence points at an apparent disappearance of the concerted OH stretch from the experimental spectra, possibly explainable by fast energy flow in the stronger hydrogen bond regime and the resulting spectral intensity redistribution.62
Author contributions
Conceptualisation: MAS, AN(VPT2); data curation: SMS, AN; formal analysis: SMS, AN; funding acquisition: MAS; investigation: SMS, AN(VPT2); supervision: MAS, AN(VPT2); visualisation: SMS; writing – original draft: MAS, AN(VPT2); writing – review & editing: SMS, AN, MAS.Conflicts of interest
There are no conflicts to declare.Acknowledgements
This work was funded by the Deutsche Forschungsgemeinschaft (DFG, German Research Foundation) – 465181753 (SU 121/8-1) and its benchmarking aspects were promoted by the research training group GRK2455 (project 389479699). A. N. thanks the GRK2455 for start-up funding during writing of the manuscript. We thank Sönke Oswald (infrared) and Elisabeth Sennert (Raman) for helpful experimental support and discussions. We acknowledge early discussions with Jer-Lai Kuo about the anharmonic treatment of such complexes and later discussions with John Stanton.References
- M. M. Lawal, T. Govender, G. E. M. Maguire, B. Honarparvar and H. G. Kruger, J. Mol. Model., 2016, 22, 235 CrossRef PubMed.
- P. W. Tiedemann and J. M. Riveros, J. Am. Chem. Soc., 1974, 96, 185–189 CrossRef CAS.
- W. Li, L. Spada, L. Evangelisti and W. Caminati, Spectrochim. Acta, Part A, 2021, 254, 119621 CrossRef CAS PubMed.
- T. Järvinen, J. Lundell and P. Dopieralski, Theor. Chem. Acc., 2018, 137, 100 Search PubMed.
- B. Ouyang, T. G. Starkey and B. J. Howard, J. Phys. Chem. A, 2007, 111, 6165–6175 CrossRef CAS PubMed.
- L. Y. Li, N. A. Seifert, F. Xie, M. Heger, Y. Xu and W. Jäger, Phys. Chem. Chem. Phys., 2018, 20, 21345–21351 RSC.
- L. Evangelisti, L. Spada, W. Li, F. Vazart, V. Barone and W. Caminati, Angew. Chem., Int. Ed., 2017, 56, 3872–3875 CrossRef CAS PubMed.
- L. Spada, L. Evangelisti, W. Li, R. Orlacchio and W. Caminati, J. Phys. Chem. A, 2019, 123, 1785–1789 CrossRef CAS PubMed.
- W. Li, L. Spada, L. Evangelisti, L. Di Silvio and W. Caminati, J. Mol. Struct., 2020, 1209, 127952 CrossRef CAS.
- L. Evangelisti, L. Spada, W. Li, I. Federici and W. Caminati, Mol. Phys., 2018, 116, 3503–3506 CrossRef CAS.
- A. Pysanenko, F. Gámez, K. Fárníková, E. Pluhařová and M. Fárník, J. Phys. Chem. A, 2019, 123, 7201–7209 CrossRef CAS PubMed.
- C. A. Cole, N. Wehres, Z. Yang, D. L. Thomsen, T. P. Snow and V. M. Bierbaum, Astrophys. J., Lett., 2012, 754, L5 CrossRef.
- P. K. Samantaray, A. Little, D. M. Haddleton, T. McNally, B. Tan, Z. Sun, W. Huang, Y. Ji and C. Wan, Green Chem., 2020, 22, 4055–4081 RSC.
- A. Nejad, E. Meyer and M. A. Suhm, J. Phys. Chem. Lett., 2020, 11, 5228–5233 CrossRef CAS PubMed.
- G. M. Blackburn and H. L. H. Dodds, J. Chem. Soc. B, 1971, 826–831 RSC.
- Y. J. Low, A. Andriyana, B. C. Ang and N. I. Z. Abidin, Polym. Eng. Sci., 2020, 60, 2657–2675 CrossRef CAS.
- L.-H. Xu, G. T. Fraser, F. J. Lovas, R. D. Suenram, C. W. Gillies, H. E. Warner and J. Z. Gillies, J. Chem. Phys., 1995, 103, 9541–9548 CrossRef CAS.
- F. Ito and T. Nakanaga, Chem. Phys., 2002, 277, 163–169 CrossRef CAS.
- A. Nejad, K. A. E. Meyer, F. Kollipost, Z. Xue and M. A. Suhm, J. Chem. Phys., 2021, 155, 224301 CrossRef CAS PubMed.
- J. Marco and J. M. Orza, J. Mol. Struct., 1992, 267, 33–38 CrossRef CAS.
- S. Oswald, E. Meyer and M. A. Suhm, J. Phys. Chem. A, 2018, 122, 2933–2946 CrossRef CAS PubMed.
- M. Heger, T. Scharge and M. A. Suhm, Phys. Chem. Chem. Phys., 2013, 15, 16065–16073 RSC.
- J. Thomas and Y. Xu, J. Phys. Chem. Lett., 2014, 5, 1850–1855 CrossRef CAS PubMed.
- D. Priem, T.-K. Ha and A. Bauder, J. Chem. Phys., 2000, 113, 169–175 CrossRef CAS.
- T. L. Fischer, M. Bödecker, A. Zehnacker-Rentien, R. A. Mata and M. A. Suhm, Phys. Chem. Chem. Phys., 2022, 24, 11442–11454 RSC.
- M. A. Suhm and F. Kollipost, Phys. Chem. Chem. Phys., 2013, 15, 10702–10721 RSC.
- T. Forsting and M. Suhm, Curry-Jet SETUP, 2019 DOI:10.6084/m9.figshare.6395840.v1.
- M. A. Suhm, S. M. Schweer and A. Nejad, [196] - replication data, GRO.data, 2022 DOI:10.25625/I67U1B.
- S. Grimme, J. Antony, S. Ehrlich and H. Krieg, J. Chem. Phys., 2010, 132, 154104 CrossRef PubMed.
- S. Grimme, S. Ehrlich and L. Goerigk, J. Comput. Chem., 2011, 32, 1456–1465 CrossRef CAS PubMed.
- F. Weigend and R. Ahlrichs, Phys. Chem. Chem. Phys., 2005, 7, 3297–3305 RSC.
- M. J. Frisch, G. W. Trucks, H. B. Schlegel, G. E. Scuseria, M. A. Robb, J. R. Cheeseman, G. Scalmani, V. Barone, G. A. Petersson, H. Nakatsuji, X. Li, M. Caricato, A. V. Marenich, J. Bloino, B. G. Janesko, R. Gomperts, B. Mennucci, H. P. Hratchian, J. V. Ortiz, A. F. Izmaylov, J. L. Sonnenberg, D. Williams-Young, F. Ding, F. Lipparini, F. Egidi, J. Goings, B. Peng, A. Petrone, T. Henderson, D. Ranasinghe, V. G. Zakrzewski, J. Gao, N. Rega, G. Zheng, W. Liang, M. Hada, M. Ehara, K. Toyota, R. Fukuda, J. Hasegawa, M. Ishida, T. Nakajima, Y. Honda, O. Kitao, H. Nakai, T. Vreven, K. Throssell, J. A. Montgomery, Jr., J. E. Peralta, F. Ogliaro, M. J. Bearpark, J. J. Heyd, E. N. Brothers, K. N. Kudin, V. N. Staroverov, T. A. Keith, R. Kobayashi, J. Normand, K. Raghavachari, A. P. Rendell, J. C. Burant, S. S. Iyengar, J. Tomasi, M. Cossi, J. M. Millam, M. Klene, C. Adamo, R. Cammi, J. W. Ochterski, R. L. Martin, K. Morokuma, O. Farkas, J. B. Foresman and D. J. Fox, Gaussian 16 Revision A.03, Gaussian Inc., Wallingford CT, 2016 Search PubMed.
- E. Miliordos and S. S. Xantheas, J. Chem. Phys., 2015, 142, 094311 CrossRef PubMed.
- A. Nejad and M. A. Suhm, J. Indian Inst. Sci., 2020, 100, 5–19 CrossRef.
- K. A. E. Meyer and A. Nejad, Phys. Chem. Chem. Phys., 2021, 23, 17208–17223 RSC.
- H. H. Nielsen, Rev. Mod. Phys., 1951, 23, 90–136 CrossRef CAS.
- P. R. Franke, J. F. Stanton and G. E. Douberly, J. Phys. Chem. A, 2021, 125, 1301–1324 CrossRef CAS PubMed.
- T. B. Adler, G. Knizia and H.-J. Werner, J. Chem. Phys., 2007, 127, 221106 CrossRef PubMed.
- W. Györffy and H.-J. Werner, J. Chem. Phys., 2018, 148, 114104 CrossRef PubMed.
- K. A. Peterson, T. B. Adler and H.-J. Werner, J. Chem. Phys., 2008, 128, 084102 CrossRef PubMed.
- H.-J. Werner, P. J. Knowles, G. Knizia, F. R. Manby, M. Schütz, P. Celani, W. Györffy, D. Kats, T. Korona, R. Lindh, A. Mitrushenkov, G. Rauhut, K. R. Shamasundar, T. B. Adler, R. D. Amos, S. J. Bennie, A. Bernhardsson, A. Berning, D. L. Cooper, M. J. O. Deegan, A. J. Dobbyn, F. Eckert, E. Goll, C. Hampel, A. Hesselmann, G. Hetzer, T. Hrenar, G. Jansen, C. Köppl, S. J. R. Lee, Y. Liu, A. W. Lloyd, Q. Ma, R. A. Mata, A. J. May, S. J. McNicholas, W. Meyer, T. F. Miller III, M. E. Mura, A. Nicklass, D. P. O’Neill, P. Palmieri, D. Peng, K. Pflüger, R. Pitzer, M. Reiher, T. Shiozaki, H. Stoll, A. J. Stone, R. Tarroni, T. Thorsteinsson, M. Wang and M. Welborn, MOLPRO, version 2018.1, a package of ab initio programs, 2018, see https://www.molpro.net Search PubMed.
- H.-J. Werner, P. J. Knowles, G. Knizia, F. R. Manby and M. Schütz, Wiley Interdiscip. Rev.: Comput. Mol. Sci., 2012, 2, 242–253 CAS.
- H.-J. Werner, P. J. Knowles, F. R. Manby, J. A. Black, K. Doll, A. Heßelmann, D. Kats, A. Köhn, T. Korona, D. A. Kreplin, Q. Ma, T. F. Miller III, A. Mitrushchenkov, K. A. Peterson, I. Polyak, G. Rauhut and M. Sibaev, J. Chem. Phys., 2020, 152, 144107 CrossRef CAS PubMed.
- M. Head-Gordon and T. Head-Gordon, Chem. Phys. Lett., 1994, 220, 122–128 CrossRef CAS.
- R. A. Kendall, T. H. Dunning Jr. and R. J. Harrison, J. Chem. Phys., 1992, 96, 6796–6806 CrossRef CAS.
- V. Barone, J. Chem. Phys., 2005, 122, 014108 CrossRef PubMed.
- G. Ceselin, Z. Salta, J. Bloino, N. Tasinato and V. Barone, J. Phys. Chem. A, 2022, 126, 2373–2387 CrossRef CAS PubMed.
- M. Ringholm, D. Jonsson, R. Bast, B. Gao, A. J. Thorvaldsen, U. Ekström, T. Helgaker and K. Ruud, J. Chem. Phys., 2014, 140, 034103 CrossRef PubMed.
- A. Pietropolli Charmet and Y. Cornaton, J. Mol. Struct., 2018, 1160, 455–462 CrossRef CAS.
- J. M. L. Martin, T. J. Lee, P. R. Taylor and J.-P. François, J. Chem. Phys., 1995, 103, 2589–2602 CrossRef CAS.
- E. B. Wilson Jr., J. C. Decius and P. C. Cross, Molecular Vibrations: The Theory of Infrared and Raman Vibrational Spectra, Dover Publications Inc., New York, 1980 Search PubMed.
- J. F. Stanton, J. Gauss, L. Cheng, M. E. Harding, D. A. Matthews and P. G. Szalay, CFOUR, Coupled-Cluster techniques for Computational Chemistry, a quantum-chemical program package, With contributions from A.A. Auer, R.J. Bartlett, U. Benedikt, C. Berger, D.E. Bernholdt, Y.J. Bomble, O. Christiansen, F. Engel, R. Faber, M. Heckert, O. Heun, M. Hilgenberg, C. Huber, T.-C. Jagau, D. Jonsson, J. Jusélius, T. Kirsch, K. Klein, W.J. Lauderdale, F. Lipparini, T. Metzroth, L.A. Mück, D.P. O’Neill, D.R. Price, E. Prochnow, C. Puzzarini, K. Ruud, F. Schiffmann, W. Schwalbach, C. Simmons, S. Stopkowicz, A. Tajti, J. Vázquez, F. Wang, J.D. Watts and the integral packages MOLECULE (J. Almlöf and P.R. Taylor), PROPS (P.R. Taylor), ABACUS (T. Helgaker, H.J. Aa. Jensen, P. Jørgensen, and J. Olsen), and ECP routines by A. V. Mitin and C. van Wüllen. For the current version, see https://www.cfour.de.
- D. A. Matthews, L. Cheng, M. E. Harding, F. Lipparini, S. Stopkowicz, T.-C. Jagau, P. G. Szalay, J. Gauss and J. F. Stanton, J. Chem. Phys., 2020, 152, 214108 CrossRef CAS PubMed.
- A. Poblotzki, H. C. Gottschalk and M. A. Suhm, J. Phys. Chem. Lett., 2017, 8, 5656–5665 CrossRef CAS PubMed.
- T. Scharge, T. Häber and M. A. Suhm, Phys. Chem. Chem. Phys., 2006, 8, 4664–4667 RSC.
- T. Scharge, C. Cézard, P. Zielke, A. Schütz, C. Emmeluth and M. A. Suhm, Phys. Chem. Chem. Phys., 2007, 9, 4472–4490 RSC.
- T. Scharge, T. N. Wassermann and M. A. Suhm, Z. Phys. Chem., 2008, 222, 1407–1452 CrossRef CAS.
- A. Nejad and E. L. Sibert III, J. Chem. Phys., 2021, 154, 064301 CrossRef CAS PubMed.
- C. Emmeluth, M. A. Suhm and D. Luckhaus, J. Chem. Phys., 2003, 118, 2242–2255 CrossRef CAS.
- G. Herzberg, Molecular spectra and molecular structure. II. Infrared and Raman spectra of polyatomic molecules, D. van Nostrand, 1st edn, New York, 1945 Search PubMed.
- M. Pettersson, E. M. S. Maçôas, L. Khriachtchev, R. Fausto and M. Räsänen, J. Am. Chem. Soc., 2003, 125, 4058–4059 CrossRef CAS PubMed.
- E. L. Sibert III, K. N. Blodgett and T. S. Zwier, J. Phys. Chem. A, 2021, 125, 7318–7330 CrossRef PubMed.
Footnote |
| † Electronic supplementary information (ESI) available: Details on computational modelling and experimental spectra. See DOI: https://doi.org/10.1039/d2cp04176f |
| This journal is © the Owner Societies 2022 |