 Open Access Article
Creative Commons Attribution 3.0 Unported Licence
Crystal growth and structure of a high temperature polymorph of Sr2TiO4 with tetrahedral Ti-coordination, and transition to the Ruddlesden–Popper tetragonal phase
Dorota
Pulmannová
 *a,
Céline
Besnard
 a,
Petr
Bezdička
b,
Marios
Hadjimichael
 a,
Jéremie
Teyssier
a and
Enrico
Giannini
 a
a
aDepartment of Quantum Matter Physics, University of Geneva, Quai Ernest-Ansermet 24, Switzerland. E-mail: dorota.pulmannova@unige.ch
bInstitute of Inorganic Chemistry of the Czech Academy of Sciences, 250 68 Husinec-Řež, Czech republic
First published on 5th May 2022
Abstract
Single crystals of transition metal oxides forming the Ruddlesden–Popper series are necessary for complete studies of their often exciting physical properties. In the strontium titanate family, crystal growth of all compounds apart from SrTiO3 has been elusive so far. We have successfully grown crystals of the high-temperature polymorph of Sr2TiO4, by using a floating-zone melt growth followed by a rapid cooling procedure. We report the crystal structure of the new modification, which is isostructural to the orthorhombic Sr2VO4 and Sr2CrO4. This structure hosts an uncommon layered sub-lattice of TiO4 tetrahedra and transforms into the tetragonal low-temperature polymorph via a complex reconstructive transition. The transformation mechanism between the two phases was studied and explains the reasons for the unsuccessful growth of tetragonal Sr2TiO4. The orthorhombic Sr2TiO4 is an insulator, with a band gap of 3.9 eV. It has a large (≈40) dielectric constant, but despite its polar structure does not show any signatures of a ferroelectric order.
1 Introduction
Transition-metal oxides which crystallize in the Ruddlesden–Popper (RP) series An+1BnO3n+1 (A = alkaline or rare earth, B = transition metal element) are characterized by a periodic stacking of perovskite-like blocks (ABO3)n and rock-salt layers (AO). These compounds often exhibit exciting properties, which can be tuned by controlling the arrangement of the perovskite blocks. In the case of Srn+1TinO3n+1 series, the end compound SrTiO3 (corresponding to n = ∞) is one of the most intriguing and studied perovskite materials: its insulating ground state can be switched to conducting and even superconducting upon doping, pressure or strain, and its peculiar quantum paraelectric state can be driven to ferroelectricity.1 The other end member, Sr2TiO4 with n = 1, which can be viewed as the 2D limit of the series, is isostructural with the high temperature superconductor (La,Sr)2CuO4, the unconventional superconductor Sr2RuO4 and the spin–orbital ordered compounds Sr2IrO4 and Sr2VO4. Long known for its thermoelectric properties,2 it has been recently brought to the fore also for its photocatalytic performance.3 Moreover, Sr2TiO4 can serve as a platform for exploring the 2D electron liquid on the SrTiO3 perovskite interfaces.4While SrTiO3 is widely studied, the growth process can be controlled to a high degree of perfection5 and crystals are even commercially available, the other members of the series are much less known and poorly investigated, mainly because of the difficulties to prepare high quality samples. Epitaxial thin films of the first members (n < 5) have been successfully grown and the dielectric constant was measured as a function of n,6 but bulk crystals of these compounds have never been reported.
According to the SrO–TiO2 phase diagram assessed by Cocco & Massazza sixty years ago,7 only SrTiO3 and Sr2TiO4 are in equilibrium with a high-temperature (>1800 °C) melt, but the latter melts incongruently and undergoes a destructive structural transition upon cooling, frustrating any attempts to grow crystals. There are no studies of this phase transition and the structure of the high temperature phase is unknown, except for an unindexed powder pattern given by Dryś & Trzebiatowski.8
We have stabilized the high-temperature phase of Sr2TiO4 in a bulk single crystal form by quenching of the floating molten zone, and we have investigated its crystal structure. In this modification titanium atoms occupy sites with tetrahedral oxygen coordination, which is rather unusual among the titanates and might be potentially interesting for applications, as other oxides with tetrahedral coordination of titanium are already known for their photocatalytic activity.9 In this article, we report the crystal structure of the new high-temperature polymorph. We present the studies of its stability with X-ray diffraction, differential thermal analysis and Raman spectroscopy, we discuss the mechanism driving the transition and report the dielectric constant and the optical gap of this new compound.
2 Experimental
2.1 Sample preparation
Crystals of Sr2TiO4 were grown from the melt by the floating zone method. Two polycrystalline rods (the “feed” and the “seed”) were prepared from stoichiometric amounts of SrCO3 (99.99% Cerac) and TiO2 (99.99%, Alpha Aesar), calcined at 1200 °C for 12 hours, ground, pressed into a pellet and annealed for 12 hours at 1100 °C. After verifying that the only phase present was Sr2TiO4, the powder was pressed in a rubber tube with 7 mm diameter at 300 MPa in ethanol, then sintered at 1400 °C in flowing O2 gas. Straight, dense and homogenous precursor rods were obtained (see Fig. 1(a)). They were mounted in a two-mirror furnace (Image Furnace by Cyberstar®), equipped with two either 1000 W or 2000 W halogen lamps. The feed rod was suspended on a Pt wire and rotated at 12 rpm, the seed rod was mounted on a fixed Al2O3 holder and counterrotated at 12 rpm. The travelling velocity was 1–1.5 mm h−1. The molten zone could be observed with a camera (Fig. 1(b)) and the crystal grew with visible facets. After 5–10 hours of growth, the lamps were turned off abruptly and at the same time the seed rod was pulled downwards at the fastest velocity of 90 mm min−1. Given the estimated temperature gradient at the liquid–solid interface of ∼30–40 °C mm−1, this corresponds to a cooling rate faster than 300 °C min−1.2.2 X-ray diffraction
Single crystal diffraction data were collected on a Rigaku Supernova diffractometer equipped with an ATLAS CCD camera using Mo Kα radiation at T = 100 K. The structure was solved by SHELXT10 and the refinement was carried away in SHELXL11 using full-matrix least square method on F2.The Laue diffraction was measured in back-reflection, using tungsten radiation and a two-dimensional gas detector (MultiWire®Laboratories). The powder diffraction at room temperature was measured with a PANalytical Aeris diffractometer equipped with a PIXcel 1D Medipix detector and a Cu X-ray tube operating at 40 kV and 7.5 mA in the range of 15 to 130° (2θ).
High temperature diffraction patterns were collected with a PANalytical X'Pert PRO diffractometer equipped with a conventional X-ray tube (Co Kα radiation, 40 kV, 30 mA, line focus) and a multichannel detector X'Celerator with an anti-scatter shield. Scans were collected in a 2θ range of 15 to 70° (step of 0.0334° and 50 s counting per step yielding a scan of ca. 11 minutes). Samples were heated in the high temperature chamber (HTK 16, Anton Paar). For each experiment a small amount of powder was placed on the Pt sample holder, which served as the heating element at the same time. Two experiments were performed. In one, the X-ray pattern was measured at different temperatures between 25 and 800 °C, with the heating ramp of 5 °C min−1 (the temperature was kept constant during each measurement). In the second experiment the sample was heated rapidly (60 °C min−1) to 550 °C and repeated scans were collected during five hours.
The diffraction patterns were analysed using the Profex/BGMN software.12 For the refinement of the lattice parameters at elevated temperature the specimen displacement and the zero shift of the detector were fixed at zero value, which resulted in the refinement in which the lattice parameter of platinum at all temperatures was very close to the reported values.13
2.3 Differential thermal analysis
DTA measurements were performed in a Setaram TAG-24 thermal analyser using Al2O3 as reference in flowing synthetic air (O2 21%, Ar balance). Powder samples of ca 50 mg were put in a Al2O3 crucible without a lid and heated at a rate of 5 °C min−1.2.4 Spectroscopy
Raman spectroscopy down to 50 K was performed on the Horiba LabRAM HR Evolution spectrometer with an excitation wavelength of 532 nm and the resolution of 0.5 cm−1. The polished (100)-oriented single crystal samples were glued onto the copper plate of a He flow cryostat with silver paint. The actual temperature of the sample was estimated from the intensity ratio between the Stokes and anti-Stokes lines using the Reffit software.14The static dielectric constant was determined from the complex impedance of a parallel plate capacitor with an Agilent E4980A LCR meter over a range of 100 Hz to 1 MHz using excitation fields between 1 and 7 V cm−1. Gold electrodes were evaporated on both sides of the polished sample with a thickness of 750 μm and contacted with silver paint.
The complex dielectric constant was also measured on polished samples mounted on Cu cones in a range from 4000 to 40![[thin space (1/6-em)]](https://www.rsc.org/images/entities/char_2009.gif) 000 cm−1 with a J. A. Woollam variable angle spectroscopic ellipsometer.
000 cm−1 with a J. A. Woollam variable angle spectroscopic ellipsometer.
3 Results and discussion
3.1 Crystal growth
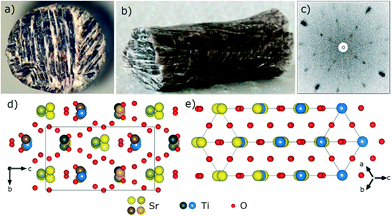
The as-grown top-end of the crystallized rod is shown in Fig. 1(c). Due to the vertical temperature profile of the mirror furnace and the need to quench the crystals from high temperature (the phase transition to the low temperature polymorph is supposed to take place at ∼1550 °C), the length of the crystallized rod is limited to ∼8–10 mm. The part of the rod which contains the high-temperature phase is transparent, with yellow to purple hue. It can be cut with a wire saw and polished to obtain flat slabs of a thickness of 500–900 μm. The very fast cooling rate, the mechanical cut and polishing induce several cracks in the crystals, and individual crack-free grains are obtained with an area of ∼1 mm2 (Fig. 1(d)).The Laue pattern measured on the top part of the crystalline rod in the growth direction is shown in Fig. 2(b): a slightly distorted six-fold pattern indicates a pseudo-hexagonal axis along the growth direction.
A small quantity of the crystals was ground into powder for further characterization. The X-ray powder diffraction pattern (Fig. 2(c)) agrees very well in the range between 30 and 60° (2θ, Cu) with the 10 most prominent diffraction lines proposed by Dryś et al. for the high-temperature structural modification of Sr2TiO4.8
3.2 Crystal structure
Crystallographic data are reported in Table 1. Unwarped single crystal data are shown in Fig. 2(a).| a The structure is non-centrosymmetric achiral, the inversion domains are related by a pure rotation. | |
|---|---|
| Empirical formula | O4Sr2Ti |
| Formula weight | 287.14 |
| Temperature/K | 100.0(1) |
| Crystal system, space group | Orthorhombic, Pna21 |
| a, b, c (Å) | 14.2901(5), 5.87288(18), 10.0872(3) |
| α, β, γ (°) | 90, 90, 90 |
| Volume (Å3) | 846.56(5) |
| Z | 8 |
| ρ calc (g cm−3) | 4.506 |
| μ (mm−1) | 26.829 |
| F(000) | 1040.0 |
| Crystal size (mm3) | 0.306 × 0.151 × 0.115 |
| Radiation | Mo Kα (λ = 0.71073 Å) |
| 2θ range for data collection (°) | 5.702 to 57.338 |
| Index ranges | −18 ≤ h ≤ 18, −7 ≤ k ≤ 7, −12 ≤ l ≤ 12 |
| Reflections collected | 12![[thin space (1/6-em)]](https://www.rsc.org/images/entities/char_2009.gif) 336 336 |
| Independent reflections | 1989 [Rint = 0.0545, Rσ = 0.0355] |
| Data/restraints/parameters | 1989/1/128 |
| Goodness-of-fit on F2 | 1.080 |
| Final R indexes [I ≥ 2σ(I)] | R 1 = 0.0287, wR2 = 0.0659 |
| Final R indexes [all data] | R 1 = 0.0308, wR2 = 0.0671 |
| Largest diff. peak/hole (e Å−3) | 0.84/−0.94 |
| Flack parametera | 0.492(15) |
High-temperature Sr2TiO4 crystallizes with the orthorhombic symmetry and is isostructural with the orthorhombic forms of Sr2VO4 and Sr2CrO4.†
These compounds belong to the β-K2SO4 structure type, which itself can be described as a distortion of the hexagonal α-K2SO4. In the orthorhombic Sr2TiO4, the 63 screw axis, which runs along the a direction in the hexagonal archetype, is lost due to a slight deformation of the unit cell. The ratio between the b and c lattice parameters is no longer  , as would be expected for a hexagonal lattice described by a centered orthorhombic cell, see Fig. 3(d).
Nevertheless, the pseudohexagonal symmetry along a is conserved to some extent, because the c-parameter 10.0872 Å is rather close to  . Both the Laue pattern in Fig. 2(b) and the unwarped single crystal data in Fig. 2(a) collected along the a-axis show this pseudohexagonal symmetry, which is also visible in the arrangement of the atoms in the crystal structure, see Fig. 3(b).
Perpendicular to the b axis, there are planes formed only by oxygen atoms, alternating with planes containing cations and oxygen atoms, as can be seen in Fig. 3 (upper panels).
Compared to the α-K2SO4 structural type, the unit cell of the orthorhombic Sr2TiO4 is doubled along the a axis and the two subcells along a are slightly misaligned, so that the cationic/anionic planes are “pleated”, and the titanium atoms are not all symmetrically equivalent anymore, (Fig. 3, left panels).
It is important to note that in these structures the transition metal occupies the tetrahedral cavities, which is a very rare case among the titanates, the other example being only Ba2TiO4. Sr2TiO4 is, however, not isostructural with Ba2TiO4, in which the structure is closer to the hexagonal archetype, less distorted, the cationic/anionic planes are less pleated, but the unit cell is tripled along the pseudohexagonal axis.
Two types of symmetrically independent TiO4−4 tetrahedra are present (central Ti atoms drawn blue and green in Fig. 3), which are considerably distorted. These distortions can be evaluated quantitatively, based on the continuous symmetry measures approach.15 The S-values and bond valences,16,17 of few relevant structures are listed in Table 2.
| α-K2SO4 | α-Ba2TiO4-1 | α-Ba2TiO4-2 | α-Ba2TiO4-3 | β-Ba2TiO4 | ||
|---|---|---|---|---|---|---|
| Valence | 6.41 | 4.14 | 3.96 | 3.95 | 4.09 | |
| S(Td) | 0.006 | 0.091 | 0.190 | 0.066 | 0.068 |
| Sr2TiO4-1 | Sr2TiO4-2 | Sr2CrO4-1 | Sr2CrO4-2 | Sr2VO4-1 | Sr2VO4-2 | |
|---|---|---|---|---|---|---|
| Valence | 4.09 | 3.95 | 3.98 | 3.62 | 4.49 | 3.77 |
| S(Td) | 0.279 | 1.14 | 0.201 | 1.184 | 0.790 | 1.692 |
The continuous symmetry measure represents the smallest deformation of the polyhedron necessary to obtain the required symmetry. It is independent on size, allowing a comparison of tetrahedra with different central atoms. The tetrahedron in the α-K2SO4, which can serve as an approximation for the hypothetical hexagonal superstructure, is very regular, with the S(Td) value of 0.006 and with a rather dense structure, manifested by the higher valence of the sulphur than usual. When the structure loses the hexagonal symmetry, the S(Td) value is first increased by one order of magnitude in the Ba2TiO4 structures, then by another order of magnitude as barium is substituted by smaller strontium. Two symmetrically non-equivalent tetrahedra in the strontium compounds are very distinct, with different bond valence and a different degree of distortion. The tetrahedra geometries are very similar in the chromium and the vanadium compound, but while in the Sr2TiO4 the valence of titanium is close to 4, in the Sr2CrO4 it is slightly lower and in the Sr2VO4 it is slightly higher, as can be expected from their preferred valence of 3 and 5, respectively.
It should be noted that single crystals of the structural prototype Sr2CrO4 have been grown by melting in a Pt crucible by Wilhelmi in 1966.18 Single crystals of the Sr2VO4, which is a magnetic spin dimer system,19 have been grown recently by the optical floating zone method, substituted by up to 20% of Ti.20
3.3 Raman spectroscopy
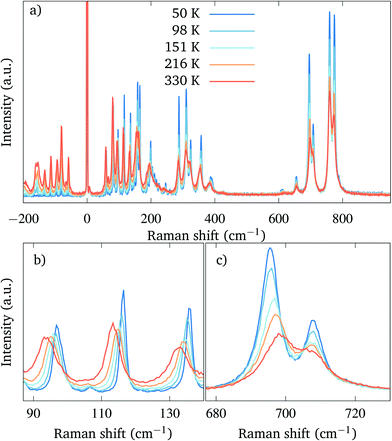
Raman spectroscopy was performed on the polished crystals of the orthorhombic Sr2TiO4. The spectra measured at different temperatures are plotted in Fig. 4. The lowest temperature we were able to reach due to the absorption of the laser by our material was 50 K.The spectra contain a large number of overlapping peaks, as can be expected from the rather low symmetry and the large unit cell,‡ in contrast to the tetragonal modification, in which only four modes are active.22
Upon cooling down from room temperature, we do not observe any structural transition and the orthorhombic phase remains stable down to 50 K. (Fig. 4(a)). With a decreasing temperature, the Raman peaks become narrower and better separated, and we observe an overall increase of the intensity and a general hardening of the modes. Interestingly, however, the hardening of the modes with cooling is not uniform and one particular mode even follows the opposite trend (Fig. 4(b) and (c)).
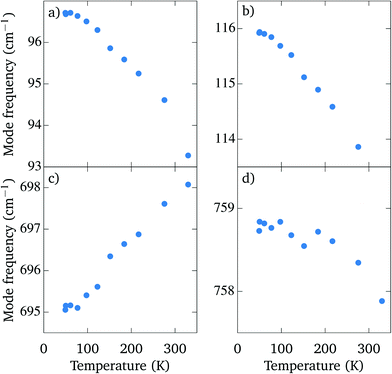
In Fig. 5 the frequencies of selected modes with high intensity are plotted as a function of the temperature. The hardening is strongest for the mode at 93 cm−1 (Fig. 5(a)), whose frequency increases by 3.5 cm−1 upon cooling. On the other hand, there is a mode at 695 cm−1 (Fig. 5(c)) which softens by 3 cm−1 when the crystals are cooled down to 50 K. A similar positive temperature dependence of the modes was described in the tetragonal modification of Sr2TiO4, where it was attributed to an anharmonic contribution to the potential well.22 Lastly, there is also a mode of high intensity at 758 cm−1 (Fig. 5(d)), whose frequency changes by less than 1 cm−1 when the temperature is lowered.
We did not find any report of Raman spectroscopy performed on the orthorhombic Sr2VO4 and Sr2CrO4. For this reason we prepared a ceramic sample of Sr2CrO4 which contained impurities of Sr3Cr2O8 (6.2 wt%) and SrO (3.1 wt%). The Raman microscope made it possible to focus on a single Sr2CrO4 grain of ca. 8 μm diameter. The recorded room temperature spectrum (not shown here) resembles the one of the isostructural titanate, with frequencies of most of the modes shifted to lower values with respect to the titanate.
3.4 Differential thermal analysis
Differential thermal analysis was performed on the powder sample of the tetragonal RP Sr2TiO4, which was later used for preparation of the seed rods. The data can be seen in Fig. 6(a). They show an endothermic peak upon heating with an onset at 1578 ± 2 °C and a visible hysteresis, as the exothermic peak upon cooling has an onset at 1530 ± 5 °C. These peaks correspond to the phase transition between the low-temperature tetragonal and high-temperature orthorhombic phase, which was estimated to occur by different authors at 1600 °C (ref. 8) and 1525 ± 20 °C.7 Although no other transitions are visible in Fig. 6(a), traces of Sr3Ti2O7 can be identified in the diffractogram collected on the powder sample after performing the DTA. This is in agreement with the phase diagrams in ref. 7 and 8 which suggest a peritectoid decomposition of Sr3Ti2O7 into Sr2TiO4 and SrTiO3 at ≈1600 °C. | ||
| Fig. 6 Differential thermal analysis of Sr2TiO4. a) The starting powder was tetragonal low temperature phase. b) The starting powder was the high-temperature orthorhombic phase. | ||
If the orthorhombic phase, which is metastable at room temperature, is annealed at 5 °C min−1, another peak appears in the DTA data, with an onset at 720 °C upon warming up, see Fig. 6(b). This peak is not present on cooldown and represents the exothermic transition to the stable tetragonal phase, which is irreversible.
3.5 High-temperature powder diffraction experiments
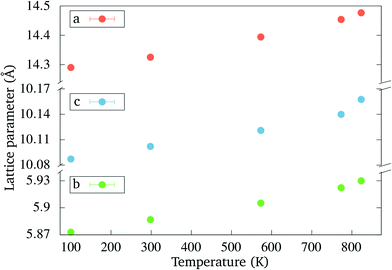
Powder diffraction was measured at several temperatures up to 800 °C. The transition occurred earlier than during the DTA experiment and at 650 °C the orthorhombic phase has completely transformed. This discrepancy is due to a different heating profile in the diffraction experiment, as compared with the DTA run. The phase transition temperature is strongly affected by kinetic factors, which results in a delay of the transition onset in the DTA experiment.The evolution of the lattice parameters of the orthorhombic phase with temperature is plotted in Fig. 7 up to 550 °C. The lattice parameters of the tetragonal phase (not shown here) are generally in good agreement with those reported by Kawamura et al.23
With the disappearance of the reflections from the orthorhombic phase, new lines become visible in the diffraction patterns, which are not ascribable to any known titanate. In order to verify whether these reflections belong to an intermediate phase, a small amount of the orthorhombic phase powder was annealed at 550 °C for one hour with a fast heating ramp of 20 °C min−1. The sample was taken out directly of the hot furnace after one hour and was left to cool in air. In the XRD pattern of this sample (Fig. 8(a)) 7 peaks of the intermediate phase can be seen, labelled with a symbol “I”. Another powder sample of the orthorhombic phase was annealed at 850 °C for seven hours. After the long treatment all of the intermediate phase lines disappeared and in the powder pattern only the tetragonal phase is present, thus confirming that the peaks don't belong to an impurity/decomposition phase.
In Table 3 all diffraction lines identified as the intermediate phase are listed, in order of their intensity. The reflections could be indexed by a monoclinic cell with a space group P2, the lattice parameters of 7.3567, 3.4588, 11.780 Å and the unit cell angles of 90, 91.6271 and 90°.
| Angle (° 2θ, Cu) | d (Å) | Intensity |
|---|---|---|
| 32.19 | 2.778 | High |
| 46.18 | 1.964 | Medium |
| 25.11 | 3.544 | Medium |
| 39.7 | 2.268 | Low |
| 67.4 | 1.388 | Low |
| 28.16 | 3.166 | Low |
| 22.59 | 3.933 | Low |
| 25.74 | 3.458 | Low |
| 49.9 | 1.826 | Low |
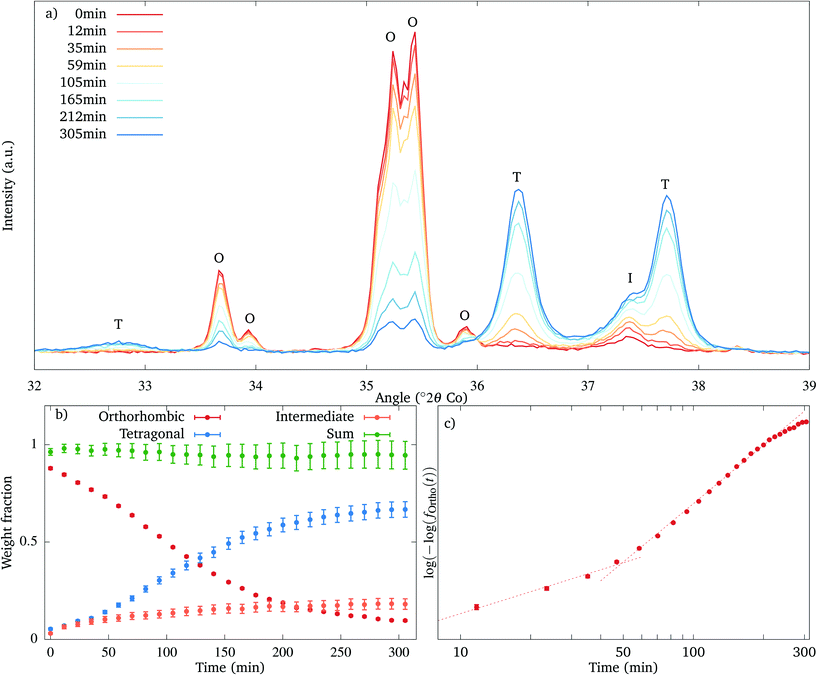
The decomposition of the orthorhombic phase and the appearance of the intermediate and the tetragonal phase have been tracked by isothermal powder XRD as function of time, at 550 °C. Selected diffraction patterns are shown in Fig. 9(a). As the lines of the orthorhombic phase disappear, together with the tetragonal phase several peaks of the intermediate phase appear, the one with the highest intensity located at 37.3° (2θ) (using Co Kα radiation). The tetragonal phase appears directly from the beginning of the annealing as a very broad doublet. The transformation is not yet complete after 5 hours, since the reflections of the orthorhombic phase are still present.
The quantitative analysis was performed using the Profex/BGMN software. In order to ensure a good thermal contact between the sample and its holder, a very small amount of sample was used. As a consequence, the relative intensities of the reflections might be affected, thus preventing us from reliably refining the atomic positions. The R-factor of the fit was largely improved if the preferential orientation of the powder sample was modelled by a spherical harmonic of 6th–10th order.24 Lastly, the amount of the intermediate phase could not be determined precisely because of the unknown structure, but (assuming that the reference intensity ratio of the intermediate phase will be similar to that of the tetragonal phase) it was approximated by the ratio:
The resulting distribution diagram is plotted in Fig. 9(b). The decomposition of the orthorhombic and formation of the tetragonal phase follow approximately a sigmoid curve, while the relative amount of the intermediate phase grows very slowly, resembling a steady state. The transformation is not yet complete after 5 hours, with 10% of the material being still present in the orthorhombic form. As the amount of the intermediate phase grows and more reflections of the intermediate phase appear, the R-factors of the refinement increase steadily.
According to the JMAK theory,25,26 a transition between two phases which proceeds via nucleation and growth follows an exponential dependence:
| f(t) = 1 − exp(−K·tn), |
3.6 Orientation relationship
If the grown crystal of the orthorhombic phase is pulled out of the hot zone slowly at 1 mm h−1, instead of quenching, the phase transition proceeds and polycrystalline rods are obtained with a very regular structure. In these rods dark brown macroscopic plates alternate with polycrystalline layers, as can be seen in Fig. 10(a) and (b). These plates run at an oblique angle to the growth direction, can be very easily cleaved, they produce a tetragonal Laue diffraction pattern (Fig. 10(c)) and their XRD pattern only consists of sharp 00l reflections. This suggests an orientational relationship between the orthorhombic and tetragonal phase during the transition.To confirm the presence of the orientational relationship, we have annealed several polished single crystal pieces of orthorhombic phase of <0.5 mm2 area with known {h00} orientation at different temperatures and time delays: 800 °C for 5 minutes up to 1000 °C during 6 hours. After the annealing, the crystals lost their transparency and were weakly diffracting, not allowing to collect single-crystal diffraction data. The θ–2θ scans could be measured, however, and the results are visible in Fig. 8(b). The peak at 2θ = 40.0° coincides with the diffraction line of the intermediate phase (up to the shift due to the sample displacement), which was observed in the powder samples. This reflection disappears gradually as the annealing temperature is increased. The tetragonal phase which is formed is strongly (11l) oriented, with 112, 114, 116 and 1110 lines visible and the 114 reflection being especially strong. Except for the 11l lines only those reflections are visible, which have very high nominal intensity: the most intensive doublet of 110 and 103 reflections and the 123 reflection, which is the fourth strongest.
An insight into this intriguing orientation relationship can be gained by visualizing the crystal structure of the low temperature–tetragonal–polymorph. In the projection along the [227] direction in Fig. 10(e) a pseudohexagonal arrangement of atoms can be seen, similar to the pseudohexagonal structure of the orthorhombic phase in the [100] direction (Fig. 10(d)).
An important feature of both structures is the alternation of cationic and anionic planes parallel to the hexagonal direction, with the interplanar distance being 2.7482 Å in the tetragonal and 2.9364 Å in the orthorhombic phase. If this planar structure is to be conserved, one can expect the c axis of the tetragonal phase to lie in the plane defined by the a and c axes of the orthorhombic phase, (as is the orientation of the axes drawn in Fig. 10(d) and (e)), or rotated by ±60° along the hexagonal axis.
During the transition between the orthorhombic and tetragonal phase a considerable reconstruction occurs in the titanium first coordination sphere, resulting in a change between the tetrahedral and octahedral arrangement of oxygens, which cannot be described by a simple symmetry breaking. In addition, the transition is connected to a rather high change in volume per formula unit, with the high temperature phase having 11% lower density. This explains why growing the RP Sr2TiO4 is usually challenging. Our experiments show, however, that it might, at least in theory, be possible to obtain single crystalline tetragonal phase, since the two structures are related.
3.7 Dielectric properties
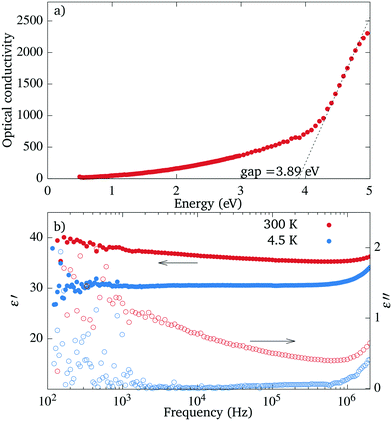
The value of the optical gap measured with ellipsometry is approximately 3.9 eV, see Fig. 11(a). This value is comparable to the value of 3.2 eV reported for SrTiO3 (ref. 27) and the values of 3.9 and >4 eV reported for the in-plane and out-of-plane electron momentum in Sr2TiO4.28 The optical conductivity shows a broad tail reaching from the gap well into the visible range, as could be expected from the light coloration of the sample.At room temperatures the samples are leaky dielectrics and the impedance spectra show a dependence of capacitance on the frequency (see Fig. 11(b)). They can be modelled by an equivalent circuit consisting of a constant phase element and a parallel resistor.29 The dispersion depends on temperature and is significantly weaker already at 250 K. At 4.2 K, the parallel resistor is not necessary to model the circuit and the capacitance dependence on the frequency is flat. This behaviour could be caused by partially mobile charges which become trapped on defects or interfaces.30 The upturn at higher frequency comes from the inductance of the measurement apparatus.
The static dielectric constant measured along the [100] direction at 4.2 K has a value of 30 ± 10. At room temperature, the value rises to 40 ± 10, which might be overestimated, however, due to the charge trapping. This value is close to the dielectric constant ε33 of 44 ± 4 and the ε11 of 42 ± 2.5 measured on the epitaxial (001)-oriented layers of RP Sr2TiO4,6,31
Tetragonal Sr2TiO4 is a member of the Ruddlesden–Popper series, of which several members can become ferroelectric at certain conditions. Since the orthorhombic Sr2TiO4 crystallizes in a polar group, we tested few crystals for signs of ferroelectricity. There was no sign of ferroelectric switching in the dependence of capacitance on voltage, neither at room temperature nor at 4.2 K, no polarization was present, and no piezoelectric response could be measured. Hence, the dependence of the dielectric constant on the temperature is most likely caused by the charge trapping and not by a ferroelectric transition.
4 Conclusions
When the single crystal growth of the Ruddlesden–Popper Sr2TiO4 from melt is attempted, an orthorhombic structure forms first, which undergoes a two-step transformation to the low-T tetragonal phase via a monoclinic phase at 1530 °C. During this transition a dramatic reconstruction takes place between tetrahedral and octahedral Ti coordination, connected to a large 11% change in volume. An orientational relationship between the two modifications is observed, identified through a common sixfold rotational symmetry element as [100]O∥[227]T and [001]O∥[![[1 with combining macron]](https://www.rsc.org/images/entities/char_0031_0304.gif)
![[1 with combining macron]](https://www.rsc.org/images/entities/char_0031_0304.gif) 6]T.
6]T.
We have stabilized the orthorhombic modification of the Sr2TiO4 by rapid cooling of the crystal during the floating zone growth, which produces bulk single crystals suitable for further characterization. We have solved the crystal structure of the new polymorph and discovered an uncommon tetrahedral Ti coordination. The new material is an insulator with a band gap of 3.9 eV and the static dielectric constant of 40 at room temperature. The Raman spectra contain a large number of peaks and reveal a quartic anharmonic contribution to the potential well.
Author contributions
D. P.: conceptualization, investigation, formal analysis, writing of the original draft, writing-review and editing. C. B.: investigation, formal analysis, writing-review and editing. E. G.: conceptualization, supervision, writing-review and editing. M. H.: investigation, writing-review and editing. J. T.: investigation, writing-review and editing. P. B.: investigation, writing-review and editing.Conflicts of interest
There are no conflicts to declare.Acknowledgements
The authors acknowledge the assistance provided by the Research Infrastructure NanoEnviCz, supported by the Ministry of Education, Youth and Sports of the Czech Republic under Project No. LM2018124.We would like to thank Radovan Černý for guidance and useful discussions.
Notes and references
- C. Collignon, X. Lin, C. W. Rischau, B. Fauqué and K. Behnia, Annu. Rev. Condens. Matter Phys., 2019, 10, 25–44 CrossRef CAS.
- Y. Wang, K. H. Lee, H. Ohta and K. Koumoto, J. Appl. Phys., 2009, 105, 103701 CrossRef.
- X. Sun, Y. Mi, F. Jiao and X. Xu, ACS Catal., 2018, 8, 3209–3221 CrossRef CAS.
- Y. F. Nie, D. D. Sante, S. Chatterjee, P. D. King, M. Uchida, S. Ciuchi, D. G. Schlom and K. M. Shen, Phys. Rev. Lett., 2015, 115, 1–5 CrossRef PubMed.
- C. Guguschev, D. J. Kok, U. Juda, R. Uecker, S. Sintonen, Z. Galazka and M. Bickermann, J. Cryst. Growth, 2017, 468, 305–310 CrossRef CAS.
- J. H. Haeni, C. D. Theis, D. G. Schlom, W. Tian, X. Q. Pan, H. Chang, I. Takeuchi and X. D. Xiang, Appl. Phys. Lett., 2001, 78, 3292–3294 CrossRef CAS.
- A. Cocco and F. Massazza, Ann. Chim., 1963, 53, 883–893 CAS.
- M. Dryś and W. Trzebiatowski, Rocz. Chem., 1957, 31, 489–496 Search PubMed.
- G. Li, N. M. Dimitrijevic, L. Chen, J. M. Nichols, T. Rajh and K. A. Gray, J. Am. Chem. Soc., 2008, 130, 5402–5403 CrossRef CAS PubMed.
- G. M. Sheldrick, Acta Crystallogr., Sect. A: Found. Adv., 2015, 71, 3–8 CrossRef PubMed.
- G. M. Sheldrick, Acta Crystallogr., Sect. C: Struct. Chem., 2015, 71, 3–8 Search PubMed.
- N. Doebelin and R. Kleeberg, J. Appl. Crystallogr., 2015, 48, 1573–1580 CrossRef CAS PubMed.
- J. W. Arblaster, Platinum Met. Rev., 1997, 41, 12–21 CAS.
- A. B. Kuzmenko, Rev. Sci. Instrum., 2005, 76, 083108 CrossRef.
- M. Pinsky and D. Avnir, Inorg. Chem., 1998, 37, 5575–5582 CrossRef CAS PubMed.
- I. D. Brown and D. Altermatt, Acta Crystallogr., Sect. B: Struct. Sci., 1985, 41, 244–247 CrossRef.
- O. C. Gagné and F. C. Hawthorne, Acta Crystallogr., Sect. B: Struct. Sci., Cryst. Eng. Mater., 2015, 71, 562–578 CrossRef PubMed.
- K. Wilhelmi, Arkiv för Kemi, 1966, 26, 157–165 CAS.
- J. Deisenhofer, S. Schaile, J. Teyssier, Z. Wang, M. Hemmida, H.-A. K. von Nidda, R. M. Eremina, M. V. Eremin, R. Viennois, E. Giannini, D. van der Marel and A. Loidl, Phys. Rev. B: Condens. Matter Mater. Phys., 2012, 86, 214417 CrossRef.
- K. Funahashi, T. Higashide, T. Ueno, K. Tasaki, Y. Tahara, M. Adachi, T. Saiki, T. Kajita and T. Katsufuji, Phys. Rev. B, 2018, 98, 184422 CrossRef CAS.
- E. Kroumova, M. Aroyo, J. Perez-Mato, A. Kirov, C. Capillas, S. Ivantchev and H. Wondratschek, Phase Transitions, 2003, 76, 155–170 CrossRef CAS.
- R. Viennois, E. Giannini, M. Koza and J. L. Sauvajol, J. Phys.: Conf. Ser., 2007, 92, 1–5 Search PubMed.
- K. Kawamura, M. Yashima, K. Fujii, K. Omoto, K. Hibino, S. Yamada, J. R. Hester, M. Avdeev, P. Miao, S. Torii and T. Kamiyama, Inorg. Chem., 2015, 54, 3896–3904 CrossRef CAS PubMed.
- M. Järvinen, European Powder Diffraction 5, 1998, pp. 184–199 Search PubMed.
- W. A. Johnson and R. F. Mehl, Trans. Am. Inst. Min. Metall. Eng., 1939, 135, 416–442 Search PubMed.
- M. Avrami, J. Chem. Phys., 1940, 8, 212–224 CrossRef CAS.
- K. van Benthem, C. Elsässer and R. H. French, J. Appl. Phys., 2001, 90, 6156–6164 CrossRef CAS.
- J. Matsuno, Y. Okimoto, M. Kawasaki and Y. Tokura, Phys. Rev. Lett., 2005, 95, 176404 CrossRef CAS PubMed.
- F. D. Morrison, D. J. Jung and J. F. Scott, J. Appl. Phys., 2007, 101, 094112 CrossRef.
- A. K. Jonscher, Dielectric Relaxation in Solids, Chelsea Dielectrics Press, London, 1983 Search PubMed.
- N. D. Orloff, W. Tian, C. J. Fennie, C. H. Lee, D. Gu, J. Mateu, X. X. Xi, K. M. Rabe, D. G. Schlom, I. Takeuchi and J. C. Booth, Appl. Phys. Lett., 2009, 94, 042908 CrossRef.
Footnotes |
| † The crystallographic data have been deposited with the ICSD (deposition number 2158480). |
| ‡ There are in total 14 different crystallographic sites, each of them situated on the Wyckoff position a. Using the Symmetry Adapted Modes tool21 accessible on the Bilbao crystallographic server, 165 Raman active modes are predicted; 41A1 + 42A2 + 41B1 + 41B2. |
| This journal is © The Royal Society of Chemistry 2022 |


