DOI:
10.1039/C9NA00688E
(Paper)
Nanoscale Adv., 2020,
2, 1993-2003
In situ assembly of a graphene oxide quantum dot-based thin-film nanocomposite supported on de-mixed blends for desalination through forward osmosis†
Received
30th October 2019
, Accepted 31st March 2020
First published on 1st April 2020
Abstract
In this work, in order to enhance the desalination performance, a unique thin-film composite membrane was designed by in situ assembly of a polyamide (PA)–graphene oxide quantum dot (GQD) framework. This unique assembly was supported on a templated hierarchical porous membrane derived from the de-mixing of a classical UCST (upper critical solution temperature) system consisting of polyvinylidene fluoride (PVDF) and polymethyl methacrylate (PMMA). The de-mixing was achieved by melt processing the blend above the UCST (in the miscible state) and quenching it below UCST. The pore size was controlled by varying the composition in the blends and by etching the PMMA phase. A sandwich architecture was developed by stacking different membranes using polyacrylic acid, as an adhesive, to achieve a gradient in pore size. Pure water flux, dye removal, and desalination experiments were carried out to study the efficacy of this strategy. The stacked membrane (used here as control) showed moderate dye rejection (about 50%) and poor desalination performance. In order to improve the desalination performance, the membranes were suitably modified by depositing a layer of polyamide (PA)–GQD framework obtained using interfacial polymerization. This strategy resulted in efficient salt rejection (more than 94% and 98% for monovalent salt and divalent salt, respectively) when studied through a pressure enhanced osmosis process using a 1000 ppm draw solution, and dye rejection (more than 90% and 85% for methylene blue (MB) and Congo red (CR), respectively) was studied through a cross-flow experimental set up using a 10 ppm feed solution @ 60 psi. Moreover, the antifouling properties of the PA–GQD modified membranes were superior (80%) to those of the control stacked membrane.
Introduction
Safe drinking water for all is perhaps one of the prime nexus of the 21st century and one of the prime sustainable development goals.1,2 Around 1.2 billion people still lack access to safe potable water, while around 2.6 billion people still lack access to proper sanitation.3,4 Due to rapid contamination of conventional freshwater aquifers and a decrease in the groundwater table, there is an urgent need to re-use unconventional sources and remediate the contaminated aquifers.4 In this context, re-using desalinated water for practical applications seems a feasible solution since nearly 71% of the earth is water, and 96.5% of that water is present in oceans.3 Compared to techniques such as thermal distillation, electro-dialysis, and evaporation, membrane-based desalination is the most economical and cost-effective process.5–7 The pump cost associated with this process is much lower than the distillation cost.4 This cost can be even further reduced by using forward osmosis (FO) membranes. FO is primarily a membrane separation process driven by natural osmosis principles and exploits the osmotic pressure gradients for harvesting water across a semipermeable membrane from a feed (low osmotic pressure) solution to a draw solution (high osmotic pressure).8
Although both FO and reverse osmosis (RO) based membranes are made up of polyamide surfaces, FO membranes operate at minimal or no hydraulic pressure and yield high rejection for a wide range of contaminants, and offer lower membrane fouling than the RO process.9 To enhance the performance characteristics of these membranes, various chemical routes based on surface engineering have been adopted in the literature. Researchers extensively use different carbon-based materials such as carbon dots (CD),10 graphene oxide (GO),11 carbon nanotubes (CNTs),12etc. While carbon dots and CNTs increase the hydrophilicity and help in lowering the fouling characteristics, their bactericidal action depends on the point of contact with bacteria.13 Among these materials, GO is the most promising material and has been shown to exhibit excellent antibacterial and antifouling characteristics.11,14–17 It has been reported that incorporation of GO in membranes enhances the hydrophilicity, bacterial resistance and foul resistance of the same.11,16,18,19 Further, GQDs formed after the disintegration of planar sheets into smaller fragments improve the performance further.20 This is due to the formation of a greater number of carboxylic and hydroxyl groups which enhance hydrophilicity as well as making a proper channel to permeate water.21 Moreover, GQD provides more reactive sites, further resulting in a strong uniform amide layer. Thus a thinner and smoother membrane surface is achieved, which results in better antifouling characteristics. All these engineered polyamide surfaces are fabricated on a base support, which is an ultrafiltration/microfiltration membrane made up of polyether sulphone or polyacrylonitrile.13 To this end, PVDF is used extensively as a membrane material due to its better chemical and thermal resistance, and excellent mechanical strength. For a semi-crystalline polymer like PVDF, Sharma et al.6,22,23 devised a unique strategy for membrane fabrication by selectively etching one of the phase from a binary blend processed via melt mixing.17 Using different compositions of this binary blend different pore sizes and distributions can be tailored.
In this work, we exploit this unique concept to design a hierarchical porous architecture based on a PA–GQD framework. A classical UCST system (PVDF/PMMA) is chosen as a support layer to design a porous membrane for water remediation using crystallization induced phase separation. By selectively etching PMMA, porous channels were fabricated, and by stitching different membranes with polyacrylic acid (PAA), a hierarchical porous architecture was designed. Pure water flux, dye removal, and desalination experiments were carried out to study the efficacy of this strategy. In order to improve the desalination performance, this templated architecture was then used as a support layer, and a PA–GQD thin composite membrane was in situ fabricated using interfacial polymerization. This strategy resulted in efficient salt rejection. Methylene blue (MB) and Congo red (CR) dyes were selected as model organic dyes for the dye removal studies, and it was observed that the rejection performance of our membranes was robust in this aspect. Incorporation of GQDs improved the antifouling efficiency of these membranes as well, with a flux recovery of more than 80%. Taken together, this concept of using the PA–GQD framework supported on a porous membrane proved to be an effective strategy for desalination.
Experimental section
Materials and reagents
PVDF of Kynar 761 grade with a Mw of 440![[thin space (1/6-em)]](https://www.rsc.org/images/entities/char_2009.gif) 000 g mol−1 was supplied by Arkema, and PMMA (PMMA 876 G) having a molecular weight (Mw) of 107
000 g mol−1 was supplied by Arkema, and PMMA (PMMA 876 G) having a molecular weight (Mw) of 107![[thin space (1/6-em)]](https://www.rsc.org/images/entities/char_2009.gif) 926 g mol−1, Mn of 54
926 g mol−1, Mn of 54![[thin space (1/6-em)]](https://www.rsc.org/images/entities/char_2009.gif) 250 g mol−1 and a polydispersity index of 1.98 was supplied by Gujpol. Graphene oxide was purchased from BT Corp. with a lateral dimension of 5 μm and with a thickness range of 1–2 nm, and 1,3,5-benzenetricarbonyl trichloride (TMSCl) (98%) and acrylic acid (99%) were supplied by Sigma Aldrich; methylene di aniline (MDA) was purchased from TCI Japan, and sodium chloride (99.90%), magnesium nitrate (99%), chloroform, ethanol, and acetic acid were purchased from a local vendor. All materials and chemicals were used directly without further purification.
250 g mol−1 and a polydispersity index of 1.98 was supplied by Gujpol. Graphene oxide was purchased from BT Corp. with a lateral dimension of 5 μm and with a thickness range of 1–2 nm, and 1,3,5-benzenetricarbonyl trichloride (TMSCl) (98%) and acrylic acid (99%) were supplied by Sigma Aldrich; methylene di aniline (MDA) was purchased from TCI Japan, and sodium chloride (99.90%), magnesium nitrate (99%), chloroform, ethanol, and acetic acid were purchased from a local vendor. All materials and chemicals were used directly without further purification.
Preparation of blend membranes using crystallization induced phase separation
Blends of PVDF/PMMA with different compositions (50/50, 60/40, and 70/30) were melt processed using a Minilab II HAAKE extruder CTW5 (7 cm3) at 220 °C with 60 rpm screw speed for 20 min as reported in the literature.22 60 mm compression molded discs with 80 μm thickness were made using a laboratory hot press at 220 °C. The membranes were then obtained by selectively etching with glacial acetic acid for 7 days to remove the PMMA phase from the blends. By stacking these membranes using PAA solution (0.08 g mL−1 THF), a unique hierarchical architecture was obtained. These were vacuum dried at 40 °C for 24 h. The PAA was prepared in the laboratory by using a free radical polymerization technique. The detailed synthesis procedure is provided in the ESI.† The membrane which was fabricated using crystallization induced phase separation is shown in Fig. 1.
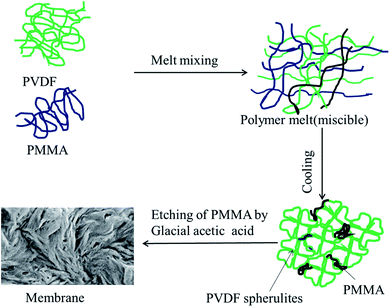 |
| | Fig. 1 Schematic representation of the membrane fabrication by crystallization induced phase separation. | |
Synthesis of GQDs
GQDs were synthesized by the method reported in the literature.24 Typically 15 mL of 3 wt% H2O2 was added to 100 mg of GO and bath sonicated for 30 min. Then the mixture was transferred to a 50 mL Teflon lined autoclave and heated at 180 °C for 2 h. Then the obtained light yellow solution was cooled and filtered through 0.2 μm filter paper to remove unreacted GO. The collected filtrate was then centrifuged at 10![[thin space (1/6-em)]](https://www.rsc.org/images/entities/char_2009.gif) 000 rpm and washed 5–6 times with deionized water until the pH reached 6. It was then dried under vacuum at 60 °C to obtain a dark powder.
000 rpm and washed 5–6 times with deionized water until the pH reached 6. It was then dried under vacuum at 60 °C to obtain a dark powder.
PA–GQD thin-film membrane
PA–GQDs were prepared via interfacial polymerization on the stitched membrane assembly with an active 50/50 surface. At first, GQDs and MDA were taken at 1![[thin space (1/6-em)]](https://www.rsc.org/images/entities/char_2009.gif) :
:![[thin space (1/6-em)]](https://www.rsc.org/images/entities/char_2009.gif) 100 w/w and bath sonicated for 30 min. The composite membrane was dipped in that solution and kept for drying at room temperature for 30 min. The amide layer was formed by dip coating the membrane in TMSCl organic solution, and finally, the membrane was kept at 80 °C for vacuum drying for 24 h. The schematic representation is shown in Fig. 2.
100 w/w and bath sonicated for 30 min. The composite membrane was dipped in that solution and kept for drying at room temperature for 30 min. The amide layer was formed by dip coating the membrane in TMSCl organic solution, and finally, the membrane was kept at 80 °C for vacuum drying for 24 h. The schematic representation is shown in Fig. 2.
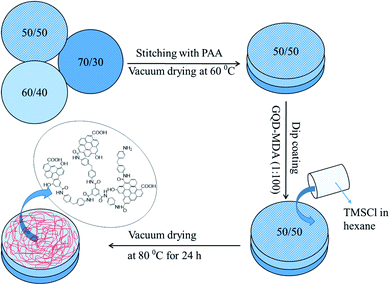 |
| | Fig. 2 Schematic representation of fabrication of the PA–GQD membrane (50/50, 60/40, and 70/30 indicate the wt% of PVDF and PMMA, respectively). | |
Membrane characterization
The membranes were preliminarily characterized using Fourier Transform Infrared spectroscopy (FTIR) on a PerkinElmer Frontier in the mid-IR range (4000 cm−1 to 650 cm−1). The surface and cross-sectional morphologies were assessed using a scanning electron microscope (SEM), Ultra55 FESEM Karl Zeiss, equipped with an EDX detector. The hydrophilicity of the modified membrane was characterized by contact angle measurement using water as a solvent. The charge on the surface of the membranes was measured using a SurPASS 3 from Anton Paar using an adjustable gap cell with 100 μm gap height and pH 7.
% water uptake and porosity
To determine the bulk hydrophilicity of the membranes, water uptake was determined as per our previous reports.3,15 Five equal-sized membranes of 0.63 cm2 area were weighed after vacuum drying. Following this, they were soaked in distilled water for 24 h. The excess water was removed using filter paper, and their weight was measured. The % uptake was calculated using:| |  | (1) |
where Ww and Wd are the weights after and before soaking.
In a similar way, the porosity (%) was calculated using:
| |  | (2) |
where
A,
l, and
ρ represent the area, the thickness of the membrane, and the density of distilled water, respectively.
To assess the pore localization of individual membrane surfaces, etched membrane samples were soaked in Hoechst 33![[thin space (1/6-em)]](https://www.rsc.org/images/entities/char_2009.gif) 258 solution (1
258 solution (1![[thin space (1/6-em)]](https://www.rsc.org/images/entities/char_2009.gif) :
:![[thin space (1/6-em)]](https://www.rsc.org/images/entities/char_2009.gif) 2000 dilution) for 10 minutes and imaged on a Zeiss LSM 880 laser scanning confocal microscope.
2000 dilution) for 10 minutes and imaged on a Zeiss LSM 880 laser scanning confocal microscope.
Permeation assessment and antifouling test
(a) Pure water flux.
A lab-scale in-house cross flow set-up was used for permeation and separation experiments. The composite token membrane of 47 mm dia. was fixed inside the module and compacted at 0.21 MPa for 30 min before the start of the experiment. The trans-membrane pressure was varied from 0.21 MPa to 0.51 MPa. The experiments were performed in triplicate and compared with stacked membranes without any polyamide modification.
(b) Dye rejection studies.
For assessing the dye removal characteristics, a cationic dye (MB) and an anionic dye (CR) were taken as model dye pollutants. A 10 ppm dye solution was prepared in double-distilled water, and the rejection studies were done in the cross-flow mode at 0.41 MPa. The concentration of the permeate was determined using a UV-Vis spectrophotometer, and % rejection was determined using the formula:| | | % rejection = [1 − ((permeate conc. in ppm)/(feed conc. in ppm))] × 100 | (3) |
(c) Salt rejection studies.
A monovalent salt solution and a divalent salt solution, i.e., NaCl and Mg(NO3)2, were taken as model draw solutions for assessing the rejection performance. The salt rejection performance was assessed using an FO flux designed in the lab, as shown in Fig. 3.
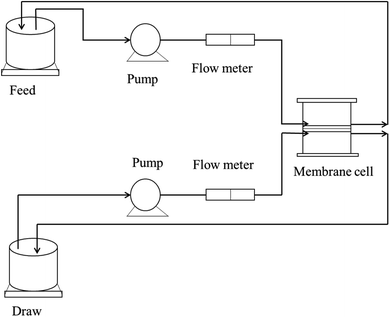 |
| | Fig. 3 Schematic diagram of the FO lab-scale system.26 | |
For the first experiment, 1000 ppm NaCl solution was set as the draw solution, while double distilled water was taken as the feed. In the next experiment, 1000 ppm Mg(NO3)2 solution acted as the draw solution, with double distilled water as the feed. The concentrations of the feed and draw solutions were monitored using a TDS meter, and the rejection was determined using eqn (3).
(d) Dynamic antifouling studies.
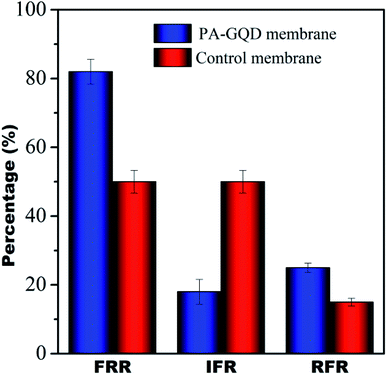
The dynamic antifouling studies were performed using bovine serum albumin (BSA) as a model protein foulant. As per our previous reports,25 BSA feed with a concentration of 1 g L−1 was prepared with double distilled water. Three flux cycles were performed. DI water flux Jw was the first step, next is the flux with BSA JB as the feed and then a water flux cycle JP was performed after back-flushing the membrane for 30 min in 1× phosphate buffered saline (PBS). The antifouling properties of the membrane were quantified in terms of flux recovery ratio (FRR), irreversible flux decline ratio (IFR), and relative fouled flux ratio (RFR). It is found that the higher the value of FRR and lower the value of IFR the better is the antifouling characteristics. The FRR, IFR, and RFR were calculated using the following equations.| |  | (4) |
| |  | (6) |
where Jw = pure water flux, JP = water flux after back flushing with PBS solution, and JB = BSA solution flux.
Results
Thermogravimetric analysis (TGA)
To validate the complete removal of PMMA post-etching, thermogravimetric analysis of all the membranes was performed before and after etching using TA Q500. The TGA profile of the blends before etching showed two-step degradation, one corresponding to PMMA in the range from 320 °C to 400 °C and another for PVDF in the range from 420 °C to 480 °C. However, etched blends showed a single step degradation manifesting the complete removal of PMMA. In the case of 60/40 blends and 70/30 blends, 7% and 4% residual PMMA were still present in the systems. The portions of un-etched PMMA were those segments which were trapped in the inter-lamellar region of PVDF (Fig. 4).23
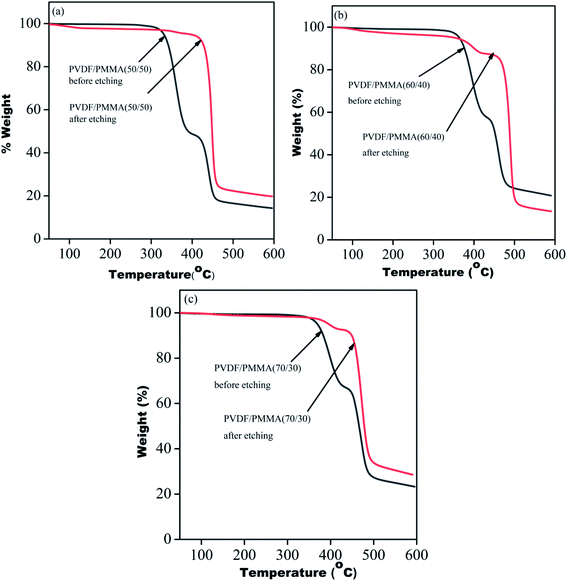 |
| | Fig. 4 TGA profiles of blends before and after etching of PMMA from PVDF/PMMA blends with different compositions: (a) 50/50, (b) 60/40 and (c) 70/30. | |
Surface and cross-sectional morphologies of individual membranes
The surface and cross-sectional morphologies of individual membranes were assessed using an Ultra55 FESEM Karl Zeiss. From the surface SEM micrographs, a spherulitic morphology was observed as shown in Fig. 5(A) for 50/50, 60/40, and 70/30 etched blends, respectively. It was observed that the spherulite size increased with decreasing PMMA concentration. Fig. 5(B) shows the cross-sectional micrographs of the corresponding surface micrographs. A spongy, porous architecture was observed, which is primarily responsible for the un-impeded permeation of water. The average pore sizes of the three different membranes 50/50, 60/40, and 70/30 were approximately 200 nm, 140 nm, and 80 nm, respectively, as estimated using imageJ software. Thus the controlled pore size obtained by varying the compositions in the blend was assured by the SEM micrograph.
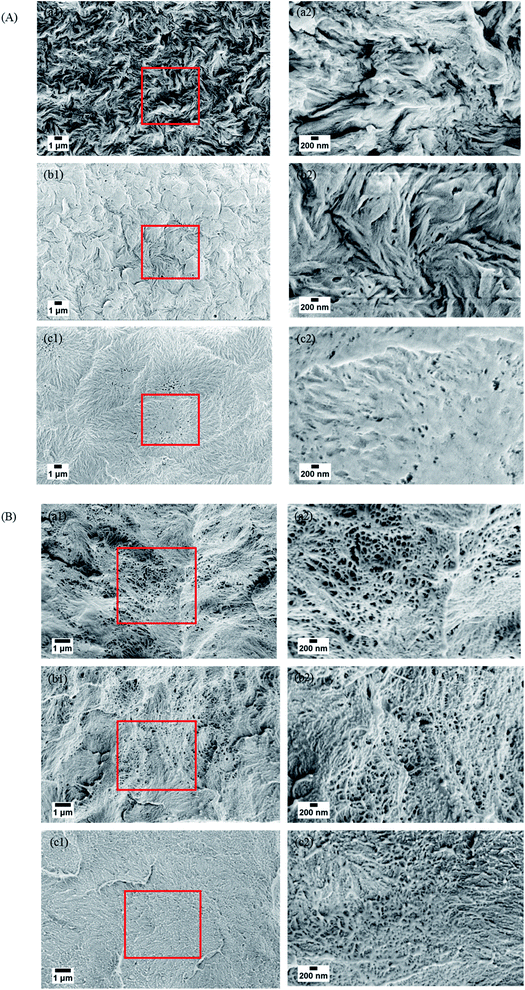 |
| | Fig. 5 (A) Surface and (B) cross-sectional morphologies of the PVDF/PMMA blend with different compositions after etching with glacial acetic acid for 7 days. (a) 50/50, (b) 60/40 and (c) 70/30. | |
Confocal microscopy of individual membranes
To support the surface and cross-sectional micrographs obtained through SEM, we performed confocal microscopy of the etched membranes soaked in Hoechst dye. Hoechst is a fluorescent dye which, when excited at 352 nm, emits blue fluorescence at 461 nm. The emission obtained from these dye molecules, retained in the membrane pores, provides a clear idea of the % porosity in these de-mixed blend membranes. Hoechst was specifically chosen to avoid autofluorescence in PVDF.27Fig. 6(a)–(c) show the confocal images of 50/50, 60/40, and 70/30 membranes, respectively. While imaging, it was seen that the best contrast of the pores was observed when 50/50 etched membranes were imaged at a depth greater than 50 μm, while for 60/40, it was 15 μm, and for 70/30 it was above 10 μm. This begins to suggest that the 50/50 etched membranes were highly porous, and dye molecules quickly penetrated deep into the membranes, while for 60/40 and 70/30 membranes, the extent of porosity was lower than for 50/50 membranes. This correlates well with the flux results, as discussed in the next section.
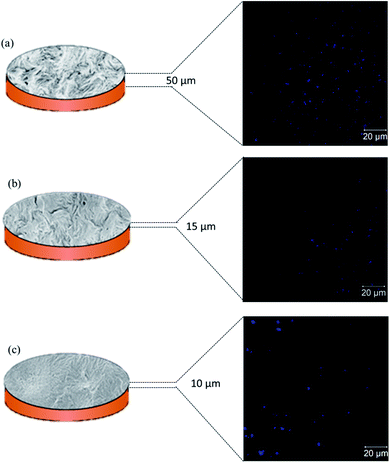 |
| | Fig. 6 Schematic representation of etched out blend membranes with their corresponding confocal microscopy images of the surface taken at the optimum depth for (a) 50/50, (b) 60/40, and (c) 70/30 compositions, respectively. | |
Pure water permeability and rejection performance of individual membranes
Fig. 7 shows the flux results of individual membranes at 60 psi. It was observed that pure water flux of all the individual membranes was 2011 ± 100 L m−2 h−1, 1664 ± 79 L m−2 h−1, and 975 ± 41 L m−2 h−1, respectively, for 50/50, 60/40 & 70/30 compositions. Though individual membranes showed higher water permeability, their dye rejection performance was relatively poor due to the microporous structure (shown in Fig. 5) of these membranes, which allowed dye molecules to pass through them easily. Hence, an integrative approach for better performance was adopted in this study. Towards this, the membranes were stitched with polyacrylic acid and referred to as control membranes and were further modified in situ using a polyamide GQD framework (referred to as PA–GQD membranes) for improved dye & salt rejection performance as per the schematic in Fig. 2.
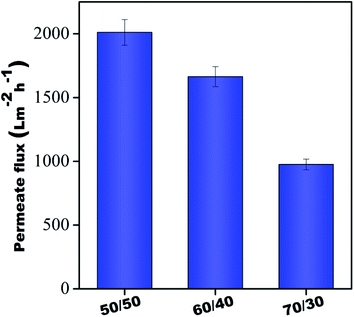 |
| | Fig. 7 Pure water flux of all individual membranes. | |
Spectroscopic evidence
The PA–GQD modification on the stacked PVDF membrane was confirmed by FTIR, as shown in Fig. 8. Due to the modification, the –CF2 peak intensity of the PVDF membrane at 1168 cm−1 significantly decreases, which suggests the presence of the active layer of PA on the surface. The –NH stretching and bending at 3326 cm−1 and 1510 cm−1, respectively, and –C![[double bond, length as m-dash]](https://www.rsc.org/images/entities/char_e001.gif) O stretching at 1625 cm−1 confirm the formation of the amide layer on the surface, and –NH2 stretching at 3409 cm−1, –OH stretching at 3205 cm−1, and –CO stretching at 1733 cm−1 suggest the presence of unreacted amine, hydroxyl and acid groups of GQD, respectively. Thus from the FTIR spectrum, it is clearly understood that the deposition of the polyamide layer is successful on the membrane surface.
O stretching at 1625 cm−1 confirm the formation of the amide layer on the surface, and –NH2 stretching at 3409 cm−1, –OH stretching at 3205 cm−1, and –CO stretching at 1733 cm−1 suggest the presence of unreacted amine, hydroxyl and acid groups of GQD, respectively. Thus from the FTIR spectrum, it is clearly understood that the deposition of the polyamide layer is successful on the membrane surface.
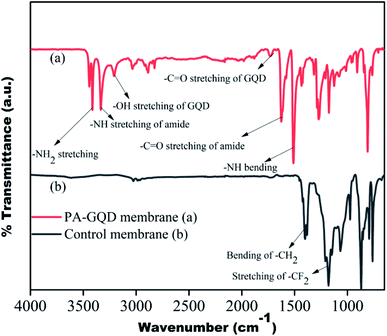 |
| | Fig. 8 FTIR spectrum of control and PA–GQD membranes. | |
Surface and cross-sectional morphologies of the modified membrane
To understand the changes in the surface characteristics of the membranes and to validate the formation of polyamide as the active surface, SEM was performed using an Ultra55 FESEM Karl Zeiss equipped with an EDX detector. Fig. 9(a) shows the surface morphology of the control membrane wherein a spherulitic morphology can be well observed.22Fig. 9(b) and (c) show the surface and cross-sectional SEM images of PA–GQD membranes. From the EDX analysis and the cross-sectional image, it can be evidently seen that a thin polyamide deposition has been formed with a layer thickness ranging from 3 to 5 μm.
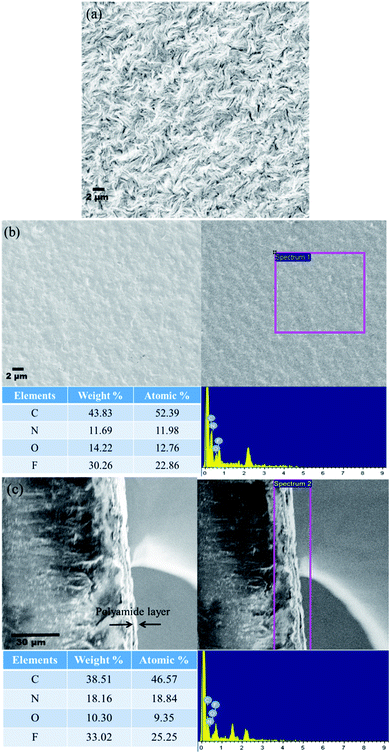 |
| | Fig. 9 (a) SEM micrograph of the control membrane indicating a spherulitic morphology, (b) surface morphology of the PA–GQD membrane with EDX analysis, and (c) cross-sectional morphology of the PA–GQD membrane with EDX analysis. | |
Contact angle and zeta potential of the control and PA–GQD membranes
The water contact angle is important to determine the hydrophilicity of the membranes qualitatively. In order to estimate the hydrophilicity of each membrane, the static contact angle was determined using a contact angle goniometer. Generally, the lower the contact angle the higher will be the hydrophilicity, and therefore, a better affinity of water towards the surface of the membrane.15 The contact angle of the control membrane was 96 ± 3°, whereas the contact angle of the GQD–PA modified membrane was 51 ± 2° (refer to Fig. 10(a)). A drastic reduction of the contact angle manifests in the hydrophilic surface in the modified membrane. The reduction in contact angle may be due to oxygen-containing functional groups (from GQD) embedded into the membrane.
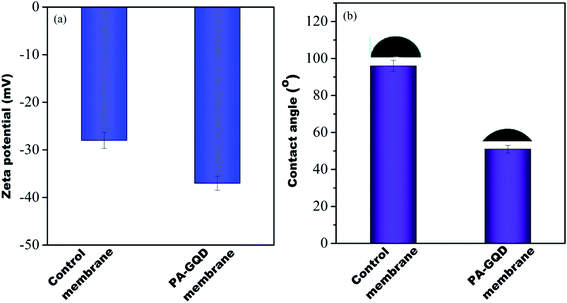 |
| | Fig. 10 Zeta potential (a) and contact angle (b) of control and PA–GQD membranes. | |
Zeta potential is the potential at the plane of shear between the surface and solution where relative motion occurs between them. Zeta potential of the membranes was computed from the measured streaming potential using the Helmholtz–Smoluchowski equation.28 It was measured using a SurPASS 3 zeta potential analyzer (from Anton Paar). The measurements were conducted in a background electrolyte solution containing 1 mM KCl at pH 7 and 25 °C. Before the measurements, the membranes were soaked in the electrolyte solution for 30 min. It was seen that the modified membrane showed a more negative zeta potential of −37 mV than the control (−26 mV), as shown in Fig. 10(b). This is plausibly due to the presence of unreacted carboxyl moieties, which was also seen in FTIR and is attributed to the presence of GQDs on the surface.
Water uptake and porosity
The significant improvement in hydrophilicity of the modified membrane was also supported by the percentage of water uptake and porosity measurement. The percentage uptake values for the control membrane and PA–GQD membranes were 11.9 ± 2.5 and 12.3 ± 1.2, respectively. From these values, it is clearly understood that the uptake has increased upon the incorporation of GQDs in the pristine membranes. The porosity (%) of control and PA–GQD membranes was estimated to be 6.8 ± 1.8 and 5.4 ± 1.2, respectively, which is comparable.
Pure water flux
Fig. 11 shows the flux results of all the membranes at 60 psi. It was observed that pure water flux values obtained from the control membrane and PA–GQD membrane were 140 ± 20 L m−2 h−1 and 170 ± 15 L m−2 h−1, respectively. The PA–GQD membrane has more hydrophilic groups due to the presence of GQDs, which might aid in the permeability.
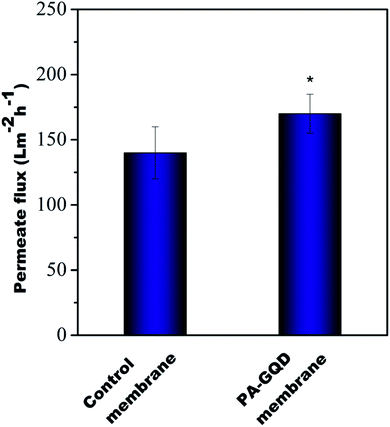 |
| | Fig. 11 Pure water flux of all samples. Flux was performed in triplicate, and * indicates statistical significance with p < 0.05 analyzed with Bonferroni post-hoc analysis. | |
Dye rejection studies
The dye rejection of all the membranes was analyzed using a 10 ppm feed of methylene blue as a cationic dye and Congo red as an anionic dye. It was observed that the rejection efficacy of the modified membrane towards methylene blue was 92 ± 5% and for Congo red, it was 88 ± 3%. The control membrane showed dye rejection of 50% for both the dyes whereas no rejection was noted for the individual membranes. The higher rejection efficiency in the modified membrane is presumably due to cationic dyes selectively adsorbing on the membrane surface due to electrostatic interaction while the anionic dye selectively repels from these surfaces. The comparison study of the PA–GQD membrane with the control membrane is shown in Fig. 12.
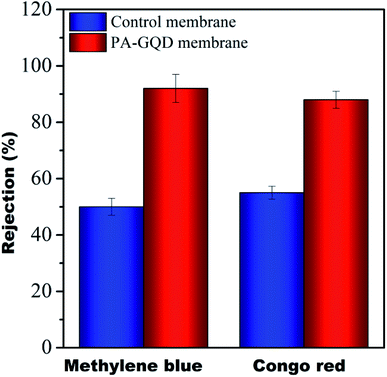 |
| | Fig. 12 Dye rejection performance of control and PA–GQD membranes. | |
Dynamic antifouling studies
The antifouling characteristics of the unmodified and PA–GQD membranes were assessed using FRR, IFR, and RFR as shown in Fig. 13. It was seen that the FRR value for the PA–GQD membrane is 80% whereas the value is 50% for the unmodified membrane. The expected higher FRR value for the modified membrane is due to the repulsion of negatively charged BSA from the negatively charged PA–GQD membrane.
 |
| | Fig. 13 Dynamic fouling studies of control and PA–GQD membranes. | |
Desalination performance by FO
The desalination performance of the modified membrane was studied using pressure enhanced forward osmosis.29 A monovalent salt (NaCl) solution of 1000 ppm and a divalent salt (Mg(NO3)2) solution of 1000 ppm were used as the draw solutions for these experiments and DI water was taken as the feed. Initially, the membrane was allowed to compact for 30 min without applying any pressure to attain a steady flow. Following this, 10 psi pressure was applied. The salt concentration was monitored periodically. Almost no change in the total dissolved solids (TDS) on the feed side suggested no reverse salt flux during this process. It was observed that the rejection for monovalent salt and divalent salt was 94% and 98.6%, respectively. The higher efficiency of salt rejection by the modified membrane is due to pore based as well as charged based separation. Though no salt rejection performance was observed for the individual membranes made of different PVDF/PMMA compositions due to larger pore size, significant rejection was seen for control membranes that were stitched with polyacrylic acid. The rejection for the control membrane is around 22% and 27% for monovalent and divalent salt, respectively, and is due to the presence of a gradient in the pores and the presence of carboxylic groups of polyacrylic acid. The salt rejection performance of control and PA–GQD membranes is shown in Fig. 14.
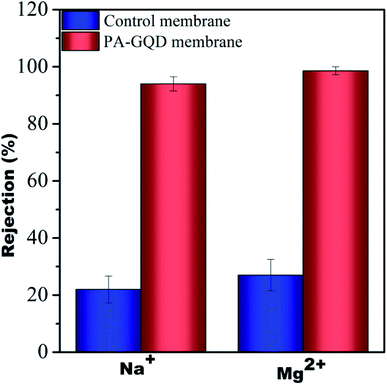 |
| | Fig. 14 Salt rejection performance of control and PA–GQD membranes. | |
Discussion
A classical UCST system (PVDF/PMMA) is chosen here to design a porous membrane for water remediation using crystallinity induced phase separation. By varying the concentration of PMMA in PVDF, membranes with different pore sizes and different pore size distributions were tailored. By selectively etching PMMA, nanoporous channels were fabricated, and by stitching different membranes, a hierarchical porous architecture is designed. Pure water flux, dye removal, and desalination experiments were carried out to study the efficacy of this strategy. The excellent desalination performance can be attributed to the key role of the gradient morphology in the PVDF stack. The individual layers with compositions of 50/50, 60/40, and 70/30 showed no salt rejection. This can be explained on the basis of their porosity, which was 17.3 ± 2.3%, 14.3 ± 0.9%, and 13.5 ± 0.75%, respectively. But after stitching them with polyacrylic acid, there was a gradient in porosity, and the overall pore size got reduced due to this coating. This is further manifested in a reduced porosity of 6.8 ± 1.8%. The porosity is further reduced to 5.4 ± 1.2% due to the in situ assembly of the PA–GQD framework. Hence the excellent salt rejection performance can be attributed to a combination of pore based separation and the presence of the PA–GQD framework, which sieves ions also based on charge.
This was supported by zeta potential. The negative charge on the surface of the membrane electrostatically binds with the cations strongly and does not allow the ions to pass through the membrane towards the feed solution, which results in no reverse salt flux. Hence, the dynamic interplay of pore and charge based separation helped in excellent rejection.
For dye pollutants, two distinct dyes were chosen: cationic MB and anionic CR. MB selectively adsorbed on the membrane surface due to electrostatic adsorption apart from being entrapped in the hierarchical arrangement. In the case of MB contaminated water, the gradient in the pores creates a tortuous path for the dye molecules which entraps them in the hierarchical membrane arrangement while water easily passes through it. For CR, selective repulsion, possibly due to higher negative zeta potential, could have played a key role. The dye molecules which escaped from this repulsive interaction were entrapped in the hierarchical arrangement. Fig. 15 shows the schematic illustration of the hierarchical membrane for desalination and dye removal.
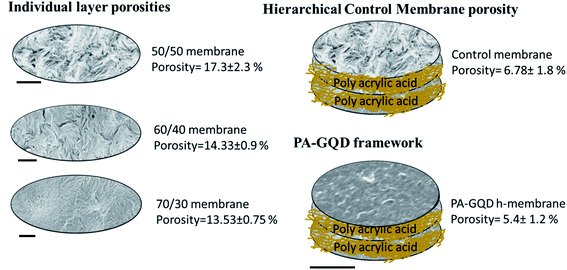 |
| | Fig. 15 Role of individual layers and their arrangement in selectively remediating dye pollutants and salt ions. The scale bar indicated is 2 μm. | |
For antifouling studies, bovine serum albumin (BSA) is used as a model fouling agent having a negative charge. The origin of the antifouling properties of the modified membrane is the negatively charged surface of the membrane, which is supported by zeta potential measurement. Therefore, there is a strong repulsion of negatively charged BSA from the negatively charged surface of the membrane. So BSA can't adhere to the surface of the membrane strongly. As a result, it can be easily washed by back-flushing the membrane with phosphate buffered saline (PBS). Therefore the modified membrane shows higher antifouling properties.
Conclusions
Herein, we put forward a methodology to obtain gradient templated polyamide membranes using a classical UCST system (PVDF/PMMA). By varying the concentration of PMMA in the blends and by selectively etching PMMA, different pore sizes were obtained. A hierarchical stack of these membranes was obtained by stitching these layers using PAA as a bonding agent. It was observed that the stacked membrane resulted in moderate dye rejection (about 50%) and poor desalination performance. In order to improve the desalination, these stack membranes were suitably modified by depositing a layer of polyamide obtained using interfacial polymerization of hydrophilic GQDs with suitable chemistry. While the GQDs helped in increasing the hydrophilicity of the modified membranes and imparting a net negative charge to the membrane, the GQD-polyamide layer was efficient in removal of salt (more than 94% and 98% for monovalent salt and divalent salt, respectively) and dyes (more than 90% and 85% for methylene blue and Congo red, respectively). Further, due to the effective negative charge, the antifouling properties of the PA–GQD modified membranes were superior (80%) to those of the unmodified stacked membrane.
Conflicts of interest
There are no conflicts to declare.
Acknowledgements
The authors would like to acknowledge DST for financial support, Dr Kaushik Chatterjee, for extending the facilities for bacterial studies, and CeNSE IISc for various characterization facilities.
References
- D. Griggs, M. Stafford-Smith, O. Gaffney, J. Rockström, M. C. Öhman, P. Shyamsundar, W. Steffen, G. Glaser, N. Kanie and I. Noble, Nature, 2013, 495, 305 CrossRef CAS PubMed.
-
P. K. Samantaray, G. Madras and S. Bose, in Next Generation Biomanufacturing Technologies, ACS Publications, 2019, pp. 321–351 Search PubMed.
- P. K. Samantaray, S. Baloda, G. Madras and S. Bose, Adv. Sustainable Syst., 2019, 1800153 CrossRef.
- P. K. Samantaray, S. Baloda, G. Madras and S. Bose, J. Mater. Chem. A, 2018, 6, 16664–16679 RSC.
- K. L. Tu, L. D. Nghiem and A. R. Chivas, Sep. Purif. Technol., 2010, 75, 87–101 CrossRef CAS.
- S. Remanan, M. Sharma, S. Bose and N. C. Das, ChemistrySelect, 2018, 3, 609–633 CrossRef CAS.
- B. Boruah, P. K. Samantaray, G. Madras, J. M. Modak and S. Bose, Chem. Eng. J., 2020, 124777 CrossRef CAS.
- S. Zhao, L. Zou, C. Y. Tang and D. Mulcahy, J. Membr. Sci., 2012, 396, 1–21 CrossRef CAS.
- R. W. Holloway, A. E. Childress, K. E. Dennett and T. Y. Cath, Water Res., 2007, 41, 4005–4014 CrossRef CAS PubMed.
- Y. Li, S. Li and K. Zhang, J. Membr. Sci., 2017, 537, 42–53 CrossRef CAS.
- L. Shen, S. Xiong and Y. Wang, Chem. Eng. Sci., 2016, 143, 194–205 CrossRef CAS.
- X. Song, L. Wang, C. Y. Tang, Z. Wang and C. Gao, Desalination, 2015, 369, 1–9 CrossRef CAS.
- P. K. Samantaray, G. Madras and S. Bose, Adv. Sustainable Syst., 2019, 1900017 CrossRef CAS.
- P. K. Samantaray, S. Baloda, G. Madras and S. Bose, ACS Sustainable Chem. Eng., 2019, 7(23), 18775–18784 CrossRef CAS.
- P. K. Samantaray, G. Madras and S. Bose, J. Membr. Sci., 2018, 548, 203–214 CrossRef CAS.
- P. K. S. Mural, S. Jain, S. Kumar, G. Madras and S. Bose, Nanoscale, 2016, 8, 8048–8057 RSC.
- P. K. S. Mural, A. Banerjee, M. S. Rana, A. Shukla, B. Padmanabhan, S. Bhadra, G. Madras and S. Bose, J. Mater. Chem. A, 2014, 2, 17635–17648 RSC.
- X. Wang, H. Wang, Y. Wang, J. Gao, J. Liu and Y. Zhang, Desalination, 2019, 451, 209–218 CrossRef CAS.
- A. Inurria, P. Cay-Durgun, D. Rice, H. Zhang, D.-K. Seo, M. L. Lind and F. Perreault, Desalination, 2019, 451, 139–147 CrossRef CAS.
- C. Zhang, K. Wei, W. Zhang, Y. Bai, Y. Sun and J. Gu, ACS Appl. Mater. Interfaces, 2017, 9, 11082–11094 CrossRef CAS PubMed.
- S. Pathan, M. Jalal, S. Prasad and S. Bose, J. Mater. Chem. A, 2019, 7(14), 8510–8520 RSC.
- M. Sharma, G. Madras and S. Bose, J. Mater. Chem. A, 2015, 3, 5991–6003 RSC.
- M. Sharma, S. Remanan, G. Madras and S. Bose, Ind. Eng. Chem. Res., 2017, 56, 2025–2035 CrossRef CAS.
- A. Halder, M. Godoy-Gallardo, J. Ashley, X. Feng, T. Zhou, L. Hosta-Rigau and Y. Sun, ACS Appl. Bio Mater., 2018, 1, 452–461 CrossRef CAS.
- P. K. Samantaray, G. Madras and S. Bose, ChemistrySelect, 2017, 2, 7965–7974 CrossRef CAS.
- N. Widjojo, T.-S. Chung, M. Weber, C. Maletzko and V. Warzelhan, J. Membr. Sci., 2011, 383, 214–223 CrossRef CAS.
- M. Sharma, N. Padmavathy, S. Remanan, G. Madras and S. Bose, RSC Adv., 2016, 6, 38972–38983 RSC.
- M. Elimelech, W. H. Chen and J. J. Waypa, Desalination, 1994, 95, 269–286 CrossRef CAS.
- N. Padmavathy, S. S. Behera, S. Pathan, L. Das Ghosh and S. Bose, ACS Appl. Mater. Interfaces, 2019, 11(7), 7566–7575 CrossRef CAS PubMed.
Footnotes |
| † Electronic supplementary information (ESI) available. See DOI: 10.1039/c9na00688e |
| ‡ Equal contribution from both the authors. |
|
| This journal is © The Royal Society of Chemistry 2020 |
Click here to see how this site uses Cookies. View our privacy policy here.  Open Access Article
 ab and
Suryasarathi
Bose
 *a
*a
![[thin space (1/6-em)]](https://www.rsc.org/images/entities/char_2009.gif) 000 g mol−1 was supplied by Arkema, and PMMA (PMMA 876 G) having a molecular weight (Mw) of 107
000 g mol−1 was supplied by Arkema, and PMMA (PMMA 876 G) having a molecular weight (Mw) of 107![[thin space (1/6-em)]](https://www.rsc.org/images/entities/char_2009.gif) 926 g mol−1, Mn of 54
926 g mol−1, Mn of 54![[thin space (1/6-em)]](https://www.rsc.org/images/entities/char_2009.gif) 250 g mol−1 and a polydispersity index of 1.98 was supplied by Gujpol. Graphene oxide was purchased from BT Corp. with a lateral dimension of 5 μm and with a thickness range of 1–2 nm, and 1,3,5-benzenetricarbonyl trichloride (TMSCl) (98%) and acrylic acid (99%) were supplied by Sigma Aldrich; methylene di aniline (MDA) was purchased from TCI Japan, and sodium chloride (99.90%), magnesium nitrate (99%), chloroform, ethanol, and acetic acid were purchased from a local vendor. All materials and chemicals were used directly without further purification.
250 g mol−1 and a polydispersity index of 1.98 was supplied by Gujpol. Graphene oxide was purchased from BT Corp. with a lateral dimension of 5 μm and with a thickness range of 1–2 nm, and 1,3,5-benzenetricarbonyl trichloride (TMSCl) (98%) and acrylic acid (99%) were supplied by Sigma Aldrich; methylene di aniline (MDA) was purchased from TCI Japan, and sodium chloride (99.90%), magnesium nitrate (99%), chloroform, ethanol, and acetic acid were purchased from a local vendor. All materials and chemicals were used directly without further purification.

![[thin space (1/6-em)]](https://www.rsc.org/images/entities/char_2009.gif) 000 rpm and washed 5–6 times with deionized water until the pH reached 6. It was then dried under vacuum at 60 °C to obtain a dark powder.
000 rpm and washed 5–6 times with deionized water until the pH reached 6. It was then dried under vacuum at 60 °C to obtain a dark powder.
![[thin space (1/6-em)]](https://www.rsc.org/images/entities/char_2009.gif) :
:![[thin space (1/6-em)]](https://www.rsc.org/images/entities/char_2009.gif) 100 w/w and bath sonicated for 30 min. The composite membrane was dipped in that solution and kept for drying at room temperature for 30 min. The amide layer was formed by dip coating the membrane in TMSCl organic solution, and finally, the membrane was kept at 80 °C for vacuum drying for 24 h. The schematic representation is shown in Fig. 2.
100 w/w and bath sonicated for 30 min. The composite membrane was dipped in that solution and kept for drying at room temperature for 30 min. The amide layer was formed by dip coating the membrane in TMSCl organic solution, and finally, the membrane was kept at 80 °C for vacuum drying for 24 h. The schematic representation is shown in Fig. 2.


![[thin space (1/6-em)]](https://www.rsc.org/images/entities/char_2009.gif) 258 solution (1
258 solution (1![[thin space (1/6-em)]](https://www.rsc.org/images/entities/char_2009.gif) :
:![[thin space (1/6-em)]](https://www.rsc.org/images/entities/char_2009.gif) 2000 dilution) for 10 minutes and imaged on a Zeiss LSM 880 laser scanning confocal microscope.
2000 dilution) for 10 minutes and imaged on a Zeiss LSM 880 laser scanning confocal microscope.


![[double bond, length as m-dash]](https://www.rsc.org/images/entities/char_e001.gif) O stretching at 1625 cm−1 confirm the formation of the amide layer on the surface, and –NH2 stretching at 3409 cm−1, –OH stretching at 3205 cm−1, and –CO stretching at 1733 cm−1 suggest the presence of unreacted amine, hydroxyl and acid groups of GQD, respectively. Thus from the FTIR spectrum, it is clearly understood that the deposition of the polyamide layer is successful on the membrane surface.
O stretching at 1625 cm−1 confirm the formation of the amide layer on the surface, and –NH2 stretching at 3409 cm−1, –OH stretching at 3205 cm−1, and –CO stretching at 1733 cm−1 suggest the presence of unreacted amine, hydroxyl and acid groups of GQD, respectively. Thus from the FTIR spectrum, it is clearly understood that the deposition of the polyamide layer is successful on the membrane surface.


