Rapid quantification of prion proteins using resistive pulse sensing†
Matthew J.
Healey
a,
Muttuswamy
Sivakumaran
b and
Mark
Platt
 *a
*a
aDepartment of Chemistry, Loughborough University, Loughborough, Leicestershire, LE11 3TU, UK. E-mail: m.platt@lboro.ac.uk; Tel: +44 (0)1509222573
bPeterborough City Hospital, Edith Cavell Campus, Bretton Gate, Peterborough, PE3 9GZ, UK
First published on 12th February 2020
Abstract
Prion diseases are a group of fatal transmissible neurological conditions caused by the change in conformation of intrinsic cellular prion protein (PrPC). We present a rapid assay using aptamers and resistive pulse sensing, RPS, to extract and quantify PrPC from complex sample matrices. We functionalise the surface of superparamagnetic beads, SPBs, with a DNA aptamer. First SPB's termed P-beads, are used to pre-concentrate the analyte from a large sample volume. The PrPC protein is then eluted from the P-beads before aptamer modified sensing beads, S-beads, are added. The velocity of the S-beads through the nanopore reveals the concentration of the PrPC protein. The process is done in under an hour and allows the detection of picomol's of protein.
Introduction
Prion diseases are a group of fatal transmissible neurological conditions whose disease etiology is characterised by the change in conformation of the normal intrinsic cellular prion protein (PrPC) in to the highly ordered insoluble amyloid state conformer (PrPSC). The significant event fundamental to the progression of these diseases is the self-catalytic, and perpetuating, nature of the conversion of PrPC in the presence of PrPSC aggregates.1–3 The emergence of variant Creutzfeldt–Jakob disease (vCJD), the most predominant prion disease in humans in the United Kingdom (UK) during the 1990s, is thought to be an effect of dietary exposure to the bovine spongiform encephalopathy (BSE) agent through contaminated meat products. The link between BSE and vCJD was uncovered after lengthy surveillance, epidemiologic studies and experimental investigation.3 Unlike the sporadic form for of the disease (sCJD), the infectious prion protein associated with vCJD is found outside the central nervous system, accumulating in peripheral lymphatic tissue, which increases the public health concern. To date, the widely accepted estimate for the prevalence of vCJD in the UK puts the number of potential carriers at 1 in 2000.4 Although most of the occurrences of vCJD have occurred in the UK there has been a number of individuals that have developed the disease overseas.Since the disease is known to be infectious and transmissible, the iatrogenic ability of this disease is a significant risk to public health through blood transfusion products and surgical procedures. There have been efforts to develop an assay that can detect the low levels of the infectious protein in the peripheral blood of pre-symptomatic patients that has the selectivity and sensitivity the assay will need.1,5,6 There are a number of reasons why developing an assay has been challenging. What has puzzled researchers is the fact that PrPSC fragments isolated from organisms are identical but cause different strains of diseases with differing clinical manifestations.7 vCJD is not encoded by RNA and DNA, in contrast to other pathogenic agents but still have the ability to transmit information.8 This lack of genetic material has negated the use of polymerase chain reaction (PCR) for nucleic acid detection methods. As the amino acid sequence is identical in both PrPSC and PrPC developing an antibody capable of differentiating between the isoforms has proven difficult. Lastly, the notion that a person could be asymptomatic and act as a carrier for vCJD may mean the levels of PrPSC are too low for traditional assays.
Two widely adopted sensing strategies utilise an amplification step to increase the level of the infectious protein to aid detection using the in vitro conversion of PrPC into PrPSC. The two strategies, termed protein misfolding cyclic amplification and quaking-induced conversion assay, work in similar way.1,9 Briefly, they use cycles of either shaking or sonication interspersed with incubation periods. If PrPSC is present in the sample the addition of a large excess of PrPC results in its conversation to PrPSC amplifying the signal into the detectable range. In 2011 a major breakthrough in the diagnosis of vCJD in symptomatic patients and preclinical asymptomatic individuals was made.10 Edgeworth et al. at the Medical Research Council's (MRC) prion unit in London reported their findings on a prototype blood test. Notably this protocol exploited previous research that found PrPSC had an extremely high affinity to stainless steel.11 In this assay, PrPSC in the blood sample is isolated on 45 μm stainless steel balls, and then detected by ELISA using ISCM18 antibodies, before visualising using commercial chemiluminescence. Although the assay currently falls short of the European Commission's Health and Consumer Directive, it does not rely on a lengthy amplification step (only requiring overnight incubation).
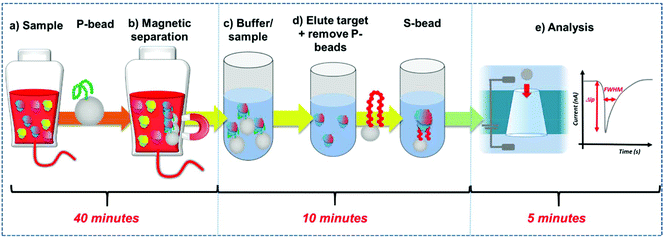
Here we develop a simple workflow using superparamagnetic beads, SPB's to extract, concentrate and quantify PrPC direct from solution. The SPB's are functionalised with a DNA aptamer that has been previously identified to bind to the PrPC protein.12 DNA aptamers are sequence specific single strand nucleic acids, that bind to target analytes via the formation of a specific tertiary structure.13–15 Researchers have demonstrated how aptamers and modified SPB's can be incorporated into resistive pulse sensors (RPS). Resistive pulse sensing strategies have the capacity to quantify DNA protein interactions facilitating epigenetic, proteomic and metal ion detection.16–30 In the assay DNA aptamer was conjugated to superparamagnetic beads, SPBs, creating a negatively charged surface. Protein binding to this DNA aptamer/strand changes the charge density around the particle as the phosphate groups on the DNA backbone adopt the new shape.16,18,31 This is measured as a change in particle velocity, and the magnitude of the velocity is used to quantify the analyte.16,18,32Fig. 1. The use of SPBs to concentrate the target analyte improves the limit of detection by an order of magnitude and the entire work flow from extraction to quantification is less than an hour. The aim is to produce a rapid, reliable assay for the detection of prions. We find the assay is highly sensitive in discriminating between the target protein of other high abundant proteins found in serum.
Experimental
Chemicals and reagents
Phosphate buffered saline (PBS. 0.01 M phosphate buffer, 0.0027 M potassium chloride, 0.137 M sodium chloride) was used for analysis. PBS tablets (P4417) were purchased from Sigma-Aldrich, UK. The control study proteins used were γ-globulin from human blood (G4386), albumin from human serum (A9511) and fibrinogen from human plasma (F3879), all sourced from Sigma Aldrich, UK. Streptavidin surface modified SPBs were purchased from Ademtech, France (03121), with a known mean diameter of 125 nm and a measured concentration of 1 × 10¹² mL−1 and used in all experiments. Invitrogen dynabeads were used, mean size of 1.05 μm.DNA oligonucleotides
A custom oligonucleotide used in the study was purchased from Sigma Aldrich, UK in lyophilized form (0.2 μM). The oligonucleotide was purified using reverse-phase cartridge purification (RP1) by the manufacturer. The details and its modifications: 5′ CTTACGGTGGGGCAATT[BtnTg] 3′. Here [BtnTg] is biotin TEG modification with five additional T bases. This was made up into a stock solution of 100 μM with deionized water. This aptamer was previously reported by another study.12Human cellular PrP
Recombinant N-terminal His-tagged full-length prion protein (residues 23–231, PR-902) was purchased from Jena Bioscience, Germany in lyophilized form. The protein was reconstituted in 1× PBS containing 0.5% Triton X-100 (Sigma-Aldrich, UK). Aliquots were prepared and stored at −80 °C until required.Aptamer immobilisation
Streptavidin modified SPBs were diluted to a concentration of 1 × 10¹⁰ mL−1, vortexed for 30 seconds and sonicated for 2 minutes to ensure monodispersity. The aptamer was added at concentrations equal to 33% and 100% binding coverage; having determined this from the binding capacity given by the manufacturer (4122 pg mg−1). The samples were placed on a rotary wheel for 1 hour at room temperature. Any unbound oligonucleotides in solution were removed by placing the samples on a MagRack (GE, UK) for 15 minutes until a cluster was visible adjacent to the magnet before removing and replacing the buffer. The resulting capture probe was stored at 4 °C or used for further study the same day. For the full work flow, the same aptamer and particles were used, but depending upon the stage, they are termed preconcentration beads, P-beads, or sensing beads, S-beads.PrPC binding
DNA modified SPBs were vortexed for 30 seconds before being placed on a rotary wheel prior to use. At varying concentration between 0–100 nm, PrPC was added to the particles, which were at 2 × 10⁹ mL−1, vortexed for 30 seconds before incubation at room temperature on a rotary wheel for 10 minutes before analysis.Varying temperature DNA aptamer binding
Prior to DNA aptamer immobilisation the concentration equivalent to 100% binding capacity (determined from the manufacturer's information) of the streptavidin modified SPBs, in PBS, were vortexed for 15 seconds before heating to either 21 °C or 90 °C in a mini dry bath (Benchmark Scientific, USA) for 5 minutes. The mixture was allowed to cool to room temperature for 30 minutes on a rotary wheel before the addition of particles. The mixture was placed on a MagRack (GE, UK) for 10 minutes until a cluster of particles was visible. The solution was carefully removed and replaced with an equal volume of PBS. The concentration of particles was kept constant throughout all experiments at 2 × 10⁹ mL−1.Control protein binding
After modifying streptavidin SPBs with DNA aptamer, albumin, fibrinogen or γ-globulin was added at a concentration of 200 nM and incubated for 20 minutes on a rotary wheel. 200 nM was selected as this concentration is 2× higher than the highest concentration used in the calibration curve.PrPC work flow
DNA aptamer modified SPBs were first prepared as described above. The full work flow is shown in Fig. 1. Preconcentration: to P-beads, PrPC was added to give a final concentration of 50 nM, the total volume here was 1 mL. The sample was then vortexed for 30 seconds and incubated for 10 minutes on a rotary wheel. The SPBs were then magnetically separated by placing the samples on a magnetic rack (GE, UK) for 5 minutes until a cluster was visible adjacent to the magnet before removing and replacing the buffer with 100 μL 10× PBS solution. The sample was sonicated for 30 seconds and vortexed for 30 seconds before being placed on a rotary wheel for 20 minutes. After, the SPBs were magnetically separated for 5 minutes and the supernatant removed, the P-beads were discarded. Sensing: to the supernatant 900 μL DI water was added to dilute give a 1× PBS solution, and an aliquot of S-beads were added to give a concentration of 2 × 10⁹ mL−1; these were then incubated for 10 minutes on a rotary wheel and then the S-beads were analysed.Resistive pulse sensing (RPS)
A qNano (Izon Science Ltd, NZ) was used to complete all measurements in this study. Briefly, in all experiments the lower fluid cell contained 80 μL of PBS buffer, ensuring no bubbles were present. When a sample measurement was being taken, the upper fluid cell contained 40 μL of the sample (suspended in PBS buffer). After each measurement was taken the nanopore was rinsed several times by removing and replacing 40 μL of buffer, each time applying varied pressures until no particles were observed. This was performed several times to remove any residual particles in the system and thus ensure no cross contamination between samples. The nanopores used throughout all experiments were capable of detecting particles within the size range of 110–630 nm (as stated by the manufacturer, Izon Science Ltd), and denoted as an NP200. To account for the variation in the manufacturing of the nanopores, an appropriate stretch (44–49 mm), voltage and pressure were applied in all experiments; the conditions were matched to the blockade magnitudes of CPC200s in PBS.Zeta potential measurements using RPS
When carrying out zeta potential measurements, the nanopore stretch was kept the constant for calibration and sample measurements, detailed explanations can be found elsewhere.33,34 When running samples, the blockade magnitudes were ensured to be at least 100× larger than the respective background noise of ca. 10 pA. Calibration measurements were completed when a new nanopore (NP200) was introduced or the start of a day. Where zeta potentials are not reported, the method used the resistive pulse to calculate the relative velocity and identifies the point of greatest resistance in the signal trace (the resistive blockade peak). For each blockade, the time at which the peak occurs is defined as T1.0 (time at 100% of peak magnitude) and the maximum magnitude of the pulse (relative to the local baseline resistance) is recorded as ΔRmax. Here the value at T0.5 (width of the pulse at 50% of the peak magnitude is used).20,23 To keep the method simple and applicable in further applications the actual zeta potential of the particle is not calculated and for further simplicity in the subsequent figures we use only one measurement to represent the particle speed which is 1/T0.50.Results and discussion
Within RPS experiments each translocation of the SPB through the nanopore produces a pulse, Fig. 1e. The magnitude of the pulse, known as the pulse magnitude (Δip) is related to the volume of the carrier, and the width or full width half maximum (FWHM) of the pulse relates to its velocity.22 In the absence of convection, the velocity of the carrier can be proportional to the surface charge or zeta potential of the carrier, assuming electro osmosis remains constant.35 As the density of the DNA aptamer and/or its length increases the velocity of the SPB through the pore also increases.21,22 Here the aptamer length remains constant, and as the concentration of the aptamer of the SPB's surface increases so does the velocity. This is recorded as a decrease in zeta potential. Example pulses recorded are shown in Fig. 2. | ||
| Fig. 2 Example data sets for DNA blank S-beads (green), S-beads incubated with 50 nM PrPC (olive) and 100 nM PrPC (red). Magnified section of this are also shown in Fig. s1.† N.B. the blank beads have been run prior to dilution. | ||
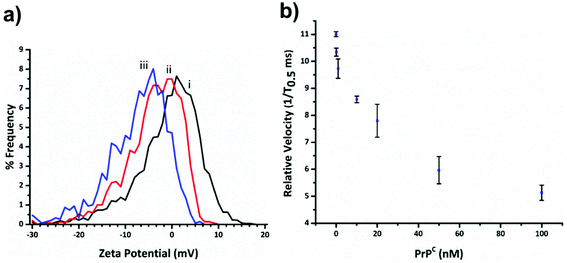
Fig. 3a shows the decrease in zeta potential from the blank value of −1.16 ± 1.31 mV to −4.43 ± 0.78 mV and −7.75 ± 0.94 mV for 33 and 100 percentage coverage of the beads surface with DNA. In the current setup the RPS is not sensitive enough to measure a change in SPB size as the DNA aptamer is placed on in surface, and the blockade magnitude does not change as the more aptamer is added to the SPB, Fig. s2.†
Before carrying out the extraction and detection of the PrPC target, we first incubated aptamer modified beads (S-beads) with varying concentrations of the target. Their velocity was then measured through the RPS, Fig. 3b. The velocity of the SPB's through the pore can be converted to a zeta potential as illustrated in Fig. 3a. However from this point we simply report the velocity of the SPB's measured at the 1/T0.5 values,20 which we have previously shown capable of monitoring the length and packing density of DNA around SPB's. The simplification make the analysis quicker as the velocities do not need to be converted to the final zeta potential value. In addition, it is the authors’ view that the reporting of zeta potential values for DNA and DNA–protein covered nanomaterials can be misleading, as there is no consistent location of the plan of shear and no assumption is made about the structure. The binding of the PrPC protein to the aptamer results in a change in its tertiary structure resulting in a decrease in translocation velocity, Fig. 3b.16,21 The magnitude of the velocity change has been shown to be dependent upon the shape of the DNA as well as the relative location of the binding event with respect to the carriers surface.32 As shown in Fig. 3b the velocity was shown to decrease over two orders of magnitude, and no change in their size was observed, Fig. s3,† indicating the particles did not aggregate.
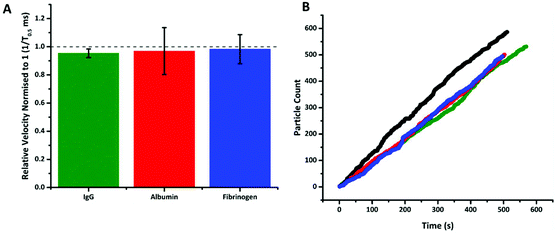
Having taken the sequence of the aptamer from the literature, there is prior knowledge that it is highly selective and sensitive to PrPC.36 However to illustrate the signal observed in Fig. 3 was specific to the target, other proteins were also added to S-beads. These proteins were chosen based on their relative abundances found in human blood.37 Albumin and γ-globulin are present in both plasma and serum samples at approximately 4 and 2%, whereas fibrinogen (as well as other clotting factors) is only found in plasma at approximately 0.4%. This translates to concentrations of 40 g L−1 for albumin, in comparison to the fibrinogen and γ-globulin samples only having protein concentrations of 4 and 20 g L−1 respectively.
Fig. 4 shows that following incubation of the S-beads with the different proteins no change in velocity was observed. Here the data is plotted normalised to calibration particles as variation from pore to pore or batches of beads can sometimes results in different absolute velocity values.22 After incubation with each control there was a relatively small decrease in relative velocity. There appears to be very little binding of the three proteins to the aptamer, or fouling of the particle's surface. This can be seen in no increase in particle's size given by an increase in blockade magnitude, Fig. s4,† nor any particle aggregation. It should also be noted the rate at which the particles translocated through the pore also remained unchanged, Fig. 4b, indicating that neither the pore or the S-beads are affected by nonspecific interactions.
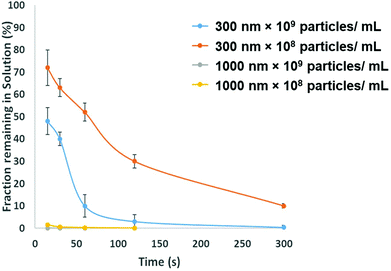
To be adopted within a clinical environmental, assays for PrPSC/C must have a limit of detection lower then demonstrated in Fig. 3. To avoid the use of protein misfolding cyclic amplification or other methods to amplify the target which may increase the analysis times the direct extraction and pre-concentration of the protein is proposed using SPB's. Prior to running a bioassay, it is not uncommon for samples to require pre-concentration, purification or extraction stage. SPB's offer a simple, cheap and rapid method for extracting target analytes from complex media. From a user's perspective it is nothing more than a simple procedure of mixing the sample with a SPB's followed by the exposure of the tube to a magnet that precipitates the target-particle complex to the tube wall, thus removing the analyte from solution. However, there is a need to balance and consider the size of the SPB, their concentration and the time the magnetic field is applied. The size of the SPB, or the loading of iron oxide nanomaterial within the polymer affects the speed in which they move across the magnetic gradient. The force acting on each SPB is proportional to their size, put simply larger particles are extracted quicker. However larger particles have a smaller surface area to volume ratio, and as the total amount of analytes that can be extracted is proportional to the surface area, sufficient numbers of SPBs must be added increasing the cost of the reagents. In addition the concentration of the SPBs also affects the recovery and speed of extraction from the solution as SPBs tend to form chains as they move via magnetophoresis through the solution. Again showing the benefit of higher particle concentrations i.e. the increased surface area and the faster recovery. Fig. 5 shows the speed of recovery for two particle sizes at two different concentrations.
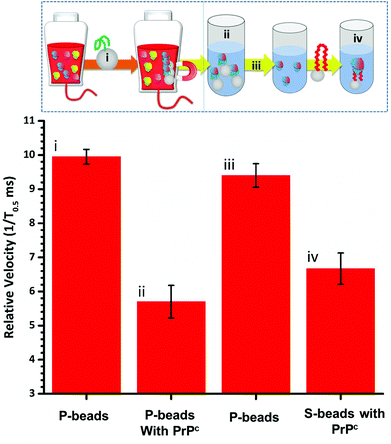
To fully extract any analyte from solution sufficient time and number of SPB's are needed. However, the requirements for an efficient extraction and pre-concentration step contradict the requirements for RPS analysis. The dynamic range, and sensitivity of assay strategies that use SPB's and aptamers in RPS has been shown to be dependent upon the number of SPBs present as well as the loading of aptamers on their surface.16,23 Briefly RPS is improved by smaller particles, with lower numbers of aptamers on their surface. To get around this and to use the full work flow to show the concept as shown in Fig. 1 we used a higher concentration of SPBs to pre-concentrate the protein, P-beads, before eluting the targets from their surface and adding fewer S-beads into a smaller volume of buffer. Fig. 6 shows the velocity of the SPBs at different stages of the workflow. To aid the reader we have taken a section of Fig. 1 and overlaid the points at which the SPB's were characterised.
Due to the nature of the RPS device, particles with diameters equal to and larger than 1 μm do not have a velocity proportional to their surface charge. To demonstrate the feasibility of our approach the P-beads here are the same size as the S-beads to allow the binding and elution of the prion from the P-beads. Fig. 6i shows the velocity of the P-beads prior to incubation with the sample, Fig. 6ii shows a decrease in velocity due to the binding of the PrPC to the P-bead. Fig. 6iii is the velocity of the P-beads after the PrPC has been eluted. The velocity almost returns back to its original value indicating that the recovery rate of the PrPC is high. Fig. 6iv shows the velocity of the S-beads after incubation with the solution containing the extracted PrPC. The velocity decreases showing the elution process confirming that the use of high ionic strengths has not effects the protein and it retains its binding to the aptamer. Using this concept, we were able to detect 50 pmol of PrPC from 1 mL of sample comparable to other detection techniques.12
Conclusion
Here we present a rapid assay using aptamers and resistive pulse sensing, RPS, to extract, pre-concentrate and quantify proteins from complex sample matrices. The binding of PrPC to aptamer modified SPB's results in a change in translocation velocity through the RPS device. The signal is specific to the target protein. Aptamer modified SPBs, were then used to extract and pre-concentrate PrPC from a larger sample volume. The elution of PrPC from the P-beads before the addition of S-beads results in an improved limit of detection. The process is done in under an hour and allows the detection of picomoles of target protein. The technique could be easily adopted to the mutated version of the protein (PrPSC) and integrated into clinical workflows for the screening of blood donations and transfusions.Conflicts of interest
The authors declare no competing financial interest.References
- L. Concha-Marambio, S. Pritzkow, F. Moda, F. Tagliavini, J. W. Ironside, P. E. Schulz and C. Soto, Sci. Transl. Med., 2016, 8, 370ra183–370ra183 CrossRef PubMed.
- C. J. Sigurdson, J. C. Bartz and M. Glatzel, Annu. Rev. Pathol.: Mech. Dis., 2019, 14, 497–516 CrossRef CAS PubMed.
- A. S. Das and W.-Q. Zou, Clin. Microbiol. Rev., 2016, 29, 633–658 CrossRef PubMed.
- O. N. Gill, Y. Spencer, A. Richard-Loendt, C. Kelly, R. Dabaghian, L. Boyes, J. Linehan, M. Simmons, P. Webb, P. Bellerby, N. Andrews, D. A. Hilton, J. W. Ironside, J. Beck, M. Poulter, S. Mead and S. Brandner, Br. Med. J., 2013, 347, f5675 CrossRef PubMed.
- S. Hornemann, P. Schwarz, E. J. Rushing, M. D. Connolly, R. N. Zuckermann, A. Y. Yam and A. Aguzzi, PLoS One, 2019, 14, e0216013 CrossRef CAS PubMed.
- H.-E. Kang, Y. Mo, R. Abd Rahim, H.-M. Lee and C. Ryou, BioMed Res. Int., 2017, 2017, 5413936 Search PubMed.
- M. E. Bruce and H. Fraser, in Current Topics in Microbiology and Immunology, ed. B. W. Chesebro, Springer Berlin Heidelberg, Berlin, Heidelberg, 1991, vol. 172, pp. 125–138 Search PubMed.
- S. B. Prusiner, Science, 1982, 216, 136–144 CrossRef CAS PubMed.
- A. J. E. Green, Pract. Neurol., 2019, 19, 49–55 CrossRef PubMed.
- J. A. Edgeworth, M. Farmer, A. Sicilia, P. Tavares, J. Beck, T. Campbell, J. Lowe, S. Mead, P. Rudge, J. Collinge, G. S. Jackson, M. Farmer, J. Beck, J. Lowe, P. Tavares, G. S. Jackson, J. A. Edgeworth, J. Collinge, P. Rudge, S. Mead and A. Sicilia, Lancet, 2011, 377, 487–493 CrossRef CAS.
- E. Zobeley, E. Flechsig, A. Cozzio, M. Enari and C. Weissmann, Mol. Med., 1999, 5, 240–243 CAS.
- L. Zhan, L. J. Liang, S. J. Zhen, C. M. Li and C. Z. Huang, Analyst, 2013, 138, 825–830 RSC.
- A. D. Ellington and J. W. Szostak, Nature, 1990, 346, 818–822 CrossRef CAS PubMed.
- C. Tuerk and L. Gold, Science, 1990, 249, 505–510 CrossRef CAS PubMed.
- C. G. Knight, M. Platt, W. Rowe, D. C. Wedge, F. Khan, P. J. R. Day, A. McShea, J. Knowles and D. B. Kell, Nucleic Acids Res., 2009, 37, e6 CrossRef PubMed.
- E. R. Billinge and M. Platt, Biosens. Bioelectron., 2015, 68, 741–748 CrossRef CAS PubMed.
- E. R. Billinge and M. Platt, Anal. Methods, 2015, 7, 8534–8538 RSC.
- E. R. Billinge, M. Broom and M. Platt, Anal. Chem., 2014, 86, 1030–1037 CrossRef CAS PubMed.
- E. L. C. J. Blundell, L. J. Mayne, M. Lickorish, S. D. R. Christie and M. Platt, Faraday Discuss., 2016, 193, 487–505 RSC.
- L. J. Mayne, S. D. R. Christie and M. Platt, Nanoscale, 2016, 8, 19139–19147 RSC.
- L. Mayne, C.-Y. Lin, S. D. R. Christie, Z. S. Siwy and M. Platt, ACS Nano, 2018, 12, 4844–4852 CrossRef CAS PubMed.
- I. Heaton and M. Platt, Anal. Chem., 2019, 91, 11291–11296 CrossRef CAS PubMed.
- M. J. Healey, W. Rowe, S. Siati, M. Sivakumaran and M. Platt, ACS Sens., 2018, 3, 655–660 CrossRef CAS PubMed.
- T. Li, L. Liu, Y. Li, J. Xie and H.-C. Wu, Angew. Chem., Int. Ed., 2015, 54, 7568–7571 CrossRef CAS PubMed.
- Y.-L. Ying, H.-Y. Wang, T. C. Sutherland and Y.-T. Long, Small, 2011, 7, 87–94 CrossRef CAS PubMed.
- O. a. Alsager, S. Kumar, G. R. Willmott, K. P. McNatty and J. M. Hodgkiss, Biosens. Bioelectron., 2014, 57, 262–268 CrossRef CAS PubMed.
- G. Nguyen, S. Howorka and Z. S. Siwy, J. Membr. Biol., 2011, 239, 105–113 CrossRef CAS PubMed.
- Z. Siwy, L. Trofin, P. Kohli, L. A. Baker, C. Trautmann and C. R. Martin, J. Am. Chem. Soc., 2005, 127, 5000–5001 CrossRef CAS PubMed.
- T. Albrecht, T. Gibb and P. Nuttall, Engineered Nanopores for Bioanalytical Applications, Elsevier, 2013 Search PubMed.
- E. McLeod, T. U. Dincer, M. Veli, Y. N. Ertas, C. Nguyen, W. Luo, A. Greenbaum, A. Feizi and A. Ozcan, ACS Nano, 2015, 9, 3265–3273 CrossRef CAS PubMed.
- X. Lin, A. P. Ivanov and J. B. Edel, Chem. Sci., 2017, 8, 3905–3912 RSC.
- L. Mayne, C. Y. Lin, S. D. R. Christie, Z. S. Siwy and M. Platt, ACS Nano, 2018, 12, 4844–4852 CrossRef CAS PubMed.
- E. L. C. J. Blundell, R. Vogel and M. Platt, Langmuir, 2016, 32, 1082–1090 CrossRef CAS PubMed.
- G. R. Willmott, S. S. C. Yu and R. Vogel, 2010 Int. Conf. Nanosci. Nanotechnol., 2010, 128–131.
- D. Kozak, W. Anderson and M. Trau, Chem. Lett., 2012, 41, 1134–1136 CrossRef CAS.
- L. Zhan, L. J. Liang, S. J. Zhen, C. M. Li and C. Z. Huang, Analyst, 2013, 138, 825–830 RSC.
- E. L. C. J. Blundell, M. J. Healey, E. Holton, M. Sivakumaran, S. Manstana and M. Platt, Anal. Bioanal. Chem., 2016, 408, 5757–5768 CrossRef CAS PubMed.
Footnote |
| † Electronic supplementary information (ESI) available: Blockade magnitudes for the particles, during the assays stages. See DOI: 10.1039/d0an00063a |
| This journal is © The Royal Society of Chemistry 2020 |

