 Open Access Article
A SERS aptasensor for sensitive and selective detection of bis(2-ethylhexyl)phthalate†
Dandan Tu *a,
Javier T. Garzaab and
Gerard L. Cotéab
aDepartment of Biomedical Engineering, Texas A&M University, College Station, Texas 77843, USA. E-mail: dandan_tu2016tamu@tamu.edu
bCenter for Remote Health Technologies & Systems, Texas A&M Engineering Experiment Station, College Station, Texas 77843, USA
First published on 18th January 2019
Abstract
Bis(2-ethylhexyl)phthalate (DEHP) is an endocrine disruptor commonly present in plastic products, such as PVC tubes and water bottles. In this work, a surface enhanced Raman spectroscopy (SERS) based aptasensor was developed and utilized for rapid, easy, sensitive, and specific detection of trace DEHP. A DEHP aptamer was immobilized on magnetic particles. Raman reporter molecule conjugated silver nanoparticles were clustered and coated with silica to provide a stable SERS signal. The SERS silica particle was then functionalized with 1,2,4-benzenetricarboxylic acid 1,2-bis(2-ethylhexyl) ester to increase its affinity to the DEHP aptamer. In the presence of a sample with DEHP, the high-affinity SERS silica particle competes with the DEHP molecule to bind with the aptamer on the magnetic particle. By measuring the signal of free SERS silica particles in the supernatant after magnetic separation, the concentration of DEHP in the sample was quantitatively determined. The developed DEHP aptasensor had a detection range from 0.008 to 182 nM and a limit of detection (LOD) of 8 pM. The aptasensor also showed high selectivity when exposed to interferents with analogous structures. The aptasensor was successfully tested for the detection of DEHP spiked in tap water, bottled water, and a carbonate beverage. The developed SERS-based aptasensor provides a rapid, sensitive, and easy-to-use method for the quantitative detection of DEHP in environmental and food analysis.
Introduction
Bis(2-ethylhexyl)phthalate (DEHP), one of the most widely used phthalates, is utilized in the production of common products such as medical devices,1 cosmetics,2 infant formulas,3 food packages,4 beverage bottles,5 and PVC tubes.6 As DEHP is not covalently bound to the plastics,7 it can easily leak from the plastics into the content directly in contact with them. For example, samples of bottled mineral water and carbonated drinks have been reported to have a detectable amount of DEHP.8–10 Several studies demonstrate that DEHP could be toxic to humans,1,11–14 and exposure to DEHP has been linked to adverse health effects such as reducing the anogenital distance in male infants,11 shortening the duration of human pregnancy,12 causing sperm abnormalities,13 or decreasing sperm motility in male adults.14 Policies and regulations restricting DEHP exposure have been developed in various jurisdictions. For example, the U.S. Environmental Protection Agency set the maximum contaminant level of DEHP to 15 nM (6 μg L−1).15 The World Health Organization and European Union set the safe limit of DEHP in fresh and drinking waters to 20 nM (8 μg L−1).16Sensitive detection of DEHP has been achieved by using gas chromatography-mass spectrometry (GC-MS),9,17,18 gas chromatography with a flame ionization detector (GC-FID),7,19,20 gas chromatography tandem mass spectrometry (GC-MS/MS),21 high performance liquid chromatography with a UV detector (HPLC-UV),22 and high performance liquid chromatography coupled with diode array detectors (HPLC-DAD).23 Although these methods are able to sensitively detect DEHP, they require special extraction techniques, complex sample pretreatments, professionally trained operators, bulky instruments, and a stable laboratory environment. To solve the mentioned drawbacks, other methods have been proposed for DEHP detection. For instance, ELISA assays were developed for sensitive detection of DEHP.24–26 However, these immunoassays require costly antibodies and a long reaction time. Other sensors are proposed for detection of DEHP using functionalized glassy carbon electrodes27,28 or extended gate organic field effect transistor (EG-OFET),29 however, these sensors show a low sensitivity in detection. Recently, a signaling-probe displaced electrochemical aptamer-based biosensor (SD-EAB) was developed to achieve sensitive DEHP detection,30,31 but it exhibited low selectivity to DEHP compared with other analogous phthalates. Therefore, it is of great interest to develop a simple, rapid, low-cost, and easy-to-operate method for the quantitative determination of DEHP, with high sensitivity, good selectivity, and good reliability.
Aptamers, composed of nucleic acid or peptide molecules, can fold into secondary and tertiary structures to specifically attach to certain targets.32 Various aptamers have been discovered to specifically recognize small molecules, proteins and intact cells, with dissociation constants ranging from nanomolar to picomolar levels.33,34 Compared to antibodies, the widely used bio-recognition elements, aptamers have several advantages that include low cost, nontoxicity, thermal stability, tolerance to a wide range of pH levels, long shelf life, efficient in vitro screening, consistent mass production, and the ability to consistently functionalize them with functional groups.32,35,36
Surface enhanced Raman spectroscopy (SERS) is a sensitive spectroscopic technique, which provides the vibrational “fingerprint” of a molecule on the surface of noble metals.37,38 To better transduce the sensing signal into a SERS signal, SERS tags have been created by attaching Raman reporter molecules (RRM) that have intrinsically strong Raman scattering on the surface of metallic nanostructures. A well-designed SERS tag has high detection sensitivity, narrow characteristic peaks, and good photostability.39,40 Various metallic nanostructures have been used to develop SERS tags.39 Nanoparticle clusters, in particular, are an efficient means to generate strong SERS signals by increasing number of “hot spots” or areas with high electromagnetic field enhancements.41–43 Moreover, a protective shell can be incorporated on the outside of SERS tags to prevent the RRM from dissociating and to prevent additional molecules from adsorbing on the surface of the metallic nanostructures. Polymers,44 bovine serum albumin (BSA),45,46 silica,47–49 and carbon50 have been used to create the protective shell. It has been demonstrated that SERS silica shell particles can exhibit high stability, good water solubility, low nonspecific binding, and straightforward surface modification.51
In this paper, a SERS aptasensor for rapid detection of trace levels of DEHP using a SERS active silica shell particle was developed. Silver nanoparticles conjugated with a Raman reporter molecule were clustered and then coated with silica to provide a highly intense and stable SERS signal. The SERS silica particles were then functionalized with a DEHP analogous molecule that competes with the analyte DEHP to bind with the DEHP aptamer on the magnetic particle. Thereby the concentration of DEHP in the sample was determined by measuring the signal of the SERS silica particles not bound to the magnetic particle. The developed aptasensor was used to monitor DEHP in tap water and bottled beverage.
Experimental
Reagents and materials
Both 1,2,4-benzenetricarboxylic acid 1,2-bis(2-ethylhexyl) ester and bis(2-ethylhexyl)phthalate (DEHP) were purchased from Toronto Research Chemicals (ON, Canada). N-Hydroxysulfosuccinimide sodium salt (Sulfo-NHS) and N-ethyl-N′-(3-dimethylaminopropyl)carbodiimide hydrochloride (EDC-HCl) were purchased from CovaChem (IL, USA). Magnetic beads (Dynabeads MyOne Streptavidin C1) were purchased from Thermo Fisher Scientific (CA, USA). Proprietary bis(2-ethylhexyl)phthalate (DEHP) aptamers were purchased from Base Pair Biotechnologies (TX, USA). A biotin and an 18-atom hexa-ethyleneglycol spacer were added at the 5′-end of the aptamer. Hydroxylamine hydrochloride, sodium hydroxide, silver nitrate, tetraethyl orthosilicate (TEOS), (3-aminopropyl) trimethoxysilane (APTMS), ammonium hydroxide (28%), 5,5′-dithio-bis-(2-nitrobenzoic acid) (DTNB), sodium chloride (NaCl), sodium phosphate, ethanol, dimethyl sulfoxide (DMSO), and isopropanol were purchased from Sigma Aldrich (MO, USA). Milli-Q ultrapure water (18.2 MΩ cm−1) was used in all the procedures. The mineral water and carbonated drinks in polyethylene terephthalate (PET) bottles were purchased from a local supermarket (TX, USA).Instrumentation
Transmission electron microscopy (TEM) images were acquired on a JEOL JEM-2010 (JEOL, Japan). The ζ-potential and hydrodynamic diameter of the nanoparticles were measured on a Zetasizer Nano ZS90 (Malvern, U.K.). The concentration of particles was measured with a Nanosight Nanoparticle Tracking Analysis (NTA) system (Malvern). Absorbance spectra of the nanoparticles were measured on a Tecan Infinite 200 Pro (Tecan, Switzerland) microplate reader. Microscale thermophoresis (MST) data sets were collected using a Monolith NT.115 Pico (NanoTemper Technologies GmbH, Munich, Germany). All SERS spectra were collected using an Ocean Optics portable Raman spectrometer (IDR-MINI) with a 638 nm laser. Samples were excited with a 40 mW laser (unless otherwise specified) using 1 s exposure time and 10 exposures per reading. All spectra were baseline corrected. Fourier transform infrared (FTIR) spectrum were measured on the ALPHA-Platinum FTIR spectrometer (Bruker) using ATR (Attenuated Total Reflectance) with a diamond crystal. The FTIR spectrum was collected from a dried particle sample, and the baseline correction was applied.Synthesis of silver nanoparticle
Hydroxylamine-reduced silver nanoparticles (AgNPs) were synthesized based on a “cold” method.52 Briefly, 1 mL of hydroxylamine hydrochloride (150 mM) was mixed with 89 mL of NaOH (3.33 mM). Then, 10 mL AgNO3 solution (10 mM) was added drop-wise to the mixture under vigorous stirring, and the mixture was left stirring for 15 min at room temperature. The synthesized AgNPs were then stored for further use.Synthesis of DEHP functionalized SERS silica particles
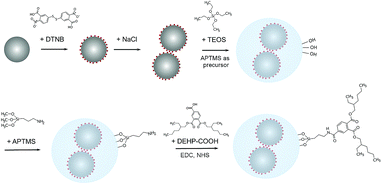
The approach for fabricating the DEHP functionalized SERS silica particles is shown in Fig. 1. A SERS silica particle was synthesized using methods previously reported.41,53 Briefly, 2 mL of the synthesized AgNPs and 100 μL of DTNB (10 mM in ethanol) were mixed, and the mixture was shaken overnight at room temperature. The nanoparticle solution was then centrifuged, and redispersed in 1.5 mL ethanol and 500 μL water. Silver nanoclusters (AgNCs) were formed by introducing salt.54 Specifically, 20 μL of NaCl solution (150 mM) was added to the nanoparticle solution, and the mixture was gently shaken for 20 min. Then, 20 μL of APTMS (0.001% in ethanol) was added into the nanoparticle solution, followed by 10 min of incubation. The amine groups of the added APTMS noncovalently bound to the carboxylic acid group of DTNB and worked as silane precursors.53 The nanoparticle solution was then centrifuged, redispersed in a mixture of water (720 μL), isopropanol (2 mL), and ammonium hydroxide (50 μL), and sonicated for uniform distribution. Then, two 20 μL aliquots of TEOS (45 mM in isopropanol) were added 30 min apart, and the mixture was left shaking overnight. Afterwards, the particles were washed three times by centrifugation (×1500g, 20 min) and the washed particles were resuspended in 2 mL of ethanol. Then the particles were further purified by centrifuging (×600g, 5 min) and collecting the supernatant. The synthesized and purified SERS silica particle (AgNCs–SiO2) were stored in room temperature for further use.The SERS silica particles (AgNCs–SiO2) were then conjugated with DEHP to introduce its affinity to the DEHP aptamer. 1,2,4-Benzenetricarboxylic acid 1,2-bis(2-ethylhexyl) ester, designated as DEHP–COOH, was covalently conjugated on the surface of AgNCs–SiO2 by its carboxyl group. Specifically, 2 mL of 100 pM AgNCs–SiO2 was mixed with 10 μL APTMS (0.001% in ethanol) under stirring. After vigorously stirring for 6 h, the mixture was heated to 70 °C for 2 h to enhance the condensation process and increase the formation of bonds between APTMS and the silica surface.55,56 Afterwards, the particles were washed by centrifugation, and the produced amine modified SERS silica particles (AgNCs–SiO2–NH2) were dispersed in DMSO. The carboxy group of the DEHP–COOH was activated by adding EDC (0.48 mg) and NHS (1.36 mg) into 250 μL of DEHP–COOH (1 mM in DMSO), followed by gentle shaking for 30 min. Afterwards, 250 μL of the activated DEHP–COOH was mixed with 2 mL of AgNCs–SiO2–NH2, and the reaction was proceeded for 6 h under gentle stirring at room temperature. Finally, the as-synthesized DEHP modified SERS silica particles (AgNCs–SiO2–DEHP) were collected by centrifugation (×1000g, 15 min), washed with DI water, and redispersed in 2 mL of DI water.
Synthesis of aptamer modified magnetic particles
DEHP aptamers were immobilized on the magnetic beads by the biotin–streptavidin interaction. Prior to immobilization, the biotinylated DEHP aptamer was suspended in 0.1 M PBS (pH 7.4) and allowed to fold into its tertiary structure by heating it at 90 °C for 5 min and slowly cooling it to room temperature. Then, 1 mL of streptavidin functionalized magnetic beads (Dynabeads) were washed three times to remove the storage buffers and preservatives. The particles were collected using a magnet and redispersed in 10 mM Tris–HCl (pH 7.5). After that, 2 mL of the washed magnetic beads (5 mg mL−1) were mixed with 2 mL of 3.5 μM biotinylated DEHP aptamers. The mixture was incubated for 30 min at room temperature under gentle shaking. Unbound aptamers were removed by washing the magnetic beads three times with 5 mM Tris–HCl. Finally, the aptamer modified magnetic beads were collected and resuspended in 4 mL of 0.1 M PBS (pH 7.4).Detection of DEHP
Before the SERS measurements, 1 μL of the SERS silica particles and 35 μL of different concentrations (0, 0.01, 0.1, 1, 10, 100, and 1000 nM) of DEHP in PBS buffer (0.1 M, pH 7.4, with 0.15 M NaCl) were mixed with 3 μL of the aptamer modified magnetic particles (2.5 mg mL−1). The mixtures were incubated for 30 min (see Fig. S8 in the ESI†), followed by separation using a magnet. Subsequently, the supernatant of each mixture was collected and the SERS signal was measured using a portable Raman spectrometer.Results and discussion
Assay design
The aptasensor was designed to detect DEHP based on a competitive binding assay format. Depicted in Fig. 2A, magnetic particles were functionalized with the DEHP binding aptamer.Silver nanoparticles were conjugated with a Raman reporter molecule (DTNB), clustered, and then coated with silica to provide a highly intense and stable SERS signal. The SERS silica particle was then functionalized with a DEHP analogous molecule that competes with the analyte DEHP for binding with the DEHP aptamer on the magnetic particle. The competitive binding process is presented in Fig. 2B. After mixing the DEHP sample, the DEHP functionalized SERS silica particles, and the aptamer modified magnetic particle, the high-affinity SERS silica particle competed with the DEHP molecule to bind with the aptamer on the MNB. By measuring the signal of free SERS silica particles in the supernatant after magnetic separation, the concentration of DEHP in the sample was quantitatively determined.
Characterization of aptamer modified magnetic particles
The binding affinity of the DEHP aptamer to the free DEHP molecule was analyzed by determining the dissociation constant Kd with MST as described in previous work.57 The aptamer-molecule binding curve obtained with MST is shown in Fig. S1† in the ESI.† The Kd value was estimated to be 15.56 nM, indicating a high affinity between the DEHP aptamer and the target DEHP molecule.The DEHP specific aptamer was immobilized on the magnetic beads by the biotin–streptavidin interaction. Absorbance spectra of the aptamer added to the magnetic beads for conjugation and the unconjugated aptamer were measured. In Fig. S2A† it can be observed that the absorbance peak (∼260 nm) of the unconjugated aptamer was much lower than the initially added aptamer, which means that a large amount of aptamer was conjugated to the magnetic beads. Additionally, the ζ potential of the magnetic beads before and after incubation with the DEHP aptamer was measured. In the results, it can be observed that the ζ potential shifted from −28.3 mV to −39.6 mV after incubation with the DEHP aptamer (Fig. S2B†). Since the aptamer is negatively charged,58 the observed decrease in surface charge confirms the immobilization of the DEHP aptamer on the magnetic beads.
Characterization of the DEHP functionalized SERS silica particles
The SERS silica particle synthesis process was monitored by the changes in UV-Vis spectrum (Fig. S3†) and the changes in size (Fig. S4†) after each modification step. The purification process using centrifugation was also verified (Fig. S5†). Finally, the obtained SERS silica particles were visually inspected by analyzing their TEM images (Fig. 3). As shown in Fig. 3, the size of the SERS silica particles ranges from 90 nm to 120 nm, and the thickness of the silica shell is about 20 nm. This thick silica shell prevents the dissociation of the Raman reporters from the nanoparticles surface and the adsorption of interfering Raman active molecules on the surface.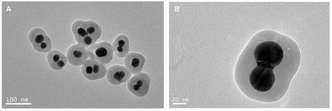 | ||
| Fig. 3 TEM image of the purified SERS silica particles (A) using a low magnification, (B) using a high magnification. | ||
To investigate the DEHP–COOH functionalization process on the SERS silica particles, FTIR spectra were measured after each functionalization step (Fig. 4). The SERS silica particle before functionalization (AgNCs–SiO2) showed the Si–OH vibration (951 cm−1) and the Si–O–Si vibration (795 cm−1, 451 cm−1, and 1095 cm−1). Besides the Si–OH and Si–O–Si vibrations, new peaks assigned to N–H vibration of amine groups (1540 cm−1) and CH2 vibration (2957 cm−1, 1468 cm−1, 2917 cm−1 and 2850 cm−1) were observed in the amine modified SERS silica particles (AgNCs–SiO2–NH2), indicating the successful functionalization of APTMS on the AgNCs–SiO2. After conjugation of DEHP–COOH on the SERS silica particles (AgNCs–SiO2–DEHP), the Si–OH vibration and the Si–O–Si vibrations remained in the FTIR spectrum, at the same time, C![[double bond, length as m-dash]](https://www.rsc.org/images/entities/char_e001.gif) O vibration in amide group (1724 cm−1) and N–H vibration in amide group (1551 cm−1) appeared, indicating the successful functionalization of DEHP–COOH by the amide bond.
O vibration in amide group (1724 cm−1) and N–H vibration in amide group (1551 cm−1) appeared, indicating the successful functionalization of DEHP–COOH by the amide bond.
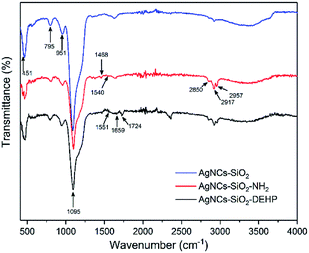 | ||
| Fig. 4 FTIR spectra of synthesized and modified SERS silica particles. (A) AgNCs–SiO2, (B) AgNCs–SiO2–NH2, and (C) AgNCs–SiO2–DEHP. | ||
Finally, the ζ-potential of the DEHP functionalized SERS silica particle was measured to be −28.1 mV, indicating that the synthesized Ag–SiO2 was electrostatically stable.59 Therefore, a stable DEHP modified SERS silica particle was successfully developed.
SERS signal of the DEHP functionalized SERS silica particles
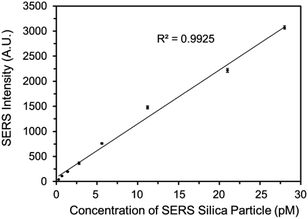
The SERS spectrum of the functionalized SERS silica particles was measured (Fig. S6†). The spectrum peak assignments of the DTNB molecule from the SERS silica particles is shown in Table S1 in the ESI.†Because a competitive binding assay format was used, the concentration of DEHP in the sample can be determined by measuring the concentration of the DEHP functionalized SERS silica particles not bound to the magnetic particles. To ensure a sensitive and reliable DEHP detection, the DEHP functionalized SERS silica particles should provide a strong SERS signal to result in a high signal to noise ratio at very low concentrations. A calibration curve of the DEHP functionalized SERS silica particles was measured, and the linearity, sensitivity, and precision of the signal response were investigated. Since the strongest characteristic vibrational mode for DTNB is at 1336 cm−1 in the spectrum, the intensity values at 1336 cm−1 were used to plot the calibration curve of the DEHP functionalized SERS silica particles (Fig. 5). The limit of detection of the SERS intensity was calculated to be 0.5 pM. This high signal sensitivity is attributed to the “hot spots” formed on the silver nanoclusters. The coefficient of variation (CV) was calculated to be <7% for all the measurements (see Table S2 in the ESI†), demonstrating the high precision in measuring the SERS signal. The calibration results demonstrate that the developed DEHP functionalized silica particle has the ability to provide SERS signal with the sensitivity, precision, and linearity, sufficient to quantitatively detect DEHP in an assay.
Stability of the DEHP functionalized SERS silica particles
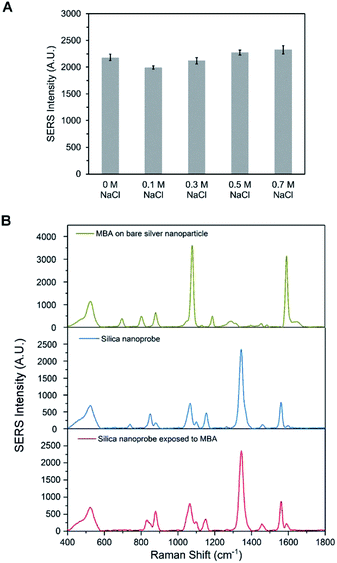
To detect DHEP in different sample matrices, the synthesized DEHP functionalized SERS silica particles should have a good stability and provide a stable SERS signal. High concentrations of salt in the sample matrix is one of the common factors that can lead to irreversible aggregation of nanoparticles, which could lead to a change in SERS signal. To confirm the signal stability of the DEHP functionalized SERS silica particles, its SERS signal was measured after exposing it to buffers with high NaCl concentration. As can be observed in Fig. 6A, the DEHP functionalized SERS silica particles showed a stable SERS signal after 1 h exposure to NaCl (up to 0.7 M). This high stability is attributed to the silica protective shell which prevents the aggregation of the metallic nanoparticles. Since the incubation time for the detection of DEHP in the proposed aptasensor is about 30 min, the developed DEHP functionalized SERS silica particles can provide a stable SERS signal.The ability of the DEHP functionalized SERS silica particles to provide stable signal in matrices with Raman active interferent was investigated. Since DTNB was utilized as the RRM, a small molecule with distinguishable characteristic peaks different than the DTNB peaks could be used to test the ability of the silica shell to prevent interfering molecules to affect the SERS spectrum. 4-Mercaptobenzoic acid (4-MBA) was chosen as the SERS active interfering molecule. Fig. 6B shows the SERS spectrum of bare silver nanoparticles and the DEHP functionalized SERS silica particles after 1 hour exposure to 0.5 mM 4-MBA. It can be observed that bare silver nanoparticles show the strong characteristic peaks that come from 4-MBA. In contrast, no obvious interfering peak is present in the spectrum after incubating the DEHP functionalized SERS silica particles with 4-MBA. This good anti-interference ability of the SERS silica particles is attributed to the thick protective silica shell. The dense silica coating works as a physical barrier to prevent molecules in the sample from approaching the metallic surface. Also, the 20 nm thick shell prevented the interfering molecules from being close the electromagnetic field SERS enhancement region, which led to the absence of their SERS signal. These results demonstrate that the DEHP functionalized SERS silica particles had a good signal stability in samples with high salt or with interfering molecules. Thus, the DEHP functionalized SERS silica particles can be used for the detection of DHEP in complex sample matrix.
Quantitative detection of DEHP using the aptasensor
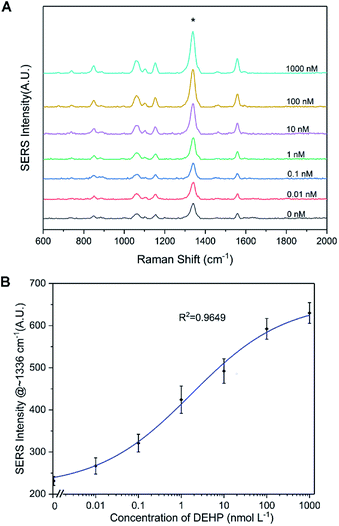
An aptasensor was developed using the SERS silica particles and the magnetic particles. After adding different concentrations of DEHP in PBS (0.1 M, pH 7.4) and measuring the supernatants after magnetic separation, the SERS spectra were acquired. In Fig. 7A, it can be observed that the intensity of the primary characteristic peaks increased with increasing DEHP concentration. The intensity at 1336 cm−1 was plotted for the corresponding concentration of DEHP tested (Fig. 7B). A fitted curve based on Hill equation (R2 = 0.9649) was also plotted in Fig. 7B (the parameters of the Hill equation are listed in Fig. S7†). Using the fitted model, the limit of detection (LOD) was calculated to be 8 pM. By calculating the lower limit of detection (LLOD) and the upper limit of detection (ULOD), the analytical range of the DEHP aptasensor was from 0.008 to 182 nM (the calculation process is described in the ESI†). The high affinity of the DEHP analyte and the DEHP functionalized SERS silica particle for the DEHP aptamer contributed to the sensitive detection of trace amounts of DEHP. Additionally, the ultrasensitive SERS silica particles permitted the detection of low concentration changes when it was probed. The performance of the developed aptasensor is comparable to the performance (LOD of 10 pM) of the aptasensor reported in the literature,30 and the LOD is well below the U.S. Environmental Protection Agency and World Health Organization 15 nM and 20 nM safe limits. Additionally, the test time is 30 min, which is faster than current reported tests.24,28 Overall, the results suggest that the designed aptasensor could be used for the sensitive detection of DEHP in standard sample.Selectivity of the aptasensor
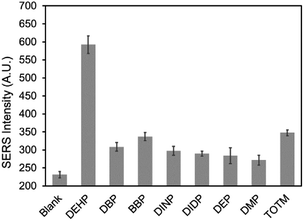
The selectivity of the DEHP aptasensor was evaluated by measuring its response to the molecules that have analogous structures to DEHP and also commonly present in plastic products. Dibutyl phthalate (DBP), benzyl butyl phthalate (BBP), diisononyl phthalate (DINP), diisodecyl phthalate (DIDP), diethyl phthalate (DEP), and dimethyl phthalate (DMP) are widely used phthalates. Besides the mentioned phthalates, trioctyl trimellitate (TOTM) is one of the alternatives to DEHP.60 These chemicals were used as interfering molecules to test and confirm the selectivity of the aptasensor. The responses of the aptasensor to 100 nM of DEHP and to 100 nM of the interfering molecules were presented in Fig. 8. It can be observed that the aptasensor resulted in a much lower signal response for the interfering molecules than for DEHP. TOTM exhibited the highest response of the interfering molecules tested, which may have occurred because the structure of TOTM was very similar to DEHP. Overall, when the aptasensor was exposed to same concentration (100 nM) of DEHP and interfering molecules, the SERS response was significantly higher for DEHP than for the interfering molecules, confirming the good selectivity of the aptasensor.Application for tap water and bottled beverage sample analysis
Tap water and bottled beverages were used to evaluate the performance of the DEHP aptasensor in practical analytical applications. Without any pre-treatment, tap water, bottled mineral water, and carbonated drink were taken directly from their containers and spiked with DEHP (1 nM and 10 nM). For each test, 1 μL of the SERS silica particles and 3 μL of the magnetic particles were mixed with 35 μL of the prepared sample. After 30 min of reaction, the supernatant (30 μL) was collected by magnetic separation and the SERS signal was measured. As shown in Table 1, the recovery values of the DEHP from the three sample matrices were within 90–116%, demonstrating the aptasensor has a good reliability to detect DEHP in real sample matrices. Across all three sample matrices, the differences on average between the found values and the added values were within 0.10 nM for the samples spiked with 1 nM DEHP and within 1.6 nM for the samples spiked with 10 nM DEHP. However, the aptasensor showed a higher standard deviation of detection (3.57 nM) and thus a lower precision in the carbonated drink compared to the other two sample matrices, which may due to the more acidic pH in the carbonated drink than the tap water and the bottled mineral water.| Sample | Added (nM) | Found (nM) | Recovery (%) | |
|---|---|---|---|---|
| Tap water | 1 | 0.90 ± 0.13 | 90.00% | |
| 10 | 9.52 ± 0.92 | 95.17% | ||
| Beverage in PET bottles | Mineral water | 1 | 1.00 ± 0.18 | 100.43% |
| 10 | 11.25 ± 0.68 | 112.51% | ||
| Carbonated drink | 1 | 1.03 ± 0.31 | 103.27% | |
| 10 | 11.6 ± 3.57 | 116.09% | ||
Conclusions
This aptasensor was developed such that it could be delivered to the end user to provide a simple, rapid, sensitive, and selective method for detection of DEHP. The designed SERS silica particles exhibited a sensitive and stable SERS signal due to the RRM and “hot spots” created by the silver nanoclusters within the silica. The DEHP aptasensor was tested with a commercial portable Raman spectrometer and was able to detect trace DEHP with a LOD of 8 pM. Also, the aptasensor could selectively recognize DEHP and show low response for molecules with analogous structures. Furthermore, the aptasensor was tested for the detection of DEHP in spiked tap water and bottled beverages, and the standard errors were below the U.S. Environmental Protection Agency and World Health Organization 15 nM and 20 nM safe limits. In summary, the developed aptasensor provides a sensitive and selective method for quantitative detection of DEHP in the field.Conflicts of interest
There are no conflicts to declare.Acknowledgements
The authors acknowledge the financial support of BioTex, Inc. through a National Institutes of Health SBIR (1R43ES022303-01). The authors also acknowledge the helpful discussions with Dr William Jackson at Basepair BioTechnologies regarding the aptamer and assay chemistry.Notes and references
- U. Heudorf, V. Mersch-Sundermann and E. Angerer, Int. J. Hyg. Environ. Health, 2007, 210, 623–634 CrossRef CAS
.
- D. Koniecki, R. Wang, R. P. Moody and J. P. Zhu, Environ. Res., 2011, 111, 329–336 CrossRef CAS PubMed
.
- T. Cirillo, G. Latini, M. A. Castaldi, L. Dipaola, E. Fasano, F. Esposito, G. Scognamiglio, F. Di Francesco and L. Cobellis, J. Agric. Food Chem., 2015, 63, 3303–3310 CrossRef CAS PubMed
.
- NTP-CERHR, Meeting summary, 2005, 2015 Search PubMed
.
- P. Schmid, M. Kohler, R. Meierhofer, S. Luzi and M. Wegelin, Water Res., 2008, 42, 5054–5060 CrossRef CAS PubMed
.
- H. C. Erythropel, M. Maric, J. A. Nicell, R. L. Leask and V. Yargeau, Appl. Microbiol. Biotechnol., 2014, 98, 9967–9981 CrossRef CAS PubMed
.
- S. Sargazi, R. Mirzaei, M. Rahmani, M. Mohammadi, A. Khammari and M. Sheikh, J. Anal. Chem., 2017, 72, 557–561 CrossRef CAS
.
- G. Heinemeyer, C. Sommerfeld, A. Springer, A. Heiland, O. Lindtner, M. Greiner, T. Heuer, C. Krems and A. Conrad, Int. J. Hyg. Environ. Health, 2013, 216, 472–480 CrossRef CAS PubMed
.
- M. Del Carlo, A. Pepe, G. Sacchetti, D. Compagnone, D. Mastrocola and A. Cichelli, Food Chem., 2008, 111, 771–777 CrossRef CAS
.
- X. L. Cao, Compr. Rev. Food Sci. Food Saf., 2010, 9, 21–43 CrossRef CAS
.
- S. H. Swan, K. M. Main, F. Liu, S. L. Stewart, R. L. Kruse, A. M. Calafat, C. S. Mao, J. B. Redmon, C. L. Ternand, S. Sullivan, J. L. Teague and S. F. F. R. Team, Environ. Health Perspect., 2005, 113, 1056–1061 CrossRef CAS PubMed
.
- G. Latini, C. De Felice, G. Presta, A. Del Vecchio, I. Paris, F. Ruggieri and P. Mazzeo, Environ. Health Perspect., 2003, 111, 1783–1785 CrossRef CAS PubMed
.
- M. Zolfaghari, P. Drogui, B. Seyhi, S. K. Brar, G. Buelna and R. Dube, Environ. Pollut., 2014, 194, 281–293 CrossRef CAS PubMed
.
- Y. H. Zhang, L. X. Zheng and B. H. Chen, Biomed. Environ. Sci., 2006, 19, 205–209 CAS
.
- U. S. E. P. Agency, Integrated Risk Information System, 2012 Search PubMed
.
- WHO, Guidelines for drinking-water quality, WHO, World Health Organization, 2011 Search PubMed
.
- E. T. Ozer, B. Osman and T. Yazici, J. Chromatogr. A, 2017, 1500, 53–60 CrossRef CAS PubMed
.
- J. González-Sálamo, B. Socas-Rodríguez, J. Hernández-Borges and M. Á. Rodríguez-Delgado, J. Chromatogr. A, 2017, 1530, 35–44 CrossRef PubMed
.
- M. A. Farajzadeh and M. R. A. Mogaddam, Anal. Chim. Acta, 2012, 728, 31–38 CrossRef CAS PubMed
.
- E. Tahmasebi, M. Y. Masoomi, Y. Yamini and A. Morsali, RSC Adv., 2016, 6, 40211–40218 RSC
.
- T. T. Tran-Lam, Y. H. Dao, D. T. Nguyen, H. K. Ma, T. Q. Pham and G. T. Le, Toxics, 2018, 6, 69 CrossRef PubMed
.
- L. D. Cheng, S. H. Pan, C. Y. Ding, J. He and C. J. Wang, J. Chromatogr. A, 2017, 1511, 85–91 CrossRef CAS PubMed
.
- F. Makkliang, P. Kanatharana, P. Thavarungkul and C. Thammakhet-Buranachai, Anal. Chim. Acta, 2017, 985, 69–78 CrossRef CAS PubMed
.
- M. C. Zhang, W. T. Hong, X. Y. Wu, Y. Zhang, F. Z. Li and S. Q. Zhao, Anal. Methods, 2015, 7, 5441–5446 RSC
.
- H. Q. Fang, J. Wang and R. A. Lynch, Food Control, 2017, 73, 1298–1302 CrossRef CAS
.
- R. Y. Sun and H. S. Zhuang, Anal. Methods, 2014, 6, 9807–9815 RSC
.
- F. J. Xiao, M. Y. Guo, J. Z. Wang, X. R. Yan, H. L. Li, C. Qian, Y. J. Yu and D. Y. Dai, Anal. Chim. Acta, 2018, 1043, 35–44 CrossRef CAS PubMed
.
- S. Q. Xiong, J. J. Cheng, L. L. He, D. Q. Cai, X. Zhang and Z. Y. Wu, J. Electroanal. Chem., 2015, 743, 18–24 CrossRef CAS
.
- S. Venkatesh, C. C. Yeung, Q. J. Sun, J. Q. Zhuang, T. Li, R. K. Y. Li and V. A. L. Roy, Sens. Actuators, B, 2018, 259, 650–657 CrossRef CAS
.
- Y. Han, D. L. Diao, Z. W. Lu, X. N. Li, Q. Guo, Y. M. Huo, Q. Xu, Y. S. Li, S. L. Cao, J. C. Wang, Y. Wang, J. X. Zhao, Z. F. Li, M. He, Z. F. Luo and X. H. Lou, Anal. Chem., 2017, 89, 5270–5277 CrossRef CAS PubMed
.
- X. Wu, D. L. Diao, Z. W. Lu, Y. Han, S. Xu and X. H. Lou, J. Vis. Exp., 2018, e56814, DOI:10.3791/56814
.
- A. B. Iliuk, L. Hu and W. A. Tao, Anal. Chem., 2011, 83, 4440–4452 CrossRef CAS PubMed
.
- X. Chen, Y. Wang, Y. Zhang, Z. Chen, Y. Liu, Z. Li and J. Li, Anal. Chem., 2014, 86, 4278–4286 CrossRef CAS PubMed
.
- C. Jin, L. Qiu, J. Li, T. Fu, X. Zhang and W. Tan, Analyst, 2016, 141, 461–466 RSC
.
- D. Song, R. Yang, S. Y. Fang, Y. P. Liu, F. Long and A. N. Zhu, Microchim. Acta, 2018, 185, 491 CrossRef PubMed
.
- Y. Li, J. Y. Xu and C. Y. Sun, RSC Adv., 2015, 5, 1125–1147 RSC
.
- S. Schlucker, ChemPhysChem, 2009, 10, 1344–1354 CrossRef PubMed
.
- J. Kneipp, H. Kneipp and K. Kneipp, Chem. Soc. Rev., 2008, 37, 1052–1060 RSC
.
- Y. Li, Z. Wang, X. J. Mu, A. Ma and S. Guo, Biotechnol. Adv., 2017, 35, 168–177 CrossRef CAS PubMed
.
- R. Xiao, C. W. Wang, A. N. Zhu and F. Long, Biosens. Bioelectron., 2016, 79, 661–668 CrossRef CAS PubMed
.
- J. T. Garza and G. L. Cote, Anal. Chem., 2017, 89, 13120–13127 CrossRef CAS PubMed
.
- N. Yang, T. T. You, X. Liang, C. M. Zhang, L. Jiang and P. G. Yin, RSC Adv., 2017, 7, 9321–9327 RSC
.
- S. L. Kleinman, B. Sharma, M. G. Blaber, A. I. Henry, N. Valley, R. G. Freeman, M. J. Natan, G. C. Schatz and R. P. Van Duyne, J. Am. Chem. Soc., 2013, 135, 301–308 CrossRef CAS PubMed
.
- S. Boca, D. Rugina, A. Pintea, L. Barbu-Tudoran and S. Astilean, Nanotechnology, 2011, 22, 055702 CrossRef PubMed
.
- A. Pallaoro, G. B. Braun, N. O. Reich and M. Moskovits, Small, 2010, 6, 618–622 CrossRef CAS PubMed
.
- M. Yarbakht, M. Nikkhah, A. Moshaii, K. Weber, C. Matthaus, D. Cialla-May and J. Popp, Talanta, 2018, 186, 44–52 CrossRef CAS PubMed
.
- A. M. Fales, H. Yuan and T. Vo-Dinh, Langmuir, 2011, 27, 12186–12190 CrossRef CAS PubMed
.
- S. Lee, H. Chon, J. Lee, J. Ko, B. H. Chung, D. W. Lim and J. Choo, Biosens. Bioelectron., 2014, 51, 238–243 CrossRef CAS PubMed
.
- W. E. Doering and S. M. Nie, Anal. Chem., 2003, 75, 6171–6176 CrossRef CAS PubMed
.
- G. N. Zhang, G. Qu, Y. Chen, A. G. Shen, W. Xie, X. D. Zhou and J. M. Hu, J. Mater. Chem. B, 2013, 1, 4364–4369 RSC
.
- Y. Q. Wang, B. Yan and L. X. Chen, Chem. Rev., 2013, 113, 1391–1428 CrossRef CAS PubMed
.
- N. Leopold and B. Lendl, J. Phys. Chem. B, 2003, 107, 5723–5727 CrossRef CAS
.
- M. Schütz, M. Salehi and S. Schlücker, Chem.–Asian J., 2014, 9, 2219–2224 CrossRef PubMed
.
- G. Chen, Y. Wang, L. H. Tan, M. Yang, L. S. Tan, Y. Chen and H. Chen, J. Am. Chem. Soc., 2009, 131, 4218–4219 CrossRef CAS PubMed
.
- R. Ashayer, S. H. Mannan and S. Sajjadi, Colloids Surf., A, 2008, 329, 134–141 CrossRef CAS
.
- T. G. Waddell, D. E. Leyden and M. T. Debello, J. Am. Chem. Soc., 1981, 103, 5303–5307 CrossRef CAS
.
- H. L. Marks, M. V. Pishko, G. W. Jackson and G. L. Cote, Anal. Chem., 2014, 86, 11614–11619 CrossRef CAS PubMed
.
- W. A. Zhao, W. Chiuman, J. C. F. Lam, S. A. McManus, W. Chen, Y. G. Cui, R. Pelton, M. A. Brook and Y. F. Li, J. Am. Chem. Soc., 2008, 130, 3610–3618 CrossRef CAS PubMed
.
- J. Goscianska, A. Olejnik, I. Nowak, M. Marciniak and R. Pietrzak, Chem. Eng. J., 2016, 290, 209–219 CrossRef CAS
.
- J. Sampson and D. de Korte, Transfus Med., 2011, 21, 73–83 CrossRef CAS PubMed
.
Footnote |
| † Electronic supplementary information (ESI) available. See DOI: 10.1039/c8ra09230c |
| This journal is © The Royal Society of Chemistry 2019 |

