 Open Access Article
Creative Commons Attribution 3.0 Unported Licence
Cloud droplet activation of organic–salt mixtures predicted from two model treatments of the droplet surface†
Jack J.
Lin
 ,
Jussi
Malila
and
Nønne L.
Prisle
 *
*
Nano and Molecular Systems Research Unit, FI-90014 University of Oulu, P. O. Box 3000, Oulu, Finland. E-mail: nonne.prisle@oulu.fi
First published on 10th October 2018
Abstract
The droplet surface plays important roles in the interaction between organic aerosols with clouds and climate. Surface active organic compounds can partition to the droplet surface, depleting the solute from the droplet bulk or depressing the droplet surface tension. This may in turn affect the shape of the droplet growth curve, threshold of aerosol activation into cloud droplets, activated droplet size distributions, and cloud radiative effects. In this work, a new monolayer model along with a traditional Gibbs adsorption isotherm model was used in conjunction with equilibrium Köhler theory to predict cloud condensation nuclei (CCN) activation of both simple and complex surface active model aerosol systems. For the surface active aerosol considered, the monolayer droplet model produces similar results to the Gibbs model as well as comparable results to CCN measurements from the literature, even for systems where specific molecular identities and aqueous properties are unknown. The monolayer model is self-contained and fully prognostic, and provides a versatile, conceptually simple, yet physically based model for understanding the role of organic surfactants in cloud droplet formation.
Environmental significanceMany atmospheric organic compounds are surface active. The partitioning of these compounds in droplets is an important process that can have impacts on surface tension depression and critical supersaturation. Understanding the role of the processes that occur at droplet surfaces can lead to the reduction in the uncertainty in the anthropogenic indirect effect. We compare the performance of a monolayer surface model to a traditional model based on Gibbs thermo-dynamics. The new monolayer model requires fewer compound-specific inputs making it more suitable for studying chemically unresolved atmospheric 5 organic aerosols. It adds to our understanding of the processes that control surface activity in cloud droplets and presents a new pathway to constrain surface impacts on cloud activation and radiative balance. |
1 Introduction
The role of surfactants in cloud droplet activation has been a recurring theme for modelling of organic aerosol cloud climate interactions.1–12 While it has been established that surface activity can impact single droplet activation through both lowering surface tension and from diminishing the solute effect by surface partitioning,3–6,12,13 the relative impact of these effects and their potential synergies under different conditions are currently not well constrained.9,10,14,15 This balance has been shown to significantly impact the predictions of global cloud droplet numbers and radiative forcing16 and is therefore important to understand in a fully prescriptive way. Disregarding surfactant effects has in several cases been shown to give correct predictions of measured droplet critical supersaturation, similar to comprehensive model frameworks.4,5,13 However, surfactant effects change the shape of the droplet growth curve3–6 and changes in the activated droplet size spectrum and large-scale radiative effects should therefore also be accounted for.Droplet models based on Gibbs adsorption thermodynamics3,5 and their approximations6,17,18 have been relatively successful in predicting cloud activation for a few selected model surfactant systems but require knowledge of molecular identity and properties, such as molecular weight and pure bulk phase mass density, for all droplet components and composition-dependent properties, such as surface tension and water activity, for the full range of droplet solution states considered. Therefore, previous studies have largely been limited to a few well-characterized surfactant systems (see e.g. Petters and Petters8 and references therein). In particular, industrial surfactants with relatively well-characterized molecular and solution properties, such as sodium dodecyl sulfate (SDS), Triton, and Zonyl, have been the subject of a number of studies as model systems for atmospheric surfactants. SDS in particular has been a favored surface-active organic aerosol model compound, both by itself and in binary aerosol mixtures with NaCl, in experimental and theoretical studies of cloud condensation nuclei (CCN) activation.1,3,5,8,19,20 Of atmospherically relevant surfactants, previous studies have focused on straight-chain fatty acids and their carboxylate salts4,5,11 and less surface active dicarboxylic acids.21–24 Recently, more complex surface active mixtures, including atmospheric limonene-derived organosulphates,25 organic mixtures coating pollen grains called pollenkitt,12 and proxies for atmospheric humic-like substances (HULIS),13 have been interpreted in a Gibbs model framework to varying degrees of success.
Several alternative droplet frameworks to the Gibbs approach for CCN activation thermodynamics have been proposed.6,9,10,26,27 The common feature of these frameworks is the representation of the droplet surface as a physical (mono-)layer instead of a mathematical dividing surface with related excess quantities as done in the Gibbs models. Recently, Malila and Prisle27 developed a relatively simple physical monolayer droplet model for predicting bulk/surface partitioning of all species in the droplet, yielding specifically the composition and thickness of the surface phase. The model predictions can therefore be directly compared not only to experimentally observed CCN activity, but also to experimental and computational studies of the droplet structure. The monolayer model is completely self-contained and involves no tunable parameters in addition to thermodynamic input data. It also requires fewer inputs of specific thermodynamic data than the Gibbs droplet models. In particular it does not require explicit knowledge of droplet water and solute activities, which are often not known or even well-defined for atmospherically relevant organic mixtures.
Here, we use the monolayer droplet model of Malila and Prisle27 in combination with Köhler28 theory to predict the CCN activity of organic aerosol systems with different surface activity, surfactant strength and chemical complexity. We compare model predictions to the Gibbs models of Prisle et al.5 and Prisle and Molgaard when available, to experimental data from the literature.
2 Methods
We consider CCN activation under two different thermodynamic frameworks used to evaluate the bulk/surface partitioning equilibrium of surface active and other droplet components. In the monolayer droplet model, partitioning occurs into a physical surface layer with thickness δ defined by its volume-weighted components. In the Gibbs model, partitioning is evaluated with respect to a conceptual two-dimensional dividing surface between uniform droplet liquid and gas phases and the deviation of droplet thermodynamics from that of a system comprised of these two bulk phases is described in terms of surface excess quantities. A detailed comparison of these approaches is given in ref. 27. With either choice of droplet framework, critical conditions for droplet activation are then evaluated using Köhler theory.282.1 Monolayer model
Bulk and surface compositions are related to the surface tension according to the Laaksonen–Kulmala30,31 equation, | (1) |
 and
and  are the bulk and surface mole fractions, corresponding to molar amounts nbi and nsi, of droplet component i, and σ (without a subscript) refers to the surface tension of the solution phase, while σi and vi are the surface tensions and liquid-phase molecular volumes of each (pure) component. Expressing the surface phase thickness
 | (2) |
2.2 Gibbs model
In the Gibbs model, surface excesses or adsorptions Γi (the surface excess number area density of molecules) of droplet components are related via Gibbs' adsorption equation. Following earlier work,3–5 we write this equation as | (3) |
 ) and conservation of mass (nsi + nbi = nti) to evaluate the bulk and surface excess mole numbers of different species, nbi and 4πR2Γi, respectively. Furthermore, a constraint is imposed that the ratio of water and salt molecules in the bulk and surface remains fixed, to reduce the number of independent variables. The assumption of volume additivity, i.e. that partial molar volumes vi are equal to those of pure substances v0i irrespective of droplet phase composition, is an expression of ideal mixing properties for the droplet solution and a thermodynamic feature treated differently by the monolayer and Gibbs droplet models in this work. However, as liquid-phase densities of ternary systems in the monolayer model are approximated with those of ideal binary mixtures of aqueous salt solution and surfactant, it is not likely to be a significant source of difference between different frameworks. Following the approach documented by Prisle et al.,5 we also assume mixing ideality in the form of unity activity coefficients in eqn (3) for all components in the droplet bulk (abi = xbi).
A major difference considering surface partitioning in the monolayer and Gibbs models is that the Gibbs dividing surface has no volume, i.e. , so that molecules adsorbed on the surface do not contribute to the total volume
  of the droplet. Moreover, the surface excess quantities are sensitive to the position of the Gibbs dividing surface, which is implicitly defined here from the total bulk molecular amounts solved from eqn (3) to yield the specified total volume of the droplet. Therefore, a positive surfactant surface excess must be balanced by a total negative surface excess of other droplet components, here water and salt. In Section 3.1.3 we discuss the implications of this for comparing the extent of surface partitioning evaluated with the two different surface models. More details can be found in ref. 5.
2.3 Köhler theory
Droplet activation is evaluated in terms of the critical saturation ratio (Scrit, often presented as an excess percentage i.e. saturation ratio (S − 1) × 100%) for water vapour, iterated as the maximum of the Köhler curve for equilibrium growth of a spherical droplet | (4) |
In eqn (4), aw = abw is the water activity and vw the partial molecular volume of water in the droplet (bulk), and k and T are the Boltzmann constant and temperature in kelvin, respectively.
For complex mixtures, experimental data for the water activity are often unavailable. Instead, aw may then be obtained from computational estimates such as group-contribution methods or, in the case of dilute solutions, approximated with the bulk mole fraction of water, xbw. While group contribution methods have been shown to give accurate activity coefficients for binary organic aqueous mixtures of atmospheric interest,32,33 there are only a few studies on their validity for organic–inorganic aqueous mixtures,34,35 and in general there is a significant spread between the estimated activity coefficients from different models. For chemically unresolved organic mixtures such as model-HULIS and pollenkitts, it is not possible to use group-contribution methods at all. Here, we therefore in all cases approximate the water activity with the bulk mole fraction of water (abw = xbw) for consistency and to facilitate comparison between the different systems. Droplet xbw and σ are determined from the bulk mole fractions derived from the monolayer and Gibbs models and used in eqn (4) to evaluate the properties of droplets during growth and activation.
2.4 Model systems
Four different surface active organic aerosol model systems are considered in this study. Succinic acid (SCA) and SDS represent simple molecular surfactants with different surfactant strength in macroscopic solutions. Nordic Aquatic Fulvic Acid (NAFA) and pollenkitts are complex and chemically unresolved surface active mixtures with different water solubility and surface activity. Cloud droplet activation is calculated for particles consisting of each of these organics mixed with inorganic salts – sodium chloride (NaCl) for SCA, SDS, and NAFA and ammonium sulphate (AS, (NH4)2SO4) for pollenkitts. These salts were selected based on the availability of experimental ternary surface tension data for the surface active organics of interest (see Table 1).| Surfactant | Salt | (N m−1 [c]−1)a | a (N m−1) | b ([c]) | Δ sft (nm) |
|---|---|---|---|---|---|
| a For NaCl and SDS, [c] = M, while for the all other compounds [c] = kg m−3. b Ref. 5. c Ref. 14: here ε is the mass fraction of NAFA in the dry particle, a0 = 72.1344 × 10⁻³, a1 = −158.4 × 10⁻³, and a2 = 93.52 × 10⁻³; and b0 = 6.5559, b1 = −15.51, and b2 = 9.431. d For SDS–NaCl solution, surface tension at a critical micelle concentration (CMC) of 36 mN m−1 was used in calculations. e Ref. 1. f Ref. 12. | |||||
| NAFA | NaCl | 1.61 × 10⁻³b | a 0 + a1ε + a2ε2c | b 0 + b1ε + b2ε2c | 2.04 |
| Succinic acid | NaCl | See Vanhanen et al.,29 eqn (4)–(6) | 0.63 | ||
| Sodium dodecyl sulphated | NaCl | 1.61 × 10⁻³b | 13.9 × 10⁻³e | 9.273 × 10⁻⁶/(9.733 × 10−3 + csalt)e | 0.93 |
| Poplar pollenkitt | (NH4)2SO4 | 16.55 × 10⁻⁶f | 3.53 × 10⁻³f | 0.18 × 10⁻⁴f | 1.01 |
| Ragweed pollenkitt | (NH4)2SO4 | 16.55 × 10⁻⁶f | 3.37 × 10⁻³f | 0.23 × 10⁻⁴f | 1.30 |
Cloud droplet activation of SDS has been studied extensively in previous work, and SDS mixtures are included here for reference, to benchmark calculations with the new monolayer droplet model. NAFA is a commercially available mixture used in previous studies as model HULIS.13,14,36 HULIS is a class of macromolecular compounds so named due to their resemblance to humic and fulvic acids from terrestrial and aquatic sources.37 Significant amounts of HULIS have been isolated from ambient particulate matter from a variety of environments,38–41 and they are known to be surface active and depress the surface tension of aqueous solutions.42–44 The remaining organics studied here have been identified as constituents of CCN relevant aerosols in the lower atmosphere. SCA is a slightly soluble (58–100 g L−1) organic and one of the more abundant dicarboxylic acids observed in the atmosphere.45–51 Previous studies have demonstrated the ability of whole pollen grains52,53 and fragments of pollen grains54 to act as CCN. The pollen grains of certain plant species are coated with a viscous material called pollenkitt.55 The composition of pollenkitt varies across species and is chemically diverse,56 but may resemble other atmospheric organic aerosol mixtures in terms of solubility and surface activity in aqueous solution.12 In this work, we focus on pollenkitt extracted from the pollen of black poplar (Populus nigra) and common ragweed (Ambrosia artemisiifolia), which were found to be the most and least CCN and surface active, respectively, among six pollenkitts studied by Prisle et al.12
2.5 Surface tension and treatment of micelles
Relevant input data needed for model calculations for these aerosol mixtures were obtained from the literature and are summarised in Table 1. The densities of all ternary aqueous solutions were calculated as ideal binary mixtures of the organic compound with water–salt solutions.57,58 Solution surface tensions, with the exception of water–NaCl–succinic acid mixtures,29 were evaluated from an augmented Szyszkowski–Langmuir relation, | (5) |
Any composition dependent surface tension relation relying on measured surface tension isotherms, including eqn (5), breaks down above the critical micelle concentration (CMC) where the surface tension–concentration relation changes discontinuously. A detailed, thermodynamically consistent treatment of micelle formation in aqueous droplets and impact on cloud activation is highly non-trivial. We therefore adopt a simplified, phenomenological approach by applying the condition σ = σCMC,sft both for droplets reaching surface saturation by forming a full monolayer in the monolayer model and for bulk concentrations reaching the CMC in either droplet framework. This allows us to extend the calculations to droplets at bulk concentrations above the ternary surfactant CMCs. With a perfect description of droplet thermodynamics, these states should coincide, but since the monolayer concept is a simplification, this will likely not be fully realized in the current framework. The simplification has the further advantage of circumventing the need for knowing pure surfactant surface tensions for input to the monolayer model. For example, pure SDS is an amorphous solid at room temperature.
3 Results & discussion
In the following sections, we present modelled results for droplet critical supersaturation Scrit, surface tension σcrit and growth factor at activation GFcrit = dcrit/ddry, organic partitioning nssft/ntsft (monolayer model) or 4πR2Γsft/ntsft (Gibbs model), and surface phase thickness δ (only the monolayer model) as functions of dry particle size ddry and composition in terms of dry particle surfactant mass fraction εsft. For all systems, calculations are made for dry particles with diameters 50–150 nm and covering the full range of dry particle surfactant mass fractions εsft ∈ [0,1]. For clarity, only results for selected particle compositions and sizes are shown in the following sections. When available, experimental CCN activity data from the literature are shown for further comparison.3.1 Succinic acid
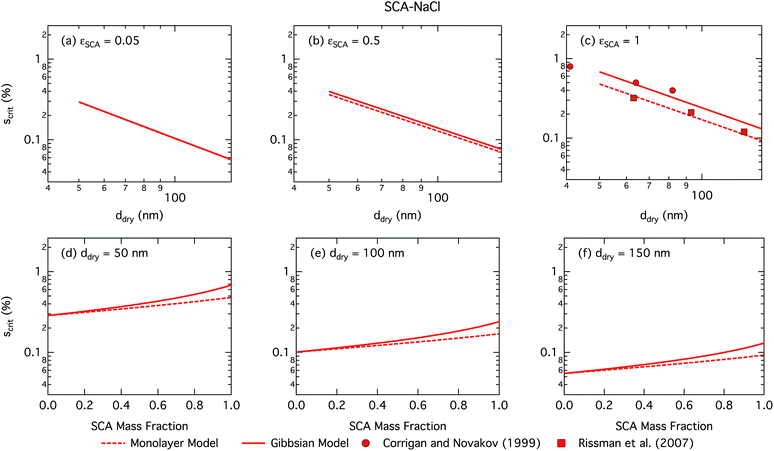 | ||
| Fig. 1 Critical supersaturations calculated with the monolayer and Gibbs droplet models as a function of dry particle size for SCA mass fractions (a) 0.05; (b) 0.5; (c) 1 and as a function of SCA mass fraction for dry particle sizes (d) 50 nm; (e) 100 nm; and (f) 150 nm. Measured critical supersaturations as a function of pure SCA dry size from Corrigan and Novakov59 and Rissman et al.60 are also shown in panel (c). | ||
Succinic acid particles are fairly CCN active, with predicted Scrit in the range 0.055–0.48% for the monolayer model and 0.055–0.68% for the Gibbs model. The monolayer model predicts somewhat smaller Scrit—or greater CCN activity—than the Gibbs model, with the difference between the models growing for increasing εSCA and ddry. A general feature in this work is how the monolayer model predicts larger bulk concentrations of surfactant at a given droplet size and composition, due to the constraint on the extent of surface partitioning imposed by the finite thickness of the physical surface layer and finite densities of pure and aqueous solutes.27 This effect becomes more pronounced for larger SCA fractions, where the monolayer is more fully saturated, and for larger particle sizes and activating droplets, where smaller surface/bulk volume ratios mean that the partitioning mass balance is not as strongly shifted toward the surface phase, as for smaller particles and droplets with larger surface/bulk volume ratios. These effects are discussed in further detail in Section 3.1.2. Nevertheless, the overall Scrit values are similar for the two models and converge as expected in the binary limit of a pure NaCl dry particle without surface active SCA. This occurs even though in the monolayer model NaCl is partially excluded from the surface layer, causing a slight increase in the bulk concentration of NaCl for a given droplet size. However, this difference is seen to have a negligible effect on the modelled droplet properties for SCA–NaCl particles.
The CCN activity of succinic acid mixed with other dicarboxylic acids and NaCl has been determined experimentally,61–63 together with several studies22,59,60,64–67 reporting Scrit values for pure succinic acid particles. We have shown experimental data for pure succinic acid as a function of dry succinic acid particle size from Corrigan and Novakov59 and Rissman et al.60 in Fig. 1. Both experiments generated succinic acid particles from water solution, drying the aqueous droplets, and size selecting the dried particles before measuring their CCN activity. Curiously, data of Corrigan and Novakov59 agree well with the results from the Gibbs model while data of Rissman et al.60 agree well with the results from the monolayer model. This illustrates how experiment–model closure is affected by not only the choice of model framework, but also potentially unresolved experimental conditions.
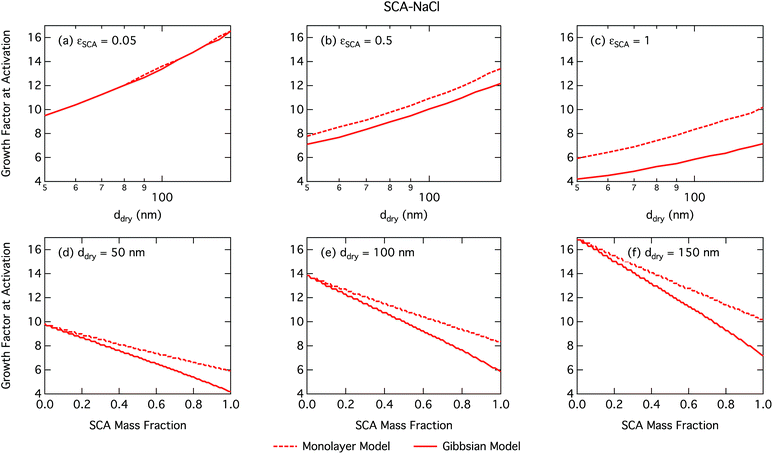
Activation growth factors for other particle mixtures follow similar trends as seen for SCA and are given in the ESI†.
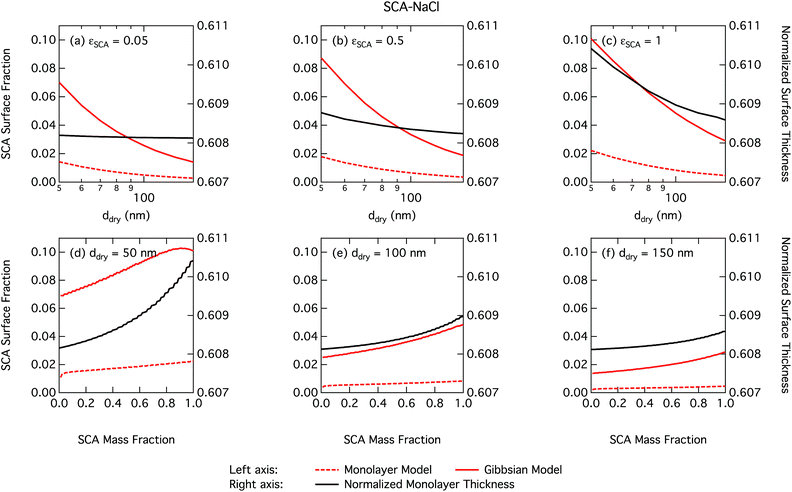
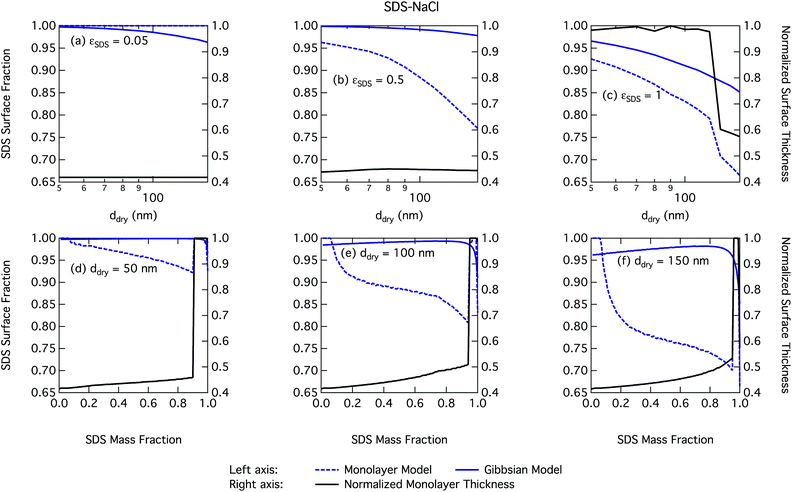
As already mentioned, due to the physical limitation on the number of molecules that can partition into the surface monolayer imposed by the finite volume and component densities, this droplet model consistently predicts lower SCA surface fractions (and therefore higher SCA bulk concentrations) compared to the Gibbs model. Also shown on the right axes of Fig. 4 are the surface thicknesses δ calculated from the monolayer model, normalized to the estimated thickness of one full SCA monolayer ΔSCA (Table 1). Unsurprisingly, the droplet monolayer thickness increases with increasing surface fraction, typically with increasing SCA mass fraction in the dry particle and decreasing dry particle size. This effect is smaller when droplets are more dilute, as seen from the growth factors in Fig. 3.
It is tempting to compare the thickness of the surface monolayer to that of a pure substance phase corresponding to the evaluated surface excess of surfactant in the Gibbs framework. For example, Petters and Petters32 predict surface excesses corresponding to several monolayers for surfactants stronger than those considered here. However, a positive surfactant surface excess evaluated in the Gibbs model must be balanced by a total negative excess of these other solution components to yield the condition  . Assigning the surfactant surface excess of the Gibbs model to a volume based on the properties of a pure surfactant phase is therefore somewhat ambiguous in terms of attributing the volume from components with negative surface excess (water and salt), and accommodating only the surface excess of surfactant into a surface layer would result in a non-equilibrium droplet bulk composition. Here, we therefore illustrate the difference between the two surface model frameworks in terms of evaluated partitioning of surfactant, specifically between the surface and bulk.
3.2 SDS
SDS is a much stronger surfactant in macroscopic solutions than succinic acid and predicted trends for most droplet properties are very similar but more pronounced for SDS particles compared to SCA.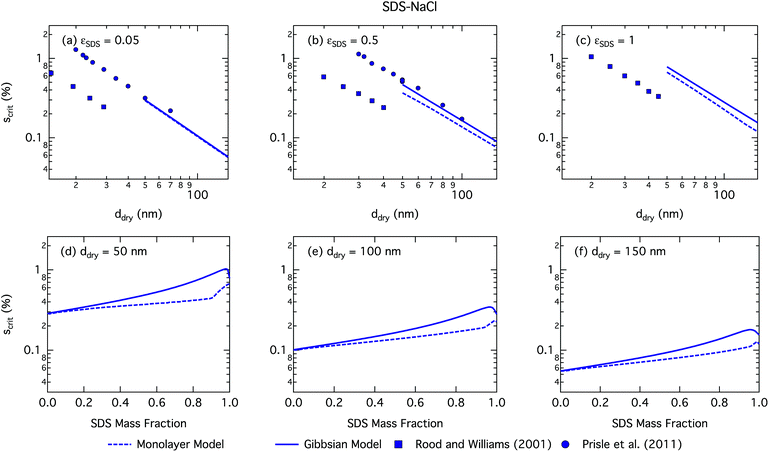 | ||
| Fig. 5 Critical supersaturations calculated with the monolayer and Gibbs models as a function of dry particle size for SDS mass fractions (a) 0.05; (b) 0.5; (c) 1 and as a function of SDS mass fraction for dry particle sizes (d) 50 nm; (e) 100 nm; and (f) 150 nm. Measured critical supersaturations as a function of dry particle size from Rood and Williams19 and Prisle et al.6 are also shown in panels (a)–(c). The measurements in panel (a) are for pure NaCl and are shown for comparison. | ||
We notice a bump in Scritvs. εSDS for SDS mass fractions around 0.95–1.00 as previously predicted using the Gibbs model5,6 due to salting out of SDS by a small amount of NaCl in the high surfactant fraction (and relatively higher overall concentration, see Fig. S1 in the ESI†) range. This effect is much less prominent for the monolayer model predictions, where the CMC is reached in droplet bulk for SDS mass fractions 0.92 (for a 50 nm droplet) and 0.97 (for a 150 nm droplet), as seen from the predicted droplet surface tension in Fig. 6 and further discussed below. The salting-out effect of NaCl on SDS could be overestimated in the Gibbs model, due to a computationally exaggerated so-called common ion effect resulting from the ideal water activity assumption. It is possible that this effect may be entirely a computational feature. For example, Prisle et al.70 and Öhrwall et al.71 both found no indication of an actual common ion effect in surface sensitive XPS studies of aqueous surfactant-salt solutions. In other words, no enhanced salting out of ionic surfactants with Na+ counterions was seen in Na+ salt mixtures compared to other salts of similar ionic strength.
The CCN activity of SDS mixed with NaCl has been experimentally determined by several groups.5,8,19,72 Experimental data from Rood and Williams19 and Prisle et al.6 are also shown in Fig. 5. The experimental data in panel (a) of Fig. 5 are for pure NaCl particles, but are included in the panel for illustrative purposes. The data from Prisle et al.6 agree well with the Gibbs model consistent with previous studies.3 The data of Rood and Williams19 show much lower critical supersaturations than predicted by either model.
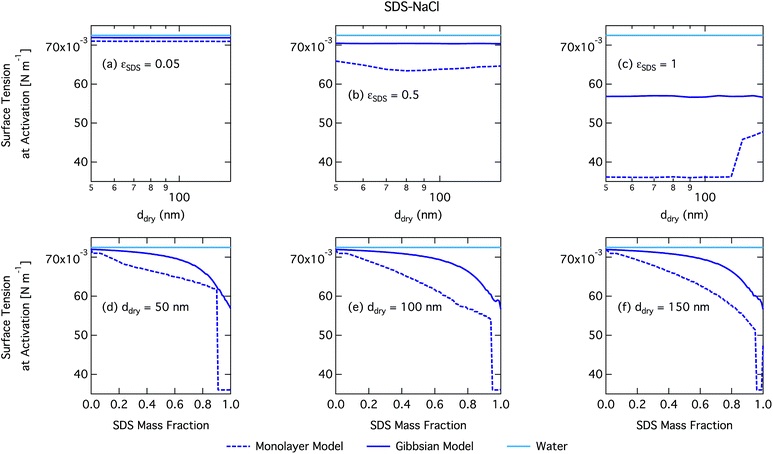
Again, the monolayer model predicts lower droplet surface tensions than the Gibbs model, due to higher bulk concentrations in droplets of a given size and overall composition from restricted surface partitioning. With the monolayer model, the noted sharp drop in activation surface tension predicted for droplets with SDS mass fractions of 0.92–0.97 represents droplet bulk compositions reaching the CMC for SDS. This is not observed for the Gibbs model, where predicted bulk concentrations are much lower due to more pronounced depletion from unrestricted surface partitioning (see Fig. 7). The reason for the discontinuous drop in surface tension at activation to its value at the CMC is the simplified condition σ = σCMC,SDS applied in the monolayer model both for droplets reaching surface saturation and when the bulk concentration reaches the CMC, as mentioned in Section 2.4.1. The sharp drop in surface tension is more pronounced for smaller droplets. Because the surface in the monolayer model has a finite thickness, the surface/bulk volume ratio tends to infinity as the droplet radius decreases towards the surfactant monolayer thickness. For a sufficiently large surface/bulk volume ratio, partitioning essentially becomes a step function in the sense that for systems with CMC or solubility limitations, a single molecule in the bulk simultaneously reaches the maximum thermodynamically possible concentration and causes the maximum deviation of surface tension from that of pure water.27
3.3 Complex surfactants
The monolayer model has a significant advantage compared to Gibbs models in general that fewer compound- and composition-specific parameters for the mixtures are needed and therefore must be known or assumed.27 Specifically, no activity coefficients, which are very hard to obtain for most aqueous mixtures of atmospheric organic aerosols, are needed for the evaluation of bulk/surface partitioning within the droplet. All information on intermolecular interactions in the droplet phase is taken implicitly into account using composition dependent density and surface tension functions. These properties are challenging, but still often feasible, to measure with significant accuracy. This is particularly relevant for increasingly complex and atmospherically relevant systems, as for sparse ambient aerosol samples, where sufficient amounts of material for resolving concentration dependent aqueous properties are usually not obtained. Here, we study droplet properties during growth and activation for two surface active complex organic aerosol systems, NAFA, which does not have a well-defined molecular structure,73–75 and pollenkitts, which are each diverse mixtures of different organic compounds with unknown specific molecular identity and mixing ratios.12,56,76–78 These organic aerosol mixtures have previously been studied within the Gibbs droplet model framework12,13 and the necessary thermodynamic data are therefore available to make model predictions feasible with both droplet models used here.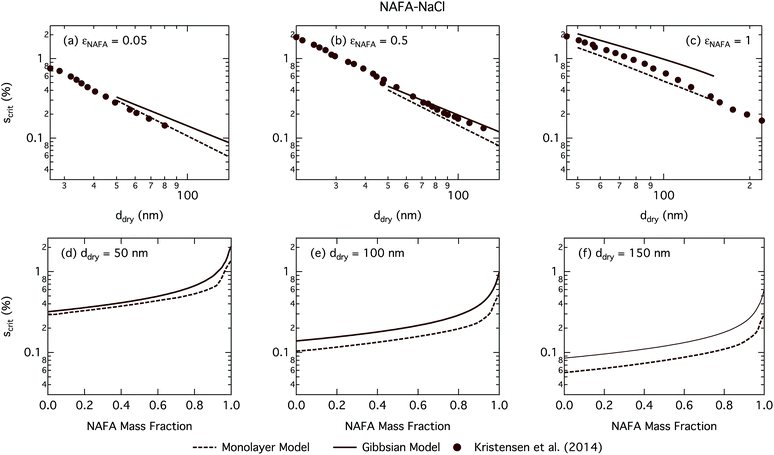 | ||
| Fig. 8 Critical supersaturations calculated with the monolayer and Gibbs models as a function of dry particle size for NAFA mass fractions (a) 0.05; (b) 0.5; (c) 1 and as a function of NAFA mass fraction for dry particle sizes (d) 50 nm; (e) 100 nm; and (f) 150 nm. Measured critical supersaturations as a function of dry particle size from Kristensen et al.14 are also shown in panels (a)–(c). The measurements in panel (a) are for pure NaCl and are shown for comparison. | ||
Fig. 8 shows experimental data from Kristensen et al.14 In general, their measured critical supersaturations fall somewhere in between the predictions of the two models. Smaller dry particles are activated at smaller critical droplet sizes than larger particles with the same overall composition (see Fig. S4† for growth factors.) The smaller droplets have a larger surface area to bulk volume ratio for the Gibbs model or surface to bulk volume ratio for the monolayer model than larger droplets. The mass balance of surfactant partitioning between the droplet bulk and surface is sensitive to the surface/bulk ratio for given molecular and solution properties, leading to a stronger enhancement of surface partitioning in the smaller droplets. The measured data are closer to those of the Gibbs model at smaller dry particle sizes where this effect is more pronounced and closer to that in the monolayer model for larger dry particles where the effect is less pronounced.
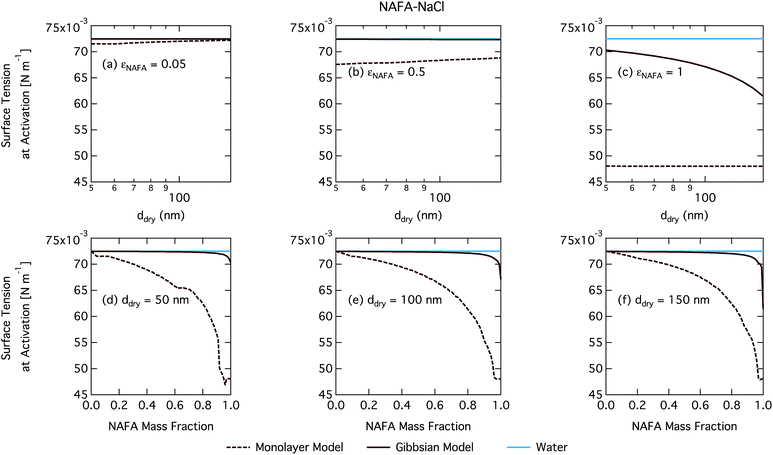
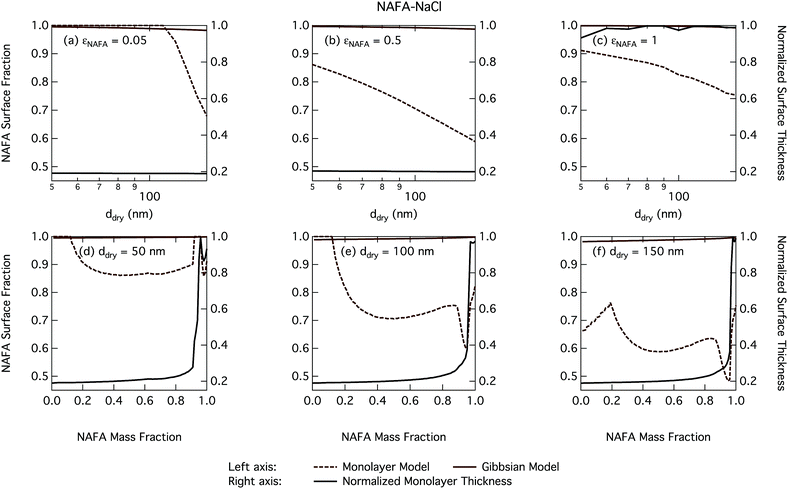
The CCN activity of NAFA has previously been modelled taking surface tension, non-ideality, and surface partitioning into account with the Gibbs model.13 The Gibbs model was run here with a different ternary surface tension parameterisation (equation form and fitting parameters) than used by Prisle and Molgaard13 for consistency between the model conditions within this work. Fig. 9 shows the droplet surface tension at activation as a function of dry particle size and NAFA mass fraction. The predicted surface tensions show large differences between the two models. While the Gibbs model predicts very little reduction in droplet surface tension at the point of activation and only for particles with the highest mass fractions of NAFA, surface tensions predicted with the monolayer model are significantly reduced at all εNAFA. This is again due to a clear difference in the droplet bulk composition predicted with the two different partitioning schemes, as seen in Fig. 10. Unrestricted surface partitioning in the Gibbs model under most conditions leads to significantly greater depletion of the droplet bulk. Here, essentially all NAFA solute is partitioned to the surface of activating droplets, but at the same time there is almost no surface tension depression, because the droplet bulk is nearly completely depleted. In both frameworks, surface tension and water activity are described as functions of droplet bulk composition. Physically, as the partitioning is established as an equilibrium gradient of surface active solute between surface and bulk phases, complete depletion of the bulk is only approached asymptotically.
From Fig. 9, the surface tension predicted at droplet activation by the monolayer model is seen to increase slightly with dry particle size, but on the other hand decreases significantly with increasing dry particle NAFA mass fraction. The increasing trend with dry size follows from the concurrent overall increasing dilution state of activating droplets (Fig. S4 in the ESI†). For increasing NAFA mass fractions, droplets are overall more concentrated at activation (Fig. S4†). In addition, the surface layer thickness (Fig. 10) increases more rapidly with increasing NAFA mass fraction for smaller dry particles. At some of the highest NAFA mass fractions (εNAFA ≥ 0.95), the relatively large NAFA molecules – with a reported average molar mass of 4266 g mol−1 (ref. 79) – are excluded from the surface layer, causing droplet bulk concentrations to approach the NAFA CMC. As the CMC is reached, a full monolayer coverage of NAFA at the surface is predicted from eqn (1), with the surface tension of pure NAFA approximated as σCMC,NAFA = 48 mN m−1. The same phenomenon is also observed, although much less pronounced, for SCA (Fig. 2 and 4).
The peculiar non-monotonic variation of NAFA surface fraction with εNAFA for a fixed dry particle size predicted by the monolayer model (Fig. 10(d)–(f)) partly stems from the assumed form of surface tension parameters. As the surface fraction predicted by the monolayer model is derived from measurements of surface tension, the model is sensitive to how these physical observations are parameterised (see the ESI† for the full sensitivity study.) Because droplets are finite and confined systems, the partitioning mass balance is a sensitive function of droplet size, modulating both the dilution state and position of the surface/bulk partitioning equilibrium of the surfactant. This sensitivity in mass balance is further affected by the nonlinear dependence of surface thickness on composition and translates into a sensitive surface tension dependency on these conditions. It is possible that the sensitive non-monotonic variation with dry particle parameters seen in Fig. 10 would also be evident in actual droplet systems, but, to our knowledge, no experiment can currently resolve such a dependence. Interestingly, this behavior is not reflected in an equally dramatic variation in either Scrit, critical radius or surface tension of activating droplets.
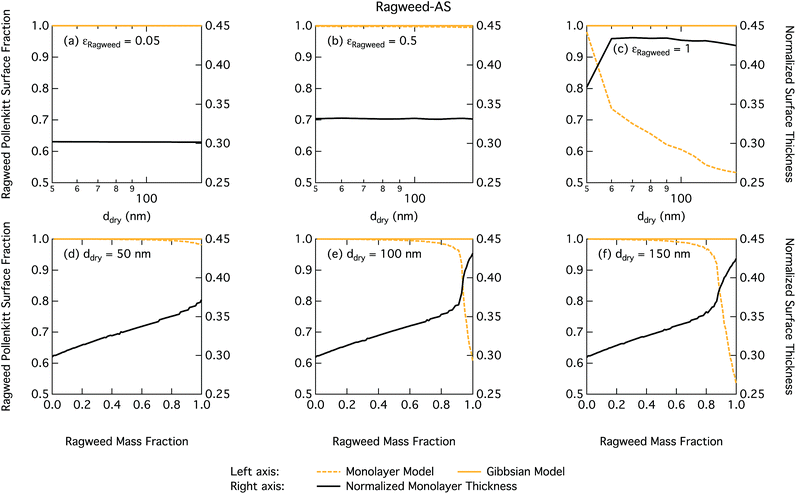
Fig. 11 shows the critical supersaturation for ragweed pollenkitt–ammonium sulphate particles as a function of dry particle size and ragweed pollenkitt mass fraction. As seen with the other surface active organic aerosol systems, the Gibbs model also here predicts higher critical supersaturations than the monolayer model, except for ragweed mass fractions less than 0.12. The difference between the two models remains fairly constant with dry particle size, but becomes noticeably greater for larger εragweed. There is a crossover between critical supersaturations predicted with the two models for εragweed between 0.1 and 0.2. This signature is also found in the critical growth factors (Fig. S3 in the ESI†) and may be related to the different treatment of non-surface active, i.e. salt, components in the two models as described in Section 2. As differences in critical supersaturation for the two models can be seen even for the binary AS salt case (εragweed = 0), this may be due to differences in aqueous densities predicted when salt composition differs. In the monolayer model, droplets also have some AS salt in the surface, thereby decreasing the bulk concentration and Raoult effect from the salt. These differences can change the shape of the droplet growth (Köhler) curves and are further modulated by somewhat different droplet sizes at activation (see Fig. S3 in the ESI†). As εragweed increases, these effects become relatively less significant compared to other effects of pollenkitt partitioning, leading to the observed crossover of predictions from the two models.
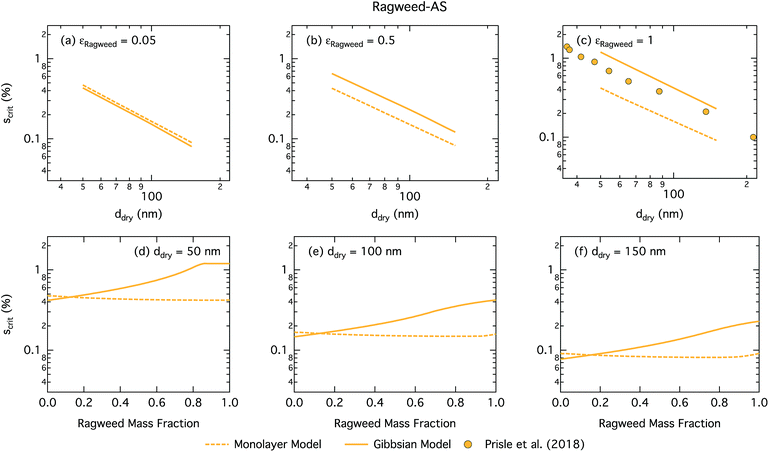 | ||
| Fig. 11 Critical supersaturations calculated by using the monolayer and Gibbs models as a function of dry particle size for ragweed pollenkitt mass fractions (a) 0.05; (b) 0.5; (c) 1 and as a function of ragweed pollenkitt mass fraction for dry particle sizes (d) 50 nm; (e) 100 nm; and (f) 150 nm. Measured critical supersaturations as a function of pure ragweed pollenkitt dry particle size from Prisle et al.12 are also shown in panel (c). | ||
Measurements of critical supersaturation as a function of ragweed pollenkitt dry size from Prisle et al.12 are also shown in panel (c) of Fig. 11. Both predictions from both models and the measurement data have a very similar slope in log ddry − log Scrit space. For pure pollenkitt particles, the Gibbs model predicts critical supersaturations closer to those seen in the measurements.
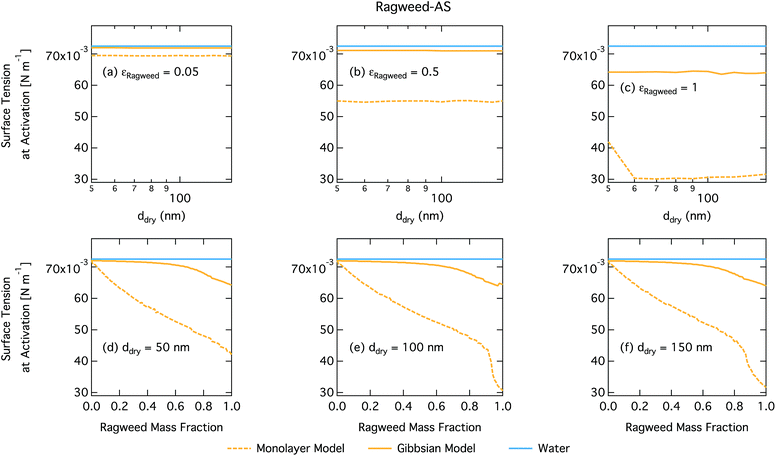
Droplet surface tensions at the critical point are shown in Fig. 12 as a function of dry particle size and ragweed pollenkitt mass fraction. Surface tensions predicted with the monolayer model are consistently lower than those predicted with the Gibbs model. In the monolayer model, droplet surface tension is significantly reduced at all particle sizes and compositions, even reaching the imposed CMC condition for pure ragweed particles above 60 nm, whereas the reduction predicted with the Gibbs framework is much more modest and only becomes significant for larger dry particle sizes and εragweed. The surface tensions of macroscopic pollenkitt solutions were measured by Prisle et al.12 for binary aqueous pollenkitt and for pollenkitt–ammonium sulphate mixtures with a pollenkitt mass fraction of 0.8. The ternary pollenkitt–ammonium sulphate aqueous tension parameterisation is therefore unconstrained at lower pollenkitt mass fractions, and similarly for droplets with lower εragweed, even in the absence of surface partitioning. Fig. 13 shows very high degrees of pollenkitt surface partitioning predicted for both droplet frameworks. These values may be exaggerated by bias in the surface tension parameterisation from measurements at high εragweed, where salting out effects may be more significant. Strong changes in salting out are not seen in Fig. 11, but may not be evident when conditions of low εragweed are not represented in the surface tension parameterisations.
3.4 General discussion
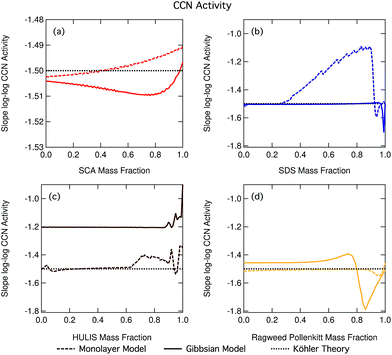
Fig. 14 shows the slopes of log–log plots of critical supersaturation as a function of dry particle size plotted as a function of surfactant mass fraction for each of the studied aerosol systems. The constant log![[thin space (1/6-em)]](https://www.rsc.org/images/entities/char_2009.gif) ddry − log
ddry − log![[thin space (1/6-em)]](https://www.rsc.org/images/entities/char_2009.gif) Scrit slope value of −1.5 predicted using basic equilibrium Köhler theory is shown in each panel for reference. Deviations of the slope from this value are indicative of the presence of droplet effects which introduce a different dependency of Scrit on ddry than predicted using basic Köhler theory. We clearly see such deviations for many of our studied particle mixtures and the trend in deviation from the −1.5 line is greatly different between the different organic aerosol systems. In the case of SDS and ragweed pollenkitt particles, major deviations also exist between predictions with the two droplet partitioning models. The small fluctuations seen for some of the traces are numerical noise in the model.
Scrit slope value of −1.5 predicted using basic equilibrium Köhler theory is shown in each panel for reference. Deviations of the slope from this value are indicative of the presence of droplet effects which introduce a different dependency of Scrit on ddry than predicted using basic Köhler theory. We clearly see such deviations for many of our studied particle mixtures and the trend in deviation from the −1.5 line is greatly different between the different organic aerosol systems. In the case of SDS and ragweed pollenkitt particles, major deviations also exist between predictions with the two droplet partitioning models. The small fluctuations seen for some of the traces are numerical noise in the model.
In general, a number of effects can affect droplet growth and activation at the same time with competing size dependencies. In our present calculations, dry particle size and composition are varied in a well-known and systematic fashion, and we have assumed ideal droplet solutions such that activity coefficients do not vary with droplet dilution. Therefore, potential effects changing the log![[thin space (1/6-em)]](https://www.rsc.org/images/entities/char_2009.gif) ddry − log
ddry − log![[thin space (1/6-em)]](https://www.rsc.org/images/entities/char_2009.gif) Scrit slope are concentration dependent droplet surface tension reduction and water activity increase from bulk/surface partitioning.
Scrit slope are concentration dependent droplet surface tension reduction and water activity increase from bulk/surface partitioning.
As seen in the growth factor variation with dry particle size (Fig. 3 and S3–S6 in the ESI†), larger particles are generally activated as larger, more dilute droplets. From the Köhler eqn (4) it is therefore seen that concentration dependent droplet surface tension and surface partitioning effects on water activity will lead to opposite dependencies of Scrit on ddry in the absence of further modulating effects. Concentration dependent surface tension at the critical droplet size will increase as larger particles are activated into larger, more dilute droplets, leading to increasing Scrit and a less steep (greater than −1.5) slope of log![[thin space (1/6-em)]](https://www.rsc.org/images/entities/char_2009.gif) ddry − log
ddry − log![[thin space (1/6-em)]](https://www.rsc.org/images/entities/char_2009.gif) Scrit. Surface partitioning will increase aw and Scrit more strongly for the smaller droplets, leading to a steeper (smaller than −1.5) log
Scrit. Surface partitioning will increase aw and Scrit more strongly for the smaller droplets, leading to a steeper (smaller than −1.5) log![[thin space (1/6-em)]](https://www.rsc.org/images/entities/char_2009.gif) ddry − log
ddry − log![[thin space (1/6-em)]](https://www.rsc.org/images/entities/char_2009.gif) Scrit slope. Therefore, we can overall say that if surface tension effects are dominating the size dependency of Scrit, the slope of log
Scrit slope. Therefore, we can overall say that if surface tension effects are dominating the size dependency of Scrit, the slope of log![[thin space (1/6-em)]](https://www.rsc.org/images/entities/char_2009.gif) ddry − log
ddry − log![[thin space (1/6-em)]](https://www.rsc.org/images/entities/char_2009.gif) Scrit will be less steep than the value of −1.5 predicted using basic equilibrium Köhler theory and if surface partitioning depletion effects on aw dominate, the log
Scrit will be less steep than the value of −1.5 predicted using basic equilibrium Köhler theory and if surface partitioning depletion effects on aw dominate, the log![[thin space (1/6-em)]](https://www.rsc.org/images/entities/char_2009.gif) ddry − log
ddry − log![[thin space (1/6-em)]](https://www.rsc.org/images/entities/char_2009.gif) Scrit slope will conversely be steeper. We see that, in general, both situations come into play across the full range of particle compositions studied in this work.
Scrit slope will conversely be steeper. We see that, in general, both situations come into play across the full range of particle compositions studied in this work.
When the slopes in Fig. 14 remain constant at a value of −1.5, the size dependency of Scrit is the same for all particle compositions as would have been predicted using basic Köhler theory without accounting for effects of surface activity. This, however, does not mean that the absolute values of Scrit are also the same, only the dependency on dry particle size. It also does not indicate the absence of surfactant effects, only that the overall influences of any size dependent effects present must balance out for all dry particle compositions to yield the same dependency of Scrit on ddry as in the absence of these effects. This is the case for nearly all mass fractions of SDS in the Gibbs model and pollenkitt in the monolayer model. For succinic acid, there are small slope changes for predictions with both models (note the different scale on the axis, compared to the other three panels).
When the log![[thin space (1/6-em)]](https://www.rsc.org/images/entities/char_2009.gif) ddry − log
ddry − log![[thin space (1/6-em)]](https://www.rsc.org/images/entities/char_2009.gif) Scrit slope deviates from −1.5 but remains constant across dry particle composition for a given set of surfactant–salt mixtures, particles display a different size dependency of Scrit than predicted using basic Köhler theory, but this size dependency remains unchanged across the surfactant–salt composition range. Thus, among any size dependent effects which are present, the overall balance of these effects in producing the size dependency of Scrit does not change across the ensemble of surfactant–salt mixtures. Specifically, the balance between surface tension and partitioning depletion at droplet activation changes with dry particle size, changing the log
Scrit slope deviates from −1.5 but remains constant across dry particle composition for a given set of surfactant–salt mixtures, particles display a different size dependency of Scrit than predicted using basic Köhler theory, but this size dependency remains unchanged across the surfactant–salt composition range. Thus, among any size dependent effects which are present, the overall balance of these effects in producing the size dependency of Scrit does not change across the ensemble of surfactant–salt mixtures. Specifically, the balance between surface tension and partitioning depletion at droplet activation changes with dry particle size, changing the log![[thin space (1/6-em)]](https://www.rsc.org/images/entities/char_2009.gif) ddry − log
ddry − log![[thin space (1/6-em)]](https://www.rsc.org/images/entities/char_2009.gif) Scrit slope value from −1.5, but this size dependent change otherwise remains the same for particles with different compositions. This can be seen for most of the Gibbs model results, for the major part of the NAFA particles, and in some sections of the monolayer model results for SDS and ragweed. The particle composition regions where there is a large size-dependent effect correspond to the transition regions in terms of CCN activity where it therefore becomes especially important to characterize both the surface tension and partitioning in an explicit and decoupled manner.
Scrit slope value from −1.5, but this size dependent change otherwise remains the same for particles with different compositions. This can be seen for most of the Gibbs model results, for the major part of the NAFA particles, and in some sections of the monolayer model results for SDS and ragweed. The particle composition regions where there is a large size-dependent effect correspond to the transition regions in terms of CCN activity where it therefore becomes especially important to characterize both the surface tension and partitioning in an explicit and decoupled manner.
When there is a change in the slope of log![[thin space (1/6-em)]](https://www.rsc.org/images/entities/char_2009.gif) ddry − log
ddry − log![[thin space (1/6-em)]](https://www.rsc.org/images/entities/char_2009.gif) Scrit with dry particle composition, the overall balance or relative importance between effects that introduce different size dependencies of Scrit changes as a function of surfactant mass fraction in the particles. Here, specifically the balance of size dependencies in Scrit introduced by surface tension and bulk/surface partitioning changes as the dry particle composition changes. Such changes are seen for SDS particles with the monolayer model as SDS fractions increase beyond 0.25, with the Gibbs model for the very highest surfactant mass fractions, and for NAFA and ragweed pollenkitt in both models, especially for larger organic fractions. The modality of log
Scrit with dry particle composition, the overall balance or relative importance between effects that introduce different size dependencies of Scrit changes as a function of surfactant mass fraction in the particles. Here, specifically the balance of size dependencies in Scrit introduced by surface tension and bulk/surface partitioning changes as the dry particle composition changes. Such changes are seen for SDS particles with the monolayer model as SDS fractions increase beyond 0.25, with the Gibbs model for the very highest surfactant mass fractions, and for NAFA and ragweed pollenkitt in both models, especially for larger organic fractions. The modality of log![[thin space (1/6-em)]](https://www.rsc.org/images/entities/char_2009.gif) ddry − log
ddry − log![[thin space (1/6-em)]](https://www.rsc.org/images/entities/char_2009.gif) Scrit slope change is however very different between the systems and models shown in Fig. 14.
Scrit slope change is however very different between the systems and models shown in Fig. 14.
Fig. 14 shows the effects of multiple processes and process levels. The large differences seen in the behavior of different surface active organic aerosol systems reflect the complex nature and impact of surface activity on droplet properties and cloud activation across particle sizes and compositions. These results underscore the importance of developing a more thorough understanding of atmospheric surfactants and their role in determining organic aerosol CCN activity.
Predictions from the monolayer model are overall more in line with the results of Ruehl et al.9 and Ovadnevaite et al.,10 compared to Gibbs surface thermodynamics. In the latter case, this is not entirely unexpected, since the monolayer model discussed here shares some phenomenological features with that presented by Ovadnevaite et al.,10 although overall the monolayer model has a simpler construction and relies on fewer specific assumptions.27 Both frameworks assume a surface layer with finite thickness. In the monolayer model, the surface thickness is predicted from solution mixing properties, while Ovadnevaite et al.10 used an assumption based on organic C–C bond lengths, similar to that used by Prisle et al.70 and Walz et al.80,81 Both models evaluate the aqueous droplet surface tension as an average of individual compound surface tensions weighted according to volume fractions. The monolayer model furthermore accounts for the effect of dissociated salts on surface tension. A major difference between the two frameworks is that molecules in the surface layer are considered by Ovadnevaite et al.10 to form patches of two fully separated phases, while a single mixed phase is assumed in the monolayer model framework.
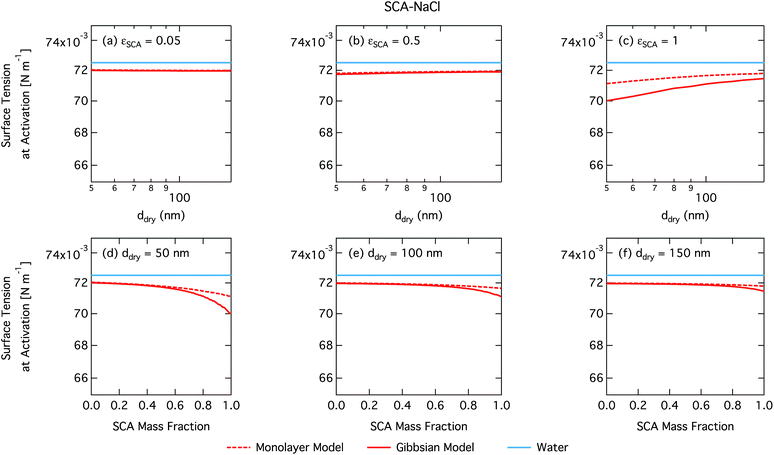
On the other hand, the monolayer model is more versatile than the approach presented by Prisle et al.6 or the compressed film model of Ruehl et al.,9 which both assume complete phase separation of organic- and water-rich phases. Ruehl et al.9 report in their Table S2† an average droplet wet diameter at activation of 1.8 ± 0.15 μm for 150 nm dry particles consisting of a 50 nm ammonium sulphate core with a succinic acid shell. Assuming densities of 1.56 and 1.77 g cm−3 for SCA and AS, respectively, these dry particles have an SCA mass fraction of 0.96. From Fig. S4† of Ruehl et al.,9 droplets at activation have surface tensions modeled from their Szyszkowski and compressed film models of 64.7 and 71.2 mN m−1, respectively. For a 150 nm SCA–NaCl dry particle with a SCA mass fraction of 0.96, the Gibbs and monolayer models of this work predict critical droplet surface tensions of 71.6 and 71.2 mN m−1, respectively. Therefore – keeping in mind that the salts are different between the particle mixtures in each work – the small change in critical droplet surface tension for SCA–NaCl particles in this work is overall consistent with the results of Ruehl et al.9
When considering various recently proposed approaches to model surface–bulk partitioning and CCN activation,27 the monolayer model provides a viable and physically transparent alternative to both the more simplified and more complex approaches, including Gibbs models.
4 Conclusions
The monolayer droplet model of Malila and Prisle27 was successfully used to predict the bulk/surface partitioning, surface composition, and surface thickness of aqueous droplets comprising several surface active organic aerosol model systems. Combined with equilibrium Köhler theory, the CCN activity of these surface active model aerosol systems was calculated for a range of dry particle sizes and surface active organic mass fractions, using both the monolayer model and a traditional Gibbs surface framework.Underpinning the CCN activity of surface active aerosols in the two models is an interplay of several mechanisms, including species and droplet mixing state-dependent surface partitioning, surface tension reduction, dilution, and changing surface/bulk volume ratios of aqueous droplets as they grow and are activated. This makes it complicated to unequivocally establish conditions for which surfactant effects on cloud droplet activation thermodynamics are significant or not.
The monolayer model predicts CCN activity comparable to that of the Gibbs model despite having a conceptually different representation of droplet surface thermodynamics and requiring fewer component- and composition-specific inputs. Overall, droplets are predicted to be activated at lower critical supersaturations, meaning the surface active aerosols are predicted to be more CCN active with the monolayer model. Due to the physical limitations on surface partitioning imposed by the finite surface volume and component densities in the monolayer model, droplet bulk concentrations at activation are predicted to be higher and may even exceed the critical micelle concentration, something which is typically not seen for predictions from the Gibbs models. A comprehensive evaluation of micelle effects in activating droplets will however require a fully thermodynamically consistent extension of the current framework.
The CCN activity predicted by the two droplet models was compared to measurement data where possible. The measured CCN activity of particles comprising the stronger surfactants SDS and NAFA more closely matched the Gibbs model results, whereas measurements for poplar and ragweed pollenkitt fell in between the predictions of the two models. For SCA particles, the models each match one set of measurements in the literature.
The overall good performance of the monolayer model for complex NAFA and pollenkitt particles demonstrates one of the major advantages of the monolayer model over the Gibbs models. Being self-contained and requiring no specific mixing properties in terms of aqueous activity coefficients, the monolayer model is much more readily applicable for complex atmospherically relevant systems where compound and composition-specific data are not available.
Conflicts of interest
There are no conflicts to declare.Acknowledgements
This project has received funding from the European Research Council (ERC) under the European Union's Horizon 2020 research and innovation programme, Project SURFACE (Grant Agreement No. 717022). The authors also gratefully acknowledge the financial contribution from the Academy of Finland, including Grant No. 308238, 314175, and 290145.Notes and references
- Z. Li, A. Williams and M. Rood, Influence of Soluble Surfactant Properties on the Activation of Aerosol Particles Containing Inorganic Solute, J. Atmos. Sci., 1998, 55, 1859–1866 CrossRef.
- M. Facchini, M. Mircea, S. Fuzzi and R. Charlson, Cloud Albedo Enhancement by Surface-Active Organic Solutes in Growing Droplets, Nature, 1999, 401, 257–259 CrossRef CAS.
- R. Sorjamaa, B. Svenningsson, T. Raatikainen, S. Henning, M. Bilde and A. Laaksonen, The Role of Surfactants in Köhler Theory Reconsidered, Atmos. Chem. Phys., 2004, 4, 2107–2117 CrossRef CAS.
- N. L. Prisle, T. Raatikainen, R. Sorjamaa, B. Svenningsson, A. Laaksonen and M. Bilde, Surfactant partitioning in cloud droplet activation: a study of C8, C10, C12 and C14 normal fatty acid sodium salts, Tellus, 2008, 60B, 416–431 CrossRef CAS.
- N. L. Prisle, T. Raatikainen, A. Laaksonen and M. Bilde, Surfactants in cloud droplet activation: mixed organic-inorganic particles, Atmos. Chem. Phys., 2010, 10, 5663–5683 CrossRef CAS.
- N. L. Prisle, M. Dal Maso and H. Kokkola, A simple representation of surface active organic aerosol in cloud droplet formation, Atmos. Chem. Phys., 2011, 11, 4073–4083 CrossRef CAS.
- B. Noziere, C. Baduel and J.-L. Jaffrezo, The dynamic surface tension of atmospheric aerosol surfactants reveals new aspects of cloud activation, Nat. Commun., 2014, 5, 1–7 CrossRef PubMed.
- S. S. Petters and M. D. Petters, Surfactant effect on cloud condensation nuclei for two-component internally mixed aerosols, J. Geophys. Res.: Atmos., 2016, 121, 1878–1895 CAS.
- C. R. Ruehl, J. F. Davies and K. R. Wilson, An interfacial mechanism for cloud droplet formation on organic aerosols, Science, 2016, 351, 1447–1450 CrossRef CAS PubMed.
- J. Ovadnevaite, A. Zuend, A. Laaksonen, K. J. Sanchez, G. Roberts, D. Ceburnis, S. Decesari, M. Rinaldi, N. Hodas, M. C. Facchini, J. H. Seinfeld and C. O' Dowd, Surface tension prevails over solute effect in organic-influenced cloud droplet activation, Nature, 2017, 546, 637–641 CrossRef CAS PubMed.
- S. D. Forestieri, S. M. Staudt, T. M. Kuborn, K. Faber, C. R. Ruehl, T. H. Bertram and C. D. Cappa, Establishing the impact of model surfactants on cloud condensation nuclei activity of sea spray aerosol mimics, Atmos. Chem. Phys., 2018, 18, 10985–11005 CrossRef CAS.
- N. L. Prisle, J. J. Lin, S. K. Purdue, H. Lin, J. C. Meredith and A. Nenes, CCN activity of six pollenkitts and the influence of their surface activity, Atmospheric Chemistry and Physics Discussions, 2018, 2018, 1–26 Search PubMed.
- N. L. Prisle and B. Molgaard, Modeling CCN activity of chemically unresolved model HULIS, including surface tension, non-ideality, and surface partitioning, Atmospheric Chemistry and Physics Discussions, 2018, 2018, 1–23 Search PubMed.
- T. B. Kristensen, N. L. Prisle and M. Bilde, Cloud droplet activation of mixed model HULIS and NaCl particles: Experimental results and κ-Köhler theory, Atmos. Res., 2014, 137, 167–175 CrossRef CAS.
- A. M. K. Hansen, J. Hong, T. Raatikainen, K. Kristensen, A. Ylisirniö, A. Virtanen, T. Petäjä, M. Glasius and N. L. Prisle, Hygroscopic properties and cloud condensation nuclei activation of limonene-derived organosulfates and their mixtures with ammonium sulfate, Atmos. Chem. Phys., 2015, 15, 14071–14089 CrossRef CAS.
- N. L. Prisle, A. Asmi, D. Topping, A.-I. Partanen, S. Romakkaniemi, M. Dal Maso, M. Kulmala, A. Laaksonen, K. E. J. Lehtinen, G. McFiggans and H. Kokkola, Surfactant effects in global simulations of cloud droplet activation, Geophys. Res. Lett., 2012, 39, L05802 CrossRef.
- D. Topping, An analytical solution to calculate bulk mole fractions for any number of components in aerosol droplets after considering partitioning to a surface layer, Geosci. Model Dev., 2010, 3, 635–642 CrossRef.
- T. Raatikainen and A. Laaksonen, A simplified treatment of surfactant effects on cloud drop activation, Geosci. Model Dev., 2011, 4, 107–116 CrossRef.
- M. J. Rood and A. L. Williams, J. Atmos. Sci., 2001, 58, 1468–1473 CrossRef.
- M. Petters and S. Kreidenweis, A single parameter representation of hygroscopic growth and cloud condensation nucleus activity–Part 3: Including surfactant partitioning, Atmos. Chem. Phys., 2013, 13, 1081–1091 CrossRef.
- M. Shulman, M. Jacobson, R. Charlson, R. Synovec and T. Young, Dissolution Behavior and Surface Tension Effects of Organic Compounds in Nucleating Cloud Droplets, Geophys. Res. Lett., 1996, 23, 277–280 CrossRef CAS.
- M. Hori, S. Ohta, N. Murao and S. Yamagata, Activation capability of water soluble organic substances as CCN, J. Aerosol Sci., 2003, 34, 419–448 CrossRef CAS.
- E. Aumann, L. Hildemann and A. Tabazadeh, Measuring and modeling the composition and temperature-dependence of surface tension for organic solutions, Atmos. Environ., 1967, 44, 329–337 CrossRef.
- S. Ekström, B. Nozière, M. Hultberg, T. Alsberg, J. Magnér, E. D. Nilsson and P. Artaxo, A possible role of ground-based microorganisms on cloud formation in the atmosphere, Biogeosciences, 2010, 7, 387–394 CrossRef.
- A. M. K. Hansen, J. Hong, T. Raatikainen, K. Kristensen, A. Ylisirniö, A. Virtanen, T. Petäjä, M. Glasius and N. L. Prisle, Hygroscopic properties and cloud condensation nuclei activation of limonene-derived organosulfates and their mixtures with ammonium sulfate, Atmos. Chem. Phys., 2015, 15, 14071–14089 CrossRef CAS.
- C. R. Ruehl and K. R. Wilson, Surface organic monolayers control the hygroscopic growth of submicrometer particles at high relative humidity, J. Phys. Chem. A, 2014, 118, 3952–3966 CrossRef CAS PubMed.
- J. Malila and N. L. Prisle, A monolayer partitioning scheme for droplets of surfactant solutions, J. Adv. Model. Earth Sy. Search PubMed , submitted..
- H. Köhler, The Nucleus in and the Growth of Hygroscopic Droplets, Trans. Faraday Soc., 1936, 32, 1152–1161 RSC.
- J. Vanhanen, A.-P. Hyvärinen, T. Anttila, T. Raatikainen, Y. Viisanen and H. Lihavainen, Ternary solution of sodium chloride, succinic acid and water; surface tension and its influence on cloud droplet activation, Atmos. Chem. Phys., 2008, 8, 4595–4604 CrossRef CAS.
- A. Laaksonen and M. Kulmala, An explicit cluster model for binary nuclei in water–alcohol systems, J. Chem. Phys., 1991, 95, 6745–6748 CrossRef CAS.
- M. Salonen, J. Malila, I. Napari and A. Laaksonen, Evaluation of surface composition of surface active water–alcohol type mixtures: a comparison of empirical models, J. Phys. Chem. B, 2005, 109, 3472–3479 CrossRef CAS PubMed.
- S. S. Petters and M. D. Petters, Surfactant effect on cloud condensation nuclei for two-component internally mixed aerosols, J. Geophys. Res.: Atmos., 2016, 121, 1878–1895 CAS.
- G. Ganbavale, A. Zuend, C. Marcolli and T. Peter, Improved AIOMFAC model parameterisation of the temperature dependence of activity coefficients for aqueous organic mixtures, Atmos. Chem. Phys., 2015, 15, 447–493 CrossRef.
- S. L. Clegg and J. H. Seinfeld, Thermodynamic Models of Aqueous Solutions Containing Inorganic Electrolytes and Dicarboxylic Acids at 298.15 K. 2. Systems Including Dissociation Equilibria, J. Phys. Chem. A, 2006, 110, 5718–5734 CrossRef CAS PubMed.
- C. Cai, D. J. Stewart, J. P. Reid, Y.-H. Zhang, P. Ohm, C. S. Dutcher and S. L. Clegg, Organic Component Vapor Pressures and Hygroscopicities of Aqueous Aerosol Measured by Optical Tweezers, J. Phys. Chem. A, 2015, 119, 704–718 CrossRef CAS PubMed.
- E. Dinar, I. Taraniuk, E. R. Graber, S. Katsman, T. Moise, T. Anttila, T. F. Mentel and Y. Rudich, Cloud Condensation Nuclei properties of model and atmospheric HULIS, Atmos. Chem. Phys., 2006, 6, 2465–2481 CrossRef CAS.
- E. R. Graber and Y. Rudich, Atmospheric HULIS: How humic-like are they? A comprehensive and critical review, Atmos. Chem. Phys., 2006, 6, 729–753 CrossRef CAS.
- T. Feczko, H. Puxbaum, A. Kasper-Giebl, M. Handler, A. Limbeck, A. Gelencsér, C. Pio, S. Preunkert and M. Legrand, Determination of water and alkaline extractable atmospheric humic-like substances with the TU Vienna HULIS analyzer in samples from six background sites in Europe, J. Geophys. Res., 2007, 112, D23S10 CrossRef.
- Z. Krivácsy, G. Kiss, D. Ceburnis, G. Jennings, W. Maenhaut, I. Salma and D. Shooter, Study of water-soluble atmospheric humic matter in urban and marine environments, Atmos. Res., 2008, 87, 1–12 CrossRef.
- I. Salma, T. Mészáros, W. Maenhaut, E. Vass and Z. Majer, Chirality and the origin of atmospheric humic-like substances, Atmos. Chem. Phys., 2010, 10, 1315–1327 CrossRef CAS.
- T. B. Kristensen, H. Wex, B. Nekat, J. K. Nøjgaard, D. van Pinxteren, D. H. Lowenthal, L. R. Mazzoleni, K. Dieckmann, C. Bender Koch, T. F. Mentel, H. Herrmann, A. Gannet Hallar, F. Stratmann and M. Bilde, Hygroscopic growth and CCN activity of HULIS from different environments, J. Geophys. Res., 2012, 117, D22203 CrossRef.
- G. Kiss, E. Tombacz and H.-C. Hansson, Surface Tension Effects of Humic-Like Substances in the Aqueous Extract of Tropospheric Fine Aerosol, J. Atmos. Chem., 2005, 50, 279–294 CrossRef CAS.
- I. Salma, R. Ocskay, I. Varga and W. Maenhaut, Surface tension of atmospheric humic-like substances in connection with relaxation, dilution, and solution pH, J. Geophys. Res., 2006, 111, D23205 CrossRef.
- I. Taraniuk, E. R. Graber, A. Kostinski and Y. Rudich, Surfactant properties of atmospheric and model humic-like substances (HULIS), Geophys. Res. Lett., 2007, 34, L16807 CrossRef.
- H. A. Khwaja, Atmospheric concentrations of carboxylic acids and related compounds at a semiurban site, Atmos. Environ., 1995, 29, 127–139 CrossRef CAS.
- S. Decesari, M. C. Facchini, S. Fuzzi and E. Tagliavini, Characterization of water-soluble organic compounds in atmospheric aerosol: A new approach, J. Geophys. Res., 2000, 105, 1481–1489 CrossRef CAS.
- S. Decesari, M. C. Facchini, E. Matta, F. Lettini, M. Mircea, S. Fuzzi, E. Tagliavini and J. P. Putaud, Chemical features and seasonal variation of fine aerosol water-soluble organic compounds in the Po Valley, Italy, Atmos. Environ., 2001, 35, 3691–3699 CrossRef CAS.
- L. M. Russell, S. F. Maria and S. C. B. Myneni, Mapping organic coatings on atmospheric particles, Geophys. Res. Lett., 2002, 29, 26-1–26-4 CrossRef.
- B. R. T. Simoneit, M. Kobayashi, M. Mochida, K. Kawamura and B. J. Huebert, Aerosol particles collected on aircraft flights over the northwestern Pacific region during the ACE-Asia campaign: Composition and major sources of the organic compounds, J. Geophys. Res.: Atmos., 2004, 109, D19S09 Search PubMed.
- M. Legrand, S. Preunkert, C. Galy-Lacaux, C. Liousse and D. Wagenbach, Atmospheric year-round records of dicarboxylic acids and sulfate at three French sites located between 630 and 4360 m elevation, J. Geophys. Res., 2005, 110(14), 459–511 Search PubMed.
- J. Jung, B. Tsatsral, Y. J. Kim and K. Kawamura, Organic and inorganic aerosol compositions in Ulaanbaatar, Mongolia, during the cold winter of 2007 to 2008: Dicarboxylic acids, ketocarboxylic acids, and α-dicarbonyls, J. Geophys. Res., 2010, 115, D22203 CrossRef.
- F. D. Pope, Pollen grains are efficient cloud condensation nuclei, Environ. Res. Lett., 2010, 5, 044015 CrossRef CAS.
- P. T. Griffiths, J. S. Borlace, P. J. Gallimore, M. Kalberer, M. Herzog and F. D. Pope, Hygroscopic growth and cloud activation of pollen: a laboratory and modelling study, Atmos. Sci. Lett., 2012, 13, 289–295 CrossRef.
- A. L. Steiner, S. D. Brooks, C. Deng, D. C. Thornton, M. W. Pendleton and V. Bryant, Pollen as atmospheric cloud condensation nuclei, Geophys. Res. Lett., 2015, 3596–3602 CrossRef CAS.
- F. Knoll, Über Pollenkitt und Bestäubungsart, Z. Bot., 1930, 23, 609–675 Search PubMed.
- E. Pacini and M. Hesse, Pollenkitt - its composition, forms and functions, Flora, 2005, 200(5), 399–415 CrossRef.
- A. M. Rowe and J. C. S. Chou, Pressure-volume-temperature-concentration relation of aqueous NaCl solution, J. Chem. Eng. Data, 1970, 15, 61–66 CrossRef CAS.
- I. N. Tang and H. R. Munkelwitz, Water activities, densities, and refractive indices of aqueous sulfates and sodium nitrate droplets of atmospheric importance, J. Geophys. Res.: Atmos., 1994, 99, 18801–18808 CrossRef.
- C. E. Corrigan and T. Novakov, Cloud condensation nucleus activity of organic compounds: a laboratory study, Atmos. Environ., 1999, 33, 2661–2668 CrossRef CAS.
- T. A. Rissman, V. Varutbangkul, J. D. Surratt, D. O. Topping, G. McFiggans, R. C. Flagan and J. H. Seinfeld, Cloud condensation nucleus (CCN) behavior of organic aerosol particles generated by atomization of water and methanol solutions, Atmos. Chem. Phys., 2007, 7, 2949–2971 CrossRef CAS.
- M. Bilde and B. Svenningsson, CCN Activation of Slightly Soluble Organics: The Importance of Small Amounts of Inorganic Salt and Particle Phase, Tellus, 2004, 56B, 128–134 CrossRef CAS.
- S. Henning, T. Rosenørn, B. D'Anna, A. Gola, B. Svenningsson and M. Bilde, Cloud Droplet Activation and Surface Tension of Mixtures of Slightly Soluble Organics and Inorganic Salt, Atmos. Chem. Phys., 2005, 5, 575–582 CrossRef CAS.
- B. Svenningsson, J. Rissler, E. Swietlicki, M. Mircea, M. Bilde, M. C. Facchini, S. Decesari, S. Fuzzi, J. Zhou, J. Mønster and T. Rosenørn, Hygroscopic growth and critical supersaturations for mixed aerosol particles of inorganic and organic compounds of atmospheric relevance, Atmos. Chem. Phys., 2006, 6, 1937–1952 CrossRef CAS.
- A. Prenni, P. DeMott, S. Kreidenweis, D. Sherman, L. Russel and Y. Ming, The Effects of Low Molecular Weight Dicarboxylic Acids on Cloud Formation, J. Phys. Chem. A, 2001, 105, 11240–11248 CrossRef CAS.
- K. Broekhuizen, P. P. Kumar and J. P. D. Abbatt, Partially soluble organics as cloud condensation nuclei: Role of trace soluble and surface active species, Geophys. Res. Lett., 2004, 31, L01107 CrossRef.
- K. Hartz, J. Tischuk, M. Chan, C. Chan, N. Donahue and S. Pandis, Cloud Condensation Nuclei Activation of Monoterpene and Sesquiterpene Secondary Organic Aerosol, Atmos. Environ., 2006, 40, 605–617 CrossRef.
- M. B. Altaf, D. D. Dutcher, T. M. Raymond and M. A. Freedman, Effect of particle morphology on cloud condensation nuclei activity, ACS Earth Space Chem., 2018, 2, 634–639 CrossRef CAS.
- A.-P. Hyvärinen, H. Lihavainen, A. Gaman, L. Vairila, H. Ojala, M. Kulmala and Y. Viisanen, Surface Tensions and Densities of Oxalic, Malonic, Succinic, Maleic, Malic, and cis-Pinonic Acids, J. Chem. Eng. Data, 2006, 51, 255–260 CrossRef.
- J. H. Seinfeld and S. N. Pandis, Atmospheric Chemistry and Physics -From Air Pollution to Climate Change, John Wiley and Sons, Inc., 2nd edn, 2006 Search PubMed.
- N. L. Prisle, N. Ottosson, G. Öhrwall, J. Söderström, M. D. Maso and O. Björneholm, Surface/bulk partitioning and acid/base speciation of aqueous decanoate: direct observations and atmospheric implications, Atmos. Chem. Phys., 2012, 12, 12227–12242 CrossRef CAS.
- G. Öhrwall, N. L. Prisle, N. Ottosson, J. Werner, V. Ekholm, M.-M. Walz and O. Björneholm, Acid–Base Speciation of Carboxylate Ions in the Surface Region of Aqueous Solutions in the Presence of Ammonium and Aminium Ions, J. Phys. Chem. B, 2015, 119, 4033–4040 CrossRef PubMed.
- M. D. Petters, S. R. Suda and S. I. Christensen, The role of dynamic surface tension in cloud droplet activation, AIP Conf. Proc., 2013, 1527, 801–807 CrossRef CAS.
- K. A. Thorn, D. W. Folan and P. MacCarthy, Characterization of the International Humic Substances Society standard and reference fulvic and humic acids by solution state carbon-13 (13C) and hydrogen-1 (1H) nuclear magnetic resonance spectrometry, U.S. Geological Survey Technical Report 89-4196, U.S. Dept. of the Interior, 1989 Search PubMed.
- G. Riise and B. Salbu, Major and trace elements in standard and reference samples of aquatic humic substances determined by instrumental neutron activation analysis (INAA), Sci. Total Environ., 1989, 81–82, 137–142 CrossRef.
- J. Peuravuori and K. Pihlaja, Multi-method characterization of lake aquatic humic matter isolated with two different sorbing solids, Anal. Chim. Acta, 1998, 363, 235–247 CrossRef CAS.
- H. E. M. Dobson, J. Bergström, G. Bergström and I. Groth, Pollen and flower volatiles in two Rosa species, Phytochemistry, 1987, 26(12), 3171–3173 CrossRef CAS.
- H. E. M. Dobson, Survey of Pollen and Pollenkitt Lipids - Chemical Cues to Flower Visitors, Am. J. Bot., 1988, 75(2), 170–182 CrossRef CAS.
- P. Piffanelli, J. H. E. Ross and D. J. Murphy, Biogenesis and function of the lipidic structures of pollen grains, Sex. Plant Reprod., 1998, 11(2), 65–80 CrossRef CAS.
- J. Mäkelä and P. Manninen, Molecular size distribution and structure investigations of humic substances in groundwater, Posiva Oy working report 2008-36, 2008 Search PubMed.
- M.-M. Walz, C. Caleman, J. Werner, V. Ekholm, D. Lundberg, N. L. Prisle, G. Ohrwall and O. Bjorneholm, Surface behavior of amphiphiles in aqueous solution: a comparison between different pentanol isomers, Phys. Chem. Chem. Phys., 2015, 17, 14036–14044 RSC.
- M.-M. Walz, J. Werner, V. Ekholm, N. L. Prisle, G. Ohrwall and O. Bjorneholm, Alcohols at the aqueous surface: chain length and isomer effects, Phys. Chem. Chem. Phys., 2016, 18, 6648–6656 RSC.
Footnote |
| † Electronic supplementary information (ESI) available. See DOI: 10.1039/c8em00345a |
| This journal is © The Royal Society of Chemistry 2018 |


