
 Open Access Article
 This Open Access Article is licensed under a
 Creative Commons Attribution 3.0 Unported Licence
Integrated multi-material portable 3D-printed platform for electrochemical detection of dopamine and glucose†
Roger
Domingo-Roca
 *a,
Alexander R.
Macdonald
a,
Stuart
Hannah
a and
Damion K.
Corrigan
b
*a,
Alexander R.
Macdonald
a,
Stuart
Hannah
a and
Damion K.
Corrigan
b
aDepartment of Biomedical Engineering, Wolfson Centre, University of Strathclyde, 106 Rottenrow East, G0 4NW, Glasgow, UK. E-mail: roger.domingo-roca@strath.ac.uk
bDepartment of Pure & Applied Chemistry, University of Strathclyde, 295 Cathedral Street, G1 1BX, Glasgow, UK
First published on 16th September 2022
Abstract
3D-printing has become a fundamental part of research in many areas of investigation since it provides rapid and personalized production of parts that meet very specific user needs. Biosensing is not an exception, and production of electrochemical sensors that can detect a variety of redox mediators and biologically relevant molecules has been widely reported. However, most 3D-printed electrochemical sensors detailed in the literature rely on big, individual, single-material electrodes that require large sample volumes to perform effectively. Our work exploits multi-material fused filament fabrication 3D-printing to produce a compact electrochemical sensor able to operate with only 100 μL of sample. We report cyclic voltammetry, differential pulse voltammetry, and chronoamperometry results to assess sensor performance and sensitivity. We investigated the influence of layer print orientation and layer thickness on the electrochemical performance of the sensor, and used the optimal parameters to produce the final device. The integrated 3D-printed platform successfully detects electrochemical activity for hexaammineruthenium(III) chloride and potassium ferricyanide (0.1 mM to 2 mM in 100 mM KCl), dopamine (50 μM to 1 mM in 1×PBS), and glucose via mediated amperometric glucose oxidase enzyme-based sensing (1 mM to 12 mM in 1×PBS), indicating good acceptance of biological modification. These results reveal the exciting potential of multi-material 3D-printing and how it can be used for the rapid development of efficient, small, integrated, personalized electrochemical biosensors.
1. Introduction
3D-printing has revolutionized how electrochemical biosensors are designed and produced. The ability to 3D-print conductive filaments combined with the simplicity and accessibility of additive manufacturing has allowed researchers to exploit fused filament fabrication (FFF) to create highly personalized sensors that meet particular user needs and promise high sensitivities.1–3 Examples can be found across many research areas, from wearable devices for medical use,4–8 to healthcare sensors that help improve lifestyle or habits such as exercise and sleep.9,10 However, several studies have noted that the low conductivity of commercially available carbon black-based polylactic acids (CB-PLA) directly impacts the performance of the sensors.11–14 It is possible to partially overcome this problem via additional filament doping or through chemical and electrochemical post-processing that can enhance the electron transfer kinetics of the final sensor surface.13–16 Additionally, several groups have also investigated how the anisotropy and orientation of the printed layers influence the electrochemical activity of 3D-printed sensors,11,12 as well as there have been multiple works on cleaning and surface activation protocols for optimized electrochemical performance.16–18These 3D-printing advances and optimizations have led several groups to develop novel electrochemical sensors to detect specific analytes. For example, the detection or quantification of commonly used redox species is widely demonstrated, covering both inner- and outer-sphere electron transfer reactions that show sensor performance and surface sensitivity.11,19 Biologically relevant molecules such as glucose or dopamine have also been targeted to directly showcase that FFF has the potential to produce fully personalized biosensors20,21 with sensitivities in the range of 0.01–0.8 μmol L−1 in dopamine22,23 and 2.4–36.4 μmol L−1 for glucose,15,24 and in the case of glucose, ruthenium-based mediators have been employed to ease detection and improve sensitivity.25–29 These 3D-printed biosensors possess a range of limitations that include: (i) their size, with electrodes up to 10 mm in diameter and several millimeters in thickness,8,12 (ii) the associated large sample volumes that these dimensions require,8,12,30–32 and (iii) the restriction of the use of 3D-printing to produce only the working electrode, requiring the use of external counter and reference electrodes that complicate experimental setup and use.8,23,32,33 Several groups have attempted to mitigate these issues by exploiting multi-material FFF 3D-printing, indicating growing interest in the production of an efficient fully-3D-printed platform.11,12,31,34,35
In this work we demonstrate the production of a compact, portable, and efficient electrochemical biosensors that includes three CB-PLA electrodes that can operate in low sample volumes of <100 μL. We take FFF multi-material 3D-printing to the next level, optimizing the 3D-printing parameters and post-processing the sensor surface using an oxygen plasma cleaning and activation protocol. We demonstrate the validity of our sensor by testing both inner- and outer-sphere redox species, detection of dopamine at concentration down to <50 μM, and detection of physiologically relevant glucose levels using through mediated amperometric enzyme-based biosensing.
2. Materials and methods
2.1. Chemicals
18.2 MΩ deionized water from an ELGA LabWater PURELAB Chorus system was used to make all aqueous solutions. Sulfuric acid (H2SO4) was obtained from Fisher Scientific, UK. Hexaammineruthenium(III) chloride ([Ru(NH3)6]Cl3), potassium ferricyanide (K3[Fe(CN)6]), potassium chloride (KCl), dopamine hydrochloride, D-(+)-glucose, gelatin (gel strength 300, type A), glutaraldehyde (GTA), and glucose oxidase from Aspergillus niger (GOx) were all obtained from Merck UK and used without further modification unless otherwise specified. Red and white polylactic acid (PLA) filaments were bought from RAISE3D (CA, USA), and the carbon black PLA filament was obtained from Proto-Pasta (WA, USA) and used as received.2.2. 3D-printing
The electrochemical sensor was 3D-printed using a RAISE3D E2 IDEX Dual 3D printer (nozzle diameter, 0.4 mm). The 3D computer-aided design (CAD) files for the sensors were created using PTC Creo Parametric (Parametric Technology Corporation) and saved as STL files. The individually generated STL files for each sensor component were assembled in ideaMaker (RAISE3D) to create the complete device, and each part was assigned its corresponding printing material. The base and top cover of the sensor were printed with red PLA, and the electrodes, tracks, and connecting pads were all 3D-printed with CB-PLA. Prior to biosensor fabrication, we investigated the influence of layer orientation (0°, 45°, and 90° layer orientation), slice thickness (50 μm and 100 μm), and total electrode thickness (100 μm and 300 μm) on electrochemical performance in 1 mM potassium ferricyanide in 100 mM KCl. These results were used to obtain the 3D-printing parameters used for the final version of the biosensor.Selective slicing was performed as follows: (1) from 0 to 0.4 mm, 200 μm layer thickness, (2) from 0.4 to 0.5 mm, 100 μm layer thickness, (3) from 0.5 to 0.8 mm, 50 μm layer thickness, and (6) from 0.8 to 2.6 mm, 100 μm layer thickness. The heated bed temperature was set to 55 °C, and the temperature of the left (red PLA) and right (CB PLA) extruders was set to 225 °C and 230 °C, respectively. Left and right extruder widths were set to 0.3 and 0.2 mm, respectively. The infill density was 100% with 50% infill overlap and a 100% infill flowrate. Final sensors were 3D-printed using 90 degrees layering and a raft support was added with an offset of 2 mm. Printing speeds were all set to 40 mm s−1 except the first layer speed (15 mm s−1), the X/Y axis movement speed (35 mm s−1), and the Z axis movement speed (15 mm s−1). A wipe wall was used (3 mm offset, 30 degrees angle, and 50 mm s−1). The connector used to take measurements from the sensor consists of 3 parts: bottom, top, and connecting pin, which were 3D-printed using red PLA, except for the connecting pin, that was 3D-printed in white PLA. A gold-plated 3-pin spring-loaded connector was introduced in the top part and soldered to 3 cables to enable electrical contact to each of the 3D-printed electrodes. A spring was used between the top and bottom connector components to apply consistent pressure to the connector and ensure mechanical stability and good electrical connection. A total of 6 connectors and 6 electrodes were 3D-printed. Design details are shown in Fig. S1 and S2 (ESI†).
2.3. Potentiostat and electrochemical measurements
All the electrochemical measurements were performed on a PalmSens PS4 potentiostat (PalmSens, Houten, Netherlands). Cyclic voltammograms (CV) were performed between −1.5 V and 0 V for hexaammineruthenium(III) chloride, −0.6 V and 0.6 V for potassium ferricyanide, −0.4 V and 1.3 V for dopamine, and −1 V and 1 V for the glucose enzyme-based sensor at scan rates of 10 mV s−1, 25 mV s−1, 50 mV s−1 and 100 mV s−1. Differential pulse voltammograms (DPV) were performed across the same range of potentials used for the CVs and at a scan rate of 50 mV s−1. Chronoamperometry (CA) measurements were performed for dopamine and glucose (N = 4) for 200 s and acquiring data every 0.1 s. The DC potential for CA measurements was adjusted for each repeat by using a voltage above the oxidation peak potential to ensure that maximum oxidation was obtained (see Table SI, ESI†).2.4. Electrode surface cleaning
All 3D-printed electrodes were treated with an oxygen plasma cleaning and surface activation protocol prior to use. This was performed by placing them in an O2 plasma cleaner (Zepto Diener, Diener Electronic GmbH, Ebhausen, Germany) and running a standard cleaning protocol with chamber pressure of 0.3 mbar, an O2 flow rate of 0.25 Nl h−1, a power setting of 65% (130 W), and a process time of 1 minute. Following this, an additional electrochemical cleaning process was performed by cycling in 1M sulfuric acid (H2SO4). 10 CV cycles (between −1.5 V and 1 V at 300 mV s−1) and then gently rinsed with deionized water. Details shown in Fig. S3 in the ESI.†2.5. Glucose testing
Mediated enzyme-based biosensor designs were tested to detect and measure glucose. Mediated sensors used a 1 mM hexaammineruthenium(III) chloride as the mediator, which was added to the sample solution before placing it on the sensor. A simple functionalization protocol was used to create the enzyme-based sensor through enzyme entrapment of GOx from Aspergillus niger in a crosslinked gelatin hydrogel on the electrode surface. Briefly, 20 μL of 2.5% v/w gelatin, dissolved and mixed at 40 °C in 1×PBS, were pipetted onto the 3D-printed electrodes and allowed to partially dry under normal atmospheric conditions and at room temperature for 30 minutes. On top of the gelatin layer, 2 μL of 10 U μL−1 GOx enzyme, resuspended in 1×PBS, was pipetted and allowed to partially dry as before. Finally, the third layer of 2 μL of 1% GTA, diluted in 1×PBS from 4% borate buffer stock solution, was pipetted over the enzyme layer. The three layers were left to crosslink for 24 hours prior to use. The electrodes were then gently cleaned with 1×PBS to rinse off any free enzyme and GTA. The electrodes were stored at 4 °C before use.3. Results and discussion
3.1. Influence of 3D-printing parameters
Fig. 1 shows the influence of layer orientation (Fig. 1A), total electrode thickness (Fig. 1B), and layer thickness (Fig. 1C) in the electrochemical performance of the biosensor using 100 μL of 1 mM potassium ferricyanide in 100 mM KCl. The data is detailed in Table 1. We observed that horizontal layer orientation provides better electrochemical outcomes than vertical and diagonal layering by producing higher current peaks, and providing a better defined reduction peak. We also observed that the total thickness of the electrode has a major impact on the electrochemical performance of the sensor, and we hypothesize that there is more electrochemically active material able to interact with the redox couples. Lastly, we measured lower currents at lower layer thickness (using a 300 μm electrode thickness), but better defined peaks, similarly to Abdalla's et al. work.11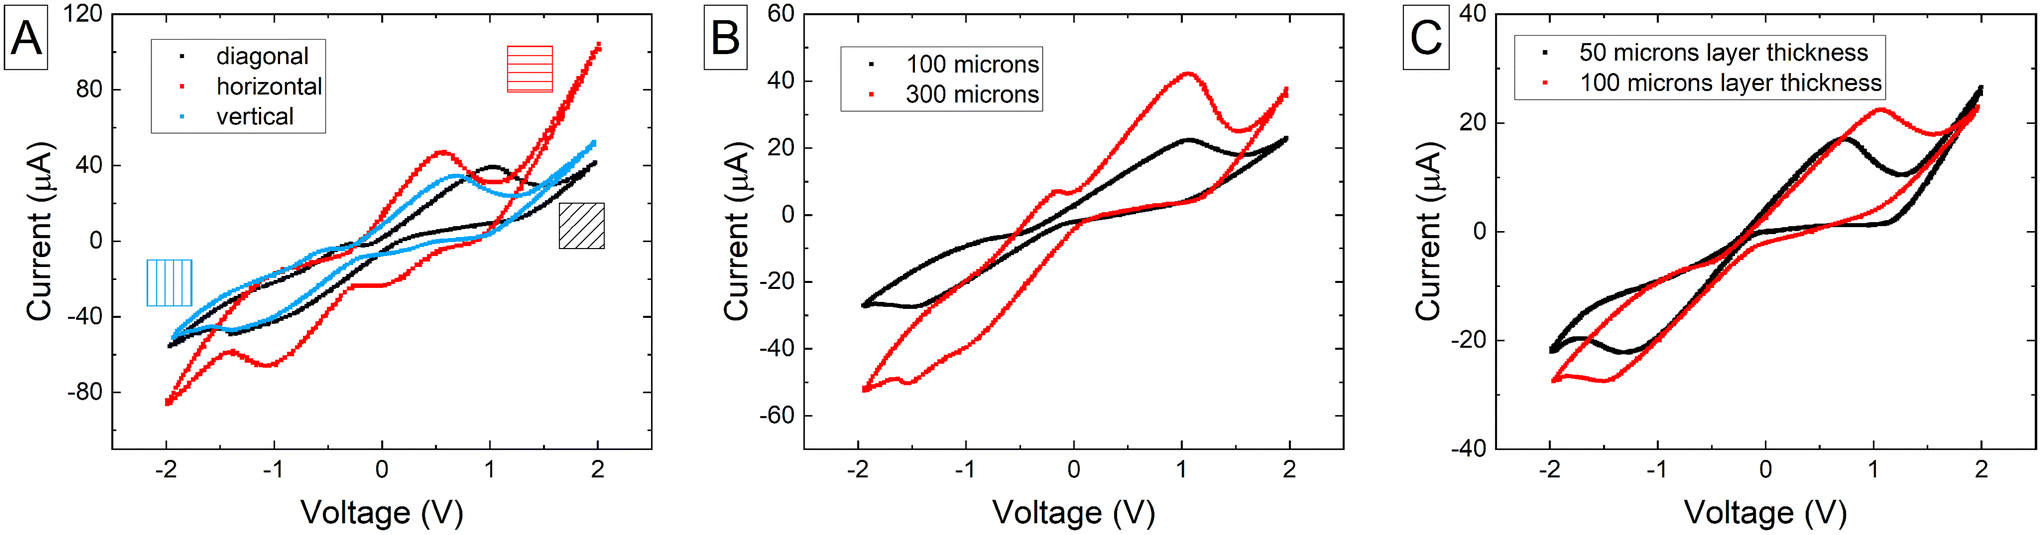 | ||
| Fig. 1 (A) Comparison of cyclic voltametric responses of horizontal (90°), diagonal (45°), and vertical (0°) layer orientation of the 3D-printed electrode. (B) Comparison of cyclic voltammogram responses of electrodes of 100 μm and 300 μm total thickness. (C) Comparison of 300 μm-thick electrodes printed at 50 μm and 100 μm layer thicknesses. All scans performed in 100 μL of 1 mM potassium ferricyanide in 100 mM KCl. | ||
| ΔV (V) | I oxpk (μA) | I redpk (μA) | |
|---|---|---|---|
| Influence of layer orientation | |||
| Horizontal | 2.13 | 35.01 | −47.61 |
| Diagonal | 2.38 | 38.67 | −49.23 |
| Vertical | 1.53 | 45.50 | −63.53 |
| Influence of total electrode thickness | |||
| 100 μm | 2.62 | 22.31 | −27.72 |
| 300 μm | 2.65 | 41.96 | −50.22 |
| Influence of layer thickness in 300 μm-thick electrodes | |||
| 50 μm | 2.014 | 17.073 | −22.18 |
| 100 μm | 2.56 | 22.42 | −27.48 |
3.2. Initial electrochemical characterization
Fig. 2 shows the schematics and a picture of the fully integrated 3D-printed platform, including both the connector and the electrode. The complete sensor consists of three electrodes; a reference electrode (1 mm2 area, 300 μm thickness), a counter electrode (17 mm2, 300 μm thickness), and a working electrode (22.2 mm2 area, 300 μm thickness), all made of CB PLA and 3D-printed simultaneously. Each sensor was tested for electrical shorts between the electrodes following printing and prior to running any experiments. These 3D-printing settings were chosen after careful examination of how layer orientation and layer thickness influence the electrochemical performance of the biosensor.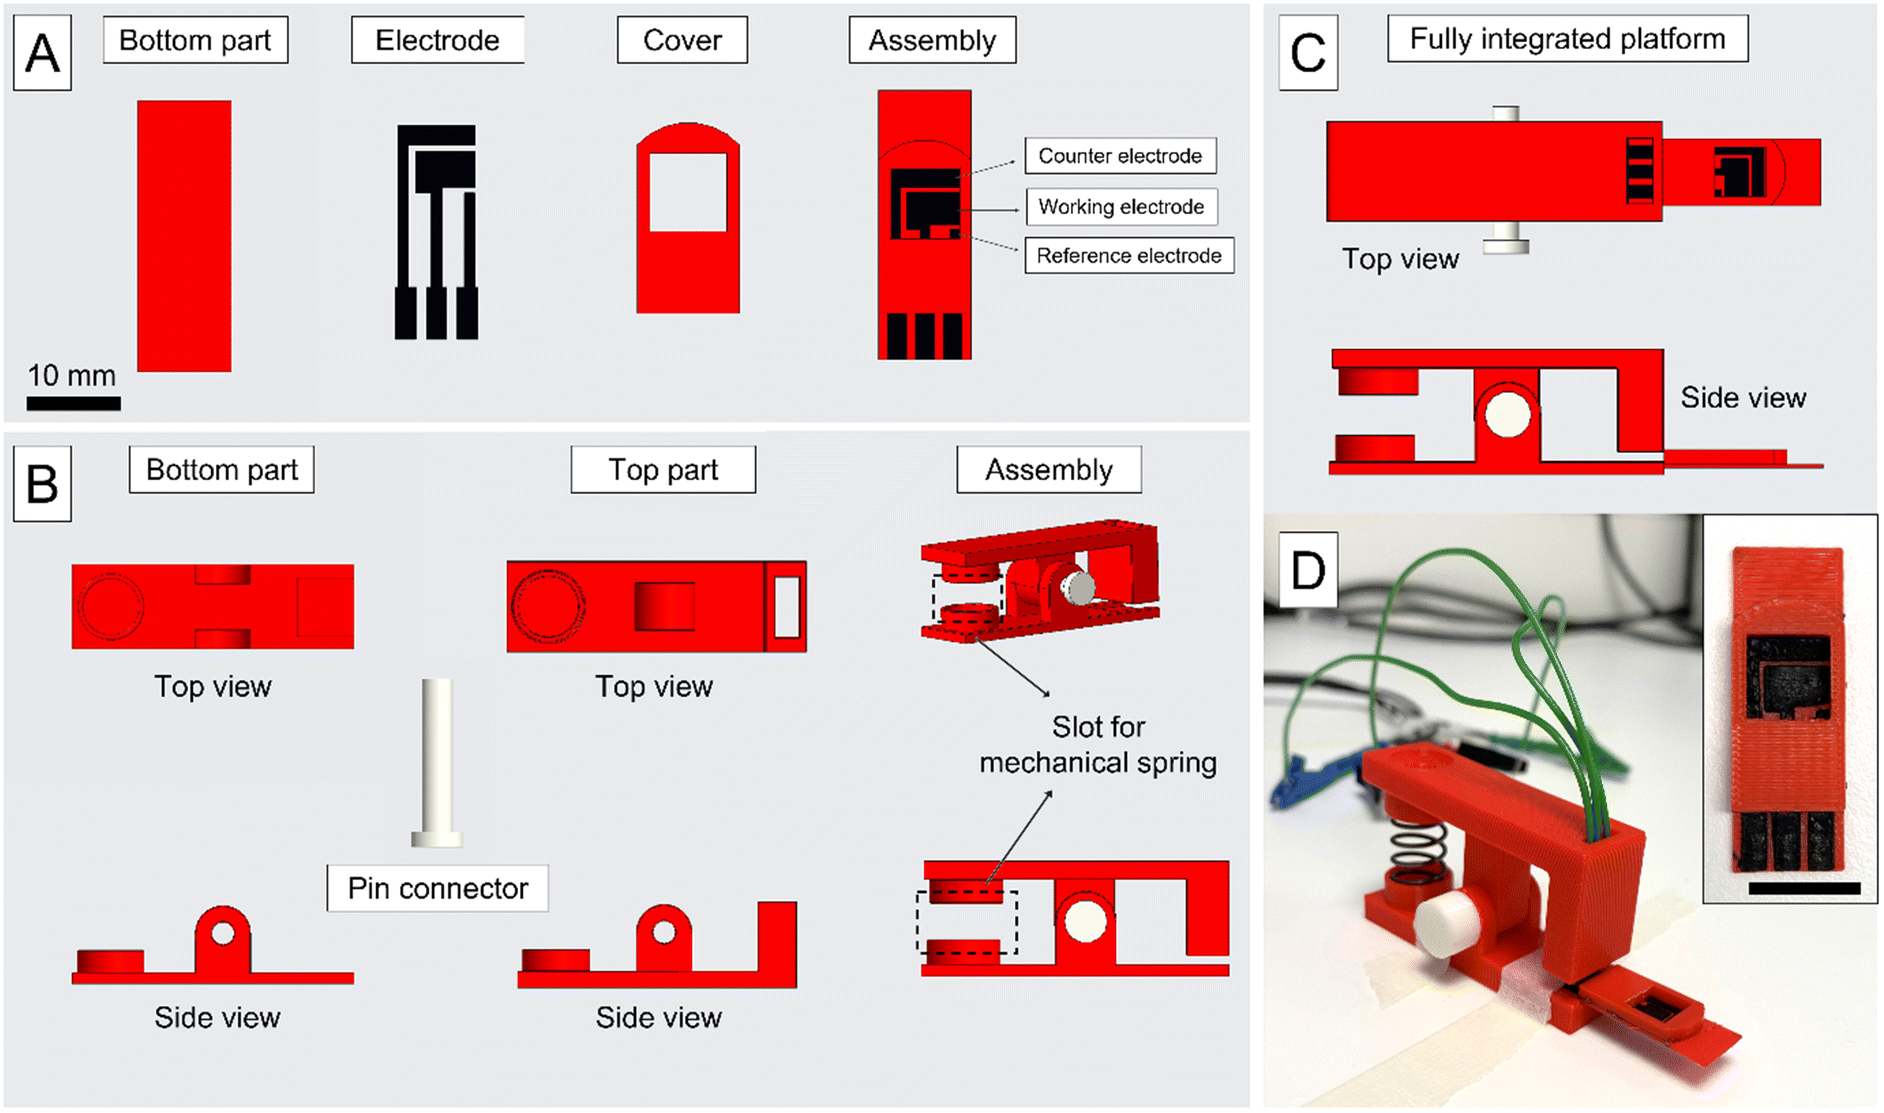 | ||
| Fig. 2 (A) Top view of the individual components of the integrated, multi-material 3D-printed sensor. These include the base, the reference, counter and working electrodes, and the insulating cover, including the integrated well. The complete assembly of the sensor is shown on the right. (B) Top and side views of the 3D-printed connector used to connect the sensor. These include the bottom part with a recessed slot for the sensor base, the top part that holds the spring-loaded electrical connector pins, and a cylindrical joint pin to allow the top to rotate over several degrees for insertion and removal of sensors. A compression spring is used to apply even and consistent pressure to the spring-loaded pins and ensure mechanically rigid clamping of the sensor. The rectangular hole visible on the right of the top partis the location of the spring-loaded connector pins. These are soldered to three individual solid core wires to connect to each electrode's contact pad directly. An example of the complete assembly of the connector is shown on the right. (C) Top and side view of the fully integrated 3D-printed connector and sensor. The minimum volume of a sample required to cover all three electrodes, working, reference, and counter, is 70 μL in this assembly. The detailed dimensions are shown in the ESI.† (D) A complete 3D-printed connector and sensor, including compression spring, spring-loaded contact pins, and wires. Insert shows the top view of the 3D-printed electrode, scale bar: 10 mm. | ||
The electrochemical performance of the 3D-printed electrodes was first tested in a range of concentrations of both hexaammineruthenium(III) chloride and potassium ferricyanide in 100 mM KCl supporting electrolyte. Measurements for each analyte were repeated over four different electrodes to examine process viability. CV and DPV were used to determine: (i) the peak currents of both the oxidation and reduction peaks at each given concentration, (ii) the potential difference between peaks, (iii) the relationship between peak current and scan rate, for both peaks, and (iv) the sensitivity of the sensor.
The results for CV and DPV measurements using either the HexRu or FC redox mediators (0.1 mM in 100 mM KCl) are shown in Fig. 3. Details of other mediator concentrations are reported in the ESI.† The experimentally determined E1/2 for HexRu was −0.72 V, and for FC was −0.21 V. Increasing the CV scan rate over 10, 25, 50, and 100 mV s−1 increases both the peak reduction and oxidation currents as well as the overall capacitance (Fig. 3A and E). The measured reduction current directly reflects the concentration of the oxidized form of the mediator in the bulk solution. The observed oxidation current was lower than the reduction current due to some diffusion of the reduced form away from the electrode before the oxidation potential was reached. Plots of peak current (ip) against the square root of scan rate (υ1/2) are highly linear at slower scan rates (Fig. 3B and F), indicating good reversibility and that the redox species were freely diffusing and not adsorbed on the electrode surface. However, an increase in peak separation (ΔEp) with increasing scan rate was also observed (Fig. 2C and G). The ΔEp is shown to increase more at higher concentrations which indicates slow electron transfer kinetics in the working electrode, most likley resulting from the use of the CB-PLA pseudo reference electrode rather than using a more effective reference electrode such as the standard aqueous Ag/AgCl liquid junction electrode, which could restrict current flow.
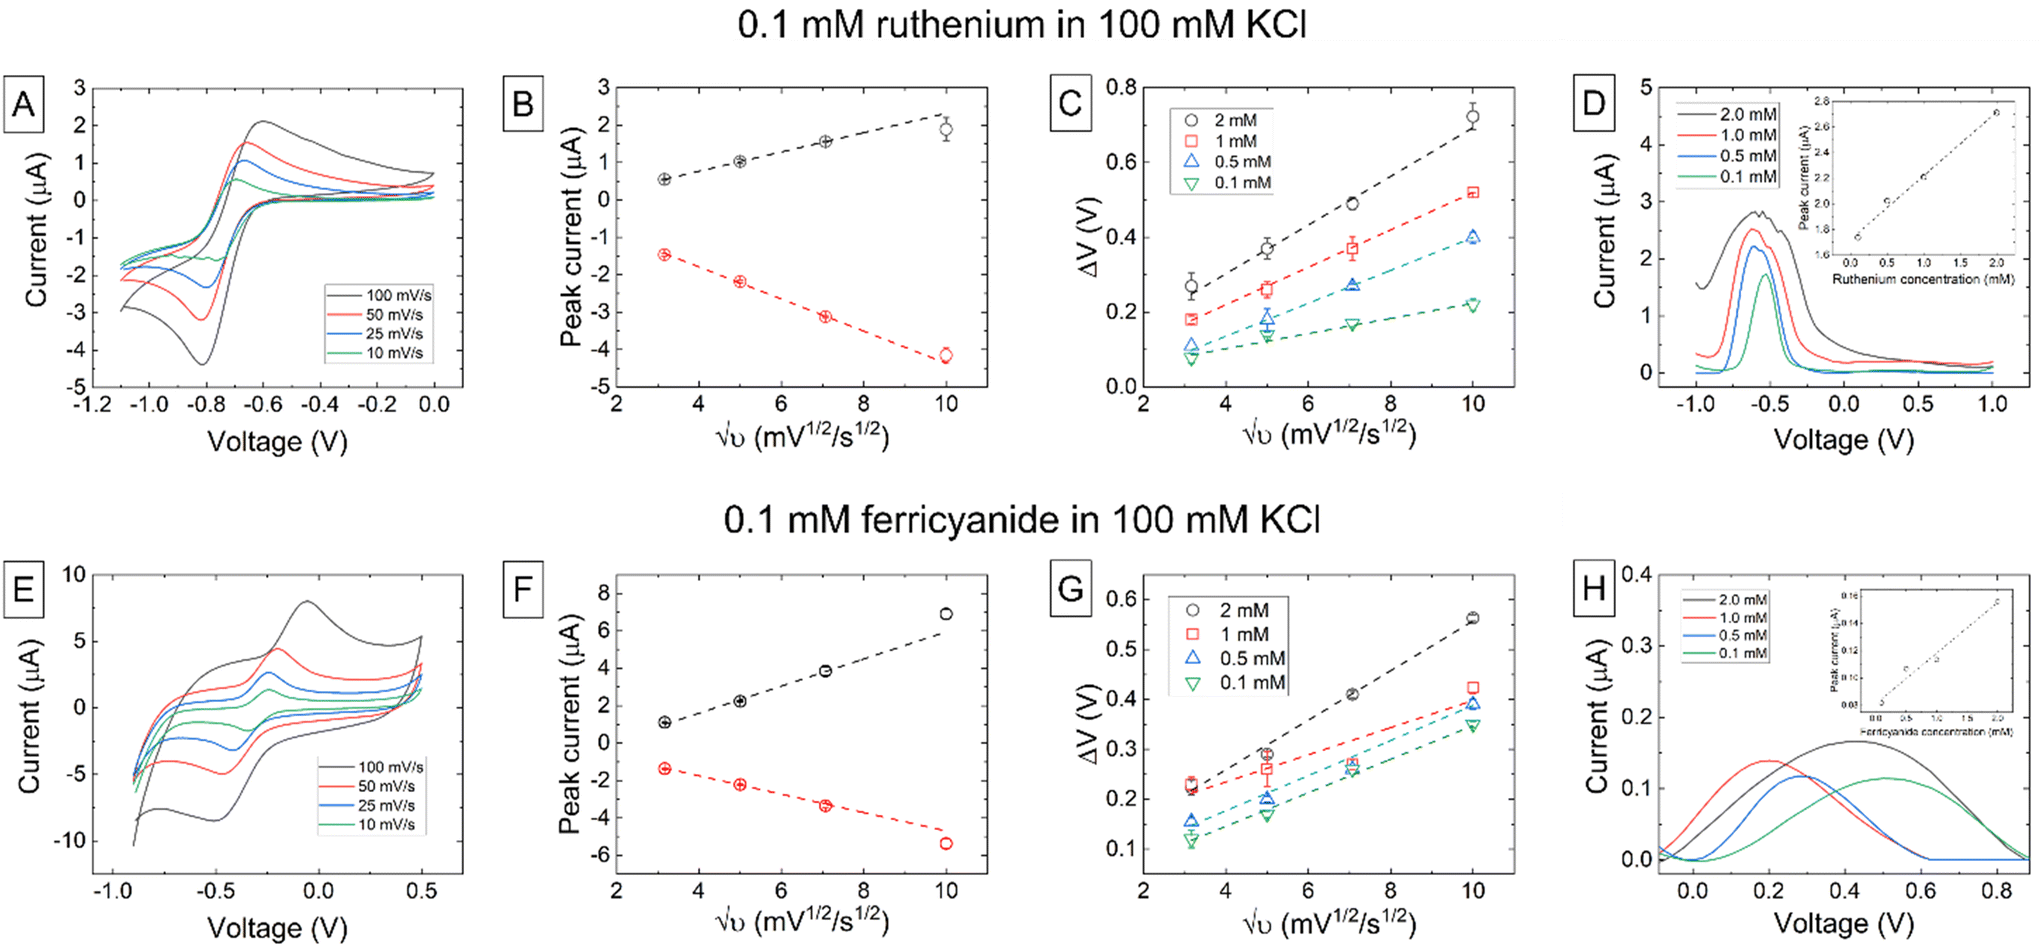 | ||
| Fig. 3 (A) and (E) CV measurements of HexRu and FC, respectively, in 100 mM KCl at increasing scanning rates of 10, 25, 50, and 100 mV s−1. (B) and (F) Oxidation and reduction peak currents against the square root of the scan rate for each mediator. Error bares represent ±s.d. (n = 4). (C) and (G) Potential difference (ΔEp) between oxidation and reduction peaks as a function of both scan rate and concentration for each mediator. Error bars represent ±s.d. (n = 4). (D) and (H) DPV measurements of increasing concentrations for each mediator. Insert plots show DPV peak current as a function of concentration (0.1 mM to 2 mM) and the slope of the linear fit to this data was used to calculate sensitivities for HexRu of (5.33 ± 0.94) × 102 nA mM−1 and for FC of (2.91 ± 0.31) × 101 nA mM−1 (±s.e.). | ||
The differences in behavior observed between HexRu and FC are likely to be due to the less surface sensitive outer-sphere electron transfer process of HexRu as opposed to the inner-sphere electron transfer process of FC that has been shown to be highly surface sensitive. Furthermore, this difference hints that the electrode surface may need further analysis and optimization to fully characterize parameters such as the charge, hydrophobicity, and exposed functional groups. The morphological irregularities, shown in the ESI,† are attributed to two main factors: (i) the 3D-printing process itself, which includes the uncontrolled melting and re-solidification of a thermoplastic-based material, leading to nonuniform filler distribution and directly affecting conductivity paths, and (ii) the anisotropic plasma cleaning process that etches certain materials and edge features over others. Fig. 3D and 2H show the DPV measurement data for each redox mediator over a range of concentrations in 100 mM KCl, and the inset shows the linear relationship between the peak current and concentration. The slope of the linear fit to this data was used to calculate a sensitivity of (4.92 ± 0.32) × 102 nA mM−1 and a sensitivity of (3.71 ± 0.46) × 101 nA mM−1 (±s.e.) at −0.525 V and 0.326 V, respectively.
The success of this initial testing using low sample volumes led us to test the performance of the 3D-printed sensors for the detection of dopamine and glucose.
3.3. Dopamine detection
CV measurements of 0.25 mM dopamine in 1×PBS at increasing scan rates are shown in Fig. 4A. Details on higher dopamine concentrations are shown in the ESI.† An oxidation current is visible at each scan rate however at lower scan rates this is a steady state current (iss) and at higher scan rates this becomes a peak current (ipk) indicating that the electrode is behaving as a microelectrode or an array of microelectrodes. This can be explained by the fact that the electrode surface is a carbon composite with areas of conductive carbon black interspersed between the PLA binder. At faster scan rates a reduction peak is also visible as there is a partial reduction of the oxidized dopamine-o-quinone form back to dopamine. This reduction does not typically occur at slow scan rates on carbon electrodes due to slow electron transfer kinetics combined with the further reactions of the quinone form that are irreversible such as the formation of polydopamine. The E1/2 potential determined from the CV measurements was 0.35 V. The ipversus υ1/2 is again linear with scan rate and passes near zero at the origin as shown in Fig. 4B. We note that these trends may slightly deviate from linearity, and it could be appropriate to use a different type of fit. In dopamine (Fig. 4B) this is explained because the back reduction is not straight-forward; the reaction is complex and can include the formation of dimers and trimers on the surface, which is not a truly diffusion-controlled process. The measured ΔEp showed a similar relationship with scan rate and concentration as that previously found with the redox mediators and the same conclusions can be reached with regards to sluggish electron transfer rates from the printed working electrode resulting in greater than predicted peak separations (Fig. 4C). DPV measurements are shown in Fig. 4D and the inset shows the peak current versus concentration at a potential of 0.451 V. The slope of the linear fit to this data was used to calculate a sensitivity of (6.05 ± 0.55) × 102 nA mM−1.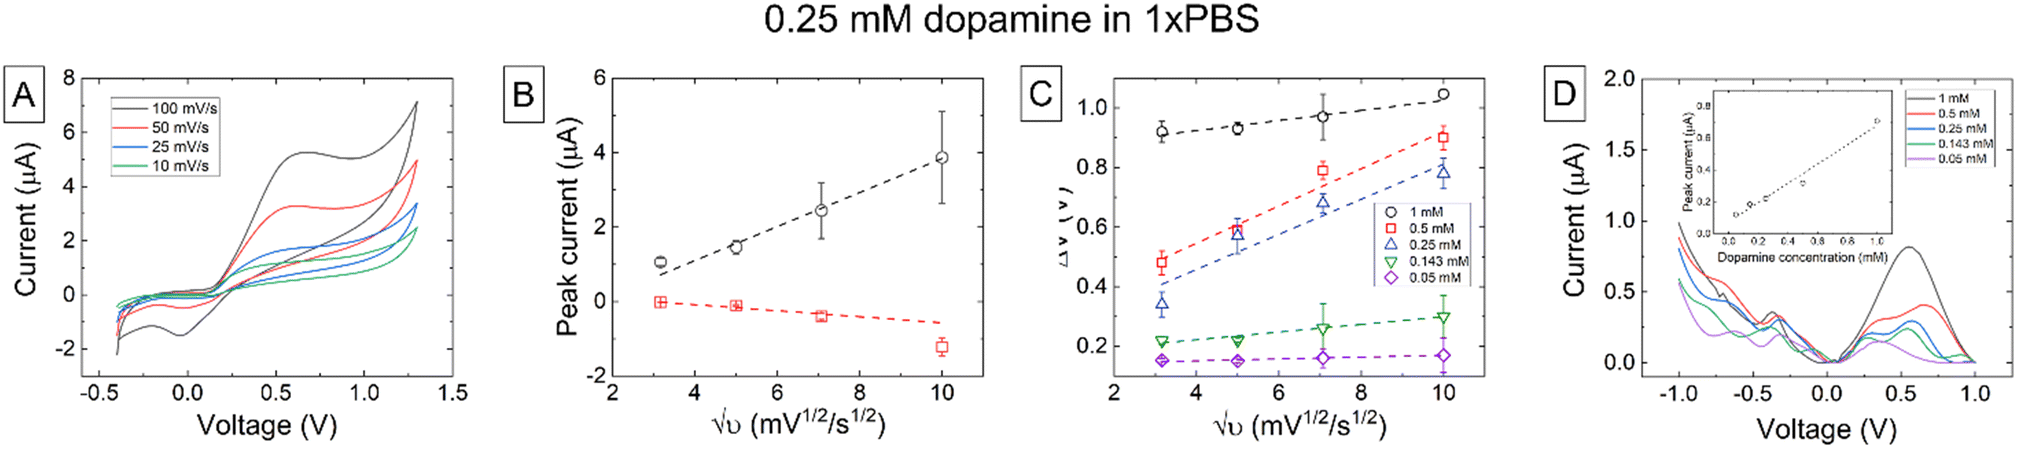 | ||
| Fig. 4 (A) CV measurements of dopamine in 1×PBS at increasing scanning rates of 10, 25, 50, and 100 mV s−1. (B) Oxidation and reduction peak currents of 0.25 mM dopamine in 1×PBS. Error bars represent ±s.d. (n = 4). (C) Voltage difference between oxidation and reduction peaks as a function of both scan rate and concentration. Error bars represent ±s.d. (n = 4). (D) DPV measurements of increasing concentrations of dopamine in 1×PBS. Insert plot shows DPV peak current as a function of concentration (0.05 mM to 1 mM) and the slope of the linear fit to this data was used to calculate a sensitivity of (6.05 ± 0.55)·102 nA mM−1. | ||
Chronoamperometric measurements at dopamine concentrations of 0.05 mM, 0.143 mM, 0.25 mM, 0.5 mM, and 1 mM in 1×PBS over 200 s are shown int Fig. 5. Measurements of the background current in 1×PBS are included to establish a baseline and clearly see whether dopamine was being measured or not. Fig. 5B and C show the measured currents at 60 and 200 seconds, respectively. The calculated sensitivity for chronoamperometric measurements at 60 s was (1.16 ± 0.10) × 101 μA mM−1, and for 200 s was (1.170 ± 0.063) × 101 μA mM−1. While good linear fitting is obtained for Fig. 5B (R2 = 0.9699), there is an iR drop in the system. Since the current increases to quite high levels at higher dopamine concentrations, some loss of linearity could a consequence of this iR drop. This data reveals that it is possible to use the 3D-printed electrodes to detect different dopamine levels in just one minute reliably. Making extended measurements up to 200s provided even more consistent and stable data, but little current changes between 60 and 200 seconds indicate that a stable amperometric response can be obtained from the sensor.
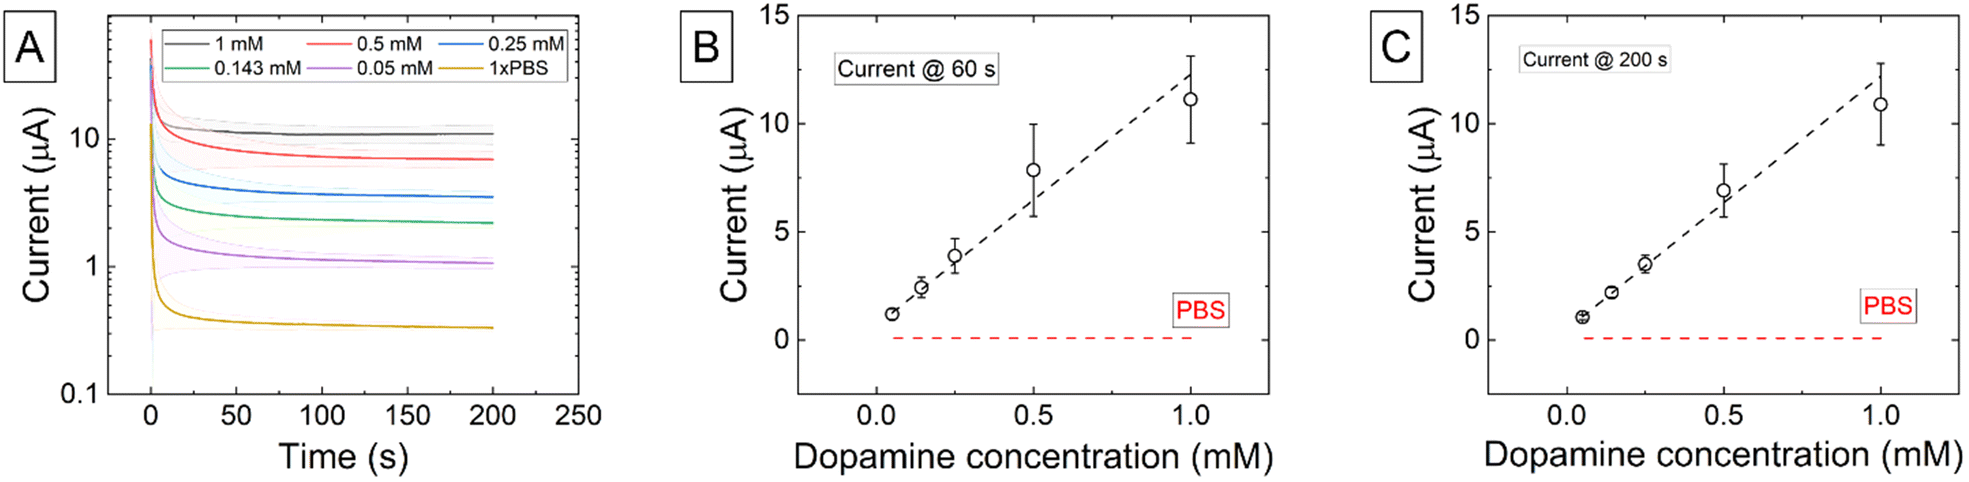 | ||
| Fig. 5 (A) Amperometry data obtained for 1 mM, 0.5 mM, 0.25 mM, 0.143 mM, and 0.05 mM dopamine in 1×PBS, with measurements running for 200 s. Shaded areas represent ±s.d. (n = 4). Current measurements as a function of dopamine concentration at (B) 60 s and (C) 200 s. The calculated sensitivity for measurements at 60 s was (1.16 ± 0.10) × 101 μA mM−1 and for 200 s was (1.170 ± 0.063) × 101 μA mM−1. Error bars represent ±s.d. (n = 4). The baseline current measured for 1×PBS is shown for comparison (red dashed line). | ||
3.4. Enzymatic glucose biosensing
Characterization of the mediated glucose oxidase enzyme biosensor is shown in Fig. 6. The introduction of a gelatin-based modification on the surface of the 3D-printed electrode still allowed current to be detected through the deposit, demonstrating enhanced applicability of 3D-printed sensors.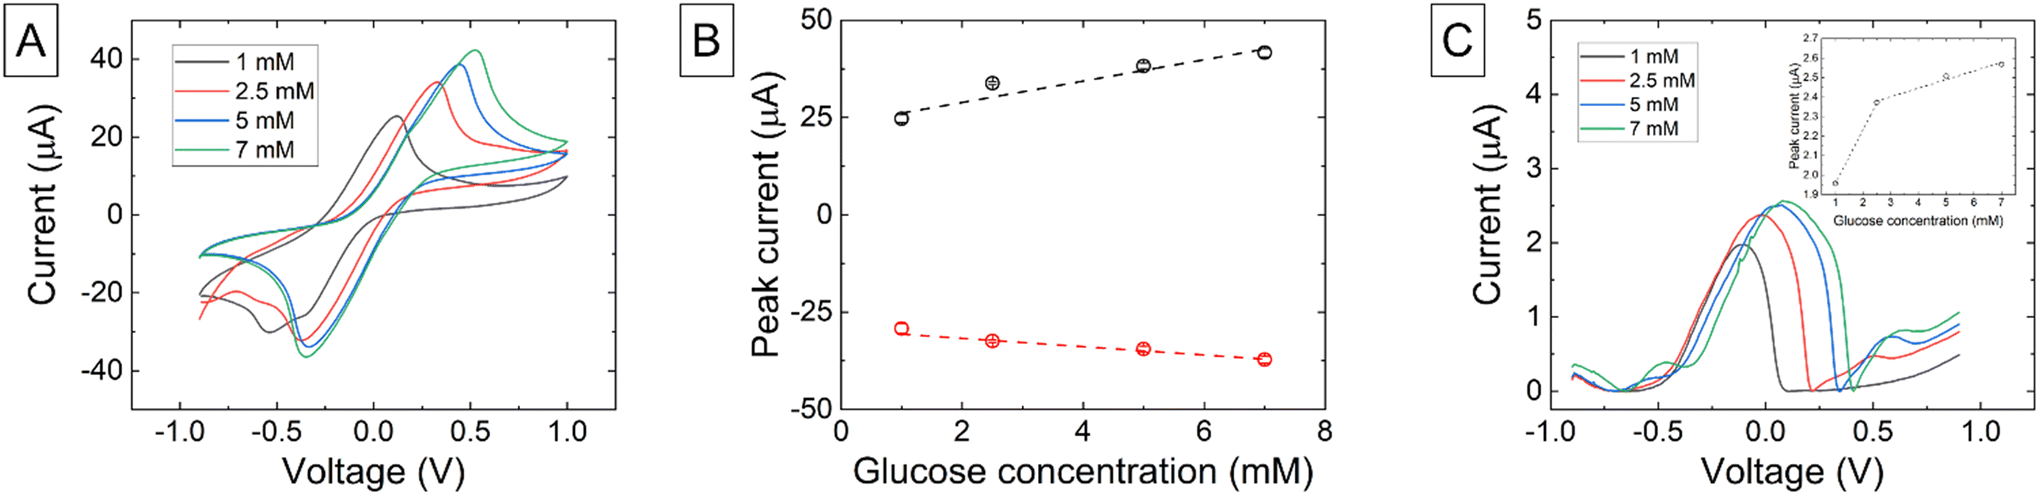 | ||
| Fig. 6 (A) CVs of increasing glucose concentrations in 1×PBS in second-generation glucose oxidase biosensor. (B) Oxidation and reduction peak current analysis as a function of glucose concentration in second-generation glucose oxidase biosensor, respectively. Error bars represent ±s.d. (n = 4). (C) DPVs at increasing glucose concentrations for second-generation glucose oxidase biosensors. Insert plots show DPV peak current as a function of glucose concentration to determine electrode sensitivity. Second-generation biosensors used 1 mM HexRu as the mediator. The sensitivity calculated for and the second-generation glucose oxidase biosensor was 277.33 nA mM−1, respectively. | ||
CV measurements of the mediated glucose biosensors (Fig. 6A) showed increased peak current response as the HexRu mediator enhances electron transfer through redox cycling between the enzyme and electrode. Current from the presence of any H2O2 produced by the enzyme is negligible. The HexRu reduction peak was largely stable as this is directly related to the concentration of the oxidized(III) form of the mediator in the bulk solution. The oxidation peak varied with glucose concentration as the enzyme reduced the mediator to the(II) form when it converts its substrate β-D-glucose to the product D-glucono-δ-lactone and this was then oxidized at the electrode on the forward scan. The oxidation peak potential again shifted to higher potentials with increased concentrations. Fig. 6B shows the linear relationship between peak oxidation current and concentration with a sensitivity of 277.33 nA mM−1. DPV peak currents increased with concentration however the response was non-linear (Fig. 6C). This could be due to saturation of the maximum turnover of the enzyme at high concentrations or through other restrictions such as charge hinderance near the electrode.
Following this, the chronoamperometric response of and the mediated glucose oxidase enzyme biosensor model was investigated (Fig. 7C).
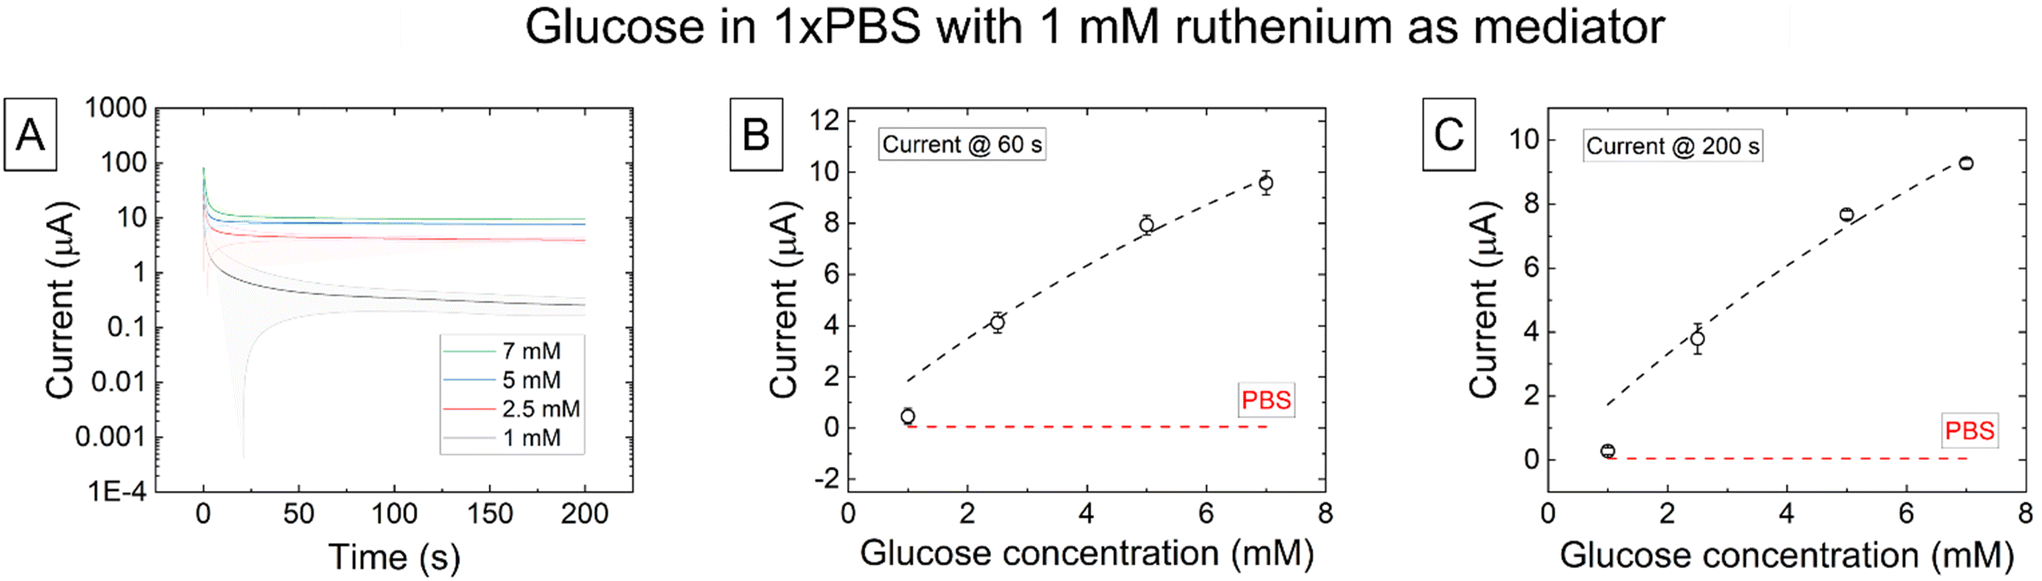 | ||
| Fig. 7 (A) Chronoamperometry data at increasing glucose concentrations in 1×PBS for the second-generation glucose oxidase biosensor with measurements running for 200 seconds. Shaded areas represent ±s.d. (n = 4). (B) Current measurements after 60 seconds for and the second-generation glucose oxidase biosensor. (C) Current measurements after 200 seconds for and the second-generation glucose oxidase biosensor. Error bars represent ±s.d. (n = 4). A baseline current measured in 1×PBS is shown for comparison (red dashed line). | ||
CA measurements of the mediated biosensor were taken at a potential of 0.8 V for 200 s. The stable current increased with concentration. The plot of the extracted stable current against concentration at 60s is given in Fig. 7B and at 200 s in Fig. 7C. The baseline and background current measured in 1×PBS is shown as a red dashed line. The data fits a Michaelis–Menten model, with Vmax values of 34.30 and 36.50 mM at 60 and 200 seconds, respectively, indicating that the sensor is able to detect current changes arising from enzymatic-based kinematic processes.
A summary of the electrode sensitivities measured in this work is given in Table 2.
| Chemical | Sensitivity (μA mM−1) | S.E. (μA mM−1) | Current density (nA mM−1 cm−2) |
|---|---|---|---|
| Hexaammineruthenium(III) chloride in 100 mM KCl | 0.533 | 0.094 | 2.40 |
| Potassium ferricyanide in 100 mM KCl | 0.0291 | 0.0031 | 0.13 |
| Dopamine in 1×PBS | 0.679 | 0.046 | 3.06 |
| Glucose in 1×PBS (mediated) | 0.28 | 4.91 × 10⁻⁵ | 1.26 |
Amperometric measurements of and the mediated glucose oxidase based enzymatic biosensor measured glucose successfully. There was not a large difference observed between current measurements made at 60 seconds or 200 seconds (from 1.59 ± 0.21 μA mM−1 at 60 seconds to 1.2781 ± 0.0026) leading to reliable measurement times of just one minute, analogous to the dopamine results and indicating that the sensor provides stable amperometric readings.
4. Conclusions
We have demonstrated how to produce a fully integrated 3D-printing platform, including connector and electrode, to perform electrochemical measurements. Small, portable electrodes can be rapidly produced and used, providing reliable readings, with as little as 100 μL samples. Further from conventional electrode characterisation using both inner- and outer-sphere electron transfer examples, we have successfully demonstrated that our sensor (production in only 39 minutes), provides reliable measurements of dopamine levels and physiologically relevant concentrations of glucose in just one minute. While there are a few parameters to optimise, namely electrode surface uniformity, integration of a non-carbon reference electrode, minimising Ohmic losses, and reduction of sample volume, we are confident that this new, integrated approach to developing electrochemical sensors will have an impact on future electroanalytical research.Author contributions
RDR performed the main body of experiments, data analysis, and writing of the manuscript and ESI.† AM designed and 3D-printed the connectors used in the integrated platform and contributed to glucose experimentation SH and DC provided funding and equipment. AM, SH, and DC also contributed in the writing of the manuscript and ESI.†Conflicts of interest
The authors declare no competing financial interests.Acknowledgements
The authors would like to thank the Scottish Enterprise and Scottish Funding Council GCRF for project funding. A. M. would like to thank the EngD Medical Devices CDT for his studentship funded by the EPSRC CDT in Biomedical Devices and Health Technologies (EP/L015595/1). We would also like to thank Dr Mairi E. Sandison for her help and support using the O2 plasma chamber.References
- C. L. Manzanares Palenzuela, F. Novotný, P. Krupička, Z. Sofer and M. Pumera, 3D-Printed Graphene/Polylactic Acid Electrodes Promise High Sensitivity in Electroanalysis, Anal. Chem., 2018, 90(9), 5753–5757, DOI:10.1021/acs.analchem.8b00083.
- F. M. de Oliveira, E. I. de Melo and R. A. B. da Silva, 3D Pen: A Low-Cost and Portable Tool for Manufacture of 3D-Printed Sensors, Sens. Actuators, B, 2020, 321, 128528, DOI:10.1016/j.snb.2020.128528.
- C. McLean, B. Tiller, R. Mansour, K. Brown, J. Windmill and L. Dennany, Characterising the Response of Novel 3D Printed CNT Electrodes to the Virulence Factor Pyocyanin, J. Electroanal. Chem., 2022, 909, 116149, DOI:10.1016/j.jelechem.2022.116149.
- H. Ota, M. Chao, Y. Gao, E. Wu, L.-C. Tai, K. Chen, Y. Matsuoka, K. Iwai, H. M. Fahad, W. Gao, H. Y. Y. Nyein, L. Lin and A. Javey, 3D Printed “Earable” Smart Devices for Real-Time Detection of Core Body Temperature, ACS Sens., 2017, 2(7), 990–997, DOI:10.1021/acssensors.7b00247.
- T. Chu, H. Wang, Y. Qiu, H. Luo, B. He, B. Wu and B. Gao, 3D Printed Smart Silk Wearable Sensors, Analyst, 2021, 146(5), 1552–1558, 10.1039/D0AN02292F.
- X. Zhu, Y. Ju, J. Chen, D. Liu and H. Liu, Nonenzymatic Wearable Sensor for Electrochemical Analysis of Perspiration Glucose, ACS Sens., 2018, 3(6), 1135–1141, DOI:10.1021/acssensors.8b00168.
- Y. Gao, G. Yu, T. Shu, Y. Chen, W. Yang, Y. Liu, J. Long, W. Xiong and F. Xuan, 3D–Printed Coaxial Fibers for Integrated Wearable Sensor Skin, Adv. Mater. Technol., 2019, 4(10), 1900504, DOI:10.1002/admt.201900504.
- S. L. Marasso, M. Cocuzza, V. Bertana, F. Perrucci, A. Tommasi, S. Ferrero, L. Scaltrito and C. F. Pirri, PLA Conductive Filament for 3D Printed Smart Sensing Applications, Rapid Prototyp. J., 2018, 24(4), 739–743, DOI:10.1108/RPJ-09-2016-0150.
- Z. A. Abro, C. Hong, Y. Zhang, M. Q. Siddiqui, A. M. R. Abbasi, Z. Abro and S. Q. B. Tariq, Development of FBG Pressure Sensors Using FDM Technique for Monitoring Sleeping Postures, Sens. Actuators, A, 2021, 331, 112921, DOI:10.1016/j.sna.2021.112921.
- J. Wei, J. Xie, P. Zhang, Z. Zou, H. Ping, W. Wang, H. Xie, J. Z. Shen, L. Lei and Z. Fu, Bioinspired 3D Printable, Self-Healable, and Stretchable Hydrogels with Multiple Conductivities for Skin-like Wearable Strain Sensors, ACS Appl. Mater. Interfaces, 2021, 13(2), 2952–2960, DOI:10.1021/acsami.0c19512.
- A. Abdalla, H. H. Hamzah, O. Keattch, D. Covill and B. A. Patel, Augmentation of Conductive Pathways in Carbon Black/PLA 3D-Printed Electrodes Achieved through Varying Printing Parameters, Electrochim. Acta, 2020, 354, 136618, DOI:10.1016/j.electacta.2020.136618.
- R. S. Shergill, F. Perez, A. Abdalla and B. A. Patel, Comparing Electrochemical Pre-Treated 3D Printed Native and Mechanically Polished Electrode Surfaces for Analytical Sensing, J. Electroanal. Chem., 2022, 905, 115994, DOI:10.1016/j.jelechem.2021.115994.
- J. Junpha, A. Wisitsoraat, R. Prathumwan, W. Chaengsawang, K. Khomungkhun and K. Subannajui, Electronic Tongue and Cyclic Voltammetric Sensors Based on Carbon Nanotube/Polylactic Composites Fabricated by Fused Deposition Modelling 3D Printing, Mater. Sci. Eng., C, 2020, 117, 111319, DOI:10.1016/j.msec.2020.111319.
- Y. Li, Y. Zheng, P. Zhan, G. Zheng, K. Dai, C. Liu and C. Shen, Vapor Sensing Performance as a Diagnosis Probe to Estimate the Distribution of Multi-Walled Carbon Nanotubes in Poly(Lactic Acid)/Polypropylene Conductive Composites, Sens. Actuators, B, 2018, 255, 2809–2819, DOI:10.1016/j.snb.2017.09.098.
- R. G. Rocha, R. M. Cardoso, P. J. Zambiazi, S. V. F. Castro, T. V. B. Ferraz, G. d. O. Aparecido, J. A. Bonacin, R. A. A. Munoz and E. M. Richter, Production of 3D-Printed Disposable Electrochemical Sensors for Glucose Detection Using a Conductive Filament Modified with Nickel Microparticles, Anal. Chim. Acta, 2020, 1132, 1–9, DOI:10.1016/j.aca.2020.07.028.
- G. D. O'Neil, Toward Single-Step Production of Functional Electrochemical Devices Using 3D Printing: Progress, Challenges, and Opportunities, Curr. Opin. Electrochem., 2020, 20, 60–65, DOI:10.1016/j.coelec.2020.02.023.
- J. S. Stefano, C. Kalinke, R. G. da Rocha, D. P. Rocha, V. A. O. P. da Silva, J. A. Bonacin, L. Angnes, E. M. Richter, B. C. Janegitz and R. A. A. Muñoz, Electrochemical (Bio)Sensors Enabled by Fused Deposition Modeling-Based 3D Printing: A Guide to Selecting Designs, Printing Parameters, and Post-Treatment Protocols, Anal. Chem., 2022, 94(17), 6417–6429, DOI:10.1021/acs.analchem.1c05523.
- D. P. Rocha, R. G. Rocha, S. V. F. Castro, M. A. G. Trindade, R. A. A. Munoz, E. M. Richter and L. Angnes, Posttreatment of 3D–printed Surfaces for Electrochemical Applications: A Critical Review on Proposed Protocols, Electrochem. Sci. Adv., 2021, 1–15, DOI:10.1002/elsa.202100136.
- R. D. Crapnell, E. Bernalte, A. G.-M. Ferrari, M. J. Whittingham, R. J. Williams, N. J. Hurst and C. E. Banks, All-in-One Single-Print Additively Manufactured Electroanalytical Sensing Platforms, ACS Meas. Sci. Au, 2021, acsmeasuresciau.1c00046, DOI:10.1021/acsmeasuresciau.1c00046.
- P. Swami, A. Sharma, S. Anand and S. Gupta, DEPIS: A Combined Dielectrophoresis and Impedance Spectroscopy Platform for Rapid Cell Viability and Antimicrobial Susceptibility Analysis, Biosens. Bioelectron., 2021, 182, 113190, DOI:10.1016/j.bios.2021.113190.
- J. E. Contreras-Naranjo, V. H. Perez-Gonzalez, M. A. Mata-Gómez and O. Aguilar, 3D-Printed Hybrid-Carbon-Based Electrodes for Electroanalytical Sensing Applications, Electrochem. Commun., 2021, 130, 107098, DOI:10.1016/j.elecom.2021.107098.
- J. F. S. Pereira, R. G. Rocha, S. V. F. Castro, A. F. João, P. H. S. Borges, D. P. Rocha, A. de Siervo, E. M. Richter, E. Nossol, R. V. Gelamo and R. A. A. Muñoz, Reactive Oxygen Plasma Treatment of 3D-Printed Carbon Electrodes towards High-Performance Electrochemical Sensors, Sens. Actuators, B, 2021, 347, 130651, DOI:10.1016/j.snb.2021.130651.
- R. M. Cardoso, D. M. H. Mendonça, W. P. Silva, M. N. T. Silva, E. Nossol, R. A. B. da Silva, E. M. Richter and R. A. A. Muñoz, 3D Printing for Electroanalysis: From Multiuse Electrochemical Cells to Sensors, Anal. Chim. Acta, 2018, 1033, 49–57, DOI:10.1016/j.aca.2018.06.021.
- R. M. Cardoso, P. R. L. Silva, A. P. Lima, D. P. Rocha, T. C. Oliveira, T. M. do Prado, E. L. Fava, O. Fatibello-Filho, E. M. Richter and R. A. A. Muñoz, 3D-Printed Graphene/Polylactic Acid Electrode for Bioanalysis: Biosensing of Glucose and Simultaneous Determination of Uric Acid and Nitrite in Biological Fluids, Sens. Actuators, B, 2020, 307, 127621, DOI:10.1016/j.snb.2019.127621.
- M. Hatada, N. Loew, Y. Inose-Takahashi, J. Okuda-Shimazaki, W. Tsugawa, A. Mulchandani and K. Sode, Development of a Glucose Sensor Employing Quick and Easy Modification Method with Mediator for Altering Electron Acceptor Preference, Bioelectrochemistry, 2018, 121, 185–190, DOI:10.1016/j.bioelechem.2018.02.001.
- W.-Y. Jeon, C.-J. Lee, H.-H. Kim, Y.-B. Choi, B.-H. Lee, H.-J. Jo and S.-Y. Jeon, Glucose Detection via Ru-Mediated Catalytic Reaction of Glucose Dehydrogenase, Adv. Mater. Lett., 2018, 9(3), 220–224, DOI:10.5185/amlett.2018.1947.
- N. Loew, W. Tsugawa, D. Nagae, K. Kojima and K. Sode, Mediator Preference of Two Different FAD-Dependent Glucose Dehydrogenases Employed in Disposable Enzyme Glucose Sensors, Sensors, 2017, 17(11), 2636, DOI:10.3390/s17112636.
- M. Okurita, N. Suzuki, N. Loew, H. Yoshida, W. Tsugawa, K. Mori, K. Kojima, D. C. Klonoff and K. Sode, Engineered Fungus Derived FAD-Dependent Glucose Dehydrogenase with Acquired Ability to Utilize Hexaammineruthenium(III) as an Electron Acceptor, Bioelectrochemistry, 2018, 123, 62–69, DOI:10.1016/j.bioelechem.2018.04.007.
- E. S. Ryabova, V. N. Goral, E. Csöregi, B. Mattiasson and A. D. Ryabov, Coordinative Approach to Mediated Electron Transfer: Ruthenium Complexed to Native Glucose Oxidase, Angew. Chem., Int. Ed., 1999, 38(6), 804–807, DOI:10.1002/(SICI)1521-3773(19990315)38:6<804::AID-ANIE804>3.0.CO;2-6.
- H. H. Hamzah, O. Keattch, M. S. Yeoman, D. Covill and B. A. Patel, Three-Dimensional-Printed Electrochemical Sensor for Simultaneous Dual Monitoring of Serotonin Overflow and Circular Muscle Contraction, Anal. Chem., 2019, 91(18), 12014–12020, DOI:10.1021/acs.analchem.9b02958.
- V. Katseli, N. Thomaidis, A. Economou and C. Kokkinos, Miniature 3D-Printed Integrated Electrochemical Cell for Trace Voltammetric Hg(II) Determination, Sens. Actuators, B, 2020, 308, 127715, DOI:10.1016/j.snb.2020.127715.
- G. D. O'Neil, S. Ahmed, K. Halloran, J. N. Janusz, A. Rodríguez and I. M. T. Rodríguez, Single-Step Fabrication of Electrochemical Flow Cells Utilizing Multi-Material 3D Printing, Electrochem. Commun., 2019, 99, 56–60, DOI:10.1016/j.elecom.2018.12.006.
- E. M. Richter, D. P. Rocha, R. M. Cardoso, E. M. Keefe, C. W. Foster, R. A. A. Munoz and C. E. Banks, Complete Additively Manufactured (3D-Printed) Electrochemical Sensing Platform, Anal. Chem., 2019, 91(20), 12844–12851, DOI:10.1021/acs.analchem.9b02573.
- J. Muñoz and M. Pumera, 3D-Printed Biosensors for Electrochemical and Optical Applications, TrAC, Trends Anal. Chem., 2020, 128, 115933, DOI:10.1016/j.trac.2020.115933.
- P. Ramiah Rajasekaran, A. A. Chapin, D. N. Quan, J. Herberholz, W. E. Bentley and R. Ghodssi, 3D-Printed Electrochemical Sensor-Integrated Transwell Systems, Microsyst. Nanoeng., 2020, 6(1), 100, DOI:10.1038/s41378-020-00208-z.
Footnote |
| † Electronic supplementary information (ESI) available: Detailed information about 3D-pritned connector and electrode dimensions; description, sketches, and electrochemical response of as printed and cleaned electrodes; SEM surface images of the 3D-printed electrode. See DOI: https://doi.org/10.1039/d2an00862a |
| This journal is © The Royal Society of Chemistry 2022 |