DOI:
10.1039/C9RA01255A
(Paper)
RSC Adv., 2019,
9, 14797-14808
Modifying the microstructure of algae-based active carbon and modelling supercapacitors using artificial neural networks†
Received
19th February 2019
, Accepted 15th April 2019
First published on 14th May 2019
Abstract
An improved activated carbon material is synthesized from nostoc flagelliforme algae (NF) using an acid immersing method. The material has more pores and lower internal resistance compared with raw NF. Hydrofluoric acid can effectively decompose cellulose fibers and remove inorganic impurities, giving the carbon materials high mesopore volumes, which makes electrolyte ions rapidly transfer to the active site on the electrode surface. The specific capacitance of the sample was increased from 200 to 283 F g−1 after immersing in hydrofluoric acid. In addition, the symmetric supercapacitor shows an excellent energy density of 22 W h kg−1 at a power density of 80 W kg−1. The capacitance remains at 101.7% after 10![[thin space (1/6-em)]](https://www.rsc.org/images/entities/char_2009.gif) 000 cycles. Furthermore, in order to find the relationship between the biochar structure and electrochemical performance in supercapacitors, an artificial neural network (ANN) method is used for studying the complex synergy mechanism. The specific capacitance is modelled using various input factors like aspect ratio (rL/D), cellulose ratio (CL(%)), specific surface area (SBET), pore volume (Vtot), internal resistance (Rs) and so on. The Levenberg–Marquart back propagation algorithm with sigmoid and ReLu active function is adopted to train the model. Random forest is used to analyse the relative importance of every input factor on specific capacitance. Results show that the model can estimate the energy storage with a mean squared error of 4.39 for materials with specific structure. Importance analyses indicate the first three significant variables are SBET, Rs and Vpor. The ANN model can accurately predict the electrical properties of biomass-based carbon materials, and also provide guidance for the selection of energy storage materials in the future.
000 cycles. Furthermore, in order to find the relationship between the biochar structure and electrochemical performance in supercapacitors, an artificial neural network (ANN) method is used for studying the complex synergy mechanism. The specific capacitance is modelled using various input factors like aspect ratio (rL/D), cellulose ratio (CL(%)), specific surface area (SBET), pore volume (Vtot), internal resistance (Rs) and so on. The Levenberg–Marquart back propagation algorithm with sigmoid and ReLu active function is adopted to train the model. Random forest is used to analyse the relative importance of every input factor on specific capacitance. Results show that the model can estimate the energy storage with a mean squared error of 4.39 for materials with specific structure. Importance analyses indicate the first three significant variables are SBET, Rs and Vpor. The ANN model can accurately predict the electrical properties of biomass-based carbon materials, and also provide guidance for the selection of energy storage materials in the future.
1. Introduction
With the development of society fossil energy is becoming increasingly depleted and no longer meets the needs of human beings. Energy storage has attracted a lot of interest.1 Among the various kinds of energy storage devices, supercapacitors emerge as competitive due to their high power density, short charge/discharge time and good cycle stability.2 All these properties can be attributed to the energy storage mechanism through the adsorption and desorption of electrolyte ions on the electrode surface. The electrode material is the most important part for supercapacitors' electrochemical performance. Among the enormous amounts of research, activated carbons have recently attracted immense interest due to their large surface area, stable chemical properties, high conductivity and adjustable structure.3 It is mainly prepared via carbonization and activation of different precursors. Generally speaking, materials containing a high content of carbon and a small amount of inorganics are favorable precursors for the preparation of activated carbon. From the points of availability and low cost of raw materials, waste biomass, such as corncob sponge,4 watermelon seeds,5 bougainvillea flowers,6 fresh elm samaras,7 dandelion fluff,8 garlic skin,9 lotus receptacle,10 rice husk,11 cornstalk,12 and kelp,13 have been seen as promising precursors for preparing activated carbon.
Algae biomass is known to grow fast in eutrophicated water bodies. Its excessive accumulation does serious damage to the marine ecosystem. It not only promotes bacteria growth but also hinders the tourism development. Therefore, a practical and feasible method to solve this problem is to take advantage of these wastes to produce value-added products. Prof. Du14 reported that enteromorpha with egg-shell structure is more likely to form porous layered structure during carbonization, resulting high capacitance in supercapacitor. Prof. Yang15 fabricated porous and high specific surface area carbon-aerogel from seaweed aerogel, and successfully applied to the field of lithium-ion battery and supercapacitors. These results indicate that algae can stand out in energy storage application. However, to date, no report has been published about algae being pretreated with different acid solution before carbonization, which is the method we used in this article to improve the structure of NF-based activated carbon.
Another important task in this paper is using artificial neutral network (ANN) to construct relations between complex structure and performance. It is known that each structure factor i.e. aspect ratio (rL/D), cellulose accounts (CL (%)), specific surface area (SBET), pore volume (Vtot), mesopore volume (Vmes), micropore volume (Vmic), resistance (Rs) and nitrogen content (N (%)) shows nonlinearities or no specific relation to electrochemical performance. Therefore establishing an appropriate structure–performance relationship becomes a big problem. ANN is famous for fast learning process, and it has been employed for Multi-Inputs Single-Output (MISO) problems such as pattern recognition, stock prediction, etc.16 Prof. T. Weigert predicted the state of charge for energy storage devices using ANN.17 Prof. Ajit Danti used ANN to predict the age and gender of human faces with 95% accuracy.18 In this paper ANN model is established based on Levenberg–Marquart back propagation algorithm. Tanh and ReLu active functions are act as transfer functions in hidden layers. The relative importance of inputs is assessed by Random Forest.19 To date, it has attracted much attention in data analysis and other fields. Random Forest contains many decision trees. Each split is a feature condition, which is used to divide the data set (root node) into many homogeneous groups, and further up to the terminal (leaf note). The eventual importance of every feature is calculated by voting from individual decision tree in random forest.20
2. Experimental
2.1 Synthesis of NFAC-x
The NF was collected from eastern coast of Xia Pu sea in Fujian province. Acetylene black, polytetrafluoroethylene (PTFE), potassium hydroxide (KOH), concentrated hydrochloric acid (37 wt%, HCl), hydrogen peroxide (30 wt%, H2O2), acetic acid (Ac), hydrofluoric acid (40 wt%, HF) were purchased from Aladdin Chemistry Co. Ltd. (China). Sodium hypochlorite (NaClO2) and ethanol were purchased from Yuanli chemical engineering Inc., Tianjin, China. All the chemical regents were of analytical grade.
2.1.1 Pretreatment of the raw NF. In this study, the dried raw NF was processed as follows: a certain amount of raw NF was firstly dispersed separately into 5 wt% Ac–H2O2, 5 wt% Ac-NaClO2, 2 M HF aqueous solution and was stirred in the swing bed for 4 h at 20 °C. The as-prepared samples were washed with distilled water for 5 times, then maintained in a freeze drying oven for 24 h. These samples are referred to as NF-a, NF-b, NF-c, respectively. The control sample without any pretreatment is referred to as NF.
2.1.2 Synthesis of the activated carbons. Firstly, a certain amount of NF, NF-a, NF-b, NF-c was carbonized at 400 °C for 1 h under an argon atmosphere in a tube furnace. The resulting material was denoted as NFC-x (x represents a, b, c). 1 g NFC-x was mixed with KOH in a certain proportion (KOH/NFC-x = 2, 3, 4) and milled with mortar evenly. Then the samples were put into aluminium oxide ark located in a tube furnace for activation process at 700 °C for 2 h. After the activation process and the temperature was down, the products were dispersed in HCl solution (1.0 mol L−1) to react with potassium compounds. Then the sample was vacuum filtrated by DI water for several times to achieve neutral pH value. Finally the samples were dried at 50 °C for 24 h in an air dry oven. The activated carbon preparing from the NFC, NFC-a, NFC-b, NFC-c is referred as NFAC, NFAC-a, NFAC-b, NFAC-c, respectively. For comparation, NFAC-c was also fabricated at 600, 800 and 900 °C (NFAC-c-600, NFAC-c-800, NFAC-c-900) in activation procedure.
2.2 Material characterization
Weight change during carbonization was monitored by a thermogravimetric analyzer (TGA; DTG-60AH) under N2 atmosphere from 100 °C to 800 °C. The surface morphology and microstructure of the samples were characterized with scanning electron microscope (SEM; Hitachi SU3500) and transmission electron microscope (TEM, Tecnai F30). Crystalline structure was identified by a D/MAX-2500 X-ray diffractometer (XRD) operating with Cu Kα radiation (λ = 1.5418 Å) at a scan rate (2θ) of 5° min−1. The degree of graphitization was measured by Raman spectroscopy (Horiba Scientific, France) with an excitation wavelength of 532 nm. The pore structure property was characterized by Nitrogen adsorption–desorption method at −196 °C (Quantachrome Autosorb-iQ). The samples were degassed at 200 °C for 6 h under vacuum prior to the adsorption/desorption measurements. The specific surface area of the samples was measured by using the multi-point Brunauer–Emmett–Teller (BET) method. The pore size distributions were estimated by using cyclinder/slit density functional theory (DFT). The total pore volume (Vtot) was determined at a relative pressure P/P0 = 0.99 and the micropore volume (Vmic) was determined using the t-plot method.
2.3 Electrochemical performance
Electrochemical properties of prepared samples were measured in a two electrode system using CHI760e electrochemical workstation (Chenhua, Shanghai, China). For electrode preparation, 80 wt% NF-derived active carbon, 10 wt% polytetrafluoroethylene and 10 wt% conducting carbon were mixed in ethanol to form slurry. The slurry was pressed into flakes via a stainless bar, and then cut into small round pieces (diameter is 8 mm). The round pieces were oven-dried at 150 °C for 5 h. Current collectors were two pieces of carbon paper with a diameter of 12 mm. Two electrode plates with equal mass of active materials were separated by a filter membrane. All measurements were conducted using 1 M H2SO4. Cyclic voltammetry (CV) and galvanostatic charge–discharge (GCD) measurement were studied within potential window from 0 V to 0.8 V. As for 1 M Na2SO4 electrolyte, the maximum potential window can reach 1.6 V. Electrochemical impedance spectrometry (EIS) was measured in the frequency ranging from 0.01 Hz to 100 kHz with 5 mV amplitude. The specific capacitance (C) for single electrode and supercapacitor cell (Ccell) were calculated from eqn (1) and (2), respectively.21| | |
Ccell = I × Δt/(m × ΔV)
| (2) |
where I (mA) represents discharge current, Δt refers to the discharge time (s), m (mg) is the weight of both working electrodes and ΔV (V) is the potential window during discharge process.
The specific energy density (E, w h kg−1) and the specific power density (P, w kg−1), as practical indicators, were also calculated by eqn (3) and (4), respectively.22
| | |
E = CcellV2/(2 × 3.6)
| (3) |
where
V is the discharge voltage and Δ
t (s) is the discharge time.
3. ANN model
ANN is an effective machine learning regression model. It is suitable for big data processing.23 ANN essentially mimics the nervous system of human beings. The neurons of ANN are grouped into an input layer, one or more hidden layers and an output layer. Fig. 1 depicts the operation mechanism of hidden layer. All variables are firstly weighted and summed (eqn (5)), then activated by a selected nonlinear function.24| |
 | (5) |
where Xi represents input, Wi represents the weight for each input and b is a bias. The incredible computational power of ANN is just achieved through interconnected neurons and transfer functions.25
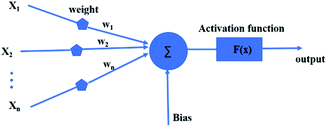 |
| | Fig. 1 Artificial neural network model. | |
3.1 Feature selection and data normalization
ANN can discover relationships between inputs and outputs of a system without understanding sophisticated function mechanism.26 Here, we apply ANN for analyzing the relationship between the structure of carbon materials and performance of supercapacitors. There are many kinds of structure features affecting the electrochemical performance of supercapacitor. Generally speaking, high specific surface supplies abundant contact surface to absorb electrolyte ions and increase specific capacitance.24 Furthermore, micropore is beneficial to the formation of double layer capacitors, and mesopore can provide ion transport channel to ensure the high rate capability.27 Heteroatom (e.g. N) may tailor their electron–donor properties and consequently tune the electrical and chemical performance.28 Importantly, from the perspective of biomass itself, aspect ratio (rL/D) and cellulose content (CL (%)) are the unique properties of species or organs. For example, straw or root of plant has a large aspect ratio (100–500), while petal or fruit has a relatively small aspect ratio (<10). Shell of Arecaceae contains high fractions of cellulose components (>65%),29 straw contains relatively low cellulose ratio (31–44%).30 The purpose of building ANN model is prediction of performance with as many as possible features into consideration, so we also treat them as evaluating performance indicators of supercapacitors.
In order to train a good ANN model, data collection is an important issue. In this manuscript, datasets were collected from more than 200 samples about biomass-derived active carbon and application for supercapacitors in recently published literatures. The input layer includes physical and chemical features of carbon material (SBET, VPor, Dave, Vmic, Vmes, ID/IG, Rs, N (%), CL (%), rL/D). The output layer includes only one feature (specific capacitance (Cp)). All of these data is available in XLSX file of ESI.† Considering that the two factors (rL/D, CL (%)) are the attributes of biomass itself, and the other eight factors are the structural characteristics of biomass-derived activated carbon. In order to obtain the optimal model, we used two, eight and ten factors as the inputs and compared the accuracy of the prediction results. To eliminate dimension differences and accelerate convergence efficiency, original inputs were normalized in advance according to eqn (6) to assure all features are in the range of [0, 1].31
| |
 | (6) |
where
Xnor is the variable after normalization.
Xmax and
Xmin are the maximum and the minimum value of a feature.
3.2 Levenberg–Marquart back propagation algorithm in training process
Supercapacitors-based ANN model is simulated by TensorFlow framework in the Python environment. The high prediction capability of ANN model is determined by the structure of network and the optimized algorithm process. Fig. 2 presents the structure of the supercapacitors-based ANN model. It consists of three layers: one input layer including ten neurons, one output layer including one neuron and two hidden layers including 20 neurons. The datasets are divided in two portions randomly by cross-validation technology.32 Ninety percent of overall data is used as training data to update ANN model that learning the structure–property relationships. The trained network was then evaluated by the remaining validation set (ten percent of overall data). The input information is transmitted to every neuron in the hidden layer increased or decreased by adjusting weight, and further transformed to the next hidden or the output layer. In the transmission process, nonlinear activation function plays an important role in future prediction. This paper chooses tanh function for the first hidden layer and ReLu function for the second hidden layer, given by the eqn (7) and (8):33| |
 | (7) |
| |
 | (8) |
where γ is a variable that can be learned through the Levenberg–Marquart back propagation algorithm. The reason for choosing ReLu function rather than others is its effectiveness in a training process.34
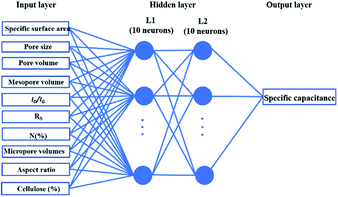 |
| | Fig. 2 Artificial neural network model for supercapacitor. | |
Training a network focuses on applying advanced algorithm to adjust weights (w) and bias (b). The program illustration of Levenberg–Marquart back propagation algorithm is presented in Fig. 3.35 Firstly, ninety percent of experimental data was selected as training subset. It is simple to obtain predicted value using initial parameters (w and b) in the forward-propagation process, meanwhile, mean squared error (MSE) is generated. The eqn (9) represents the MSE calculation:36
| |
 | (9) |
where
ypi is the
ith value predicted from ANN mode
ydi is the
ith desired value. The updating criterion is according to
eqn (10):
37| |
 | (10) |
where
δ is the learning rate and
n is epochs. The weight was adjusted by iterating thousands of times that based on Levenberg–Marquart back propagation algorithm.
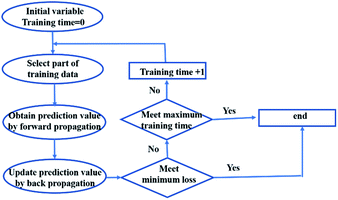 |
| | Fig. 3 The program illustration of back propagation algorithm. | |
3.3 Random forest algorithm in feature importance assessment
Random forest is an integrated learning algorithm which bases on decision tree. Randomization mainly involve two aspects:38 (1) individual decision tree is constituted of training samples, which is selected from data set by bootstrap method randomly. (2) Each split at node is according to one candidate feature condition randomly. In order to find the optimum decision tree, researchers usually based on two indicators: Gini index or out-of-bag data (OOB) error rate.39 Herein, Gini index was used as a criterion for impurity. The detailed algorithm is described as follows:40
There are features such as X1, X2, X3,…, Xm. Gini index is defined by eqn (11):41
| |
 | (11) |
where
k represents a category.
Pmk represents the proportion of category
k at node
m. GI
m shows the probability of randomly selecting two samples from data set whose classes are inconsistent. Therefore, the smaller the GI
m is, the higher the purity will be. The importance score of the feature
Xj at the node m (VIM
(Gini)jm) is the Gini index change after splitting, as shown in
eqn (12):
42| | |
VIM(Gini)jm = GIm − GIl − GIr
| (12) |
GIl and GIr indicate the Gini index of two new nodes after branching. The node m in one decision tree is belonged to set M, therefore the importance score of feature Xj (VIM(Gini)j) is the sum of VIM(Gini)jm, as shown in eqn (13):
| |
 | (13) |
If there are n trees in the Random Forest (RF), then the importance score of feature Xj in RF is expressed by eqn (14):
| |
 | (14) |
Finally, the importance score of the feature Xj can be normalized by eqn (15):
| |
 | (15) |
where
k represents the sum of features. Random forest algorithm is to estimate the average contribution of each feature on all trees in a random forest. As for capacitance performance being controlled by 10 features in supercapacitors model mentioned above, the program makes bucketing at each node. That is to say, the output values were divided into several interval segments. So the output will fall in a certain interval according to the feature condition. The importance of the feature is ranked along the direction in which the Gini index decreases fastest at overall node. Fortunately, Sklearn data packet in machine learning already encapsulates the above mentioned complex algorithm, we only need to recall the function and debug parameter. As analyzed above, trees are random, resulting differences in individual trees' predictions. The eventual importance of every feature (VIM
j) is predicted by voting from individual trained decision tree in random forest.
4. Results and discussion
4.1 Structural characterizations
Schematic illustration for preparing NFAC-x is shown in Fig. 4. The porous carbon was fabricated by carbonization and KOH activation of NF at high temperature (600–900 °C) under an Ar atmosphere. As mentioned in previous research,43 NF is rich in lipids, carbohydrates, alginic acid, and multiple trace elements. Polycondensation reactions will take place between these compounds during carbonization and activation process. TGA indicates three weight loss stage (Fig. S1†). The main mass loss takes place from 220 to 400 °C, which reveals the decomposition of carbohydrates, cellulose.44 Therefore the carbonization temperature was set at 400 °C to decompose most organics.
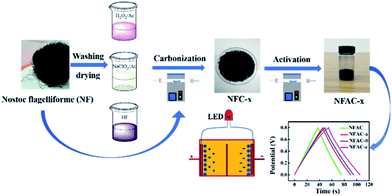 |
| | Fig. 4 Schematic illustration of the synthesis process for NFAC-x from algae. | |
Morphology information on the four groups of samples was obtained via SEM and TEM. The SEM images of NFC-x and NFAC-x are presented in Fig. 5. It can be seen that NFC-x shows the irregular bulk structure with few visible pores on its surface. However, after activation, NFAC-x was featured with vacancies randomly (Fig. 5e–h and S2†). Such change resulted from the volatile matter (CO2, moisture) through decomposition of carbon sample at high temperatures (see ESI† for more explanations). At the same time, the difference of surface morphology is presented for NF after acid solution immersing. NFAC's surface only distributes blisters, however porous structure is showed on the NFAC-x's surface. More specifically, the SEM image of NFAC-c (Fig. 5h) clearly shows a three-dimensional honeycomb-like porous framework. The interconnected pore walls of NFAC-c look very thin, which can accelerate the rate of ion transmission from the electrolyte solution to the inner pores,45 furthermore make outstanding rate performance (74%) when the current density is increased from 0.1 A g−1 to 20 A g−1. Chemical composition (C, O) of NFAC-c can be observed from EDS data. Corresponding element mapping images validate the uniform distribution of C atom (Fig. 6b) and O atom (Fig. 6c). O-containing functional groups is helpful for widening working voltage window (0–1.6 V), and increasing energy density of supercapacitors.46 NFAC-c shows a large amount of interconnected micropores and mesopores evenly distribute inside carbon material in TEM images. The TEM images of NFAC-c in Fig. 6d–f show that a large amount of interconnected micropores and mesopores are evenly distributed inside carbon material. The abundant micropores and mesoporous structures are more helpful for charge storage and the transmission of electrolytes for the electrode material applied in supercapacitors.47 Amorphous structure is also confirmed by carbon materials without graphic ribbon.48 From pore size distribution curves, we can observe that mesopores occupy higher proportion of NFAC-c compared to others, which is beneficial for high rate capacitive performance by serving as ion transport channels to the interior surface of electrode materials.49
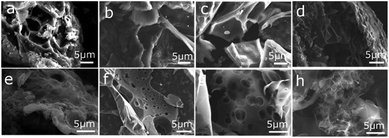 |
| | Fig. 5 SEM images after carbonization at 400 °C of NFC (a), NFC-a (b), NFC-b (c), NFC-c (d) and SEM images after activation at 700 °C of NFAC (e), NFAC-a (f), NFAC-b (g), and NFAC-c (h). | |
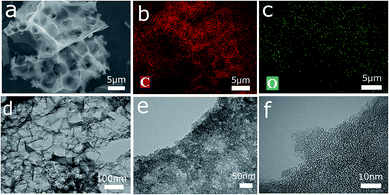 |
| | Fig. 6 (a) SEM image of the obtained three-dimensional porous active carbon (NFAC-c). (b) Corresponding elemental mapping images of C atom and O atom in (c). (d) TEM image of NFAC-c. (e) and (f) HRTEM image of NFAC-c. | |
The crystal structure of NFAC-x was evaluated by XRD (Fig. 7a). For all NFAC-x, there are broad and weak diffraction peaks around 22° corresponding to (002) plane of disordered carbon and 43° corresponding to (100) plane of graphitized lattice, respectively.50 The barely observed diffraction pattern for NFAC is due to its amorphous property.51 The feature of disordered structure and graphitization degree in the samples were characterized by Raman spectra (Fig. 7b). The peak (D band) centering at ∼1340 cm−1 reveals defect and disorder structure of carbon. Another peak (G band) centering at ∼1580 cm−1 is related to sp2 graphite lattice. A smaller intensity ratio between D and G band (ID/IG) indicates the higher degree of graphitization.52 NFAC-c has a lower ID/IG (0.78) than that of NFAC-a (0.81), NFAC-b (0.82) and NFAC (0.95), revealing the greater degree of graphitization.
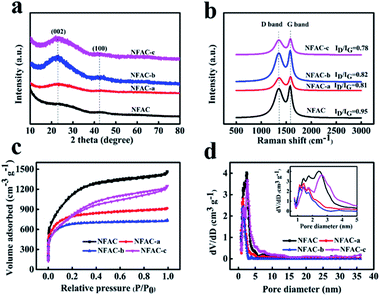 |
| | Fig. 7 (a) XRD profiles of NFAC-x. (b) Raman spectra of NFAC-x. (c) N2 adsorption/desorption isotherm of NFAC-x. (d) Pore size distributions of NFAC-x. The inset shows magnified section of pore diameter ranging from 1 nm to 5 nm. | |
The pore-size information is measured by N2 adsorption/desorption analyzer. As depicted in Fig. 7c and d. NFAC, NFAC-a and NFAC-b all display type I adsorption–desorption isotherm based on the IUPAC classification. N2 adsorption increases steeply at relative low pressure (P/P0 < 0.05), indicating the presence of a great number of micropores.53 For NFAC-c, the plot exhibited hybrid type I/IV adsorption–desorption isotherm with a hysteresis loop in relative pressure P/P0 from 0.4 to 0.9. The hysteresis loop is ascribed to capillary condensation occurring in mesopores.54 The steep adsorption volume in the relative pressure range from 0.9 to 1.0 indicates the existence of macropores.55 The above information demonstrates that there are micropores, mesopores, and macropores present in the NFAC-c. More detailed pore size distributions curves (Fig. 7d) calculated according to the DFT method further show the as-prepared carbon materials have a hierarchical pore structure. Table 1 lists the structure characteristics of NFAC, NFAC-a, NFAC-b, and NFAC-c. It is found that their SBET are 3925 m2 g−1 (NFAC), 2884 m2 g−1 (NFAC-a), 2502 m2 g−1 (NFAC-b), 2796 m2 g−1 (NFAC-c), respectively. The Vpor are 2.26 cm3 g−1 (NFAC), 1.41 cm2 g−1 (NFAC-a), 1.14 cm2 g−1 (NFAC-b), 1.93 cm3 g−1 (NFAC-c), respectively. It can be observed that mesopores occupy higher proportion of NFAC-c compared to others, which is beneficial for high rate capacitive performance by serving as ion transport channels to the interior surface of electrode materials.49 Mesopores forming can be attributed to three reasons: (1) algae (NF) riches in alginate biopolymers on the cell walls. It has a unique ability to generate “egg-box” structures, which facilitate to generate mesopores on algae-based active carbon.56 (2) Acid washing of precursor improves the porosity of the activated carbon produced. Compared with other acid solution, HF treatment can remove of the mineral matter or other inorganic impurity involved in the raw algae thoroughly, furthermore alter the pore structure of the material.57 (3) KOH activation plays an important role in producing mesopore structure in carbons. When the activation temperature is higher than 400 °C, the chemical reactions are involved into the process: 6KOH + 2C![[thin space (1/6-em)]](https://www.rsc.org/images/entities/char_2009.gif) → 2K + 3H2 + 2K2CO3, subsequent decomposition of K2CO3 and reactions of K/K2CO3/CO2 with the carbon.58 Due to this unique microstructure, a specific capacitance of 283 F g−1 for NFAC-c can be obtained at a current density of 0.1 A g−1, which implies a higher performance than that of NFAC (200 F g−1), NFAC-a (239 F g−1) and NFAC-b (253 F g−1).
→ 2K + 3H2 + 2K2CO3, subsequent decomposition of K2CO3 and reactions of K/K2CO3/CO2 with the carbon.58 Due to this unique microstructure, a specific capacitance of 283 F g−1 for NFAC-c can be obtained at a current density of 0.1 A g−1, which implies a higher performance than that of NFAC (200 F g−1), NFAC-a (239 F g−1) and NFAC-b (253 F g−1).
Table 1 Pore characteristic of the as-obtained porous carbon materials
| |
SBET [m2 g−1] |
Smic [m2 g−1] |
Smes [m2 g−1] |
Vpor [cm2 g−1] |
Vmic [cm2 g−1] |
Vmes [cm2 g−1] |
Dave [nm] |
| NFAC |
3925 |
2554 |
1371 |
2.26 |
1.18 |
1.08 |
2.31 |
| NFAC-a |
2884 |
2459 |
425 |
1.41 |
1.05 |
0.36 |
1.97 |
| NFAC-b |
2502 |
2305 |
197 |
1.14 |
0.97 |
0.17 |
1.83 |
| NFAC-c |
2796 |
1236 |
1560 |
1.93 |
0.58 |
1.35 |
2.76 |
4.2 Performance of NFAC-x based electrodes in supercapacitor
To compare electrochemical performance of NFAC-x, CV curves were acquired at a scan rate of 20 mv s−1. All of them present symmetric-rectangular shape without any peaks caused by redox reactions (Fig. 8a, S3b and S5b†), showing typical electric double layer capacitance.64 Comparing four curves, it can be observed that NFAC-c's CV curve area is larger than that of others. This indicates that NFAC-c is able to store more energy.10 Fig. 8b shows CV curves for NFAC-c at a scan rate ranging from 2 to 100 mv s−1. Symmetric-rectangular shape maintains well even at high scan rate of 100 mV s−1. GCD curves at a current density of 1 A g−1 are shown in Fig. 8c, S3b and S5b.† All curves show isosceles triangle shape, implying good reversibility for these electrodes.21 Discharge time of NFAC-c is the longest among all samples', furtherly confirming its strong energy storage power.65 GCD curves for NFAC-x electrode at different current densities are shown in Fig. 8d, S4b, d and f.† Isosceles triangle shape maintains well even at high current densities, showing small internal resistance.46 The calculated specific capacitances (Cm) are 200, 239, 253, 283 F g−1 for NFAC, NFAC-a, NFAC-b, NFAC-c at a current density of 0.1 A g−1, respectively. Fig. 8e demonstrates Cm of all electrodes at a current density ranging from 0.1 to 20 A g−1. The Cm values of NFAC-c are measured as 283, 276, 264, 255, 242, 225, 210, 190 F g−1 at 0.1, 0.2, 0.5, 1, 2, 5, 10, 20 A g−1. Therefore, the NFAC-c has the highest value and still retains a capacitance of 67% at 20 A g−1. Such high capacitance of NFAC-c is related to the unique 3D multi-pores texture, which facilitates ionic transportation within mesopores.66 The decreasing specific capacitance with current density is mainly resulted from slow diffusion of protons through electrodes.67 Fig. S3c and S5c† show the capacitance of other samples being activated at different temperature and KOH mass. It was found NFAC-c exhibited satisfactory capacitive performance. In order to evaluate performance of as-prepared sample, we compared specific capacitance between NFAC-c and other published biomass-derived carbon materials (Table 2). It is shown that our sample is at the level of high energy storage.
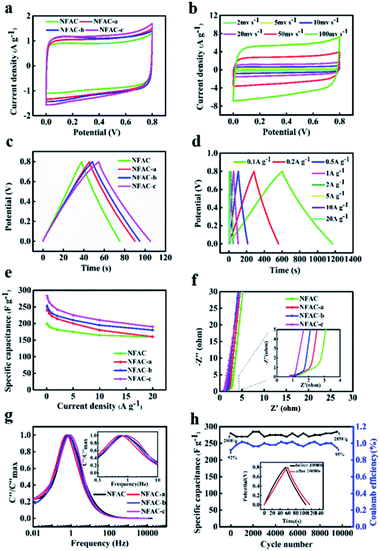 |
| | Fig. 8 Electrochemical performance of NFAC-x electrodes: (a) CV curves at a scan rate of 20 mv s−1 for NFAC-x. (b) CV curves at different scan rates from 2 to 100 mv s−1 for NFAC-c. (c) GCD profiles at a current density of 1 A g−1 for NFAC-x. (d) GCD curves at different current densities from 1 to 20 A g−1 for NFAC-c. (e) Specific capacitances at varied current densities. (f) Nyquist plots of NFAC-x based electrodes in a frequency from 0.01 Hz to 100 kHz. (g) Frequency response of imaginary capacitance plot of NFAC-x. (h) Cycling stability of the NFAC-c at a current density of 1.0 A g−1 for 10![[thin space (1/6-em)]](https://www.rsc.org/images/entities/char_2009.gif) 000 cycles. The inset shows the before and after 10 000 cycles. The inset shows the before and after 10![[thin space (1/6-em)]](https://www.rsc.org/images/entities/char_2009.gif) 000 cycles of GCD curves. 000 cycles of GCD curves. | |
Table 2 Comparison of specific capacitance of carbon materials derived from numerous biomass in symmetric supercapacitor
| Biomass |
Activating agent |
SBET (m2 g−1) |
Specific capacitance (F g−1) |
Current density (A g−1) |
Electrolyte |
Ref. |
| Elm samaras |
KOH |
1947 |
173 |
0.25 |
6 M KOH |
7 |
| Celtuce leaves59 |
KOH |
3404 |
273 |
0.5 |
6 M KOH |
59 |
| Prolifera green tide |
KOH |
2200 |
298 |
0.1 |
6 M KOH |
15 |
| Clover stem60 |
KCl |
1459 |
309 |
0.5 |
1 M H2SO4 |
60 |
| Pomelo61 |
KOH |
832 |
213.6 |
1 |
6 M KOH |
61 |
| Cornstalk |
KCl/NaCl |
1588 |
413 |
0.5 |
1 M H2SO4 |
12 |
| Longan shells62 |
KOH |
3260 |
102.1 |
0.5 |
6 M KOH |
62 |
| Lotus leaf63 |
KOH |
2488 |
219 |
1 |
6 M KOH |
63 |
| Nostoc flagelliforme |
KOH |
2796 |
283 |
0.1 |
1 M H2SO4 |
Our work |
EIS has been conducted to get the dynamic information on the interface of electrode and electrolyte (Fig. 8f, S3d and S5d†).68 No obvious semicircle was observed at the high-frequency region for NFAC-c, demonstrating a low charge transfer resistance.69 Furtherly, intercept at the real axis of impedance (Rs) was fitted by the equivalent circuit, which are in the following order: NFAC (0.85 Ω) > NFAC-b (0.91 Ω) > NFAC-a (0.74 Ω) > NFAC-c (0.73 Ω). It shows that NFAC-c has the best conductivity. The vertical line at low-frequency region is related to superior diffusion channels for electrolyte ions.70 The frequency as the function of imaginary capacitance is plotted in Fig. 8g. The imaginary capacitance reaches a peak at the operating frequency f0, which is the inverse of the constant time τ0.71 The constant time for NFAC, NFAC-a, NFAC-b, NFAC-c are 1.47 s, 1.78 s, 1.47 s, 1.21 s respectively. This implies that NFAC-c has the rapid frequency response.72 The NFAC-c based supercapacitor shows 101.7% capacitance retention after 10![[thin space (1/6-em)]](https://www.rsc.org/images/entities/char_2009.gif) 000 GCD cycles at the current density of 1.0 A g−1 (Fig. 8h). This result can be ascribed to the further wetting electrode, which facilitate ions to intercalate into and out of the micropores.73,74 As shown in the inset of Fig. 8h, the GCD curves still remain symmetric and undistorted after long-term charging/discharging process, suggesting a remarkable stability.
000 GCD cycles at the current density of 1.0 A g−1 (Fig. 8h). This result can be ascribed to the further wetting electrode, which facilitate ions to intercalate into and out of the micropores.73,74 As shown in the inset of Fig. 8h, the GCD curves still remain symmetric and undistorted after long-term charging/discharging process, suggesting a remarkable stability.
Considering that the high stability window can be attained in neutral solution. It is beneficial to obtain the high energy density for supercapacitors. So we assembled symmetric supercapacitors by employing two same NFAC-c electrodes in 1 M Na2SO4 aqueous electrolyte. Fig. 9a shows the CV curves of the NFAC-c//NFAC-c symmetric supercapacitors operated in different voltage windows (1–1.8 V) at 50 mv s−1. It is clear the loop displays a rectangular-like shape without obvious increase of anodic current even at 1.6 V, suggesting an ideal capacitive behavior and excellent reversibility. However, further extending the potential to 1.8 V, the current at high potential increased drastically due to the oxygen and hydrogen evolution reaction, demonstrating that such supercapacitor can be reversibly cycled within the voltage window of 0–1.6 V. The wide working voltage is probably due to that the neutral electrolyte such as Na2SO4 aqueous solution (1.0 M) only contains low H+ and OH− concentration.75 In addition, the 3D interconnected porous structure can also enlarge the voltage window. The hierarchical porosities provide effective pathway for H+/OH− transportation, hence preventing di-hydrogen evolution in electrolyte.50 Furthermore, the extended voltage window also attributed to the existence of oxygen-containing functional groups introduced by KOH activation process.46 Fig. 9b presents the GCD curves of NFAC-c at various current densities. The charge–discharge curves show isosceles triangles shapes, indicating good reversibility. Fig. 9c shows the specific capacitance of NFAC-c at various current densities. When the current density is 1 A g−1, it reaches 191 F g−1. When the current density is 10 A g−1, it retained at 143 F g−1. Fig. 9d is a Ragone diagram. It exhibits an energy density of 22 W h kg−1 at a power density of 80 W kg−1, which is higher or comparable with other published results of carbon-based supercapacitors.9,61,76–80 Furthermore, the assembled NFAC-c//NFAC-c supercapacitors could successfully light LED bulb with 1.5 V working potential (inset of Fig. 9d). This confirms the feasibility of actual energy storage application.
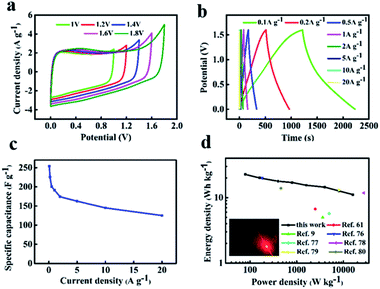 |
| | Fig. 9 Electrochemical measurements of the assembled NFAC-c//NFAC-c supercapacitor in 1 M Na2SO4 electrolyte: (a) CV curves in various potential window at a scan rate of 50 mV s−1. (b) GCD curves at different current densities. (c) Specific capacitances at different current densities. (d) Ragone plot. The inset is the lightened LED light. | |
4.3 Numerical simulation and analysis of ANN model
Structural parameters of carbon materials have a strong effect on capacitance performance, but it has still not come to an agreement as for structure–performance relationship for supercapacitors. As depicted in Fig. 10, we recorded experimental data in the literatures. The structural features of our sample (NFAC-x) were specially displayed with black dots in every scatter diagram. There is no simple linear relationship or obvious tendency between them. For example, single specific surface area corresponds to multiple specific capacitances. The same phenomenon exists for N (%), Dave, Vtot, etc. It indicates that individual feature is not enough to reveal the complex structure–performance relationship. Regarding to this matter, ANN method was conducted to analyze the data in a feasibility way. The weight matrix between ten input neurons and ten hidden neurons, ten hidden neutrons and one output neutron are recorded in Table 3. Weight matrices as for other number of input neurons (2 and 8) are recorded in Tables S1 and S2,† respectively. They are barely updated after 1000 epochs when the MSE doesn't decrease anymore. Essentially, weight can be acted as the link between the neurons of hidden layers, which makes indirect relationship between input layer and output layer.
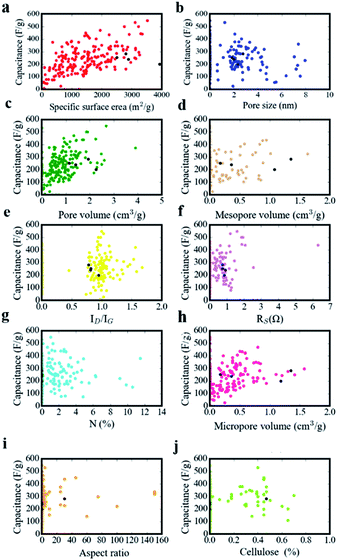 |
| | Fig. 10 The relation between specific capacitance and (a) specific surface area, (b) pore size, (c) pore volume, (d) mesopore volume, (e) the intensity ratio of ID/IG, (f) Rs (g) N-doping amount, (h) micropore volume, (i) aspect ratio, (j) cellulose amount. | |
Table 3 Diagram of interconnected weights of neutrons in input, hidden and output layera
| |
H1 |
H2 |
H3 |
H4 |
H5 |
H6 |
H7 |
H8 |
H9 |
H10 |
| H: hidden layer; I1: input layer 1-rL/D; I2: input layer 2 − CL (%); I3: input layer 3 − SBET; I4: input layer 4 − Dave; I5: input layer 5 − Vtot; I6: input layer 6 − Vmic; I7: input layer 7 − Vmes; I8: input layer 8 − ID/IG; I9: input layer 9 − Rs; I10: input layer 10 − N (%); O: output layer. |
| I1 |
−11.8 |
−3.0 |
−38.7 |
1.49 |
−18.2 |
−2.0 |
−5.9 |
12.5 |
−1.8 |
−43.7 |
| I2 |
9.7 |
−1.8 |
−51.2 |
−1.1 |
5.6 |
−15.1 |
−5.2 |
11.3 |
1.4 |
−18.5 |
| I3 |
−76.0 |
−1.12 |
9.5 |
3.5 |
−36.0 |
−5.8 |
−19.8 |
−4.3 |
−2.1 |
−28.1 |
| I4 |
3.0 |
−1.5 |
−1.1 |
15.9 |
2.4 |
15.0 |
−3.6 |
9.9 |
−2.2 |
−1.9 |
| I5 |
−9.9 |
−1.3 |
0.001 |
1.4 |
2.9 |
−12 |
−24.9 |
−0.4 |
−1.5 |
−33.2 |
| I6 |
−12.8 |
−2.0 |
−14.6 |
2.0 |
−3.3 |
17.6 |
−15.7 |
−4.7 |
0.5 |
10.1 |
| I7 |
23.2 |
−2.4 |
−5.9 |
12.2 |
18.6 |
−6.2 |
7.9 |
−10.8 |
−88.6 |
18.5 |
| I8 |
23.6 |
−2.4 |
−2.2 |
3.4 |
3.4 |
−1.4 |
7.5 |
15.0 |
−1.2 |
−4.4 |
| I9 |
36.6 |
−3.7 |
−46.8 |
60.9 |
29.7 |
19.5 |
−40.8 |
−8.9 |
−2.7 |
17.0 |
| I10 |
40.7 |
−2.1 |
15.1 |
20.4 |
−26.0 |
5.1 |
−2.4 |
2.5 |
−3.2 |
−15.0 |
| O |
28.9 |
−28.5 |
−31.1 |
27.9 |
−33.3 |
−30.3 |
−28.5 |
29.1 |
−27.1 |
−31.6 |
The quantification assessment of ANN is carried out by calculating MSE and correlation coefficient (r2) between desired output and estimated output provided by ANN model.81 Fig. 11(a) shows MSE during training process as a function of epochs. The MSE is reduced from 81.90 to 4.39 after 1000 iteration epochs perfectly. Furthermore, there is a sharp convergence (MSE from 81.90 to 12.85) during the first 300 epochs, however a very slow improvement (MSE from 12.82 to 4.39) as epochs increased beyond 300. When the input factors were changed to 2 and 8, MSE can be reduced to 6.38 and 5.50, respectively (Fig. S7a and S8a†). The smaller MSE is, the closer the real value to predicted value. These results indicate that the attributes of biomass and the structure of activated carbon jointly affect the capacitance. In other words, ANN model can well weigh the relative contributions of these 10 factors to the energy storage property. Correlation coefficient (r2) is a number between 0 and 1. It can be calculated by eqn (16):82
| | |
r2 = 1 − ∑(ydi − ypi)2/∑(ydi − ȳ)2
| (16) |
where
ypi is the
ith value predicted from the ANN model,
ydi is the
ith desired value.
ȳ denotes the arithmetic mean of the
ydi. The zero or very low value means that the ANN model does not predict correctly. If the ability of ANN prediction is high, the correlation coefficient increases and reaches to 1 for perfect fitting.
83 The correlation coefficient is approximately 0.896 and 0.864 for training data and validation data respectively. They are so closed to 1, which further confirms appropriate ANN modelling for biomass-derived active carbon in supercapacitors.
Fig. 11b shows the experimental value compared with predicted value from the test subset (twenty samples) which not appeared in training process. By comparing two groups of values, it could not only be seen that the overall change tendency of experimental values is consistent to the predicted one, but also error was limited to tolerable range excluding a few outliers. However, when the input factors involve two attributes of biomass itself, only two predicted value can be obtained by ANN model (Fig. S7b
†). The sensitivity of the output to the inputs is poor. Similarly, when the input factors contain 8 kinds of structure characteristics from activated carbon, the prediction effect became better than that of the former. Due to the varying of input, the output changes correspondingly. However, there are still some predicted values that are far from the real ones (Fig. S8b
†). Therefore, when the input factors contain both the attribute of biomass and the structure information of activated carbon, the prediction of ANN model is the most accurate. The trained model was further used in predicting the electrochemical performance in NFAC-c with multi-input features. From EDS data analysis, it can be obtained that the prepared sample is not incorporated nitrogen into carbon materials. So the value of nitrogen content (N (%)) was initialed by zero. Because ANN has the characteristic of randomness, we run program for 8 times to observe the stability of the prediction value. As shown in
Fig. 11c, they were recorded as 313, 319, 274, 281, 258, 287, 255, 315 F g
−1 respectively. The average value is 289 F g
−1, which is very closed to the real capacitance value (283 F g
−1). These figures show ANN model can provide a valuable guidance for predicting energy storage information of active carbon materials with specific structure. The final output is determined by interconnected weights and activation functions. In order to evaluate relative importance for every feature, we used a random forest algorithm. As presented in
Fig. 11d, the relative importance to specific capacitance is ranked in the descending order. It can be obtained that first 3 features play an important role in the prediction model. The detailed proportion is listed in
Table 4.
SBET accounts for 30.1% importance.
RS accounts for 19.4% importance.
Vtot accounts for 18.7% importance. It is reasonable for specific surface area to occupy such large importance proportion. Large specific surface area has long been the goal for researchers to realize high specific capacitance, which can enable the electrode material to provide enough contact area to absorb electrolyte ions, thus storing more charge.
27 It is known that the electrical conductivity is crucial for obtaining the high rate capability and power density.
84 At the same time, the materials with high total pore volume show better performance as ion reservoir or transport channels during charging/discharging process, thus improving the rate capability.
85 We also found that mesopores have a more important role than micropores to energy storage. It is exactly consistent with our experimental results. For the attribute of biomass itself, the aspect ratio has a greater impact than the cellulose content on the capacitance. Therefore, it is a key issue to explore a kind of biomass with appropriate aspect ratio as well as the relationship between precursor and activated carbon in the future. The figure also shows that the feature like N (%),
Dave,
ID/
IG has lower relative importance comparing with other structure features.
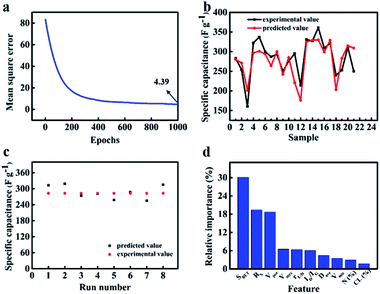 |
| | Fig. 11 The prediction effect of ANN model controlled by ten inputs (rL/D, CL (%), SBET, Dave, Vpor, Vmic, Vmes, ID/IG, Rs, N (%)): (a) mean square error as epochs of the ANN model. (b) Comparison of experimental and predicted value of test set for specific capacitance. (c) The specific capacitance of NFAC-c predicted by ANN model for eight times. (d) The relative importance of inputs to output. | |
Table 4 The relative importance of inputs to outputa
| F |
SBET |
RS |
Vpor |
Vmes |
rL/D |
ID/IG |
Dave |
Vmic |
N (%) |
CL (%) |
| F: feature; RI: relative importance. |
| RI (%) |
30.1 |
19.4 |
18.7 |
6.5 |
6.4 |
6.1 |
4.4 |
3.5 |
2.9 |
1.7 |
5. Conclusion
Active carbon with hierarchically porous structure was fabricated by effective method using a renewable source NF. Immersing into acidified NaClO2, acidified H2O2 and HF has improved the pore distribution of activated carbon to some extent. HF increases mesopore volumes of the sample. The specific capacitance was higher for the active carbon synthesized from three kinds of acid solution with strong oxidizing property. Under the optimized condition, the NFAC-c with porous structure shows specific capacitance as high as 283 F g−1 at a current density of 0.1 A g−1. The superior stability (101.7% capacitance retention after 10![[thin space (1/6-em)]](https://www.rsc.org/images/entities/char_2009.gif) 000 cycles) is exhibited in symmetric supercapacitor. Such excellent performance derived from unique structure. Much cellulose, fibers starch, polysaccharide in NF are in situ decomposed and oxidized, resulting in carbon sheet fluffy and porous. Furthermore, the dataset with more than 200 samples of biomass-carbon electrode was selected for training ANN model. A three-layer ANN with Levenberg–Marquart Back propagation algorithm has been employed to predict the specific capacitance of supercapacitor. The proposed ANN model being controlled by ten inputs shows a precise prediction of the experimental data with an excellent MSE of 4.39 and a high correlation coefficient of 0.864 after 1000 epochs. In a sense, the attributes of biomass are indirect factors affecting the supercapacitance behavior, while the structure of activated carbon is a direct one. They interact with each other and jointly determine the final electrochemical characteristics. Random forest algorithm successfully weights multiple inputs. SBET, Rs, Vtot play more important role among all variables on specific capacitance. The result suggests that the ANN can be used as an effective method for modelling of electrode samples, thus provides a guideline for adjusting ideal bio-carbon structure for supercapacitors in the future.
000 cycles) is exhibited in symmetric supercapacitor. Such excellent performance derived from unique structure. Much cellulose, fibers starch, polysaccharide in NF are in situ decomposed and oxidized, resulting in carbon sheet fluffy and porous. Furthermore, the dataset with more than 200 samples of biomass-carbon electrode was selected for training ANN model. A three-layer ANN with Levenberg–Marquart Back propagation algorithm has been employed to predict the specific capacitance of supercapacitor. The proposed ANN model being controlled by ten inputs shows a precise prediction of the experimental data with an excellent MSE of 4.39 and a high correlation coefficient of 0.864 after 1000 epochs. In a sense, the attributes of biomass are indirect factors affecting the supercapacitance behavior, while the structure of activated carbon is a direct one. They interact with each other and jointly determine the final electrochemical characteristics. Random forest algorithm successfully weights multiple inputs. SBET, Rs, Vtot play more important role among all variables on specific capacitance. The result suggests that the ANN can be used as an effective method for modelling of electrode samples, thus provides a guideline for adjusting ideal bio-carbon structure for supercapacitors in the future.
Conflicts of interest
There are no conflicts to declare.
Acknowledgements
This work was financially supported by the National Natural Science Foundation of China (No. 11774255) and the Key Project of Natural Science Foundation of Tianjin City (No. 17JCZDJ30100).
Notes and references
- Y. Sun and X. Yan, Sol. RRL, 2017, 1, 1700002 CrossRef.
- R. Liu, J. Wang, T. Sun, M. Wang, C. Wu, H. Zou, T. Song, X. Zhang, S. T. Lee, Z. L. Wang and B. Sun, Nano Lett., 2017, 17, 4240–4247 CrossRef CAS PubMed.
- L. Wei, M. Sevilla, A. B. Fuertes, R. Mokaya and G. Yushin, Adv. Energy Mater., 2011, 1, 356–361 CrossRef CAS.
- Y. Liu, Z. Xiao, Y. Liu and L. Fan, J. Mater. Chem. A, 2018, 6, 160–166 RSC.
- R. Thangavel, A. G. Kannan, R. Ponraj, V. Thangavel, D.-W. Kim and Y.-S. Lee, J. Mater. Chem. A, 2018, 6, 17751–17762 RSC.
- R. P. Panmand, P. Patil, Y. Sethi, S. R. Kadam, M. V. Kulkarni, S. W. Gosavi, N. R. Munirathnam and B. B. Kale, Nanoscale, 2017, 9, 4801–4809 RSC.
- C. Chen, D. Yu, G. Zhao, B. Du, W. Tang, L. Sun, Y. Sun, F. Besenbacher and M. Yu, Nano Energy, 2016, 27, 377–389 CrossRef CAS.
- J. Zhao, Y. Li, G. Wang and W. Tong, J. Mater. Chem. A, 2017, 5, 23085–23093 RSC.
- Q. Zhang, K. Han, S. Li, M. Li, J. Li and K. Ren, Nanoscale, 2018, 10, 2427–2437 RSC.
- S.-Y. Lu, M. Jin, Y. Zhang, Y.-B. Niu, J.-C. Gao and C. M. Li, Adv. Energy Mater., 2018, 8, 1702545 CrossRef.
- S. Dong, X. He, H. Zhang, X. Xie, M. Yu, C. Yu, N. Xiao and J. Qiu, J. Mater. Chem. A, 2018, 6, 15954–15960 RSC.
- C. Wang, D. Wu, H. Wang, Z. Gao, F. Xu and K. Jiang, J. Mater. Chem. A, 2018, 6, 1244–1254 RSC.
- Y. Zhang, H. Jiang and Q. Wang, Appl. Surf. Sci., 2018, 447, 876–885 CrossRef CAS.
- W. Du, X. Wang, X. Ju, K. Xu, M. Gao and X. Zhang, J. Electroanal. Chem., 2017, 802, 15–21 CrossRef CAS.
- J. Cui, Y. Xi, S. Chen, D. Li, X. She, J. Sun, W. Han, D. Yang and S. Guo, Adv. Funct. Mater., 2016, 26, 8487–8495 CrossRef CAS.
- B. Guijarro-Berdinas, B. P. Sánchez and O. F. Romero, Artif. Intell. Rev., 2018, 49, 281–299 CrossRef.
- T. Weigert, Q. Tian and K. Lian, J. Power Sources, 2011, 196, 4061–4066 CrossRef CAS.
- M. R. Dileep and A. Danti, Appl. Artif. Intell., 2018, 32, 281–292 CrossRef.
- U. Grömping, Am. Stat., 2009, 63, 308–319 CrossRef.
- S. Boonprong, C. Cao, W. Chen and S. Bao, Remote Sens., 2018, 10, 3–15 Search PubMed.
- A. Elmouwahidi, J. Castelo-Quibèn, J. F. Vivo-Vilches, A. F. Pèrez-Cadenas, F. G. Maldonado-Hòdar and F. Carrasco-Marìn, Chem. Eng. J., 2018, 1835–1841 CrossRef CAS.
- P. Yu, Z. Zhang, L. Zheng, F. Teng, L. Hu and X. Fang, Adv. Energy Mater., 2016, 6, 160111 Search PubMed.
- M. Wang, T. Wang, P. Cai and X. Chen, Small Methods, 2019, 1900025–1900032 CrossRef.
- A. A. Hameed, B. Karlik and M. S. Salman, Knowl. Based Syst., 2016, 114, 79–87 CrossRef.
- N. Abolhassani Monfared, N. Gharib, H. Moqtaderi, M. Hejabi, M. Amiri, F. Torabi and A. Mosahebi, J. Power Sources, 2006, 158, 932–935 CrossRef CAS.
- M. R. G. Marques, J. Wolff, C. Steigemann and M. A. L. Marques, Phys. Chem. Chem. Phys., 2019, 21, 6506–6516 RSC.
- Y. Wang, Y. Song and Y. Xia, Chem. Soc. Rev., 2016, 45, 5925–5950 RSC.
- C. Zhao, Y. Huang, C. Zhao, X. Shao and Z. Zhu, Electrochim. Acta, 2018, 291, 287–296 CrossRef CAS.
- A. R. Reed and P. T. Williams, Int. J. Energy Res., 2004, 28, 131–145 CrossRef CAS.
- R. Biswas, H. Uellendahl and B. K. Ahring, BioEnergy Res., 2015, 8, 1101–1116 CrossRef CAS.
- Z. Yang and Y. Lin, Eng. Computation., 2018, 35, 1625–1638 CrossRef.
- T. D. Dongale, K. P. Patil, S. R. Vanjare, A. R. Chavan, P. K. Gaikwad and R. K. Kamat, J. Comput. Sci., 2015, 11, 82–90 CrossRef.
- J. N. Marie-Francoise, H. Gualous and A. Berthon, IEE Proc. Elec. Power Appl., 2006, 153, 255–262 CrossRef.
- Y. LeCun, Y. Bengio and G. Hinton, Nature, 2015, 521, 436–444 CrossRef CAS PubMed.
- M. A. Mohammed, M. K. Abd Ghani, N. Arunkumar, R. I. Hamed, M. K. Abdullah and M. A. Burhanuddin, Future Gener. Comput. Syst., 2018, 89, 539–547 CrossRef.
- M. Jahangoshai Rezaee, M. Jozmaleki and M. Valipour, Phys. A, 2018, 489, 78–93 CrossRef.
- A. Eddahech, O. Briat, M. Ayadi and J.-M. Vinassa, Electr. Power Syst. Res., 2014, 106, 134–141 CrossRef.
- H. L. Ishwaran and M. Lu, Stat. Med., 2019, 38, 558–582 CrossRef PubMed.
- K. J. Archer and R. V. Kimes, Comput. Stat. Data Anal., 2008, 52, 2249–2260 CrossRef.
- Q. Zhao, L. Su, Z. Shi, P. Ling, N. Yan, C. Gu and Z. Shi, IoPARTS, 2018, 60–65 CAS.
- W. Chen, S. Zhang, R. Li and H. Shahabi, Sci. Total Environ., 2018, 644, 1006–1018 CrossRef CAS PubMed.
- S. K. S. Fan, C. J. Su, H. T. Nien, P. F. Tsai and C. Y. Cheng, Soft Computing, 2017, 22, 5707–5718 CrossRef.
- B. Zhu, B. Liu, C. Qu, H. Zhang, W. Guo, Z. Liang, F. Chen and R. Zou, J. Mater. Chem. A, 2018, 6, 1523–1530 RSC.
- E. Raymundo-Piñero, M. Cadek and F. Béguin, Adv. Funct. Mater., 2009, 19, 1032–1039 CrossRef.
- H. Yin, B. Lu, Y. Xu, D. Tang, X. Mao, W. Xiao, D. Wang and A. N. Alshawabkeh, Environ. Sci. Technol., 2014, 48, 8101–8108 CrossRef CAS PubMed.
- Y. Li, G. Wang, T. Wei, Z. Fan and P. Yan, Nano Energy, 2016, 19, 165–175 CrossRef CAS.
- A. K. Mondal, K. Kretschmer, Y. Zhao, H. Liu, H. Fan and G. Wang, Microporous Mesoporous Mater., 2017, 246, 72–80 CrossRef CAS.
- Q. Yao, H. Wang, C. Wang, C. Jin and Q. Sun, ACS Sustainable Chem. Eng., 2018, 6, 4695–4704 CrossRef CAS.
- D.-W. Wang, F. Li, M. Liu, G. Q. Lu and H.-M. Cheng, Angew. Chem., 2008, 120, 379–382 CrossRef.
- X. L. Su, M. Y. Cheng, L. Fu, J. H. Yang, X. C. Zheng and X. X. Guan, J. Power Sources, 2017, 362, 27–38 CrossRef CAS.
- J. Shao, F. Ma, G. Wu, C. Dai, W. Geng, S. Song and J. Wan, Chem. Eng. J., 2017, 321, 301–313 CrossRef CAS.
- L. Zhi, T. Li, H. Yu, S. Chen, L. Dang, H. Xu, F. Shi, Z. Liu and Z. Lei, Carbon, 2017, 113, 100–107 CrossRef CAS.
- R. Wang, D. Jin, Y. Zhang, S. Wang, J. Lang, X. Yan and L. Zhang, J. Mater. Chem. A, 2017, 5, 292–302 RSC.
- Y. Zhang, S. Liu, X. Zheng, X. Wang, Y. Xu, H. Tang, F. Kang, Q.-H. Yang and J. Luo, Adv. Funct. Mater., 2017, 27, 1604687 CrossRef.
- W. Liu, G. Liu, Q. Kou and S. Xiao, RSC Adv., 2017, 7, 33875–33882 RSC.
- D. Kang, Q. Liu, J. Gu, Y. Su, Z. Wang and D. Zhang, ACS Nano, 2015, 9, 11225–11233 CrossRef CAS PubMed.
- I. I. G. Inal, S. M. Holmes and E. Yagmur, J. Ind. Eng. Chem., 2018, 61, 124–132 CrossRef.
- X. Tian, H. Ma, Z. Li, S. Yan, L. Ma, F. Yu, G. Wang, X. Guo, Y. Ma and C. Wong, J. Power Sources, 2017, 359, 88–96 CrossRef CAS.
- R. Wang, P. Wang, X. Yan, J. Lang, C. Peng and Q. Xue, ACS Appl. Mater. Interfaces, 2012, 4, 5800–5806 CrossRef CAS PubMed.
- C. Wang, D. Wu, H. Wang, Z. Gao, F. Xu and K. Jiang, J. Colloid Interface Sci., 2018, 523, 133–143 CrossRef CAS PubMed.
- J. Liu, H. Li and H. Zhang, J. Solid State Electrochem., 2017, 257, 64–71 CrossRef.
- H. Wei, H. Chen, N. Fu, J. Chen and G. Lan, Electrochim. Acta, 2017, 203, 403–411 CrossRef.
- J. Wan, S. Qu, C. Dai, T. Jin and F. Ma, J. Alloys Compd., 2018, 751, 107–116 CrossRef.
- J. Xia, N. Zhang, S. Chong, D. Li, Y. Chen and C. Sun, Green Chem., 2018, 20, 694–700 RSC.
- F. Xu, Z. Tang, S. Huang, L. Chen, Y. Liang, W. Mai, H. Zhong, R. Fu and D. Wu, Nat. Commun., 2015, 6, 7221 CrossRef PubMed.
- S. Han, D. Wu, S. Li, F. Zhang and X. Feng, Adv. Mater., 2014, 26, 849–864 CrossRef CAS.
- C. Chen, D. Yu, G. Zhao, B. Du, W. Tang, L. Sun, Y. Sun, F. Besenbacher and M. Yu, Nano Energy, 2016, 27, 377–389 CrossRef CAS.
- W. Yu, H. Wang, S. Liu, N. Mao, X. Liu, J. Shi, W. Liu, S. Chen and X. Wang, J. Mater. Chem. A, 2016, 4, 5973–5983 RSC.
- L. Chen, T. Ji, L. Mu and J. Zhu, Carbon, 2017, 111, 839–848 CrossRef CAS.
- Z. Li, L. Zhang, B. S. Amirkhiz, X. Tan, Z. Xu, H. Wang, B. C. Olsen, C. M. B. Holt and D. Mitlin, Adv. Energy Mater., 2012, 2, 431–437 CrossRef CAS.
- M. Biswal, A. Banerjee, M. Deo and S. Ogale, Energy Environ. Sci., 2013, 6, 1249–1259 RSC.
- D. Yu, C. Chen, Z. Li, Y. Sun and G. Zhao, ChemSusChem, 2018, 11, 1678–1685 CrossRef CAS PubMed.
- Z.-Y. Jin, A. H. Lu, Y.-Y. Xu, J.-T. Zhang and W.-C. Li, Adv. Mater., 2014, 26, 3700–3705 CrossRef CAS.
- J. Yan, C. E. Ren, K. Maleski, C. B. Hatter, B. Anasori, P. Urbankowski, A. Sarycheva and Y. Gogotsi, Adv. Funct. Mater., 2017, 27, 1701264 CrossRef.
- W. Zhang, H. Lin, Z. Lin, J. Yin, H. Lu, D. Liu and M. Zhao, ChemSusChem, 2015, 8, 2114–2122 CrossRef CAS PubMed.
- B. Liu, Y. Liu, H. Chen, M. Yang and H. Li, J. Power Sources, 2017, 341, 309–317 CrossRef CAS.
- Y. Huang, Y. Liu and G. Zhao, J. Mater. Sci., 2017, 52, 478–488 CrossRef CAS.
- M. Wahid, D. Puthusseri and D. Phase, Energy Fuels, 2014, 28, 4233–4240 CrossRef CAS.
- Y. Huang, L. Peng, Y. Liu, G. Zhao, J. Y. Chen and G. Yu, ACS Appl. Mater. Interfaces, 2016, 8, 15205–15215 CrossRef CAS PubMed.
- H. Feng, H. Hu, H. Dong, Y. Xiao, Y. Cai, B. Lei, Y. Liu and M. Zheng, J. Power Sources, 2016, 302, 164–173 CrossRef CAS.
- A. Zamaniyana, F. Joda, A. Behroozsarand and H. Ebrahimi, Int. J. Hydrogen Energy, 2013, 38, 6289–6297 CrossRef.
- A. H. A. Al-Waeli, K. Sopian, J. H. Yousif, H. A. Kazem, J. Boland and M. T. Chaichan, Energy Convers. Manage., 2019, 186, 368–379 CrossRef.
- F. Yang, H. Zhang, X. Hou, Y. Tian and Y. Xu, Energy, 2019, 175, 630–644 CrossRef.
- S. Gao, X. Li, L. Li and X. Wei, Nano Energy, 2017, 33, 334–342 CrossRef CAS.
- Z. Li, Z. Xu, X. Tan, H. Wang, C. M. B. Holt, T. Stephenson, B. C. Olsen and D. Mitlin, Energy Environ. Sci., 2013, 6, 871–875 RSC.
Footnote |
| † Electronic supplementary information (ESI) available. See DOI: 10.1039/c9ra01255a |
|
| This journal is © The Royal Society of Chemistry 2019 |
Click here to see how this site uses Cookies. View our privacy policy here.  Open Access Article
 *ab and
Lei Ma*a
![[thin space (1/6-em)]](https://www.rsc.org/images/entities/char_2009.gif) 000 cycles. Furthermore, in order to find the relationship between the biochar structure and electrochemical performance in supercapacitors, an artificial neural network (ANN) method is used for studying the complex synergy mechanism. The specific capacitance is modelled using various input factors like aspect ratio (rL/D), cellulose ratio (CL(%)), specific surface area (SBET), pore volume (Vtot), internal resistance (Rs) and so on. The Levenberg–Marquart back propagation algorithm with sigmoid and ReLu active function is adopted to train the model. Random forest is used to analyse the relative importance of every input factor on specific capacitance. Results show that the model can estimate the energy storage with a mean squared error of 4.39 for materials with specific structure. Importance analyses indicate the first three significant variables are SBET, Rs and Vpor. The ANN model can accurately predict the electrical properties of biomass-based carbon materials, and also provide guidance for the selection of energy storage materials in the future.
000 cycles. Furthermore, in order to find the relationship between the biochar structure and electrochemical performance in supercapacitors, an artificial neural network (ANN) method is used for studying the complex synergy mechanism. The specific capacitance is modelled using various input factors like aspect ratio (rL/D), cellulose ratio (CL(%)), specific surface area (SBET), pore volume (Vtot), internal resistance (Rs) and so on. The Levenberg–Marquart back propagation algorithm with sigmoid and ReLu active function is adopted to train the model. Random forest is used to analyse the relative importance of every input factor on specific capacitance. Results show that the model can estimate the energy storage with a mean squared error of 4.39 for materials with specific structure. Importance analyses indicate the first three significant variables are SBET, Rs and Vpor. The ANN model can accurately predict the electrical properties of biomass-based carbon materials, and also provide guidance for the selection of energy storage materials in the future.


![[thin space (1/6-em)]](https://www.rsc.org/images/entities/char_2009.gif) → 2K + 3H2 + 2K2CO3, subsequent decomposition of K2CO3 and reactions of K/K2CO3/CO2 with the carbon.58 Due to this unique microstructure, a specific capacitance of 283 F g−1 for NFAC-c can be obtained at a current density of 0.1 A g−1, which implies a higher performance than that of NFAC (200 F g−1), NFAC-a (239 F g−1) and NFAC-b (253 F g−1).
→ 2K + 3H2 + 2K2CO3, subsequent decomposition of K2CO3 and reactions of K/K2CO3/CO2 with the carbon.58 Due to this unique microstructure, a specific capacitance of 283 F g−1 for NFAC-c can be obtained at a current density of 0.1 A g−1, which implies a higher performance than that of NFAC (200 F g−1), NFAC-a (239 F g−1) and NFAC-b (253 F g−1).![[thin space (1/6-em)]](https://www.rsc.org/images/entities/char_2009.gif) 000 GCD cycles at the current density of 1.0 A g−1 (Fig. 8h). This result can be ascribed to the further wetting electrode, which facilitate ions to intercalate into and out of the micropores.73,74 As shown in the inset of Fig. 8h, the GCD curves still remain symmetric and undistorted after long-term charging/discharging process, suggesting a remarkable stability.
000 GCD cycles at the current density of 1.0 A g−1 (Fig. 8h). This result can be ascribed to the further wetting electrode, which facilitate ions to intercalate into and out of the micropores.73,74 As shown in the inset of Fig. 8h, the GCD curves still remain symmetric and undistorted after long-term charging/discharging process, suggesting a remarkable stability.![[thin space (1/6-em)]](https://www.rsc.org/images/entities/char_2009.gif) 000 cycles) is exhibited in symmetric supercapacitor. Such excellent performance derived from unique structure. Much cellulose, fibers starch, polysaccharide in NF are in situ decomposed and oxidized, resulting in carbon sheet fluffy and porous. Furthermore, the dataset with more than 200 samples of biomass-carbon electrode was selected for training ANN model. A three-layer ANN with Levenberg–Marquart Back propagation algorithm has been employed to predict the specific capacitance of supercapacitor. The proposed ANN model being controlled by ten inputs shows a precise prediction of the experimental data with an excellent MSE of 4.39 and a high correlation coefficient of 0.864 after 1000 epochs. In a sense, the attributes of biomass are indirect factors affecting the supercapacitance behavior, while the structure of activated carbon is a direct one. They interact with each other and jointly determine the final electrochemical characteristics. Random forest algorithm successfully weights multiple inputs. SBET, Rs, Vtot play more important role among all variables on specific capacitance. The result suggests that the ANN can be used as an effective method for modelling of electrode samples, thus provides a guideline for adjusting ideal bio-carbon structure for supercapacitors in the future.
000 cycles) is exhibited in symmetric supercapacitor. Such excellent performance derived from unique structure. Much cellulose, fibers starch, polysaccharide in NF are in situ decomposed and oxidized, resulting in carbon sheet fluffy and porous. Furthermore, the dataset with more than 200 samples of biomass-carbon electrode was selected for training ANN model. A three-layer ANN with Levenberg–Marquart Back propagation algorithm has been employed to predict the specific capacitance of supercapacitor. The proposed ANN model being controlled by ten inputs shows a precise prediction of the experimental data with an excellent MSE of 4.39 and a high correlation coefficient of 0.864 after 1000 epochs. In a sense, the attributes of biomass are indirect factors affecting the supercapacitance behavior, while the structure of activated carbon is a direct one. They interact with each other and jointly determine the final electrochemical characteristics. Random forest algorithm successfully weights multiple inputs. SBET, Rs, Vtot play more important role among all variables on specific capacitance. The result suggests that the ANN can be used as an effective method for modelling of electrode samples, thus provides a guideline for adjusting ideal bio-carbon structure for supercapacitors in the future.


