 Open Access Article
The missing small microplastics: easily generated from weathered plastic pieces in labs but hardly detected in natural environments†
Fangni
Du
a,
Huiwen
Cai
 a,
Lei
Su
a,
Wei
Wang
b,
Liwu
Zhang
a,
Lei
Su
a,
Wei
Wang
b,
Liwu
Zhang
 bc,
Chengjun
Sun
 d,
Beizhan
Yan
e and
Huahong
Shi
 *a
*a
aState Key Laboratory of Estuarine and Coastal Research, East China Normal University, Shanghai 200241, China. E-mail: hhshi@des.ecnu.edu.cn
bShanghai Key Laboratory of Atmospheric Particle Pollution and Prevention, Department of Environmental Science & Engineering, Fudan University, Shanghai 200433, China
cShanghai Institute of Pollution Control and Ecological Security, Shanghai 200092, China
dKey Laboratory of Marine Eco-environmental Science and Technology, Marine Bioresource and Environment Research Center, First Institute of Oceanography, Ministry of Natural Resources (MNR), Qingdao 266061, China
eLamont-Doherty Earth Observatory of Columbia University, Palisades, New York, USA
First published on 12th December 2023
Abstract
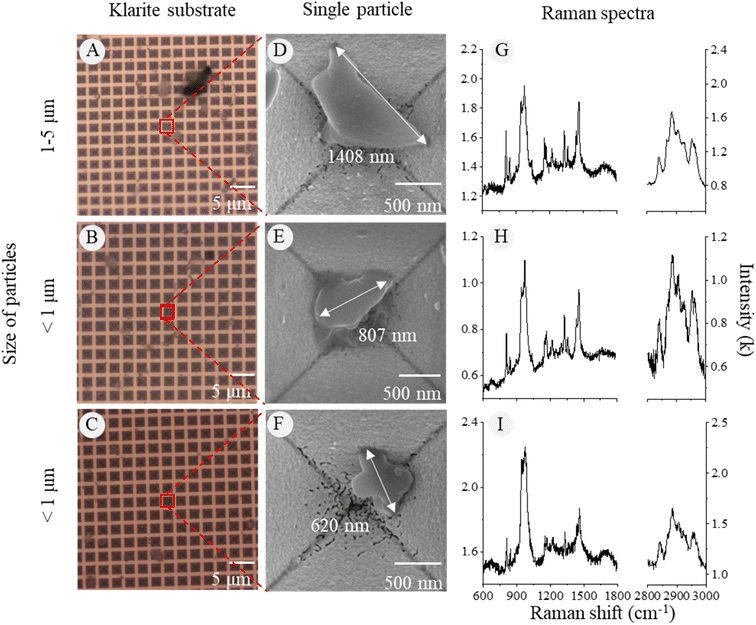
Small microplastics (SMPs, 1–20 μm) and nanoplastics (NPs, 1–1000 nm) are contaminants of high concern, but they were only documented in a few studies due to challenges during pre-treatment and characterization in environmental samples. In this study, weathered plastic pieces and surrounding sediments were collected from 3 areas of Yangtze Estuary, China. A top-down method was used to generate SMPs/NPs from plastic pieces using an ultrasonic cleaner in the lab, and the abundance and size distribution of SMPs/NPs generated, as well as those found from the surrounding sediments of the pieces in the field were measured and subsequently compared after verifying polymer types using Raman spectroscopy. The results revealed that each plastic piece generated an average of 3 × 10⁴ particles of MPs, and NPs with size down to 620 nm in lab samples. However, the number of SMPs found in surrounding sediments was almost 3 times lower than that generated from one plastic piece. Furthermore, the particle size ranges do not align with those generated in the lab. It indicated that smaller and more abundant SMPs/NPs could be generated from the weathered plastic pieces, but few SMPs were found in surrounding environments. We assume that the current sampling and identification methods limit the representativeness of samples and the accuracy of SMP/NP detection.
Environmental significanceThe presence of small microplastics (1–20 μm) and nanoplastics (<1 μm) in the environment is a major concern. Our study has shown that highly weathered plastics can generate a significant amount of small microplastics, and we have also identified nanoplastics. However, the abundance and size of microplastics in the highly polluted surrounding sediment were lower, indicating that the abundance of small microplastics and nanoplastics is underestimated. Therefore, it is essential to develop novel methods to overcome the significant detection barriers of SMPs/NPs. |
1 Introduction
Plastics, one of the greatest inventions in the last century, have been widely used in daily human life due to their excellent properties such as ease of production, light weight, high stability, and versatility.1 Unfortunately, ∼90% of consumed plastics have been discarded into the environment.2,3 Due to the effects of UV radiation and tides, large plastic waste in the aquatic system will be physically and chemically weathered into smaller pieces < 5 mm, including microplastics (MPs) and nanoplastics (NPs, < 1 μm).4,5 According to the pore size of filters used in conventional filtration, the diffraction limit of an infrared microscope, and the feasibility of conducting experiments, MPs can be further divided into large MPs (LMPs, > 20 μm) and small MPs (SMPs, 1–20 μm).6 It is worth noting that compared with LMPs, SMPs and NPs possess larger specific surface area and stronger adsorption capacity, which make them more prone to carrying more chemicals such as anthropogenic contaminants, natural organic matter, etc.2According to a theoretical 3D fragmentation process, the particle number of fragmented plastics is in reverse ratio to the third power of the diameter when the total weight is constant.7 In other words, the particle abundance of fragmented SMPs/NPs should be much higher than that of LMPs in the environment. Furthermore, the results of laboratory simulation prove that SMPs/NPs can be easily generated from a piece of LMP with a ball mill, shaker, ultrasonic cleaner, probe sonicator, and even hot water.8–11 In these reports, the generated particles have been successfully identified using novel instruments such as a scanning electron microscope-Raman spectroscopy (SEM-Raman spectroscopy) and gas chromatograph-mass spectrometer (GC-MS). However, there are fewer studies that detect SMPs/NPs in real field samples compared to LMPs according to the technique barrier as well as complex environmental matrices which could cause severe interference during the analysis process.12,13
Apparently, the results of model prediction and simulation experiments elaborated above have contradicted those found in field investigations. There are many explanations for this inconsistency, including quick degradation or transportation of SMPs/NPs which causes collected samples without SMPs/NPs, aggregation of particles which causes inefficient separation, identification difficulties, etc.9,14 A so-called top-down method can be used to pin down key reasons for the contradiction. The top-down approach involves analyzing pollution particles from the source of pollution, rather than those extracted from the environment. Herein, the pollutant source and pollution level in the surrounding environment will be analyzed and compared to reveal the potential changes during the detection process.
In this study, the top-down method was used to compare the abundance, size distribution, and polymer types of SMPs generated from plastic pieces with those found in surrounding sediments in coastal areas of the Yangtze Estuary, Shanghai, China. Herein, NPs generated from plastic pieces were identified using the surface-enhanced Raman scattering (SERS) technique. Our aims were to determine (1) if SMPs and NPs could be generated from pieces and their physicochemical features; (2) if comparable abundances of SMPs and NPs could be found in the surrounding sediments where the pieces were collected.
2 Methods and materials
2.1 Sampling of plastic pieces and surrounding sediments
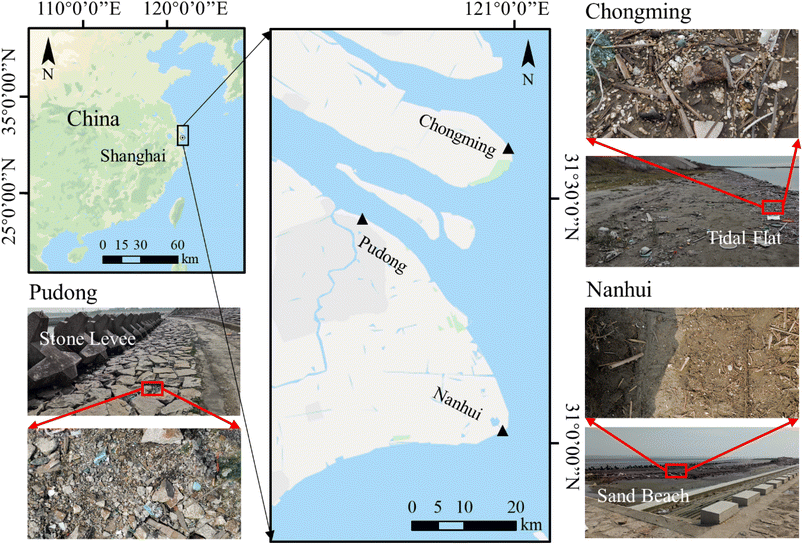
All plastic samples were collected in three areas along waterways in Shanghai, China from July to December 2020 (Fig. 1). These areas were classified as tidal flats (Chongming), stone dams (Pudong), and sand beaches (Nanhui). In each area, three sites were set. Highly weathered plastic pieces with a size of 1–5 cm were collected and kept in aluminum foil bags for laboratory analysis.In addition to the plastic pieces, we also collected surrounding sediment samples (a quadrat with a size of 25 cm × 25 cm) at each site (Fig. 1). The top layer of the sediment, up to 1–3 cm in depth, was scooped using a metal spoon.15 Stones and plant branches were removed from the surface of the sediments first, and big plastic pieces (bigger than 5 mm) were collected. After that, at least 300 g of sediment samples were collected and kept in an aluminum foil bag.
2.2 Generation of SMPs and NPs from plastic pieces
In the laboratory, the collected plastic pieces were put in a 200 mL beaker and immersed in ∼150 mL of 30% hydrogen peroxide. Then, the beaker was covered and placed in an incubator set to oscillate at 30 rpm and 25 °C for 30 minutes. After digestion, the pieces were taken out, dried in an oven at 50 °C and then observed under a stereomicroscope (Carl Zeiss Discovery V8, Micro Imaging GmbH, Gottingen, Germany). Since the plastic pieces are big in size, the chemical compositions of 2920 plastic pieces were verified using an ATR-FTIR (Nicolet iS 5N, Thermo Fisher Scientific Co., USA). The major types of plastics were PP (66.6%) and PE (28.7%). Six types of plastic pieces were selected according to their surface features and composition, i.e., four polypropylene (PP) and two polyethylene (PE) pieces. We used three similar pieces of each type for the representativeness of the data. The aging features of six types of plastics (18 in total) are shown in Table S1.† According to the surface figures, we measured the line density, surface loss, and irregular pattern, and then defined the crack feature of the six types of plastics. The selected pieces were kept in glass Petri dishes to avoid air contamination.After the weight measurement of each piece, an ultrasound treatment was used to simulate the process of environmental fragmentation. One piece was added into a 20 mL glass vial, along with ethanol (analytical reagent) in the ratio of 10–13 mL to 1 gram of plastic. Each glass vial was put into an ultrasonic cleaner (40 kHZ, 500 W, KQ-500E, Shumei, China) for 1 min to mimic the weathering process on plastics in a real environment.16 After drying at 50 °C, the solution was concentrated to ∼1 mL in volume and kept in a 1.5 mL glass vial. To obtain the size distribution and abundance of generated MPs/NPs, 50 μL of the concentrated solution was dropped on three replicate circular silicon wafers for each sample. Three procedural blanks were also prepared in the same way as plastic samples to correct the potential procedural contamination. The ethanol solution was filtered using 1 μm glass membrane to avoid contamination.
We also conducted an additional experiment to test the reliability of the ultrasound method. We selected six plastic pieces, including five PP and one PE, to compare the forces of ultrasound and oscillation. To ensure reliability and comparability, each piece was cut into two small parts and weighed. One plastic part was treated following the same process as described in the ultrasonic section. The other part was treated with an oscillator (2800 rpm min−1, VORTEX-5, Haimen Kylin-Bell Lab Instrument, China) for 1 minute. The oscillating time was the same as the ultrasound time, and the rotational speed was set based on ambient water velocity in the Yangzi River.
2.3 Extraction of MPs from sediment samples
To extract MPs and SMPs from sediments, we employed a flotation method using a saturated NaCl solution (1.202 g cm−3).17 At each sampling site, we collected 100 g of sediment and set three replicates and procedural blanks. In the sampling area, since PP and PE accounted for more than 90% of all verified pieces, and given the densities of PP (0.9 g cm−3) and PE (0.962 g cm−3), we compared the extraction efficiency of MPs and SMPs between saturated NaCl and NaBr (1.55 g cm−3) solutions (see the ESI for detailed procedures).† There is no significant difference between the two solvents. Considering the convenience of reagents, cost-effectiveness, and environmental friendliness, we selected NaCl as the flotation agent. Firstly, 100 g of sediment and 300 mL of saturated NaCl solution were put into a clean long glass cylinder with consistent upper and lower diameters (28.5 cm in height and 6.5 cm in diameter), and a magnetic stirrer was used to suspend MPs/NPs and separate sediment aggregations for 10 min. Then, the stirrer was removed, and the glass cylinder was left to stand for 48 hours. Secondly, the supernatant after separation was transferred to another glass cylinder for digestion using 200 mL of 30% hydrogen peroxide at room temperature for half an hour and then moved into an incubator for 24 hours at 65 °C, 50 rpm to remove organic matter. Finally, the solution was filtered using nylon filter membranes with pore sizes of 20 μm, 10 μm, and 5 μm (NY2004700, NY1004700, NY0504700, Millipore, USA) for the convenience of analysis. The filter membranes were kept in glass Petri dishes with covers for subsequent analysis.We used three air purifiers (6000V, Allerair, Canada) to control air quality in the laboratory during experiments. We also wore cotton lab coats and gloves and cleaned the glassware with Milli-Q water three times before use. To prevent contamination, we covered all the samples with aluminium foil.
2.4 Observation of particles using SEM
SEM was used to acquire high-quality images of piece surfaces and MPs/NPs. Twenty μL of the concentrated solution was transferred to the surface of the silicon wafer and optimized Klarite substrate using a pipette, respectively. The substrates were dried in an oven at 50 °C to remove any water content and then treated with gold sputtering. SMPs/NPs on the silicon wafer were imaged using a SEM (S-4800, Hitachi, Japan) at various magnifications (1 k–3.5 k×). Particles on the Klarite substrate were observed under another SEM (Regulus8100, Hitachi, Japan) at 20 k–45 k× magnification.2.5 Identification and quantification of MPs using a Raman microscope
The generated particles were first photographed with a stereomicroscope to obtain their general distribution on the silicon wafer. Then the silicon wafer was transferred to a Raman microscope (inVia Reflex, Renishaw, UK) to identify particles in a random area (2000 μm × 500 μm). Raman spectra were recorded in the range of 600–1200 cm−1, and a single spectrum was scanned 5 times with an integration of 2 s each scan. All spectra were set at 50× magnification using a 785 nm laser at a power of 28 mW. The Raman spectra were reasonably baseline calibrated to eliminate fluorescent background or noise to improve the accuracy of data analysis.18 The spectra of MPs were analyzed using several characteristic peaks. Seven most prominent peaks of PP at 809, 841, 1151, 1168, 1220, 1435, and 1458 cm−1 were used to characterize and calculate the peak signal-noise ratio (PSNR, eqn (1)).19,20 Characteristic peaks of PE were chosen at 1070, 1138, 1298, 1420, 1443, and 1464 cm−1.21,22 According to the identification results, the percentage and abundance of each type of generated MPs/NPs on the wafer were calculated and estimated. According to the calculation of the PSNR, each ratio was calculated to compare the spectrum quality which indicated the difficulty degree for analyzing each particle. The PSNR is defined as | (1) |
The particles separated from sediment samples were observed and identified on the filter membranes. To ensure a balance between data reliability and time expenditure, some researchers measured part of the area in the filter membrane for semi-quantization of the abundance of MPs.24,25 In this study, five small squares with a diameter of 5 mm were selected on each filter membrane (Fig. S1†). MPs with size >50 μm in the five squares were identified using a Raman microscope (DXR™ 3, Thermo Fisher Scientific Co., USA) at 20× magnification using a 785 nm laser at a power of 28 mW. The spectral range was set as 400–4000 cm−1. A single spectrum was scanned 4 times with an integration of 8 s each scan. MPs with size < 50 μm and NPs were detected in smaller areas (2000 μm × 500 μm) of the squares. They were identified using the same parameters on the Raman microscope for the generated SMPs/NPs above (inVia Reflex, Renishaw, UK). All particles were verified and counted in these five squares, and an estimated abundance of MPs/NPs in the sediment was calculated from the MP/NP percentage on the filter membranes. For details on the abundance calculation process of plastic fragments from plastic pieces and MPs/NPs in the sediment see the ESI.†
2.6 Identification of NPs using surface-enhanced Raman scattering (SERS)
In this study, the generated NPs from one type of plastic were analyzed on a Klarite substrate. It is a commonly used substrate that was designed as an inverted pyramid structure and coated with aurum (Au). The SERS technique provides an easy-to-use and rapid method to obtain the chemical information about NPs as a single nanoparticle situated in the “hotspots” of the Klarite substrate, which can reach up to >100 orders of magnitude of the enhanced signal. Meanwhile, the grids on the Klarite substrate can help locate particles after transferring the substrate to the Raman microscope. After SEM observation, the located NPs were identified using a Raman microscope (LabRAM HR Evolution, Horiba, French) at 100× magnification with a 532 nm laser at a power of 25 mW. The spectral ranges were set as 600–1800 and 2800–3000 cm−1 to shorten the scanning duration. And a single spectrum was scanned 4 times with integration of 10 s each scan.2.7 Statistical analysis
To determine the differences among the mean abundances of MPs from different weathered plastic pieces and sediment samples, the data were assessed for normality of residual distributions using the Shapiro–Wilk test (p > 0.05). As the mean abundances of MPs from plastic pieces and sediments followed a non-normal distribution, a Welch's ANOVA was used. The statistical analysis was performed using the SPSS 18.0 software (IBM Corp, Armonk, New York, USA).3 Results and discussion
3.1 MPs generated from weathered plastic pieces
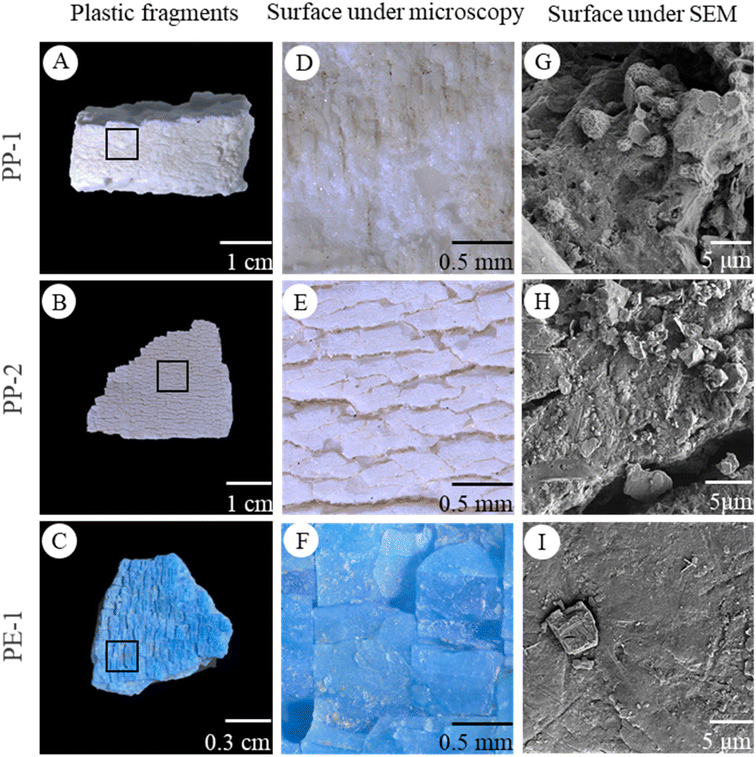
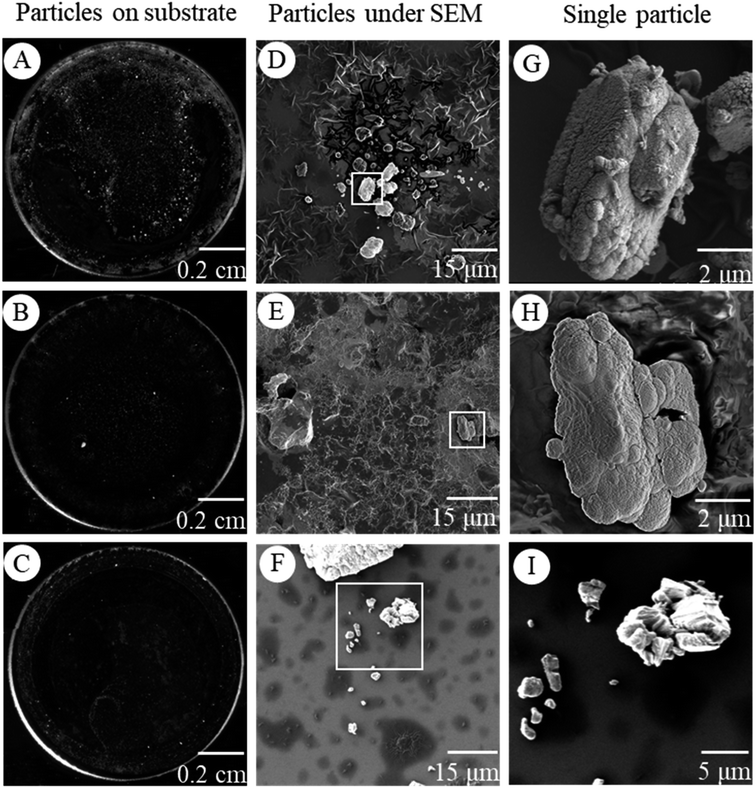
The plastic pieces found in natural environments exhibited a wide range of sizes, colors, and irregular shapes (Fig. 2A–C, S2†). They were categorized into 6 types according to their different polymer compositions and aging characters (Fig. S2, Table. S1†). Some plastic pieces had a rough surface (Fig. 2D). Others displayed deep lines and grooves (Fig. 2E and F). All of the plastics were highly weathered and had fragile surfaces to spall off small particles. The SEM images of plastic surfaces showed a large number of nearly spherical and irregular particles with a size of 1–5 μm. In addition, some nanoparticles were also observed on the surface (Fig. 2G–I, S2†).After the ultrasonic treatment of plastic pieces, particles generated from the weathered plastics were found on the silicon wafer (Fig. 3A–C). Under a SEM, it was obvious that some particles tended to gather or aggregate together (Fig. 3D–F). Higher magnification SEM images of the particles showed that the particles had irregular shapes and rough surfaces, and some smaller particles stuck on the larger particle surface. The size of the smaller particles was less than 10 μm or even in nano-size ranges (Fig. 3G–I).
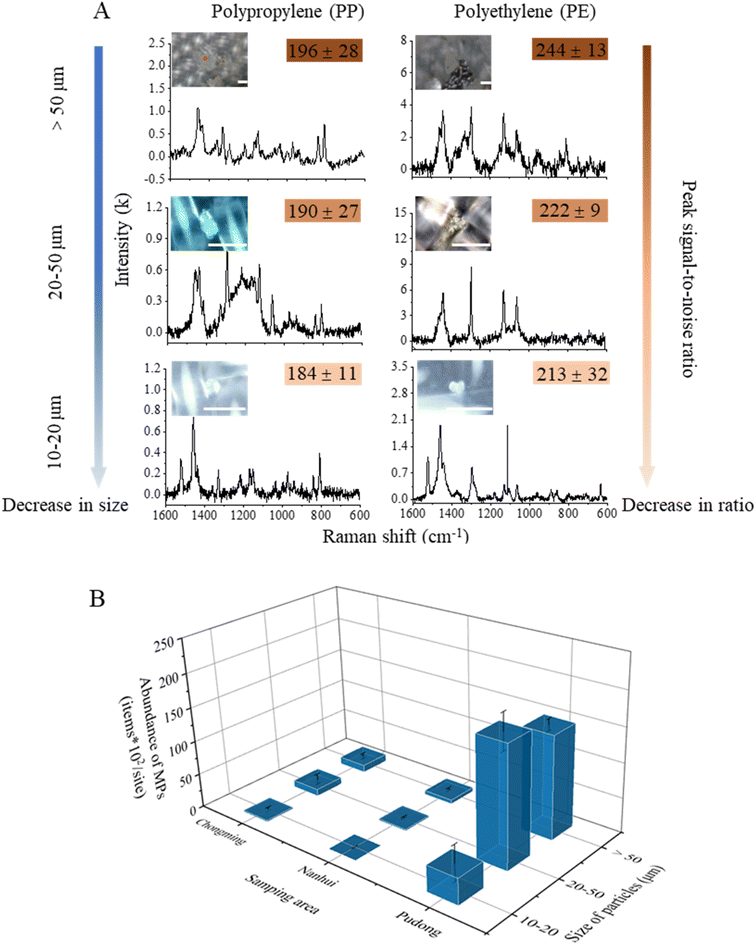
The Raman microscope analysis of the silicon wafers revealed the identification results of a total of 1682 particles, with 1128 particles confirmed to be MPs. The dominant polymer composition was PP (1045 particles), followed by PE (83 particles) (Fig. 4). The sizes of all the identified MPs ranged from 6 to 350 μm with a mean value of 41 μm, and were categorized into four size fractions (>50, 50–20, 20–10, and 10–5 μm). The quality of the spectra calculated from PP particles larger than 10 μm was significantly better than that of smaller particles, as the Raman signal intensity decreased with the decreasing of particle size (Fig. 4A–C). Furthermore, when the particle size gets smaller than the size of the laser spot, the signal of the silicon substrate increases and interferes with the particle signal, resulting in a decrease of the particle-to-substrate noise ratio (PSNR) (Fig. 4D and H). The particles with size down to 5 μm were barely detectable in the end.
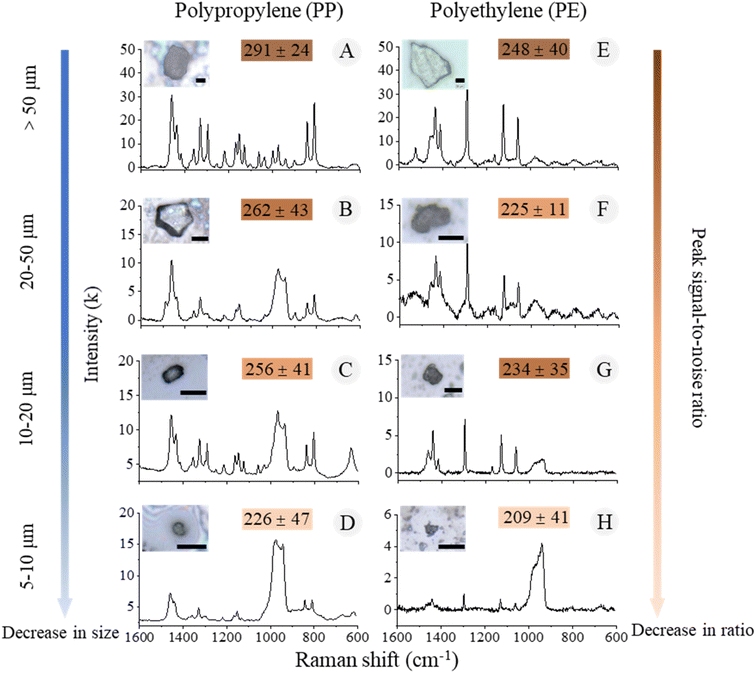 | ||
| Fig. 4 The morphological and chemical information of MPs in different size fractions. (A–D) PP particles; (E–H) PE particles. Scale bar = 20 μm. | ||
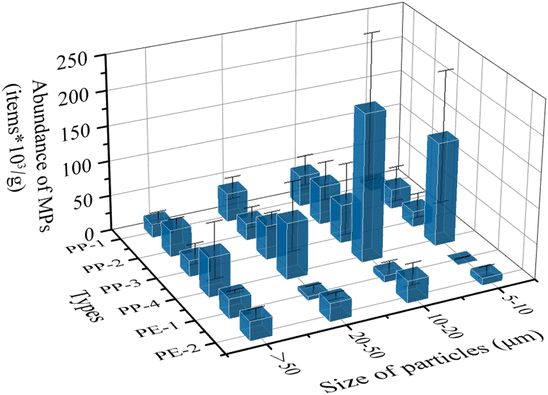
Based on the weight of each plastic piece and verification of polymer types, the abundances of MPs in different size fractions from 6 types of samples were calculated (Fig. 5). The dominant size fraction was 10–20 μm with an abundance of 6.73 × 10⁴ particles per g (particle number/each gram piece), followed by 20–50 μm (3.74 × 10⁴ particles per g), and 5–10 μm (3.58 × 10⁴ particles per g). The least abundant fraction was > 50 μm (3.17 × 10⁴ particles per g). Besides, the mean value of MP abundance from each plastic piece was 3.0 × 10⁴ particles. There was a significant difference between the abundances of PP and PE using a one-way analysis of variance (ANOVA) (p < 0.05). A potential explanation for this is PE tends to crack more strips on the surface than PP due to its lamella structure.26
The abundances of generated particles by ultrasound were 1.5 to 4 times higher than those by shaking, but their size distribution was similar to each other (Fig. S3†). The oscillation treatment used in the shaking method produced a flow velocity of 1.5 m s−1, which is comparable to the average velocity of 1.4 m s−1 in the Yangtze River estuary.27 The treatment of oscillation was similar to the force of water flow, but it should be noted that the process of plastic fragmentation is under multi-environmental forces and it will continue from years to decades. Therefore, the ultrasonic treatment was workable to simulate multi-environment forces on plastics in this study.
3.2 SMPs/NPs generated from weathered plastic pieces
Through the optical images of the Klarite substrate, we could observe the contour of microparticles and hotspots (Fig. 6A–C). To obtain specific surface features and corresponding chemical signals of the nanoparticles, we used the SEM to locate the particle and obtain high-quality images (Fig. 6D–F). The Raman signal of PP particles as small as 620 nm in diameter could be clearly detected on the Klarite substrate (Fig. 6G–I). In contrast, it was hard to obtain the Raman signal of PP particles less than 5 μm on the silicon wafer (Fig. S3†). The SERS technique can significantly increase the signal quality and spatial limit of Raman detection on nanoplastics.The spectra of 1–2 μm SMPs on the silicon wafer were of low quality but exhibited strong peaks at 800–1000 cm−1, which were distinguished as the characteristic peaks of the silicon substrate. Hence, no NPs were identified on the silicon wafer because of the strong substrate interference. Obviously, the use of the Klarite substrate increased the limit of detection of a Raman microscope to several hundreds of nanometers on weathered NPs from environmental samples. However, using the SERS technique is time-consuming for single-particle detection and numerous SERS substrates come with a notable cost, affecting the efficiency of the overall process.28,29 This was the reason why we only tested PP samples with SERS. Moreover, in this study, we found that some MPs were covered by impurities on the membranes after the traditional flotation extraction of sediment sampling. Therefore, the SERS technique was not applicable to the samples in complex matrices unless most of the impurities could be removed in the pretreatment step.
3.3 MPs in the sediments
In total, 2600 particles from the sediment samples were identified using Raman spectroscopy, and 587 of them were verified as MPs. The dominant polymer types were PP and PE, accounting for 89% of particles. We categorized MPs into three size fractions > 50, 50–20, and 20–10 μm (Fig. 7A). Among all MPs, the smallest fragment was 13.97 μm in size. The PSNR (peak signal-noise ratio) decreased with decreasing particle sizes (Fig. 7A). The abundances of MPs showed great variations among sediment samples (Fig. 7B). The abundance in the Pudong area (3.6 × 10⁴ particles/site) was significantly higher than those in Chongming (2.3 × 10³ particles per site) and Nanhui areas (784 particles per site) (p < 0.05). The size fraction of MPs larger than 50 μm accounted for nearly 50% at most sites.The type of sites (tidal flats near waterways, artificial stone levees, sand beaches) potentially affects the behavior and environmental fate of MPs.14 It is more possible for highly weathered plastic pieces to generate abundant MPs and NPs, which are supposed to fall into surrounding sediments. However, the artificial levee made of stones impedes the vertical transport of particles. This increases the possibility of plastic pieces gathering on the surface of the levee, undergoing extended exposure to weathering. Consequently, this process could lead to the creation of a greater number of SMPs/NPs on the levee.30,31 While the tidal flat and sand beach have more vertical transport channels than the stone levee, MPs and NPs on these surfaces could be transported to the subsurface or even to the water environment due to interactions with microorganisms, organic matter, and loose soils.14,32 These complex factors could be the reason which leads to the higher abundance of MPs at Pudong than at Chongming or Nanhui.
3.4 Underestimation of fragmented MPs in the environment
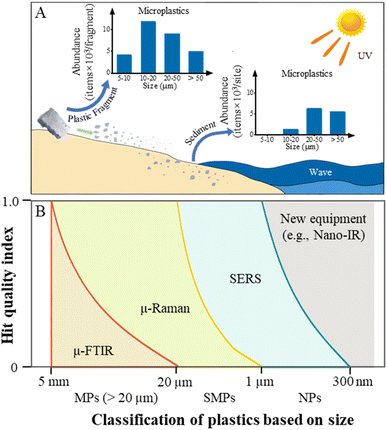
Over 90% of mismanaged large plastics are discarded in terrestrial environments (1% on the beach and 99% on other lands), which can be regarded as the most significant storage pool of plastic debris.33 Thus, it is highly possible to find SMPs and NPs in sediments in heavily plastic-contaminated sites. In this study, we found that the collected plastic pieces can generate a huge number of MPs under external pressure. Each plastic piece released more than 3 × 10⁴ MPs/NPs with a wide size fraction. However, we only found MPs (>10 μm) with a mean abundance of 1.3 × 10⁴ particles per site in sediment samples. Interestingly, the abundance and size distribution of MPs in the sediment samples surrounding the plastic pieces did not match those generated from the same plastic pieces (Fig. 8A). It is highly possible that the true abundance of MPs and NPs in sediment samples is greatly underestimated.However, the key reason causing the puzzle of underestimation of SMPs/NPs has not been clearly clarified yet. According to the assumption on the vertical transport of surface particles in Section 3.3, SMPs and NPs may “escape” from sampling at the very beginning. The small particles fragmented from the weathered plastics may be transported to another environment under wind power, hydraulic action, and bioturbation.14,32 Some reports suggest that the loss of small particles can also be attributed to the rapid degradation of NPs in the environment before sampling, as well as the inefficiency of separation and purification methods to effectively intercept and enrich SMPs/NPs from complicated aggregates in sediment samples.9,34 The results of this study demonstrate that the weathered plastic pieces could generate a huge number of non-active small particles. Additionally, a previous study shows that the large-scale distribution of plastic pieces is inclined to transport along the coastlines for at least 3 years.35 Throughout the fragmentation process, the spatial dispersion and momentary prevalence of MPs within the ambient environment undergo dynamic alterations. This signifies that each instance of sampling can solely encompass momentary results. The application of single-sampling continues to be confined to comprehending the processes of plastic fragmentation and dispersion. Nonetheless, this constraint pervades all prevalent field sampling methodologies.
Although MPs in the sediment can be collected, there is still a limitation in the process of MP extraction. After calculating the flotation efficiency of PS and PP spike standard particles, we found that there was no significant difference between the flotation agents of NaCl and NaBr. The average flotation rate was 94% for MPs and 7% for SMPs (Table S2†). The flotation agents can alter the surface charge of particles and the energy barrier among particles, subsequently leading to the increase of the aggregation kinetics among NPs or with sediments of small size.36 In other words, SMPs and NPs mixed with sand and clay tend to settle down in the bottle, making it harder to float them in the suspension. Besides, the filtration with three filters which is often used in sample processing, will also lead to procedure losses of MPs and SMPs. The complex pre-treatments seem to be unavoidable for reducing the difficulty of observation and identification of SMPs/MPs. A method with fewer pre-treatment steps and higher separation efficiency needs to be developed in future research.
Another challenge is to identify SMPs/NPs in such small sizes for chemical information. Even if they are successfully extracted, conventional Raman spectroscopy can be inadequate for identifying such small particles, especially those in real sediment samples. In previous research, vibrational spectroscopy was reported as a nondestructive method for obtaining the morphological and chemical information of a single particle at the same time.37 The restrictions of vibrational spectroscopy on detecting SMPs/NPs are (1) the diffraction limit of the laser which decides the spatial resolution, (2) the limit of detection of particle abundance on a substrate, and (3) the processing method when analyzing spectra. The lower size limit of μ-FTIR for MPs in environmental samples is about 20 μm in diameter. As a non-contact technique, the detection limit of μ-Raman can reach the size of ∼1 μm for SMPs in water samples.38 Raman spectroscopy coupled with super-resolution microscopes such as SEM is a novel way to locate and identify NPs, such as SEM-Raman, confocal Raman, and AFM-Raman. Nevertheless, the practical spatial resolution is still lower than the theoretical diffraction limit.39 To approach to smaller size in Raman detection, surface-enhanced and tip-enhanced Raman scattering techniques have been employed to increase the electric field intensity of nanoparticles down to ∼360 nm.9 In addition, new technology such as Nano-IR can be used to identify nanoparticles down to tens of nanometers, even a single molecule.40 Up to now, laboratory setups for the SMPs/NPs are still under development to meet the requirements of vibrational spectroscopy, which necessitates pure and highly concentrated samples. Meanwhile, the quantification analysis of vibrational spectroscopy is another barrier to the field investigation of SMPs/NPs. In a previous study, semi-quantitative methods have been used to estimate the abundance of SMPs and NPs based on the percentage of plastics in whole particles.24,25 The identification method should be improved for more efficient application in the field investigation of SMPs/NPs in future.
4 Conclusions
In summary, our study has revealed that the highly weathered plastic pieces collected from the field can generate a large number of MPs, and even NPs, under moderate external pressure. However, only lower abundance and larger size of plastic particles were found in the surrounding sediments. Such inconsistency indicates that there could be a great underestimation of SMPs and NPs in the real terrestrial environment. The limitation of analytical methods is a critical factor contributing to this underestimation. Therefore, it is imperative to conduct further research to understand the unique characteristics and environmental behavior of SMPs/NPs. Additionally, innovative methods need to be developed to overcome the significant detection barriers of SMPs/NPs in environmental samples.Author contributions
Fangni Du: Conceptualization, methodology, software, validation, formal analysis, investigation, resources, data curation, writing – original draft preparation, writing – review and editing, visualization; Huiwen Cai: methodology, software, validation, investigation, resources, writing – review and editing, visualization; Lei Su: software, formal analysis, writing – review and editing; Wei Wang: methodology; Liwu Zhang: methodology, writing – review and editing; Chengjun Sun: methodology, writing – review and editing, visualization; Beizhan Yan: writing – review and editing, visualization; Huahong Shi: conceptualization, writing – review and editing, supervision, project administration.Conflicts of interest
The authors declare there were no conflicts of interest in the creation of this study.Acknowledgements
This work was kindly supported by grants from the Natural Science Foundation of China (41776123 and 42176239) and the Research Funds of Happiness Flower, East China Normal University (2021ST2110).References
- A. L. Andrady, Microplastics in the marine environment, Mar. Pollut. Bull., 2011, 62, 1596–1605 CrossRef CAS.
- O. S. Alimi, J. Farner Budarz, L. M. Hernandez and N. Tufenkji, Microplastics and nanoplastics in aquatic environments: Aggregation, deposition, and enhanced contaminant transport, Environ. Sci. Technol., 2018, 52, 1704–1724 CrossRef CAS.
- X. Zhao, M. Korey, K. Li, K. Copenhaver, H. Tekinalp, S. Celik, K. Kalaitzidou, R. Ruan, A. J. Ragauskas and S. Ozcan, Plastic waste upcycling toward a circular economy, Chem. Eng. J., 2022, 428, 131928 CrossRef CAS.
- M. A. Browne, P. Crump, S. J. Niven, E. Teuten, A. Tonkin, T. Galloway and R. Thompson, Thompson, Accumulation of microplastic on shorelines worldwide: Sources and sinks, Environ. Sci. Technol., 2011, 45, 9175–9179 CrossRef CAS PubMed.
- A. Jahnke, H. P. H. Arp, B. I. Escher, B. Gewert, E. Gorokhova, D. Kühnel, M. Ogonowski, A. Potthoff, C. Rummel, M. Schmitt-Jansen, E. Toorman and M. MacLeod, Reducing uncertainty and confronting ignorance about the possible impacts of weathering plastic in the marine environment, Environ. Sci. Technol. Lett., 2017, 4, 85–90 CrossRef CAS.
- S. Mintenig, P. S. Bäuerlein, A. Koelmans, S. Dekker and A. Van Wezel, Closing the gap between small and smaller: towards a framework to analyse nano-and microplastics in aqueous environmental samples, Environ. Sci.: Nano, 2018, 5, 1640–1649 RSC.
- R. Lenz, K. Enders and T. G. Nielsen, Microplastic exposure studies should be environmentally realistic, Proc. Natl. Acad. Sci. U. S. A., 2016, 113, E4121–E4122 CAS.
- H. El Hadri, J. Gigault, B. Maxit, B. Grassl and S. Reynaud, Nanoplastic from mechanically degraded primary and secondary microplastics for environmental assessments, NanoImpact, 2020, 17, 100206 CrossRef.
- G. Xu, H. Cheng, R. Jones, Y. Feng, K. Gong, K. Li, X. Fang, M. A. Tahir, V. K. Valev and L. Zhang, Surface-enhanced Raman spectroscopy facilitates the detection of microplastics < 1 μm in the environment, Environ. Sci. Technol., 2020, 54, 15594–15603 CrossRef CAS.
- W. Zhang, Z. Dong, L. Zhu, Y. Hou and Y. Qiu, Direct observation of the release of nanoplastics from commercially recycled plastics with correlative Raman imaging and scanning electron microscopy, ACS Nano, 2020, 14, 7920–7926 CrossRef CAS.
- F. Blancho, M. Davranche, H. E. Hadri, B. Grassl and J. Gigault, Nanoplastics identification in complex environmental matrices: Strategies for polystyrene and polypropylene, Environ. Sci. Technol., 2021, 55, 8753–8759 CrossRef CAS PubMed.
- Y. Xu, Q. Ou, M. Jiao, G. Liu and J. P. van der Hoek, Identification and quantification of nanoplastics in surface water and groundwater by pyrolysis gas chromatography-mass spectrometry, Environ. Sci. Technol., 2022, 56, 4988–4997 CrossRef CAS PubMed.
- H. Cai, E. G. Xu, F. Du, R. Li, J. Liu and H. Shi, Analysis of environmental nanoplastics: Progress and challenges, Chem. Eng. J., 2021, 410, 128208 CrossRef CAS.
- Y. Yu and M. Flury, Current understanding of subsurface transport of micro- and nanoplastics in soil, Vadose Zone J., 2021, 20, e20108 CrossRef CAS.
- J. Li, H. Zhang, K. Zhang, R. Yang, R. Li and Y. Li, Characterization, source, and retention of microplastic in sandy beaches and mangrove wetlands of the Qinzhou Bay, China, Mar. Pollut. Bull., 2018, 136, 401–406 CrossRef CAS.
- F. Blancho, M. Davranche, F. Fumagalli, G. Ceccone and J. Gigault, A reliable procedure to obtain environmentally relevant nanoplastic proxies, Environ. Sci.: Nano, 2021, 8, 3211–3219 RSC.
- J. Martin, A. Lusher, R. C. Thompson and A. Morley, The deposition and accumulation of microplastics in marine sediments and bottom water from the Irish continental shelf, Sci. Rep., 2017, 7, 10772 CrossRef PubMed.
- S. He, S. Fang, X. Liu, W. Zhang, W. Xie, H. Zhang, D. Wei, W. Fu and D. Pei, Investigation of a genetic algorithm based cubic spline smoothing for baseline correction of Raman spectra, Chemom. Intell. Lab. Syst., 2016, 152, 1–9 CrossRef CAS.
- A. S. Nielsen, D. N. Batchelder and R. Pyrz, Estimation of crystallinity of isotactic polypropylene using Raman spectroscopy, Polymer, 2002, 43, 2671–2676 CrossRef CAS.
- H. Tadokoro, M. Kobayashi, M. Ukita, K. Yasufuku, S. Mtirahashi and T. Torii, Normal vibrations of the polymer molecules of helical conformation. V. Isotactic polypropylene and its deuteroderivatives, J. Chem. Phys., 1965, 42, 1432–1449 CrossRef CAS.
- M. Kim, J. Noh and H. Chung, Comparison of near-infrared and Raman spectroscopy for the determination of the density of polyethylene pellets, Anal. Chim. Acta, 2009, 632, 122–127 CrossRef CAS PubMed.
- J. Kim, Y. Kim and H. Chung, Direct on-line Raman measurement of flying solid samples: determination of polyethylene pellet density, Talanta, 2011, 83, 879–884 CrossRef CAS.
- O. Ryabchykov, T. Bocklitz, A. Ramoji, U. Neugebauer, M. Foerster, C. Kroegel, M. Bauer, M. Kiehntopf and J. Popp, Automatization of spike correction in Raman spectra of biological samples, Chemom. Intell. Lab. Syst., 2016, 155, 1–6 CrossRef CAS.
- M. Pittroff, Y. K. Müller, C. S. Witzig, M. Scheurer, F. R. Storck and N. Zumbülte, Microplastic analysis in drinking water based on fractionated filtration sampling and Raman microspectroscopy, Environ. Sci. Pollut. Res., 2021, 28, 59439–59451 CrossRef CAS.
- M. Bergmann, V. Wirzberger, T. Krumpen, C. Lorenz, S. Primpke, M. B. Tekman and G. Gerdts, High quantities of microplastic in Arctic deep-sea sediments from the hausgarten observatory, Environ. Sci. Technol., 2017, 51, 11000–11010 CrossRef CAS.
- F. Julienne, F. Lagarde and N. Delorme, Influence of the crystalline structure on the fragmentation of weathered polyolefines, Polym. Degrad. Stab., 2019, 170, 109012 CrossRef.
- C. Jingdong, W. Yaping and S. Benwei, Mechanisms on the suspended sediment transport in the mouth of North Channel of Yangtze River estuary, Ocean Eng., 2014, 32, 45–54 Search PubMed.
- P. M. Anger, E. von der Esch, T. Baumann, M. Elsner, R. Niessner and N. P. Ivleva, Raman microspectroscopy as a tool for microplastic particle analysis, TrAC, Trends Anal. Chem., 2018, 109, 214–226 CrossRef CAS.
- T. Dey, Microplastic pollutant detection by Surface Enhanced Raman Spectroscopy (SERS): a mini-review, Nanotechnol. Environ. Eng., 2023, 8, 41–48 CrossRef CAS.
- M. C. Rillig, L. Ziersch and S. Hempel, Microplastic transport in soil by earthworms, Sci. Rep., 2017, 7, 1362 CrossRef.
- S. Sasidharan, S. Torkzaban, S. A. Bradford, P. J. Dillon and P. G. Cook, Coupled effects of hydrodynamic and solution chemistry on long-term nanoparticle transport and deposition in saturated porous media, Colloids Surf., A, 2014, 457, 169–179 CrossRef CAS.
- X. Yan, X. Yang, Z. Tang, J. Fu, F. Chen, Y. Zhao, L. Ruan and Y. Yang, Downward transport of naturally-aged light microplastics in natural loamy sand and the implication to the dissemination of antibiotic resistance genes, Environ. Pollut., 2020, 262, 114270 CrossRef CAS.
- A. Isobe and S. Iwasaki, The fate of missing ocean plastics: Are they just a marine environmental problem?, Sci. Total Environ., 2022, 825, 153935 CrossRef CAS PubMed.
- M. Urso and M. Pumera, Nano/Microplastics capture and degradation by autonomous nano/microrobots: A perspective, Adv. Funct. Mater., 2022, 32, 2112120 CrossRef CAS.
- V. Onink, M. L. A. Kaandorp, E. van Sebille and C. Laufkotter, Influence of particle size and fragmentation on large-scale microplastic transport in the Mediterranean sea, Environ. Sci. Technol., 2022, 15528–15540 CrossRef CAS.
- J. Wang, X. Zhao, A. Wu, Z. Tang, L. Niu, F. Wu, F. Wang, T. Zhao and Z. Fu, Aggregation and stability of sulfate-modified polystyrene nanoplastics in synthetic and natural waters, Environ. Pollut., 2021, 268, 114240 CrossRef CAS.
- N. P. Ivleva, A. C. Wiesheu and R. Niessner, Microplastic in Aquatic Ecosystems, Angew. Chem., Int. Ed., 2017, 56, 1720–1739 CrossRef CAS.
- D. Schymanski, C. Goldbeck, H.-U. Humpf and P. Fürst, Analysis of microplastics in water by micro-Raman spectroscopy: release of plastic particles from different packaging into mineral water, Water Res., 2018, 129, 154–162 CrossRef CAS PubMed.
- G. Sarau, L. Kling, B. E. Oßmann, A.-K. Unger, F. Vogler and S. H. Christiansen, Correlative microscopy and spectroscopy workflow for microplastics, Appl. Spectrosc., 2020, 74, 1155–1160 CrossRef CAS PubMed.
- E. A. Muller, B. Pollard and M. B. Raschke, Infrared chemical Nano-Imaging: Accessing structure, coupling, and dynamics on molecular length scales, J. Phys. Chem. Lett., 2015, 6, 1275–1284 CrossRef CAS PubMed.
Footnote |
| † Electronic supplementary information (ESI) available. See DOI: https://doi.org/10.1039/d3va00291h |
| This journal is © The Royal Society of Chemistry 2024 |

