 Open Access Article
Mg-modified graphitic carbon nitride/converter slag composites as an efficient photocatalyst for sugar conversion†
Assadawoot
Srikhaow
 a,
Chitiphon
Chuaicham
ab,
Jirawat
Trakulmututa
a,
Kaiqian
Shu
a and
Keiko
Sasaki
a,
Chitiphon
Chuaicham
ab,
Jirawat
Trakulmututa
a,
Kaiqian
Shu
a and
Keiko
Sasaki
 *ab
*ab
aDepartment of Earth Resources Engineering, Kyushu University, Fukuoka, 819-0395, Japan. E-mail: keikos@mine.kyushu-u.ac.jp
bFaculty of Science and Technology, Waseda University, 169-0072, Tokyo, Japan. E-mail: keikos@waseda.jp
First published on 4th June 2024
Abstract
The development of a strategy for the resource utilisation of converter slag (CS) in the photocatalysis of biomass for high-value chemical production is essential for application in advanced purposes and for establishing a sustainable and economic solar-driven photoreforming process. This work reports a viable approach to using CS for the synthesis of Mg-modified graphitic carbon nitride/CS (Mg–CN/CS) composites with Mg doping contents ranging from 2 to 7 wt%. Then, the Mg–CN/CS composites served as efficient photocatalysts for the conversion of biomass-derived sugars to lactic acid under visible-light irradiation. The experimental findings indicated that CS served as a supporting material to facilitate the dispersion of CN particles on the CS surface. In addition, CS played a role in the formation of a Mg–CN/Ca2Fe2O5-bearing CS heterojunction, which was enabled by the presence of the photoactive semiconductor Ca2Fe2O5 in CS. Interestingly, the surface area and porosity of Mg–CN/CS samples slightly improved after Mg doping possibly due to the formation of structural defects. Contrary to pristine CN and Mg–CN, the Mg–CN/CS composites exhibited superior photocatalytic performance for lactic acid production, which could be attributed to the efficient separation of photogenerated charge carriers and improved light absorption capability facilitated by the synergetic impact of Mg doping and the Mg–CN/CS heterostructure. Under visible-light irradiation, 4.7Mg–CN/CS, at its optimal Mg content, achieved 97% glucose conversion and 71% lactic acid production within 2 h at 50 °C. This work provides an efficient approach to promoting the resource utilisation of CS, industrial solid waste, in the field of biomass photorefinery for the production of valuable chemicals and other photocatalytic applications.
1 Introduction
Recently, the utilisation of semiconductor photocatalysts for the conversion of solar energy into chemical energy has gained considerable attention in the pursuit of a sustainable society.1 Their ability to harness sunlight to produce valuable chemicals from readily available resources provides a tangible and environmentally friendly solution to both energy and environmental challenges. In particular, lignocellulosic biomass, an abundant and inherently renewable carbon source, exhibits remarkable potential for the production of platform chemicals and high-value biofuels from a photocatalytic process, providing a pathway towards achieving carbon neutrality.2,3 Glucose is widely used as a model compound for elucidating the complicated photoreforming mechanism owing to its simpler structure than that of lignocellulosic biomass.4,5Lactic acid (LA), a biomass-derived platform molecule, has a robust global market ($3.82 billion in 2020) of approximately 400![[thin space (1/6-em)]](https://www.rsc.org/images/entities/char_2009.gif) 000 tons annually, and the annual growth is projected to surge at 18.6%.6 LA is an important precursor for producing biodegradable plastics and various chemicals (acetaldehyde, pyruvic acid, propylene glycol, etc.) and can be used in the medical, dyeing, printing and brewing industries.7 Traditionally, biomass saccharides are used as feedstocks in the presence of enzymes or microorganisms to produce LA; however, this biological process faces challenges such as costly enzymes, prolonged fermentation time and low efficiency. Alternatively, thermochemical catalysis has been developed for producing LA from biomass-derived substances catalysed by acid catalysts (ZrW and Sn-beta), which were mostly operated at a high temperature of 160–190 °C.8,9 Furthermore, alkaline catalysts (Ba(OH)2 and NaOH) have been used and effectively demonstrated high LA yield at 25 °C; however, the process requires a long reaction time (∼48 h) and is associated with unsatisfactory recyclability.10,11 Thus, there is a need for exploration to develop alternative technologies for producing LA with high efficiency, easy and low-cost operation, mild conditions and a green process. Therefore, the photocatalytic conversion of biomass for LA production is a promising route, as it can be facilitated by solar light at an evaluated temperature (25–80 °C) and ambient pressure.12,13
000 tons annually, and the annual growth is projected to surge at 18.6%.6 LA is an important precursor for producing biodegradable plastics and various chemicals (acetaldehyde, pyruvic acid, propylene glycol, etc.) and can be used in the medical, dyeing, printing and brewing industries.7 Traditionally, biomass saccharides are used as feedstocks in the presence of enzymes or microorganisms to produce LA; however, this biological process faces challenges such as costly enzymes, prolonged fermentation time and low efficiency. Alternatively, thermochemical catalysis has been developed for producing LA from biomass-derived substances catalysed by acid catalysts (ZrW and Sn-beta), which were mostly operated at a high temperature of 160–190 °C.8,9 Furthermore, alkaline catalysts (Ba(OH)2 and NaOH) have been used and effectively demonstrated high LA yield at 25 °C; however, the process requires a long reaction time (∼48 h) and is associated with unsatisfactory recyclability.10,11 Thus, there is a need for exploration to develop alternative technologies for producing LA with high efficiency, easy and low-cost operation, mild conditions and a green process. Therefore, the photocatalytic conversion of biomass for LA production is a promising route, as it can be facilitated by solar light at an evaluated temperature (25–80 °C) and ambient pressure.12,13
To date, various semiconductor photocatalysts (g-C3N4, TiO2, CuO2 and CdS) have been developed to efficiently achieve the photocatalytic conversion of biomass-derived substances to LA, other valued-added chemicals and H2 under solar-light irradiation.6,12,14–17 Interestingly, the g-C3N4 photocatalyst has been extensively used compared with other semiconducting materials owing to its high efficiency, cost-efficiency, robust stability, suitable band gap (Eg = 2.7 eV) and non-toxicity. However, its low visible-light utilisation and high recombination rate substantially limit its widespread application.18,19 To address these concerns, the optical properties and photogenerated charge transportation of semiconducting materials are optimised using various methods such as element doping, surface modification and construction of a heterojunction between semiconducting materials. Notably, element doping is an effective strategy for modifying the band gap energy of semiconductors. Compared with other dopants, Mg-doped g-C3N4 (Mg–CN) photocatalysts have been prepared and have exhibited significantly high photocatalytic performance in photo-Fenton-like reactions and CO2 reduction owing to improved light adsorption capability and reduced charge recombination.20–22 In addition, the construction of a heterojunction between semiconductors is a common strategy for mitigating photogenerated charge recombination. Previous studies reported that composites of g-C3N4 with an iron oxide-based semiconductor (e.g. α-Fe2O3/g-C3N4 and CaFe2O4/g-C3N4) exhibited enhanced photocatalytic performance compared with their patent materials because the heterojunction can effectively promote charge separation and improve light-harvesting ability.23–25 Thus, the combination of Mg–CN and an iron oxide-based semiconductor can provide a promising photocatalyst for the photocatalysis of biomass-derived substances and other photocatalytic applications.
Globally, approximately two billion tons of steel slag are produced annually, and Japan generated around 9.5 million tons of converter slag (CS) in 2020. In general, blast furnace slag, with low iron oxide contents, finds nearly complete recycling in cement and roadbed materials and other construction material applications.26 Meanwhile, CS has high iron oxide contents (above 20%) and swelling properties and faces limitations in civil engineering applications.27 Furthermore, the steel-making industry, a prominent CO2 emitter in Japan, relies on coke as a reducing agent for iron ore, currently irreplaceable with H2. Due to the existence of photocatalytic active compounds such as iron oxide in CS, it has been recently explored and developed as a low-cost and resource-efficient photocatalyst for the production of H2 and degradation of organic pollutants. Previous studies reported that pure CS exhibited low photocatalytic efficiency owing to its high charge recombination rate and low light absorption capability.28–30 Hence, the formation of a composite between iron oxide-bearing CS and Mg–CN has the potential to yield an efficient photocatalyst, providing an eco-friendly method for recycling industrial solid waste. This approach not only holds significant economic value but also contributes to environmental security.
In this work, CS from the steel-making plant was directly used without pre-treatment and activation steps to fabricate Mg-modified graphitic carbon nitride/CS (Mg–CN/CS) composites with various Mg contents. The obtained Mg–CN/CS composites efficiently induced the quantitative production of LA from glucose under visible light and mild conditions. Our photocatalytic LA production system was found to be more efficient and cleaner than conventional methods. Furthermore, the optimal conditions for LA production, possible photocatalytic mechanism and role of active radicals were investigated and discussed.
2 Experimental
2.1 Chemicals
CS was generously provided by an anonymous company in Japan, and its corresponding elemental composition (subjected to XRF analysis) is presented in Table S1.† CS was mainly composed of CaO (45%), Fe2O3 (25%) and SiO2 (13%) in the same range of concentrations as CS reported in previous studies.31,32 In a typical experiment, CS was ground and passed through a stainless steel testing sieve (JIS Z 8801, wire diameter of 71 μm; Tokyo Screen Co., Ltd., Japan) before further use. All chemicals were used as received and were of analytical grade (data shown in the ESI). Deionised (DI) water was used as a solvent throughout all experiments.2.2 Preparation of Mg-modified graphitic carbon nitride/converter slag (Mg–CN/CS) composites
Dicyanamide (DA, 3.5 g) and a certain amount of MgCl2·6H2O were dissolved in DI water and stirred for 1 h to generate a homogeneous solution. Then, 0.1 g of ground CS was added to the solution and stirred for 30 min. Subsequently, the suspension was dried at 80 °C for 12 h in a hot air oven. Then, the obtained dried power was transferred to a silica crucible with a cover and calcined at 550 °C for 2 h in a muffle furnace in ambient air. The effect of Mg contents in the Mg–CN/CS composites on photocatalytic performance was examined by varying the amount of Mg contents by 2–7 wt%. CHN analysis revealed that approximately 5 wt% of CS existed in CN/CS and all Mg–CN/CS composites. Inductively coupled plasma optical emission spectroscopy (ICP-OES, PerkinElmer 8500, USA) was employed to determine the Mg contents in all samples. The solid samples were subjected to digestion in concentrated HNO3 using the microwave-assisted method before the ICP-OES measurement. Based on the ICP-OES results, the Mg–CN/CS composites were denoted as xMg–CN/CS, where x represents the wt% of Mg in the samples, including 2.3Mg–CN/CS, 4.7Mg–CN/CS and 7.1Mg–CN/CS. To compare the photocatalytic performance, pure CN, CN/CS and 4.6Mg–CN were prepared through a similar procedure but without the addition of CS and MgCl2·6H2O for pure CN synthesis, without Mg salt for CN/CS synthesis and without CS for 4.6Mg–CN synthesis.2.3 Characterisation
X-ray diffraction (XRD) measurement was performed using an Ultima IV X-ray diffractometer (Rigaku, Japan) with Cu-Kα radiation (λ = 1.5418 nm) at 40 kV and 40 mA to examine the crystallographic information of all as-synthesised samples. Scanning electron microscope (SEM) images were recorded on a KEYENCE VE-9800 (Keyence, Japan) equipped with an energy-dispersive X-ray spectroscopy analyser to investigate the morphology and elemental composition of the produced samples. Transmission electron microscope (TEM) images were obtained from a JEOL JEM ARM200CF (JEOL, Japan). Ultraviolet-visible diffuse reflectance spectroscopy (UV-Vis DRS, UV-2450 Shimadzu, Japan) and room-temperature photoluminescence spectroscopy (PL, FP-6600, JASCO Corporation, Japan) were performed to analyse the optical characteristics of the samples. The surface electronic states of the samples were examined through X-ray photoelectron spectroscopy (XPS, Thermo Scientific K-Alpha, USA) with an Al Kα monochromatic source (operating at 12 kV and 6 mA). All the binding energies in the XPS analysis were referenced to the binding energy of [C 1s] = 284.6 eV, derived from the adventitious carbon of the surface.29 The electrochemical impedance spectroscopy (EIS) measurements and transient photocurrent measurement were performed using a Solartron 1280C electrochemical test system (Solartron Analytical, UK) in 0.1 M NaCl at a pH of 2. The electron spin resonance (ESR) signals were recorded at room temperature using a JES-FA200 ESR spectrometer (JEOL, Japan). The energy-resolved distribution of electron traps (ERDTs) of the samples was obtained through reverse double-beam-photoacoustic spectroscopy (RDB-PAS), a technique developed by Ohtani et al. as previously reported.33,342.4 Photocatalytic experiments
Photocatalytic conversion of glucose was performed in a sealed quartz reactor with a rubber septum. In a typical experiment, 25 mg of glucose was added into an aqueous NaOH solution (1 M, 25 mL) and stirred for 2 min to obtain the homogeneous solution. Subsequently, the sample powder was introduced to the solution and stirred in the dark for 30 min at room temperature to achieve adsorption–desorption equilibrium. Thereafter, photocatalytic glucose conversion was performed by heating the quartz reactor to the desired temperature under visible-light irradiation (a cut-off filter λ > 380 nm, 500 W Xe short arc lamp, 6258, USHIO, Japan). After a 2-h reaction, 0.5 mL of the solution was taken out using a syringe and promptly filtered through a 0.45 μm micro-porous membrane (cellulose acetate) filter to collect the liquid fraction. Then, 0.5 mL of H2SO4 aqueous solution (1.0 M) was immediately mixed with the aforementioned liquid fraction to neutralise the solution pH before further analysis. High-performance liquid chromatography (HPLC, CO-2065, JASCO, Japan) was employed to quantify the concentration of glucose and products using an Aminex HPX-87H (300 × 7.8 mm, BIO-RAD, USA) column equipped with a refractive index detector for sugar analysis and a UV-Vis detector (210 nm) for organic acid analysis. H2SO4 aqueous solution (0.5 mM) was used as a mobile phase and applied to the HPLC system in the isocratic mode at a 0.6 mL min−1 flow rate and a column temperature of 50 °C. Details of the calculation of glucose conversion and LA yield are described in the ESI.†3 Results and discussion
3.1 Characterisation
Fig. 1 presents the XRD patterns of the CS, CN/CS and Mg–CN/CS composites with various Mg contents. Notably, the XRD patterns of CS exhibited the characteristic peaks of Ca2Fe2O5 (JCPDS 38-0408), Ca3SiO5 (JCPDS 49-0442), MgAl2O4 (JCPDS 89-1627) and TiMg2O4 (JCPDS 25-1157), similar to the previous study.29 The predominant Fe phase in CS was Ca2Fe2O5, which has been extensively reported as a photoactive material (Eg ∼ 2.21 eV) for photocatalytic applications.35,36 Thus, the Ca2Fe2O5-bearing CS possibly demonstrates its potential application for the conversion of biomass into value-added chemicals. The XRD patterns of pristine CN, 4.6Mg–CN, shown in Fig. S1,† and Mg–CN/CS-based samples demonstrated two distinct peaks at 2θ of 13.2° and 27.5° corresponding to the (100) and (002) diffraction planes, respectively. These findings agree well with the XRD patterns reported for g-C3N4 materials in previous studies.18,37 Interestingly, the dominant appearance of the (200) peak in CN/CS and Mg–CN/CS composites suggested the formation of g-C3N4 in the composites. However, the peak became lower in intensities and has larger full width at half maximum (Table S2†) with the increase in Mg contents, indicating that Mg doping could decrease the degree of condensation and crystallinity of g-C3N4 and increase the structural defects. Furthermore, there were no diffraction peaks corresponding to Mg species (e.g. Mg3N2 and MgO), suggesting that Mg was dispersed and coordinated with the g-C3N4 material. Notably, the main characteristic peaks of CS were indiscernible in the XRD patterns of the CN/CS and Mg–CN/CS composites likely due to the low amount of CS in the composites.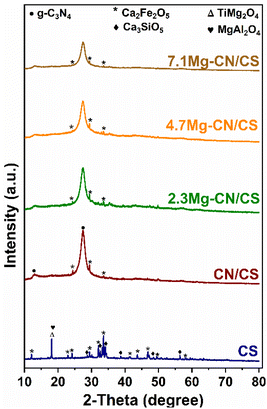 | ||
| Fig. 1 XRD diffraction patterns of the CS, CN/CS and Mg–CN/CS composites with different Mg contents. | ||
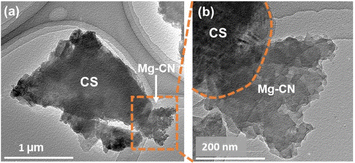
The morphology and micro-structure of the as-prepared samples were observed in the SEM images (Fig. 2a–f). As shown in Fig. 2a, pure CS has a smooth surface, and its particle size is comparatively larger than those of pristine CN and 4.6Mg–CN samples (Fig. S2a and b†). Meanwhile, the CN/CS (Fig. S2†) and Mg–CN/CS composites exhibit agglomerations of small CN and Mg–CN particles on the CS surface, indicating that the CN or Mg–CN particles can grow and adhere on the surface of CS. Hence, CS can function as a supportive substrate and could alleviate some issues associated with CN particle agglomeration, thereby potentially enhancing photocatalytic activity. Furthermore, SEM-EDS analysis revealed the effective dispersion of Mg–CN in the 4.7Mg–CN/CS composite, as shown in Fig. 2f and as evidenced by the overlapping signals of carbon (C), nitrogen (N) and magnesium (Mg) from Mg–CN with those of Ca, Fe, O, Al and Si from CS. Fig. 3a presents the low-magnification TEM image of the 4Mg–CN/CS composite, which distinctly illustrates the coexistence of CS particles and thin Mg–CN sheets with a fluffy morphology. In contrast, the high-magnification TEM image (Fig. 3b) shows a tight interface of Mg–CN and CS, providing evidence of heterojunction formation.
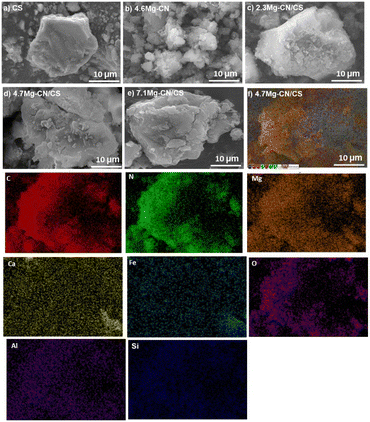 | ||
| Fig. 2 SEM images of (a) CS, (b) 4.6Mg–CN, (c) 2.3Mg–CN/CS, (d) 4.7Mg–CN/CS, and (e) 7.1Mg–CN/CS, and (f) elemental mapping images of 4.7Mg–CN/CS. | ||
The specific surface and pore-size distribution of all samples were evaluated using N2 adsorption–desorption isotherms. Fig. 4a demonstrates that the adsorption isotherms of all samples were of type IV with an H3 hysteresis loop,38 suggesting the existence of mesopores in the samples. Fig. 4b shows that CS had a bimodal pore-size distribution, with narrow pores in the range of 2–10 nm and broader pores in the range of 10–40 nm. In addition, the dense and large particles of CS led to a low surface area of 5 m2 g−1. In contrast, CN and 4.6Mg–CN had a broad pore-size distribution from 2 to 50 nm and a higher surface area of 10 m2 g−1 and 11 m2 g−1, respectively, due to the smaller particles and fluffy morphology. Interestingly, the surface areas of the CN/CS (16 m2 g−1) and Mg–CN/CS composites (17–25 m2 g−1) were slightly higher than those of CN and 4.6Mg–CN, indicating the improved dispersion and reduced aggregation of g-C3N4 particles on the CS surface. The Mg–CN/CS composites had a broad pore-size distribution with an intensive narrow pore size of around 2–20 nm and broader pores in the range of 20–50 nm. Notably, the specific surface area and total pore volume of the Mg–CN/CS composites (Table S3†) increased with the increase in Mg contents. The improvement of the surface area and porosity was possibly due to the hindered g-C3N4 growth by Mg doping, probably leading to the formation of surface defects and the generation of more active sites.20,21 This finding agrees with the XRD analysis results.
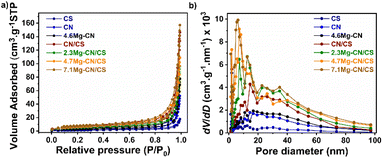 | ||
| Fig. 4 (a) N2 adsorption–desorption isotherms and (b) pore size distribution of all as-prepared samples. | ||
PL spectroscopy and photoelectrochemical measurements were performed to evaluate the separation ability for the photogenerated charge carriers of the samples.33 Generally, PL is used to simultaneously examine the photoexcitation and relaxation of semiconductors, which can imply the ability of the charge transfer, separation and recombination of the photoexcited charge carriers of the materials. Basically, lower PL intensity suggests effective charge separation due to the lower rate of the recombination process of the photogenerated electron–hole pair.39Fig. 5a shows the room-temperature PL spectra of all samples. The PL results indicated that g-C3N4 exhibited poor separation ability of photoinduced charge carriers, as evidenced by its high PL intensity. Interestingly, the PL intensity of 4.6Mg–CN and CN/CS significantly diminished, suggesting that the separation ability of photogenerated charge carriers improved after doping with Mg or the formation of the CN/CS heterojunction. Evidently, the PL intensities of Mg–CN/CS with different Mg content loadings were much lower than those of pure g-C3N4, 4.6Mg–CN and CN/CS. Thus, the recombination of photogenerated electrons and holes was effectively suppressed in the Mg–CN/CS samples. Fig. 5b shows the transient photocurrent response to pulse irradiation of all the samples. Photocurrent generation under light irradiation of a semiconductor coated on an electrode is a commonly used method for evaluating the efficiency of photogenerated charge separation.40 Basically, the efficiency of charge separation is determined using the rate of electron transfer from the semiconductor particle network to the underlying electrode layer and subsequently to an external circuit.41 Therefore, a semiconductor with a low rate of charge recombination is expected to exhibit a higher photocurrent response under light irradiation. The Mg–CN/CS samples exhibited higher photocurrent density than pure g-C3N4, 4.6Mg–CN and CN/CS, indicating that the production of photogenerated electrons can be promoted after Mg doping and the formation of Mg–CN/CS heterostructures. Furthermore, the EIS of the as-prepared samples are depicted in Fig. 5c. The radius of the semicircle in the Nyquist plots is proportional to the charge-transfer resistance. A significant decrease in the semicircle diameter is observed in the Nyquist plots of the Mg–CN/CS samples, indicating quick interfacial charge transportation and low charge-transfer resistance. Hence, the results from the PL and photoelectrochemical experiments indicated that the formation of a heterostructure of Mg–CN and CS, along with Mg doping, can enhance photogenerated charge separation and transportation, ultimately prolonging the lifetime of photogenerated charge carriers. This phenomenon is beneficial for significantly improving the photocatalytic performance of the materials.
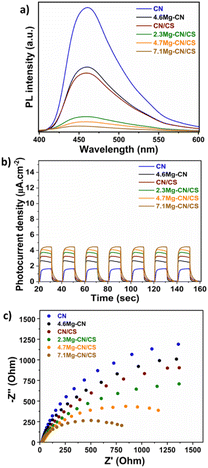 | ||
| Fig. 5 (a) Room-temperature PL spectra, (b) transient photocurrent behaviour and (c) the EIS Nyquist plot of CN, 4.6Mg–CN, CN/CS and Mg–CN/CS composites with different Mg contents. | ||
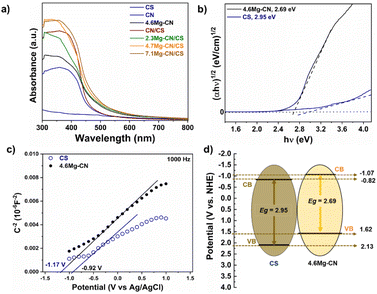
The UV-Vis DRS was used to characterise the optical absorption properties of all samples. As shown in Fig. 6a, the pristine CN and 4.6Mg–CN samples have absorption edges at 460 and 480 nm, respectively, indicating that Mg doping of CN can extend the light absorption range. Notably, pure CS exhibited a lower adsorption edge compared to the CN-based samples, suggesting that pure CS might have low photo-responsive activity. Interestingly, the integration of CS with the CN in CN/CS samples not only improves light-harvesting ability but also causes a red shift in the absorption edge into a longer wavelength compared with the pristine CS and CN samples. Furthermore, the Mg–CN/CS composites demonstrated a subtle red shift towards a longer wavelength than the 4.6Mg–CN and CN/CS samples, indicating the synergetic impact between Mg–CN and CS in expanding the light absorption range and enhancing its effective utilisation of visible light. To determine the optical band gap energy (Eg) of CS and Mg–CN from the UV-Vis DRS spectra, Tauc's plots were constructed using the following equation:42
| (αℏν)1/2 = A(ℏν − Eg) | (1) |
Mott–Schottky measurements were performed to ascertain the flat-band potential (Vfb), which is closely approximated to the conduction band (CB) potential of n-type semiconductors. As shown in Fig. 6c, the positive slopes in the Mott–Schottky plots of both CS and 4.6Mg–CN indicated their n-type semiconductor characteristics. The Vfb values can be determined by extrapolating the x-intercept of the linear region in the Mott–Schottky plot using the Mott–Schottky relation. The measured Vfb potentials vs. Ag/AgCl were converted to the normal hydrogen electrode (NHE) using the formula ENHE = EAg/AgCl + 0.197. Thus, the estimated Vfb potentials of CS and 4.6Mg–CN were about −0.92 and −1.17 V compared with Ag/AgCl, respectively. Then, the obtained potentials were further converted to the NHE as −0.72 V for CS and −0.97 V for 4.6Mg–CN. In general, the CB potential of an n-type semiconductor is approximately 0.1 V more negative than the Vfb potential.43,44 Consequently, the estimated CB potentials of CS and 4.6Mg–CN were found to be −0.82 and −1.07 V, respectively. Based on the UV-Vis DRS and Mott–Schottky measurement results, the estimated valence band (VB) potentials of CS and 4.6Mg–CN were 2.13 and 1.62 eV, respectively. As a result, the possible electronic band structure of the Mg–CN/CS composites can be diagrammed as illustrated in Fig. 6d. Thus, the integration of Mg–CN and CS may construct the Z-scheme Mg–CN/CS heterojunction, which can promote charge transportation to reduce the recombination of photogenerated electron–hole pairs and enhance photocatalytic activity.
The surface chemical compositions and oxidation states of the elements of the pure CS, 4.6Mg–CN and 4.7Mg–CN/CS samples were investigated through XPS analysis. Fig. S3† shows distinct peaks corresponding to the C, N, O and Mg elements in the Mg–CN and 4.7Mg–CN/CS samples, whereas there are no signals corresponding to the Ca and Fe elements in the 4.7Mg–CN/CS composite. This phenomenon suggested that the surface of 4.7Mg–CN/CS is partially covered by the Mg–CN particles. Previous studies also reported the significant weaker intensities of the Ca 2p and Fe 2p signals of the composites such as g-C3N4/CaFe2O4 and gC3N4/artificial CS.24,29 This is attributed to the predominant coverage of the surface of CaFe2O4 and artificial CS particles by the g-C3N4 particles. In the high-resolution spectra of C 1s (Fig. 7a), the peaks at 284.6, 286.1 and 288.2 eV were attributed to adventitious carbon impurity (C–C), the (C)3–N bond and the N–C![[double bond, length as m-dash]](https://www.rsc.org/images/entities/char_e001.gif) N bond in the g-C3N4 structure, respectively.45 Interestingly, the additional peak at 289.2 eV corresponding to the C
N bond in the g-C3N4 structure, respectively.45 Interestingly, the additional peak at 289.2 eV corresponding to the C![[double bond, length as m-dash]](https://www.rsc.org/images/entities/char_e001.gif) O bond was found after the formation of the 4.7Mg–CN/CS composites, indicating the formation of C
O bond was found after the formation of the 4.7Mg–CN/CS composites, indicating the formation of C![[double bond, length as m-dash]](https://www.rsc.org/images/entities/char_e001.gif) O between Mg–CN and CS after compositing.24,46,47 The peaks at 397.7, 399.0 and 400.1 eV in Fig. 7b corresponded to C–N
O between Mg–CN and CS after compositing.24,46,47 The peaks at 397.7, 399.0 and 400.1 eV in Fig. 7b corresponded to C–N![[double bond, length as m-dash]](https://www.rsc.org/images/entities/char_e001.gif) C, N–(C)3 and C–N–H in g-C3N4, respectively.47 Notably, the binding energies of the C 1s peaks for the (C)3–N bond and N–C
C, N–(C)3 and C–N–H in g-C3N4, respectively.47 Notably, the binding energies of the C 1s peaks for the (C)3–N bond and N–C![[double bond, length as m-dash]](https://www.rsc.org/images/entities/char_e001.gif) N and the N 1s peaks for C–N
N and the N 1s peaks for C–N![[double bond, length as m-dash]](https://www.rsc.org/images/entities/char_e001.gif) C and N–(C)3 slightly decreased in 4.7Mg–CN/CS. These results suggested that the heterojunction of Mg–CN and CS induces a charge-transfer process at their interface.
C and N–(C)3 slightly decreased in 4.7Mg–CN/CS. These results suggested that the heterojunction of Mg–CN and CS induces a charge-transfer process at their interface.
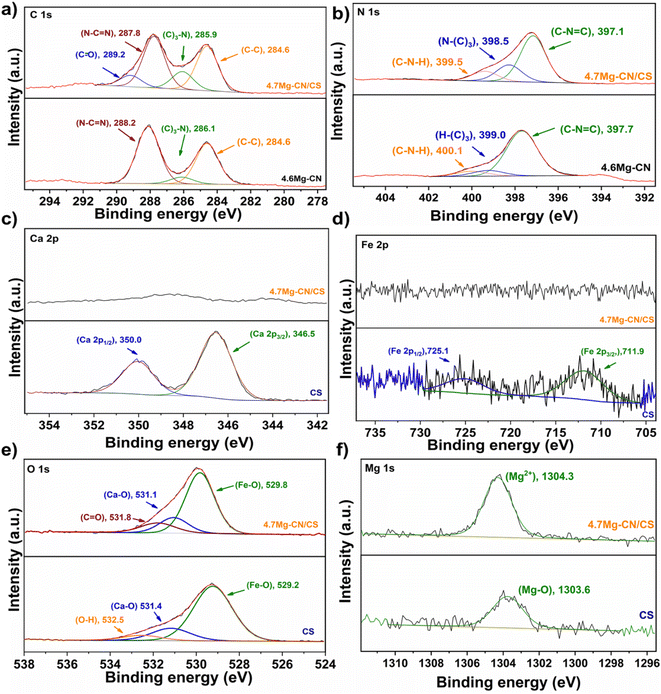 | ||
| Fig. 7 XPS spectra of the CS, 4.6Mg–CN and 4.7Mg–CN/CS samples: (a) C 1s, (b) N 1s, (c) Ca 2p, (d) Fe 2p, (e) O 1s and (f) Mg 1s. | ||
By fitting the Ca 2p XPS spectra of CS shown in Fig. 7c, two peaks at 346.5 and 350.0 eV were correlated with the Ca 2p3/2 and Ca 2p1/2 spin states of Ca2+, respectively.24,29 In addition, the Fe 2p peak was deconvoluted into two peaks at 711.9 and 725.1 eV (Fig. 7d), which could be attributed to Fe 2p3/2 and Fe 2p1/2, respectively.48,49 This result indicated the existence of a Fe3+ oxidation state in CS. Notably, Ca 2p and Fe 2p signals were not detected in the XPS spectra of 4.7Mg–CN/CS, possibly due to the low contents of Ca and Fe on its surface. These findings also suggested that the surface of the 4.7Mg–CN/CS composite was dominantly coated by the Mg–CN particles. The O 1s spectrum (Fig. 7e) of CS illustrates three peaks at 259.2, 531.4 and 532.5 eV, which were assigned to the lattice oxygen Fe–O, Ca–O and the surface adsorbed oxygen species (OH, H2O), respectively.24 Notably, the peak at 531.8 eV associated with the C![[double bond, length as m-dash]](https://www.rsc.org/images/entities/char_e001.gif) O bond was found after the formation of the 4.7Mg–CN/CS composites, indicating the possible formation of C
O bond was found after the formation of the 4.7Mg–CN/CS composites, indicating the possible formation of C![[double bond, length as m-dash]](https://www.rsc.org/images/entities/char_e001.gif) O between Mg–CN and CS in the material. Essentially, the binding energy of lattice oxygen Fe–O showed a slight shift to 289.8 eV in 4.7Mg–CN/CS, indicating that the charge-transfer process at the Mg–CN/S interface may have been induced by the heterojunction formation. For the Mg 1s XPS spectra (Fig. 7f), the peak observed at 1303.6 eV depicted the Mg–O bond in MgO in CS.50 Interestingly, the peak at 1304.3 eV in the Mg 1s XPS spectrum of 4.7Mg–CN/CS indicated that the Mg species on the composite surface mainly existed in Mg2+ ions.51 According to the XPS results, the 4.7Mg–CN/CS composite is a heterojunction with a significant interaction between Mg–CN and CS rather than simple physical mixing.
O between Mg–CN and CS in the material. Essentially, the binding energy of lattice oxygen Fe–O showed a slight shift to 289.8 eV in 4.7Mg–CN/CS, indicating that the charge-transfer process at the Mg–CN/S interface may have been induced by the heterojunction formation. For the Mg 1s XPS spectra (Fig. 7f), the peak observed at 1303.6 eV depicted the Mg–O bond in MgO in CS.50 Interestingly, the peak at 1304.3 eV in the Mg 1s XPS spectrum of 4.7Mg–CN/CS indicated that the Mg species on the composite surface mainly existed in Mg2+ ions.51 According to the XPS results, the 4.7Mg–CN/CS composite is a heterojunction with a significant interaction between Mg–CN and CS rather than simple physical mixing.
RDB-PAS was employed to investigate the electronic surface properties of pristine CN, pure CS, CN/CS and 4.7Mg–CN/CS. In general, corresponding the energy-resolved distribution of electron trap (ERDT) patterns are constructed to identify, characterise and elucidate the interfacial charge transfer of the semiconductors.52 As shown in Fig. S4,† there is no signal of ERDT patterns in the pure CS, whereas the pristine CN shows high electron accumulation density at around 2.2–2.9 eV, with the highest electron trap (ET) states at around 2.8 eV. Interestingly, the new trap state appeared at around 2.3 eV after the fabrication of the CN/CS heterojunction, which suggests that the strong interfacial contact between these two components may cause structural damage on the surface of each component and subsequently lead to the creation of a new ET state at the surface of the CN/CS composite. In addition, the electron accumulation density slightly increased from 9.3 for CN/CS to 11.0 for 4.7Mg–CN/CS, which can be explained by that the surface structural defects of g-C3N4 were increased after the Mg doping of the CN/CS composite (as suggested by the XRD results). In general, the surface defects can trap photogenerated electrons, suppressing the recombination of photogenerated charge carriers and resulting in improved photocatalytic activity of the materials.29
3.2 Photocatalytic conversion of glucose to LA under visible-light irradiation
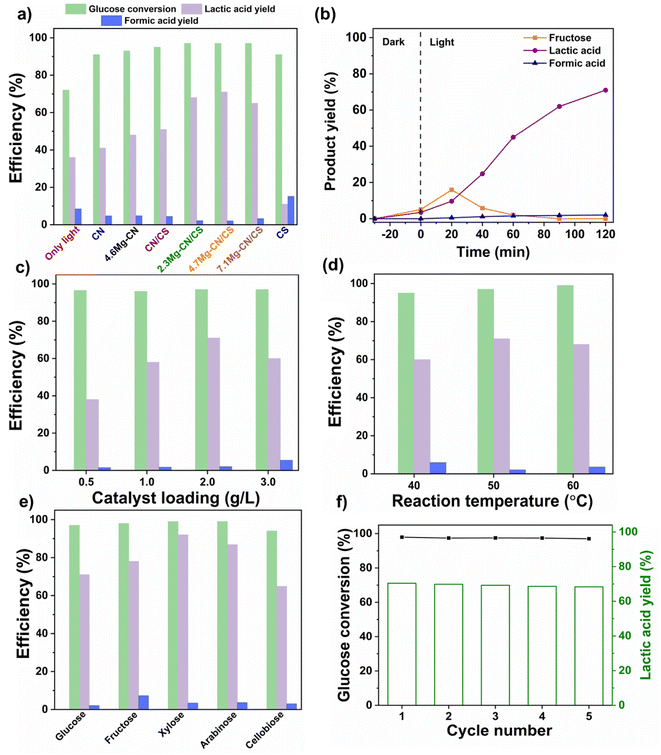
The photocatalytic activities of various as-synthesised samples in the LA production from the photocatalytic conversion of glucose were initially evaluated at 50 °C for 2 h under visible-light irradiation (Fig. 8a). The quantification of glucose and LA as well as potential by-products was performed via HPLC using peak positions compared with those of pure substances (Fig. S5†). Notably, the glucose conversion and LA and formic acid production from a control experiment conducted at 50 °C under visible-light irradiation without the addition of photocatalysts were only 72%, 36% and 9%, respectively. In the control experiment, LA production was induced by the conversion of glucose in an alkaline solution, with a partial contribution from the thermal conversion of glucose due to the reaction performed at 50 °C. Interestingly, pure CS exhibited enhanced glucose conversion (91%) compared with the control experiment, which could be attributed to the presence of the photoactive-Ca2Fe2O5 compound and the basicity provided by the metallic oxides in CS. However, a lower LA yield (11%) was obtained, possibly due to CS promoting a side reaction, as indicated by the higher formation of formic acid (15%) than by the control experiment. Moreover, comparative analysis of the photocatalytic activities of pristine CN, CN/CS and Mg–CN/CS with various Mg contents revealed that 4.7Mg–CN/CS exhibited the highest photocatalytic activity, achieving around 97% glucose conversion, 71% LA yield and 2% formic acid production. In addition, the photocatalytic performance of the 4.6Mg–CN sample was compared with that of 4.7Mg–CN/CS. It was observed that 4.6Mg–CN exhibited lower photocatalytic performance than 4.7Mg–CN/CS, obtaining 43% LA yield. Thus, the photocatalytic activity results indicated that the Mg doping of CN with appropriate contents and the construction of an effective heterostructure of Mg–CN/CS could improve photocatalytic activity in LA production. Notably, all Mg–CN/CS composites achieved better glucose conversion and LA production, exceeding 95% and 65%, respectively, compared with pristine CN, 4.6Mg–CN and CN/CS. This improvement was likely attributed to improved visible-light absorption ability, enhanced photogenerated charge separation and increased specific surface areas, as suggested by the UV-Vis DRS, PL, EIS, photocurrent and BET results. Based on the aforementioned findings, 4.7Mg–CN/CS exhibited the highest LA production. Consequently, further experiments were conducted using 4.7Mg–CN/CS to investigate the optimal conditions and uncover a plausible reaction mechanism.As shown in Fig. 8b, with an increase in reaction time, the yield of fructose, an intermediate product in the conversion of glucose to LA in basic solvents, initially increased to 16% in the initial stage (20 min) but subsequently decreased and became nearly undetectable after 60 min. Fructose was found to be more likely to undergo selective transformation into LA after 20 min of reaction time. Notably, LA was incrementally produced as the reaction time was increased, reaching 71% after 2 h. In addition, a small amount of formic acid, approximately 2%, was generated and consistently increased throughout the reaction. In the subsequent photocatalytic tests, the effect of catalyst dosage on LA production from glucose was explored (Fig. 8c). The results indicated that LA yields initially increased from 38% to 71% at a catalyst dosage of 0.5 to 2 g L−1 and then slightly decreased to 60% at 3 g L−1. Excessive photocatalyst amounts may induce side reactions, reducing the overall activation energy due to the formation of unstable species after glucose adsorption at the 4.7Mg–CN/CS surface,14 as indicated by the higher formic acid yield at 3 g L−1 of catalyst dosage.
The influence of reaction temperature on the selective formation of LA from glucose was investigated and is illustrated in Fig. 8d. The LA production increased from 60% at 40 °C to 71% at 50 °C and then slightly reduced to 68% at 60 °C. It is widely known that an increase in reaction temperature is desirable for the generation of LA from monosaccharides in an alkaline solution, as this endothermic reaction is thermodynamically more favourable at elevated temperatures.53 Nevertheless, the LA yield slightly decreased at 60 °C possibly due to the promotion of other side reactions such as decarboxylation of LA to formic acid, as suggested by the higher formic acid production than the reaction at 50 °C.
Additionally, varying the NaOH concentrations from 0.25 to 1 M (Fig. S6†) demonstrated enhanced glucose conversion (97%) and LA yield (71%) at 1 M, with a slight decrease in LA production (65%) at 2 M due to excessive ˙OH formation, causing LA peroxidation.54
In addition to glucose, other saccharides, including fructose, xylose, arabinose and cellobiose, were investigated for the photocatalytic conversion to LA at 50 °C for 2 h under visible-light irradiation (Fig. 8e). With the addition of 4.7Mg–CN/CS, fructose, xylose and arabinose nearly completed the conversion to produce LA in high yields of 78%, 92% and 87%, respectively. Interestingly, 94% of conversion and 65% yield of LA were obtained from cellobiose (C12 sugar) within 2 h. The lower photocatalytic conversion of cellobiose may be due to its larger molecules than monosaccharides and the fact that the reaction was initiated by hydrolysis of the β-1,4-glycosidic bonds.55 These results indicated the broad applicability of the 4.7Mg–CN/CS composite for the production of LA from biomass-derived monosaccharides and disaccharides.
3.3 Reusability test
In addition to high photocatalytic performance, stability and reusability are crucial factors influencing the practical application. After each photocatalytic reaction cycle, the 4.7Mg–CN/CS composite was separated through centrifugation and washed with DI water until the pH of the supernatant became neutral. Subsequently, the 4.7Mg–CN/CS composite was dried at 80 °C and reused for the subsequent cycle. As shown in Fig. 8f, the photocatalytic performance of the 4.7Mg–CN/CS composite exhibited no significant loss of glucose conversion and a slight decrease in LA production during the five consecutive runs. Therefore, the 4.7Mg–CN/CS composite demonstrated favourable stability and reusability in the photocatalytic production of LA during the recycling test. The slight decline in LA yield may have been caused by the loss of some photocatalysts during the recovery process.3.4 Possible photocatalytic reaction mechanism
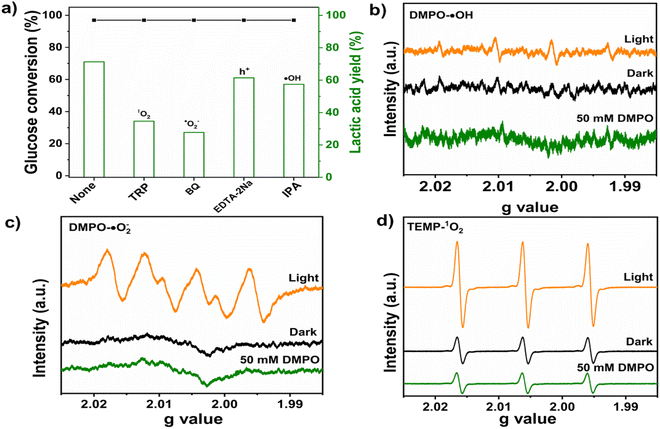
Scavenger experiments were conducted to examine the effect of reactive oxygen species on the photocatalytic LA production from glucose. Upon the addition of tryptophan (TRP, 1O2 scavenger), para-benzoquinone (BQ, ˙O2− scavenger), ethylenediaminetetraacetic acid disodium salt (EDTA-2Na, h+ scavenger) or isopropyl alcohol (IPA, ˙OH scavenger), there was no significant change in glucose conversion (Fig. 9a). However, the yields of LA were inhibited to various degrees, with the most significant inhibition observed in the presence of TRP or BQ. These results indicated that all the ˙O2−, 1O2, ˙OH and h+ radicals were involved in the reaction and that the major active radical species in the photocatalytic reaction for the selective production of LA are ˙O2− and 1O2.ESR spectroscopy was employed to verify the generation of radicals during the photocatalytic reaction. Radical trapping agents such as 5,5-dimethyl-1-pyrroline-N-oxide (DMPO) in water and methanol were used for ˙OH and ˙O2− detection, respectively, whereas 2,2,6,6-tetramethylpiperidine (TEMP) in water was used for 1O2 detection. In Fig. 9b–d, the quartet hyperfine splitting pattern of the spin adduct DMPO–˙O2−, with a relative intensity of 1![[thin space (1/6-em)]](https://www.rsc.org/images/entities/char_2009.gif) :
:![[thin space (1/6-em)]](https://www.rsc.org/images/entities/char_2009.gif) 1
1![[thin space (1/6-em)]](https://www.rsc.org/images/entities/char_2009.gif) :
:![[thin space (1/6-em)]](https://www.rsc.org/images/entities/char_2009.gif) 1
1![[thin space (1/6-em)]](https://www.rsc.org/images/entities/char_2009.gif) :
:![[thin space (1/6-em)]](https://www.rsc.org/images/entities/char_2009.gif) 1, indicates ˙O2− trapping by DMPO under visible-light irradiation. Similarly, the ESR spectrum of the spin adduct DMPO–˙OH was observed, exhibiting the quartet hyperfine splitting pattern (relative intensity ratio of 1
1, indicates ˙O2− trapping by DMPO under visible-light irradiation. Similarly, the ESR spectrum of the spin adduct DMPO–˙OH was observed, exhibiting the quartet hyperfine splitting pattern (relative intensity ratio of 1![[thin space (1/6-em)]](https://www.rsc.org/images/entities/char_2009.gif) :
:![[thin space (1/6-em)]](https://www.rsc.org/images/entities/char_2009.gif) 2
2![[thin space (1/6-em)]](https://www.rsc.org/images/entities/char_2009.gif) :
:![[thin space (1/6-em)]](https://www.rsc.org/images/entities/char_2009.gif) 2
2![[thin space (1/6-em)]](https://www.rsc.org/images/entities/char_2009.gif) :
:![[thin space (1/6-em)]](https://www.rsc.org/images/entities/char_2009.gif) 1) under visible-light irradiation.56,57 Notably, there are no ESR spectra of spin adduct DMPO–˙OH and DMPO–˙O2− in the absence of light, indicating that no ˙OH and ˙O2− were generated. In addition, the oxidation of TEMP by 1O2 can produce the TEMPO (2,2,6,6-tetramethyl-1-piperidinyl) free radical, detected by ESR as a triplet hyperfine splitting signal with a relative intensity ratio of 1
1) under visible-light irradiation.56,57 Notably, there are no ESR spectra of spin adduct DMPO–˙OH and DMPO–˙O2− in the absence of light, indicating that no ˙OH and ˙O2− were generated. In addition, the oxidation of TEMP by 1O2 can produce the TEMPO (2,2,6,6-tetramethyl-1-piperidinyl) free radical, detected by ESR as a triplet hyperfine splitting signal with a relative intensity ratio of 1![[thin space (1/6-em)]](https://www.rsc.org/images/entities/char_2009.gif) :
:![[thin space (1/6-em)]](https://www.rsc.org/images/entities/char_2009.gif) 1
1![[thin space (1/6-em)]](https://www.rsc.org/images/entities/char_2009.gif) :
:![[thin space (1/6-em)]](https://www.rsc.org/images/entities/char_2009.gif) 1.57 Small TEMPO signals under dark conditions may result from the electron transfer oxidation of TEMP to TEMPO in the presence of O2.58 A higher TEMPO intensity under visible-light irradiation confirms the 1O2 generation during the photocatalytic reaction. Thus, the ESR results indicated that ˙O2−, ˙OH and 1O2 were generated during the photocatalytic reaction and played a pivotal role in the subsequent oxidative reaction of glucose to LA. However, the results from scavenger experiments indicated that ˙OH exhibited less contribution to LA production. Previous studies reported that ˙O2− and 1O2 served as milder oxidants, avoiding overoxidation and resulting in a more selective oxidation of organic compounds compared with ˙OH.59
1.57 Small TEMPO signals under dark conditions may result from the electron transfer oxidation of TEMP to TEMPO in the presence of O2.58 A higher TEMPO intensity under visible-light irradiation confirms the 1O2 generation during the photocatalytic reaction. Thus, the ESR results indicated that ˙O2−, ˙OH and 1O2 were generated during the photocatalytic reaction and played a pivotal role in the subsequent oxidative reaction of glucose to LA. However, the results from scavenger experiments indicated that ˙OH exhibited less contribution to LA production. Previous studies reported that ˙O2− and 1O2 served as milder oxidants, avoiding overoxidation and resulting in a more selective oxidation of organic compounds compared with ˙OH.59
Based on the above experimental results, the mechanism underlying the photocatalytic production of LA from glucose by 4.7Mg–CN/CS was elaborated. Essentially, a photoactive Ca2Fe2O5 component in CS could significantly contribute to the formation of a Mg–CN/Ca2Fe2O5-bearing CS heterojunction. In CS, Ca3SiO5 and MgAl2O4 are recognised as insulators, whereas Mg2TiO4 is known to be a semiconductor with a wide Eg of 3.81 eV.60 Thus, they could not play crucial roles in the photocatalytic activity of the composites. Possibly, Ca3SiO5, MgAl2O4 and Mg2TiO4 in CS can serve as supporting materials for the dispersion of Mg–CN particles on the surface of Mg–CN/CS composites. According to the constructed electronic band structure diagram, the VB potential of 4.6Mg–CN (1.62 eV) was more negative than that of CS (2.13 eV), whereas the CB potential of CS (−0.82 eV) was more positive than that of 4.6Mg–CN (−1.07 eV). Clearly, if the charge transfer followed a traditional type II Mg–CN/CS heterostructure, the hole in the VB of 4.6Mg–CN cannot convert OH− to ˙OH due to the more negative VB potential of 4.6Mg–CN (1.62 eV) than the standard normal potential of OH−/˙OH (1.99 eV). Evidently, the production of ˙OH during the photocatalytic reaction supported the Z-scheme-type charge transfer in the Mg–CN/CS heterojunction and helped mitigate the recombination of photogenerated electron–hole pairs. Typically, the electrons and holes were generated by both Mg–CN and CS under visible-light irradiation. Simultaneously, the photogenerated electrons in the CB of CS migrated to the VB of Mg–CN, where they combined with photogenerated holes. The accumulated photogenerated electrons in the CB of Mg–CN were capable of reducing O2 to ˙O2− due to the more negative CB potential of Mg–CN (−1.07 eV) than the standard reduction potential of O2/˙O2− (−0.33 eV).61 Subsequently, the generated ˙O2− can further be transformed into 1O2 reactive species by the photogenerated holes. Furthermore, the photogenerated holes in the VB of CS can convert OH− to ˙OH as the VB potential of CS (2.13 eV) is more positive than the normal potential of OH−/˙OH (1.99 eV).61 Finally, these highly active radicals (˙O2−, 1O2 and ˙OH) proceeded to undergo photocatalytic conversion of sugar to produce LA.
Next, a possible photocatalytic reaction pathway of glucose conversion by 4.7Mg–CN/CS under visible-light irradiation will be discussed (Fig. 10). First, the isomerisation of glucose to fructose occurred in an alkaline solution. In the meantime, ˙O2−, 1O2 and ˙OH effectively cleaved the C–C bond of glucose, initiating its retro-aldol condensation to yield glyceraldehyde and 1,3-dihydroxyacetone. Subsequently, both C3 compounds underwent the dehydration reaction to form pyruvaldehyde, followed by radical active species facilitated rearrangement to produce LA.6 Moreover, some side reactions may occur during the reaction. For instance, glucose and fructose can undergo isomerisation, and glucose can be oxidised through α and β oxidation pathways (Fig. S7†), finally yielding formic acid as a by-product.12
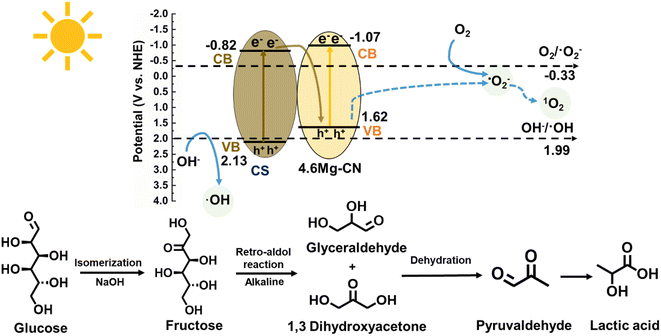 | ||
| Fig. 10 Schematic of the possible reaction mechanism for the photocatalytic production of lactic acid from glucose over the Mg–CN/CS composite. | ||
4 Conclusion
A series of Mg-modified graphitic carbon nitride/converter slag (Mg–CN/CS) composites with Mg doping contents ranging from 2 to 7 wt% were successfully fabricated and evaluated for their photocatalytic performances for the conversion of biomass-derived saccharides to LA under visible-light illumination. The characterisation results (UV-Vis DRS, PL, EIS and BET) revealed the synergic effects of Mg doping and heterojunction of Mg–CN/Ca2Fe2O5-bearing CS, leading to improved visible-light response properties, increased separation rates of photogenerated electron–hole pairs and enhanced active surface areas in the materials. Furthermore, the alkaline properties of metallic oxides in CS may contribute to pH elevation and shift the isomerisation equilibrium, thereby enhancing fructose production, subsequently leading to the increased selective production of LA. Thus, the Mg–CN/CS composites exhibited a much higher photocatalytic performance than pristine CN, pure CS and 4.6Mg–CN. The 4.7Mg–CN/CS sample demonstrated the highest glucose conversion (97%) and LA yield (71%) among all the samples after 2 h at 50 °C under visible-light irradiation. This study explored a feasible way to achieve the high value-added utilisation of CS and contributes to the sustainable and economical solar-driven photocatalytic conversion of biomass for the production of valuable chemicals. In addition, considering the substantial CO2 emissions from the steel industry, the reutilisation of CS for biomass photorefinery demonstrates its potential contribution to carbon neutrality.Data availability
The raw/processed data required to reproduce the above findings cannot be shared at this time as the data also form part of an ongoing study.Author contributions
Assadawoot Srikhaow: investigation, formal analysis, methodology, visualisation, writing-original draft, editing. Chitiphon Chuaicham: writing-review, editing, formal analysis. Jirawat Trakulmututa: investigation, formal analysis, writing-review. Kaiqian Shu: investigation, formal analysis. Keiko Sasaki: conceptualisation, investigation, writing-review, editing, supervision, project administration, funding acquisition.Conflicts of interest
The authors declare no conflict of interest.Acknowledgements
This work was supported by the Japan Society for the Promotion of Science (JSPS) KAKENHI (A) for funding the research grants [JP21F21342, JP22P22083, JP22H00266, and JP22K18998] provided to KS and the postdoctoral fellowship for foreign researchers (JP22P22083) to AS and partly supported by Advanced Research Infrastructure for Materials and Nanotechnology Grant Number JPMXP1222KU1009 in Japan sponsored by the Ministry of Education, Culture, Sports, Science and Technology (MEXT), Japan, and the 2022 Research Start Programme 202208 to CC. The authors extend their appreciation to Kyushu University's Ultra-microscopy Research Centre for assistance in conducting the TEM analysis. Furthermore, the authors would like to express their gratitude to the Kyushu University Nanotech Centre for providing access to BET measurements and XPS analysis. The graphical abstract was created using some images from https://Flaticon.com.References
- F. Wang, Q. Li and D. Xu, Adv. Energy Mater., 2017, 7, 1700529 CrossRef.
- L. I. Granone, F. Sieland, N. Zheng, R. Dillert and D. W. Bahnemann, Green Chem., 2018, 20, 1169–1192 RSC.
- B. Tabah, I. N. Pulidindi, V. R. Chitturi, L. M. Reddy Arava, A. Varvak, E. Foran and A. Gedanken, J. Mater. Chem. A, 2017, 5, 15486–15506 RSC.
- X. Liu, X. Duan, W. Wei, S. Wang and B.-J. Ni, Green Chem., 2019, 21, 4266–4289 RSC.
- V.-C. Nguyen, M. Sanoe, N. P. Putri, Y.-L. Lee and H. Teng, Sustainable Energy Fuels, 2024, 8, 1412–1423 RSC.
- Y. Cao, D. Chen, Y. Meng, S. Saravanamurugan and H. Li, Green Chem., 2021, 23, 10039–10049 RSC.
- S. Mailaram, V. Narisetty, S. K. Maity, S. Gadkari, V. K. Thakur, S. Russell and V. Kumar, Sustainable Energy Fuels, 2023, 7, 3034–3046 RSC.
- M. S. Holm, S. Saravanamurugan and E. Taarning, Science, 2010, 328, 602–605 CrossRef CAS PubMed.
- F. Chambon, F. Rataboul, C. Pinel, A. Cabiac, E. Guillon and N. Essayem, Appl. Catal., A, 2015, 504, 664–671 CrossRef CAS.
- X. Yan, F. Jin, K. Tohji, A. Kishita and H. Enomoto, AIChE J., 2010, 56, 2727–2733 CrossRef CAS.
- L. Li, F. Shen, R. L. Smith and X. Qi, Green Chem., 2017, 19, 76–81 RSC.
- J. Ma, D. Jin, Y. Li, D. Xiao, G. Jiao, Q. Liu, Y. Guo, L. Xiao, X. Chen, X. Li, J. Zhou and R. Sun, Appl. Catal., B, 2021, 283, 119520 CrossRef CAS.
- G. C. de Assis, I. M. A. Silva, T. G. dos Santos, T. V. dos Santos, M. R. Meneghetti and S. M. P. Meneghetti, Catal. Sci. Technol., 2021, 11, 2354–2360 RSC.
- D. Jin, G. Jiao, W. Ren, J. Zhou, J. Ma and R. Sun, J. Mater. Chem. C, 2021, 9, 16450–16458 RSC.
- H. Zhao, C.-F. Li, X. Yong, P. Kumar, B. Palma, Z.-Y. Hu, G. Van Tendeloo, S. Siahrostami, S. Larter, D. Zheng, S. Wang, Z. Chen, M. G. Kibria and J. Hu, iScience, 2021, 24, 102109 CrossRef CAS PubMed.
- Q. Hao, G. Jia, W. Wei, A. Vinu, Y. Wang, H. Arandiyan and B.-J. Ni, Nano Res., 2020, 13, 18–37 CrossRef CAS.
- A. H. Navidpour, D. Hao, X. Li, D. Li, Z. Huang and J. L. Zhou, Catal. Rev., 2023, 1–72 CrossRef.
- Y. Lv, W. Shao, Y. Kong, N. Li, X. Huang, Z. Tang, M. Gong, L. Li and W. Wei, J. Environ. Chem. Eng., 2023, 11, 109981 CrossRef CAS.
- F. Huang, D. Tan, D. Li, S. Guo, Y. Yan and W. Zhang, J. Alloys Compd., 2023, 947, 169487 CrossRef CAS.
- J.-y. Tang, W.-g. Zhou, R.-t. Guo, C.-y. Huang and W.-g. Pan, Catal. Commun., 2018, 107, 92–95 CrossRef CAS.
- Y. Duan, J. Li, D. Jia, H. Yao, X. Shang and C. Li, Diamond Relat. Mater., 2022, 129, 109313 CrossRef CAS.
- X. Bai, T. Jia, X. Wang, S. Hou, D. Hao and N. Bingjie, Catal. Sci. Technol., 2021, 11, 5432–5447 RSC.
- Y. Li, S. Zhu, Y. Liang, Z. Li, S. Wu, C. Chang, S. Luo and Z. Cui, Mater. Des., 2020, 196, 109191 CrossRef CAS.
- S. Shenoy, C. Chuaicham, T. Okumura, K. Sekar and K. Sasaki, Chem. Eng. J., 2023, 453, 139758 CrossRef CAS.
- V. V. Pham, T. K. Truong, L. V. Hai, H. P. P. La, H. T. Nguyen, V. Q. Lam, H. D. Tong, T. Q. Nguyen, A. Sabbah, K.-H. Chen, S.-J. You and T. M. Cao, ACS Appl. Nano Mater., 2022, 5, 4506–4514 CrossRef CAS.
- H. Matsuura, X. Yang, G. Li, Z. Yuan and F. Tsukihashi, Int. J. Miner., Metall. Mater., 2022, 29, 739–749 CrossRef.
- A. Srikhaow, C. Chuaicham, S. Shenoy, J. Trakulmututa and K. Sasaki, Chem. Eng. J., 2023, 473, 145167 CrossRef CAS.
- C. Fusco, M. Casiello, P. Pisani, A. Monopoli, F. Fanelli, W. Oberhauser, R. Attrotto, A. Nacci and L. D'Accolti, Sci. Rep., 2022, 12, 11378 CrossRef CAS PubMed.
- T. Inoue, C. Chuaicham, N. Saito, B. Ohtani and K. Sasaki, J. Photochem. Photobiol., A, 2023, 440, 114644 CrossRef CAS.
- X. Zhao, T. Chen, Y. Xue and J. Liu, New J. Chem., 2023, 47, 7746–7756 RSC.
- S. Eloneva, S. Teir, J. Salminen, C.-J. Fogelholm and R. Zevenhoven, Ind. Eng. Chem. Res., 2008, 47, 7104–7111 CrossRef CAS.
- J. Zhao, P. Yan and D. Wang, J. Cleaner Prod., 2017, 156, 50–61 CrossRef CAS.
- C. Chuaicham, K. Sekar, V. Balakumar, J. Uchida, T. Katsurao, H. Sakabe, B. Ohtani and K. Sasaki, Environ. Res., 2022, 212, 113635 CrossRef CAS PubMed.
- A. Nitta, M. Takashima, N. Murakami, M. Takase and B. Ohtani, Electrochim. Acta, 2018, 264, 83–90 CrossRef CAS.
- Y.-H. Chang, W.-C. Tseng, C.-C. Kaun, Y.-H. Su and J.-J. Wu, ACS Sustain. Chem. Eng., 2022, 10, 12651–12658 CrossRef CAS.
- D. S. Vavilapalli, R. G. Peri, R. K. Sharma, U. K. Goutam, B. Muthuraaman, M. S. Ramachandra Rao and S. Singh, Sci. Rep., 2021, 11, 19639 CrossRef CAS PubMed.
- S. R. Gujjula, U. Pal, N. Chanda, S. Karingula, S. Chirra, S. Siliveri, S. Goskula and V. Narayanan, Energy Fuels, 2023, 37, 9722–9735 CrossRef CAS.
- Z. Le, C. Xiong, J. Gong, X. Wu, T. Pan, Z. Chen and Z. Xie, Environ. Pollut., 2020, 260, 114070 CrossRef CAS PubMed.
- R. Ye, H. Fang, Y.-Z. Zheng, N. Li, Y. Wang and X. Tao, ACS Appl. Mater. Interfaces, 2016, 8, 13879–13889 CrossRef CAS PubMed.
- V. Seiß, U. Helbig, R. Lösel and M. Eichelbaum, Sci. Rep., 2021, 11, 22200 CrossRef PubMed.
- R. Beranek, B. Neumann, S. Sakthivel, M. Janczarek, T. Dittrich, H. Tributsch and H. Kisch, Chem. Phys., 2007, 339, 11–19 CrossRef CAS.
- R. R. Pawar, C. Chuaicham, K. Sekar, S. Rajendran and K. Sasaki, Chemosphere, 2022, 291, 132922 CrossRef CAS PubMed.
- D. P. Kumar, S. Hong, D. A. Reddy and T. K. Kim, J. Mater. Chem. A, 2016, 4, 18551–18558 RSC.
- S. Saha, G. Das, J. Thote and R. Banerjee, J. Am. Chem. Soc., 2014, 136, 14845–14851 CrossRef CAS PubMed.
- L. Lei, W. Wang, Z. Xie, X. Wu, A. K. Yadav, P. Müller-Buschbaum and H. Fan, Sustainable Energy Fuels, 2021, 5, 5227–5235 RSC.
- N. T. T. Truc, D. S. Duc, D. Van Thuan, T. A. Tahtamouni, T.-D. Pham, N. T. Hanh, D. T. Tran, M. V. Nguyen, N. M. Dang, N. T. P. Le Chi and V. N. Nguyen, Appl. Surf. Sci., 2019, 489, 875–882 CrossRef CAS.
- S. Huang, Y. Zhang, C. Du and Y. Su, Chem. Commun., 2020, 56, 6054–6057 RSC.
- Q. Tian, B. Guo, C. Chuaicham and K. Sasaki, Chemosphere, 2020, 248, 126123 CrossRef CAS PubMed.
- R. Li, M. Cai, Z. Xie, Q. Zhang, Y. Zeng, H. Liu, G. Liu and W. Lv, Appl. Catal., B, 2019, 244, 974–982 CrossRef CAS.
- L. Cui, L. Huang, M. Ji, Y. Wang, H. Shi, Y. Zuo and S. Kang, J. Power Sources, 2016, 333, 118–124 CrossRef CAS.
- D. Long, W. Diao, X. Rao and Y. Zhang, ACS Appl. Energy Mater., 2020, 3, 9278–9284 CrossRef CAS.
- C. Chuaicham, S. Karthikeyan, R. R. Pawar, Y. Xiong, I. Dabo, B. Ohtani, Y. Kim, J. T. Song, T. Ishihara and K. Sasaki, Chem. Commun., 2020, 56, 3793–3796 RSC.
- B. Jin, G. Yao, X. Wang, K. Ding and F. Jin, ACS Sustain. Chem. Eng., 2017, 5, 6377–6381 CrossRef CAS.
- J. Ma, Y. Li, D. Jin, X. Yang, G. Jiao, K. Liu, S. Sun, J. Zhou and R. Sun, Appl. Catal., B, 2021, 299, 120698 CrossRef CAS.
- H. Zhao, C.-F. Li, X. Yu, N. Zhong, Z.-Y. Hu, Y. Li, S. Larter, M. G. Kibria and J. Hu, Appl. Catal., B, 2022, 302, 120872 CrossRef CAS.
- J. Trakulmututa, K. Uraisin, S. Pornsuwan and S. M. Smith, Mater. Res. Bull., 2023, 162, 112181 CrossRef CAS.
- H.-J. Qin, Y.-H. Zhang, Z. Wang and G.-H. Yang, Catalysts, 2022, 12, 719 CrossRef CAS.
- C. Ayed, W. Huang, G. Kizilsavas, K. Landfester and K. A. I. Zhang, ChemPhotoChem, 2020, 4, 571–576 CrossRef CAS.
- L. Xiong and J. Tang, Adv. Energy Mater., 2021, 11, 2003216 CrossRef CAS.
- S. Chang, Y. Hu, J. Qian, Y. Shao, S. Ni, L. Kong, W. Dan, C. Luo, S. Jin and X. Xu, Chem. Eng. J., 2021, 410, 128410 CrossRef CAS PubMed.
- S. Xiong, X. Liu, X. Zhu, G. Liang, Z. Jiang, B. Cui and J. Bai, Ecotoxicol. Environ. Saf., 2021, 208, 111519 CrossRef CAS PubMed.
Footnote |
| † Electronic supplementary information (ESI) available. See DOI: https://doi.org/10.1039/d4se00209a |
| This journal is © The Royal Society of Chemistry 2024 |

