
 Open Access Article
 This Open Access Article is licensed under a
 Creative Commons Attribution 3.0 Unported Licence
Bayesian optimization of glycopolymer structures for the interaction with cholera toxin B subunit†
Masanori
Nagao
 ,
Osuke
Nakahara
,
Xincheng
Zhou
,
Hikaru
Matsumoto
and
Yoshiko
Miura
*
,
Osuke
Nakahara
,
Xincheng
Zhou
,
Hikaru
Matsumoto
and
Yoshiko
Miura
*
Department of Chemical Engineering, Kyushu University, 744 Motooka, Nishi-ku, Fukuoka 819-0395, Japan. E-mail: miuray@chem-eng.kyushu-u.ac.jp
First published on 29th May 2024
Abstract
The optimal structure of synthetic glycopolymers for GM1 mimetics was determined through Bayesian optimization. The interactions of glycopolymers carrying galactose and neuraminic acid units in different compositions with cholera toxin B subunit (CTB) were assessed by an enzyme-linked immunosorbent assay (ELISA). Gaussian process regression, using the ELISA results, predicted the composition of glycopolymers that would exhibit stronger interactions with CTB. Following five cycles of optimization, the glycopolymers carrying 60 mol% galactose and 25 mol% neuraminic acid demonstrated an IC50 value of 75 μM for CTB, representing the lowest value among the synthesized glycopolymers.
Biomolecules demonstrate their superior functions based on the precise arrangement of functional groups. In the quest to develop highly functional molecules, the method of “total synthesis”, involving the construction of complex functional molecules derived from living organisms using simple molecular structures, has become well-established.1,2 Challenges in the production or limited supply of naturally derived functional molecules, especially pharmaceuticals, underscore the significance of total synthesis as a crucial approach for artificially replicating natural compounds. However, due to the intricate and multi-stage synthetic routes necessary for total synthesis of natural products, there is an increasing need to explore simpler synthetic pathways.
When considering the molecular structures of representative biomolecules like carbohydrates and proteins, the functional expression is typically associated with specific parts of the overall structure.3,4 For example, the structure of GM1 ganglioside (Fig. S1†), a natural ligand for cholera toxin, is notably intricate. However, only two residues, galactose and Neu5Ac at the terminal ends, are involved in binding to cholera toxin B subunits (CTB).5,6 Consequently, by focusing on the parts directly involved in protein binding and mimicking them using different chemical structures, synthetic materials with functionalities similar to natural carbohydrates can be obtained. This approach is referred to as the “carbohydrate module method” (Fig. 1a).7,8 Our group previously employed the “carbohydrate module method” in combination with synthetic polymers to create GM1 mimetics.9,10 Glycopolymers carrying both galactose and Nue5Ac units exhibited strong interactions with CTB. Glycopolymers containing only either carbohydrate exhibited a weak interaction with CTB, indicating that both galactose and Nue5Ac units were bound to CTB, as in natural GM1. Furthermore, screening the interactions of the glycopolymers using surface plasmon resonance imaging (SPRI) revealed significant variations in function based on the ratio of galactose units to Nue5Ac units, indicating the existence of polymer compositions that maximize the molecular recognition capability.10 However, since such an exhaustive screening method require ample raw materials for objective compound evaluation, a more efficient method is desired for compound searches using rare raw materials.
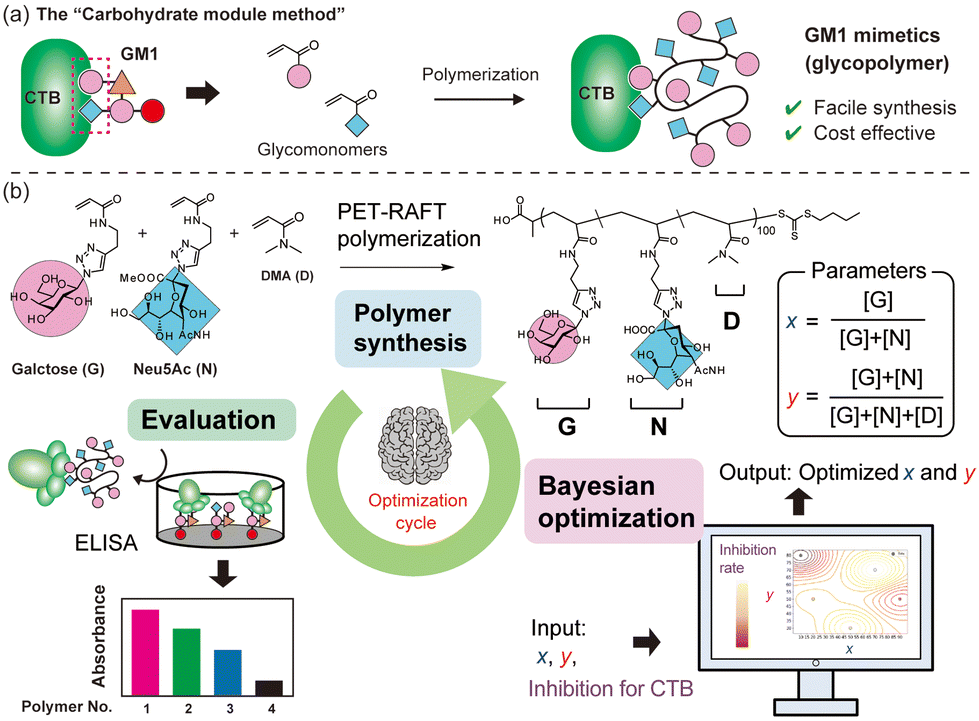 | ||
| Fig. 1 Schematic illustrations of the “carbohydrate module method” (a). Illustration of a cycle for Bayesian optimization of the glycopolymer structure for GM1 mimetics (b). | ||
Machine learning has emerged as a valuable tool for optimizing materials, with applications reported in various fields such as drug discovery and catalyst development.11–14 In recent years, there has been increasing interest in using machine learning to maximize the functionality of synthetic polymers, treating monomer units as modules to construct functional polymers.15,16 For example, Knight and co-workers elucidated optimal conditions for the Suzuki–Miyaura cross-coupling reaction with polymer catalysts using statistical analysis and data visualization.17 However, there have been no examples of optimizing the functionality of synthetic polymers with molecular recognition capabilities through machine learning. Since the functions of synthetic copolymers can be customized by adjusting the monomer ratio, Bayesian optimization emerges as a suitable machine learning method for understanding the polymer structure to maximize its functionality.18 The swift optimization of molecular recognition functionality using machine learning has the potential to facilitate the development of exceptional synthetic inhibitors for unknown targets.
In this work, we treat units of galactose (G) and Neu5Ac (N) in glycopolymer structures as parameters and aim to maximize the function of the glycopolymers as GM1 mimics (binding to CTB) by incorporating machine learning with minimal trial attempts (Fig. 1b). G and N are integral parts of the natural ligand for CTB (GM1), and their simultaneous binding to CTB is crucial for a strong interaction. While a ratio of G![[thin space (1/6-em)]](https://www.rsc.org/images/entities/char_2009.gif) :N = 1:1 appears to be the most efficient when synthesizing small molecules that mimic GM1, this is not optimal for polymers. Synthetic polymers adopt various conformations influenced by the steric hindrance of their side chains and their affinity for solvents (such as water). Thus, even if the carbohydrate units are introduced at a G:N = 1:1 ratio, the polymer conformation may not always be ideal for binding to CTB. There exists an ideal composition in which the glycopolymer can effectively display G and N for CTB binding, determined by the ratio of carbohydrate units to each other and the carbohydrate unit density in the polymer structure.19–21 To control the carbohydrate unit density, N,N-dimethylacrylamide (D) was introduced as the third monomer. Among monomers that are inert to molecular recognition, hydrophilic, and offer minimal steric hindrance, D was chosen due to its ease of control during radical polymerization. To determine the optimal polymer structure for binding with CTB, we employed a Bayesian optimization method utilizing Gaussian process regression.22 In this approach, contours are drawn by providing outputs for several variables (e.g., Fig. 2). Confidence intervals are also established using the upper confidence bound algorithm. Vertical cuts of the data are then taken perpendicular to the axis variables passing through the maximum points (e.g., Fig. S19–S23†). The point of the variables giving the highest value within this confidence interval is then evaluated. In this study, two variables were introduced for Bayesian estimation: the ratio of carbohydrate units to each other (x = [G]/([G] + [N])) and the ratio of carbohydrate units within the whole polymer structure (y = ([G] + [N])/([G] + [N] + [D])). The objective function here is the absorbance obtained in an enzyme-linked immunosorbent assay (ELISA) method, and the aim is to minimize its value (maximize the interaction). To cover the range of these variables with as few points as possible, the first five points were determined using these variables as the x-axis and y-axis {(0.2, 20), (0.2, 80), (0.5, 50), (0.8, 20), (0.8, 20)}.
:N = 1:1 appears to be the most efficient when synthesizing small molecules that mimic GM1, this is not optimal for polymers. Synthetic polymers adopt various conformations influenced by the steric hindrance of their side chains and their affinity for solvents (such as water). Thus, even if the carbohydrate units are introduced at a G:N = 1:1 ratio, the polymer conformation may not always be ideal for binding to CTB. There exists an ideal composition in which the glycopolymer can effectively display G and N for CTB binding, determined by the ratio of carbohydrate units to each other and the carbohydrate unit density in the polymer structure.19–21 To control the carbohydrate unit density, N,N-dimethylacrylamide (D) was introduced as the third monomer. Among monomers that are inert to molecular recognition, hydrophilic, and offer minimal steric hindrance, D was chosen due to its ease of control during radical polymerization. To determine the optimal polymer structure for binding with CTB, we employed a Bayesian optimization method utilizing Gaussian process regression.22 In this approach, contours are drawn by providing outputs for several variables (e.g., Fig. 2). Confidence intervals are also established using the upper confidence bound algorithm. Vertical cuts of the data are then taken perpendicular to the axis variables passing through the maximum points (e.g., Fig. S19–S23†). The point of the variables giving the highest value within this confidence interval is then evaluated. In this study, two variables were introduced for Bayesian estimation: the ratio of carbohydrate units to each other (x = [G]/([G] + [N])) and the ratio of carbohydrate units within the whole polymer structure (y = ([G] + [N])/([G] + [N] + [D])). The objective function here is the absorbance obtained in an enzyme-linked immunosorbent assay (ELISA) method, and the aim is to minimize its value (maximize the interaction). To cover the range of these variables with as few points as possible, the first five points were determined using these variables as the x-axis and y-axis {(0.2, 20), (0.2, 80), (0.5, 50), (0.8, 20), (0.8, 20)}.
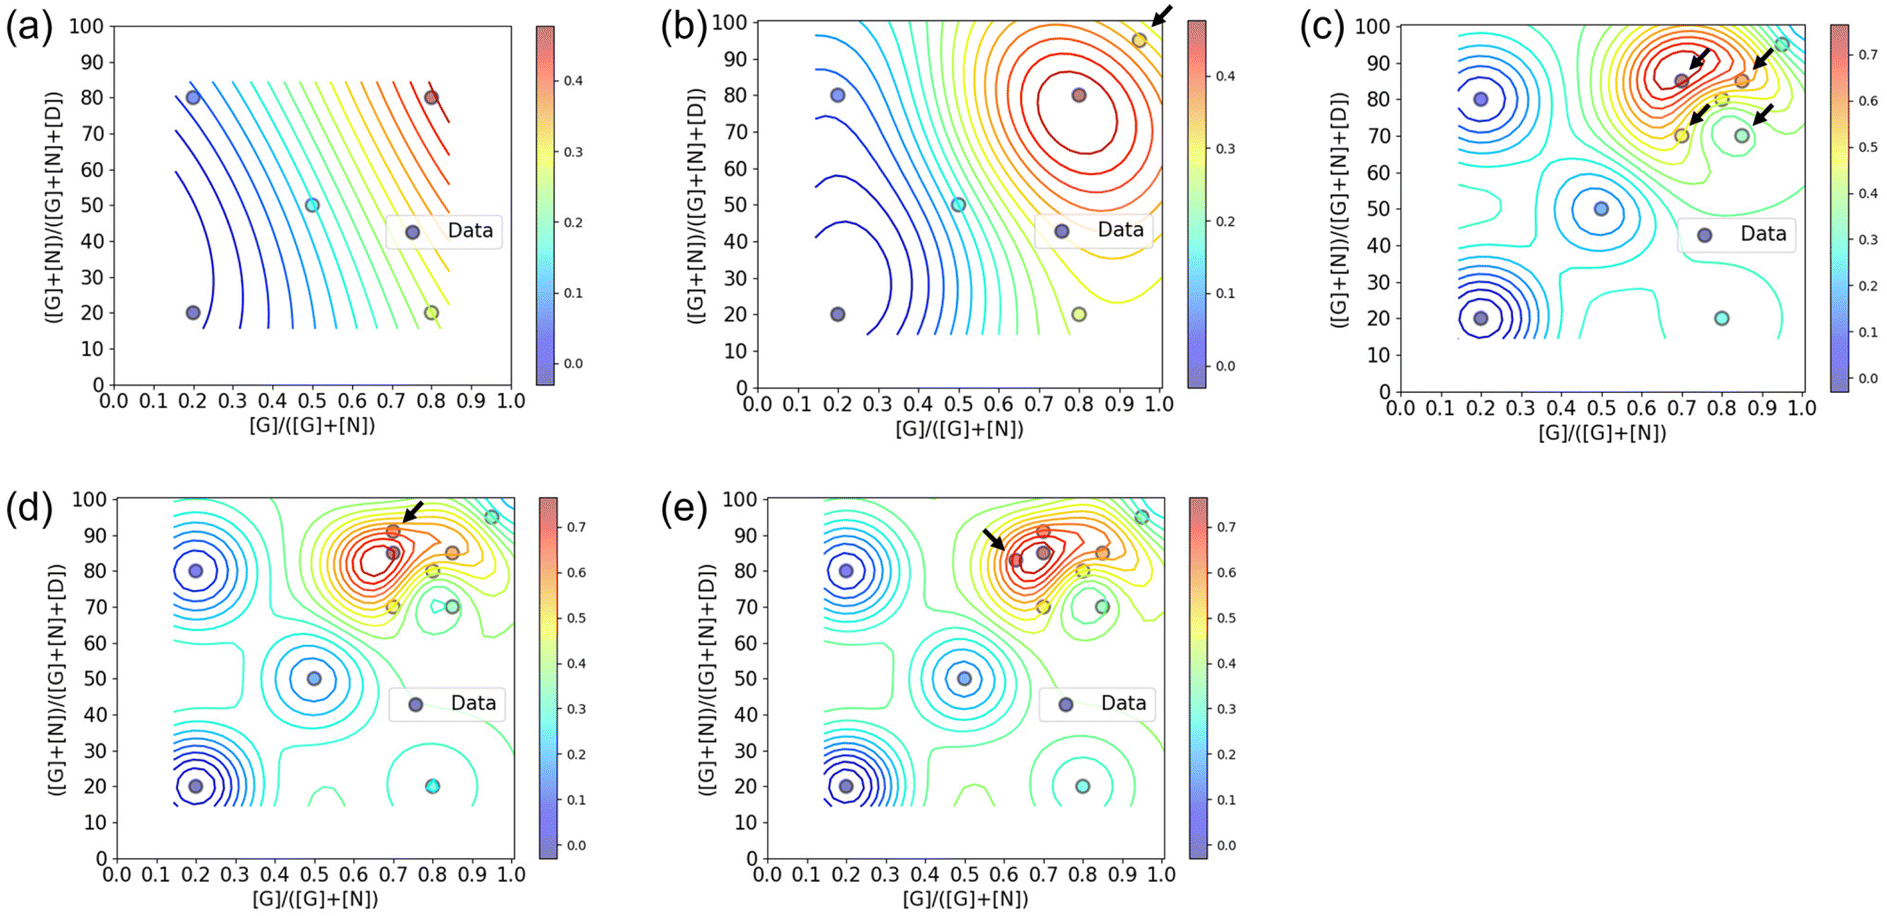 | ||
| Fig. 2 Estimated yield from results of ELISA using glycopolymers obtained after 1st (a), 2nd (b), 3rd (c), 4th (d), and 5th (e) cycles. X and Y axis represent parameters applied to the calculation. Red and blue area represent low and high absorbance obtained by ELISA. Black arrows indicate the points which is added in that cycle. | ||
The five glycopolymers were synthesized using photoinduced electron/energy transfer-reversible addition–fragmentation chain transfer polymerization (PET-RAFT polymerization).10,23,24 PET-RAFT polymerization enables polymer synthesis through radical polymerization under ambient conditions, such as at room temperature and in the presence of oxygen. These features are suitable for preparation of a copolymer library. The monomer concentration [M] was fixed at 0.5 M. The monomer, RAFT agent, photocatalyst (eosin Y), and reducing agent (ascorbic acid) were mixed at a ratio of 100:1:0.01:1 in Milli-Q water (200 μL). Each mixture was added to a 96-well plate and irradiated with LED light (λ = 527 nm) for 3 h at room temperature. The monomer conversions and molecular weights were determined by proton nuclear magnetic resonance (1H NMR) and size exclusion chromatography (SEC) analysis, respectively (Table 1, 1st cycle). The monomer conversions were over 90%, and the polymerization proceeded successfully. The dispersities of the glycopolymers were narrow (Mw/Mn < 1.12), indicating the good control in the polymerization.
| Cycle | Polymer | Carbohydrate ratiob (–) | Total carbohydrate ratiob (mol%) | Conv.c (%) | M n |
|---|---|---|---|---|---|
|
a The ratio of [monomer]:[RAFT]:[eosin Y]:[ascorbic acid] = 100:1:0.01:1.
b
G, N, and D represent functional units of galactose, Neu5Ac, and DMA monomer, respectively.
c Monomer conversion was determined by 1H NMR.
d The relative molecular weight (Mn) was determined by SEC analysis calibrated with a polyethylene glycol standard. The eluent was 100 mM NaNO3 (aq).
e The composition that exhibited the strongest interaction with CTB.
|
|||||
| 1st | G4N16D80 | 0.20 | 20 | 95 | 5200 |
| G16N64D20 | 0.20 | 80 | 94 | 5700 | |
| G25N25D50 | 0.50 | 50 | 95 | 5000 | |
| G16N4D80 | 0.80 | 20 | 96 | 4800 | |
| G64N16D20 | 0.80 | 80 | 93 | 3600 | |
| 2nd | G90N5D5 | 0.95 | 95 | 96 | 4000 |
| 3rd | G49N21D30 | 0.70 | 70 | 98 | 4700 |
| G60N10D30 | 0.85 | 70 | 98 | 5000 | |
|
G60N25D15e |
0.70 | 85 | 98 | 4800 | |
| G72N13D15 | 0.85 | 85 | 98 | 4600 | |
| 4th | G64N27D9 | 0.70 | 91 | 98 | 7400 |
| 5th | G52N31D17 | 0.63 | 83 | 97 | 7400 |
The interactions of the glycopolymers with CTB was assessed using ELISA.25 GM1 ganglioside was immobilized on the bottom of the wells, and mixtures of CTB and each glycopolymer were added in the wells. After washing, primary and secondary antibodies were bound to CTB adsorbed on the bottom of the wells, and the colorimetric reaction of the tetramethylbenzidine substrate by Horseradish peroxidase was quantified using a plate reader at 450 nm. Among the five glycopolymers, G64N16D20 {(x, y) = (0.8, 80)} exhibited the lowest absorbance, indicating the highest CTB inhibition capability (Fig. S14†). The absorbance in ELISA of the five glycopolymers was normalized and applied to Bayesian estimation (Fig. 2a and Table S1†). In the yellow region, where the carbohydrate ratio is high and the ratio of galactose units among the total carbohydrate units is also high, the glycopolymer bound to CTB more strongly than the other polymers. At this stage, no local maximal value was predicted. Based on the graph of confidence intervals, a glycopolymer composition that likely to exhibit stronger interaction {(x, y) = (0.95, 95)} was predicted (Fig. S19†).
The predicted glycopolymer (G90N5D5) was synthesized, and their interaction with CTB was assessed by ELISA (Fig. S15† and Table 1, 2nd cycle). The obtained result was combined with the results of the previous five glycopolymers, and the contour lines were redrawn (Fig. 2b and Table S2†). By adding the results of the 6th point, a local maximal value was observed. Vertical cuts were made around this maximal value, and confidence intervals were calculated using Bayesian estimation (Fig. S20†). The location showing the highest ELISA inhibition effect was chosen as the next exploration point, and glycopolymers with corresponding compositions were synthesized {(x, y) = (0.7, 70), (0.85, 70), (0.7, 85), and (0.85, 85)}. The results of ELISA were fed back into the cycle (Fig. S16 and Table S3†). This process was repeated, and after the 5th cycle, the point where the highest ELISA result was expected coincided with the maximum value, thus concluding the optimization cycle (Fig. 2c–e and Fig. S17, S18, S21–S23, Tables S4, S5†). Through this process, optimization of the glycopolymer structure was achieved by synthesizing a total of 12 polymer samples over five cycles. The composition of the glycopolymer at the maximum value was determined to be G60N25D15, which was shown in the 3rd cycle. The 4th and 5th cycles further improved its reliability. When we previously analyzed the interactions of glycopolymers presenting galactose and Neu5Ac with CTB in a high throughput screening method, the optimal polymer structure was determined by SPRI measurements using 28 types of glycopolymers carrying different ratios of the carbohydrate units. The optimal polymer was found to be carrying 70 mol% of galactose and 20 mol% of Neu5Ac.10 In contrast, the Bayesian optimization in this study determined the optimal polymer structure by repeatedly evaluating the interactions of the glycopolymers and making predictions for the better structures based on that evaluation. The optimization started with 5 types of the polymer samples, and finally, the optimal structure was determined with 12 types of the glycopolymers. Although the number of total polymer samples in the Bayesian optimization were smaller than that in the high throughput screening, both methods arrived at the optimal glycopolymer structures with the similar compositions. These compositions featured high carbohydrate ratios, with galactose being more abundant than Neu5Ac. These results indicate that the Bayesian optimization can serve as an alternative method to the high throughput screening for determining optimal polymer structures with biomolecular recognition.
To quantify the interaction between the optimized polymer structure and CTB, ELISA with varying concentrations were performed to determine the IC50 values (Fig. 3). The optimized structure G60N25D15 exhibited an IC50 value of 75 μM, which is 7 times lower than that presenting lower amount of Neu5Ac (G60N10D30, IC50 = 540 μM). This result indicates that even a 15 mol% difference in the polymer composition of Neu5Ac leads to a significant difference in the biomolecular function, and the Bayesian optimization allowed identification the correlation between the polymer structure and function. This clearly demonstrates the ability to determine synthetic polymer structures with superior functionality using Bayesian estimation. Although the interaction of the optimized glycopolymer with CTB is still 1000 times weaker than that of GM1 (an IC50 value of GM1 for CTB inhibition is 80 nM),25 further development of synthetic materials comparable to natural ones is expected through the design of polymer structures in the future.
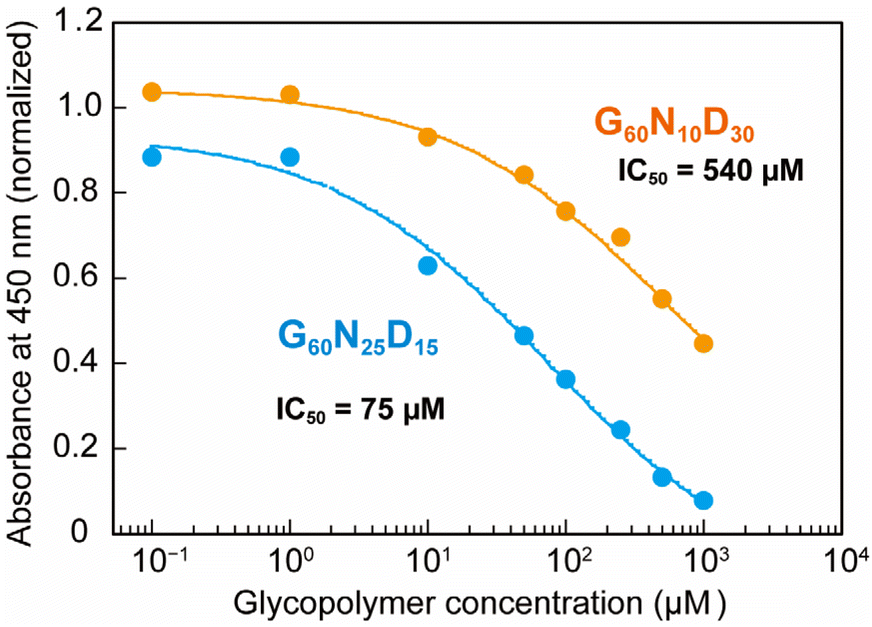 | ||
| Fig. 3 Plots of normalized absorbance in ELISA. Blue and orange plots represent the glycopolymer of G60N25D15 (optimized one) and G60N10D30, respectively. | ||
In conclusion, using the concept of the “carbohydrate module method” to mimic GM1, we performed Bayesian optimization to determine the optimal structure of glycopolymer that strongly binds to CTB. When conducting Gaussian process regression, we used the ratio of carbohydrate units to each other as the x-axis and the overall ratio of galactose and Neu5Ac side chains in the polymer as the y-axis. Initially, five different compositions of glycopolymers were synthesized via PET-RAFT polymerization to cover the entire range of polymer compositions. Upon performing Gaussian process regression with the ELISA results, no local maximal value was observed, prompting the addition of another composition combination around the maximum value in the second cycle. In the third cycle, a point where the interaction reached a maximum was identified, and the fourth and fifth cycles further improved its reliability. In total, five cycles were conducted, resulting in the synthesis of 12 different polymers. The polymer with the optimized structure obtained through this method exhibited an IC50 value of 75 μM for CTB inhibition, which was lower than that of the non-optimized glycopolymer. This study represents the first example of Bayesian optimization of the functionality of synthetic polymers with monomer unit structures as variables for molecular recognition, contributing to the development of functional polymers using machine learning that is expected to evolve in the future. Expanding the scope to include primary structure aspects like monomer sequence and stereoregularity would open new avenues for exploration.
Author contributions
The research project was planned by M. Nagao and Y. Miura. The experiments were conducted by O. Nakahara. The manuscript was written by M. Nagao. X. Zhou and H. Matsumoto provided advice to improve the quality of the research.Conflicts of interest
There are no conflicts to declare.Acknowledgements
This work was financially supported by JSPS Grants-in-Aid (JP22H04553, JP22H05372, JP22H05048, JP22K19068, JP23H02015, and JP24K17726).References
- K. C. Nicolaou, C. R. H. Hale, C. Nilewski and H. A. Ioannidou, Chem. Soc. Rev., 2012, 41, 5185–5238 RSC.
- S. B. H. Kent, Chem. Soc. Rev., 2009, 38, 338–351 RSC.
- F. Schwizer, Y. Okamoto, T. Heinisch, Y. Gu, M. M. Pellizzoni, V. Lebrun, R. Reuter, V. Köhler, J. C. Lewis and T. R. Ward, Chem. Rev., 2018, 118, 142–231 CrossRef CAS PubMed.
- A. Imberty and S. Pérez, Chem. Rev., 2000, 100, 4567–4588 CrossRef CAS PubMed.
- W. B. Turnbull, B. L. Precious and S. W. Homans, J. Am. Chem. Soc., 2004, 126, 1047–1054 CrossRef CAS PubMed.
- H. Zuilhof, Acc. Chem. Res., 2016, 49, 274–285 CrossRef CAS PubMed.
- K. Sasaki, Y. Nishida, T. Tsurumi, H. Uzawa, H. Kondo and K. Kobayashi, Angew. Chem., Int. Ed., 2002, 41, 4463–4467 CrossRef CAS PubMed.
- Y. Nishida, H. Uzawa, T. Toba, K. Sasaki, H. Kondo and K. Kobayashi, Biomacromolecules, 2000, 1, 68–74 CrossRef CAS PubMed.
- Y. Terada, Y. Hoshino and Y. Miura, Chem. - Asian J., 2019, 14, 1021–1027 CrossRef CAS PubMed.
- M. Nagao, T. Uemura, T. Horiuchi, Y. Hoshino and Y. Miura, Chem. Commun., 2021, 57, 10871–10874 RSC.
- J. Bergstra and Y. Bengio, J. Mach. Learn. Res., 2012, 13, 281–305 Search PubMed.
- B. Sanchez-Lengeling and A. Aspuru-Guzik, Science, 2018, 361, 360–365 CrossRef CAS PubMed.
- P. Raccuglia, K. C. Elbert, P. D. F. Adler, C. Falk, M. B. Wenny, A. Mollo, M. Zeller, S. A. Friedler, J. Schrier and A. J. Norquist, Nature, 2016, 533, 73–76 CrossRef CAS PubMed.
- M. S. Sigman, K. C. Harper, E. N. Bess and A. Milo, Acc. Chem. Res., 2016, 49, 1292–1301 CrossRef CAS PubMed.
- Y. Jin and P. V. Kumar, Nanoscale, 2023, 15, 10975–10984 RSC.
- S. M. McDonald, E. K. Augustine, Q. Lanners, C. Rudin, L. C. Brinson and M. L. Becker, Nat. Commun., 2023, 14, 4838 CrossRef CAS PubMed.
- M. A. Sanders, S. S. Chittari, N. Sherman, J. R. Foley and A. S. Knight, J. Am. Chem. Soc., 2023, 145, 9686–9692 CrossRef CAS PubMed.
- X. Xu, W. Zhao, L. Wang, J. Lin and L. Du, Chem. Sci., 2023, 14, 10203–10211 RSC.
- L. L. Kiessling and J. C. Grim, Chem. Soc. Rev., 2013, 42, 4476–4491 RSC.
- M. Nagao, H. Matsumoto and Y. Miura, Chem. – Asian J., 2023, 18, e202300643 CrossRef CAS PubMed.
- M. Nagao, Y. Fujiwara, T. Matsubara, Y. Hoshino, T. Sato and Y. Miura, Biomacromolecules, 2017, 18, 4385–4392 CrossRef CAS PubMed.
- M. Kondo, H. D. P. Wathsala, M. Sako, Y. Hanatani, K. Ishikawa, S. Hara, T. Takaai, T. Washio, S. Takizawa and H. Sasai, Chem. Commun., 2020, 56, 1259–1262 RSC.
- S. Shanmugam, J. Xu and C. Boyer, Macromolecules, 2016, 49, 9345–9357 CrossRef CAS.
- J. Phommalysack-Lovan, Y. Chu, C. Boyer and J. Xu, Chem. Commun., 2018, 54, 6591–6606 RSC.
- R. M. Dawson, J. Appl. Toxicol., 2005, 25, 30–38 CrossRef CAS PubMed.
Footnote |
| † Electronic supplementary information (ESI) available: Materials, characterization, 1H NMR spectra of the glycopolymers, condition of the RAFT polymerization, results of ELISA, and results of Gaussian process regression. See DOI: https://doi.org/10.1039/d4nr00915k |
| This journal is © The Royal Society of Chemistry 2024 |