 Open Access Article
Six-dimensional quantum dynamics of an Eley–Rideal reaction between gaseous and adsorbed hydrogen atoms on Cu(111)
Longlong Xionga,
Liang Zhanga,
Bin Zhao*b and
Bin Jiang *ac
*ac
aDepartment of Chemical Physics, Key Laboratory of Precision and Intelligent Chemistry, Key Laboratory of Surface and Interface Chemistry and Energy Catalysis of Anhui Higher Education Institutes, University of Science and Technology of China, Hefei, Anhui 230026, China. E-mail: bjiangch@ustc.edu.cn
bDepartment of Chemistry, Southern University of Science and Technology, Shenzhen, 518055, P. R. China. E-mail: zhaobin@sustech.edu.cn
cHefei National Laboratory, University of Science and Technology of China, Hefei, 230088, China
First published on 17th May 2024
Abstract
In the form of direct abstraction of a surface adsorbate by a gaseous projectile, the Eley–Rideal (ER) reaction at the gas–surface interface manifests interesting dynamics. Unfortunately, high-dimensional quantum dynamical (QD) studies for ER reactions remain very challenging, which demands a large configuration space and the coordinate transformation of wavefunctions. Here, we report the first six-dimensional (6D) fully coupled quantum scattering method for studying the ER reaction between gas phase H(D) atoms and adsorbed D(H) atoms on a rigid Cu(111) surface. Reaction probabilities and product rovibrational state distributions obtained by this 6D model are found to be quite different from those obtained by reduced-dimensional QD models, demonstrating the high-dimensional nature of the ER reaction. Using two distinct potential energy surfaces (PESs), we further discuss the influence of the PES on the calculated product vibrational and rotational state distributions, in comparison with experimental results. The lateral corrugation and the exothermicity of the PES are found to play a critical role in controlling the energy disposal in the ER reaction.
I. Introduction
Surface reactions are pivotal in a multitude of interfacial processes, ranging from interstellar and atmospheric chemistry1 to heterogeneous catalysis,2 crystal growth,3 and plasma chemistry.4 Understanding surface reaction mechanisms is of great importance, both from a fundamental perspective and for practical applications.5–9 A majority of surface reactions proceed through the Langmuir–Hinshelwood (LH) mechanism.10 This model posits that reactions occur between adsorbed species situated in neighboring sites, which are in complete thermal equilibrium with the surface and can be well understood by statistical models. An alternative type of reaction occurring between a gaseous and an adsorbed species on the surface is generally referred to as the Eley–Rideal (ER) reaction.11 More specifically, the gaseous species can either engage in a direct collision with the adsorbate, leading to an immediate ER mechanism, or transform into a highly mobile “hot” precursor on the surface and undergo multiple rebounds on the surface before eventually abstracting the adsorbate to form the product. This latter scenario is thus often referred to as the hot-atom (HA) mechanism.12 Both direct ER and indirect HA mechanisms possess non-thermal distributions of product energies and momenta that differ significantly from those in the LH mechanism. As a result, reaction dynamics can play an imperative role in such reactions.13Experimentally, several ER reactions on metal surfaces have been measured with quantum-state resolved resolution,14–29 among which the recombination of H (D) atoms and a pre-covered D (H) atoms on Cu(111), referred to as H-on-D (D-on-H) hereafter, represents the simplest and one of most studied systems.15,17–19 Rettner and Auerbach19 found that the overall probability of forming HD is as high as ∼0.47, which includes both immediate ER and HA contributions. Notably, the HD product carries a substantial amount of internal energy, up to the maximum level allowed by the exothermicity of this process. In the case of D-on-H, HD products in vibrational states from v = 0 to v = 3 exhibit similar populations, while v = 4 is less populated, yielding a mean vibrational energy of ∼0.7 eV. On the other hand, the vibrational state distribution for H-on-D is somewhat colder peaking at v = 1 and the mean vibrational energy is ∼0.6 eV. The rotational state distribution is also hot which falls gradually with increasing v in both cases. The measured mean rotational energy is 0.37 eV for H-on-D and 0.35 eV for D-on-H.
These experiments have motivated various theoretical models for investigating the ER reaction mechanism at the atomic level.30–36 Thanks to its computational efficiency, the quasi-classical trajectory (QCT) method has been easily applied in combination with high-dimensional potential energy surfaces (PESs). These QCT simulations have been performed using empirical PESs at early stages and neural network PESs more recently, which account for relevant factors such as surface coverage and surface temperature.37–48 In addition, some QCT studies49–53 have investigated the impact of electron–hole pairs on the ER reaction based on the electronic friction theory within the local density friction approximation.54 These studies found that electron–hole pair excitations lead to additional energy loss of the hyperthermal hydrogen atoms and thus typically reduce the ER reactivity, but do not alter the product state distribution very much. Unfortunately, the QCT method is approximate and neglects quantum effects like the conservation of zero-point energy and tunneling. On the other hand, more rigorous quantum dynamical (QD) calculations are much more challenging due to the exponential increase of computational cost with respect to dimensionality. Early QD calculations on the ER reaction have relied on empirical PESs and low-dimensional models. Kratzer and Brenig30 initiated a collinear two-dimensional (2D) quantum model, which predicted a too hot vibrational state distribution of the H2 product molecule for the H + H/Cu(111) ER reaction. Jackson and Persson32 extended the QD calculation to a three-dimensional (3D) flat surface model, ignoring surface corrugation while treating the product HD molecule as a rigid rotor. Their results showed a substantial degree of rotational excitation of the HD molecule, although the rotational distribution shows some oscillations. Dai and Light34 developed a four-dimensional (4D) quantum model that includes the corrugation of the surface along one specific direction. However, even on a rigid surface, two additional degrees of freedom (DOFs) are still missing, preventing a comprehensive understanding of the internal energy transfer dynamics in this ER reaction. The theoretical development for the simplest ER reaction between two atoms lacks far behind that for the dissociative chemisorption or inelastic scattering of diatomic molecules. In latter cases, the configuration space is less substantial and six-dimensional (6D) QD calculations have been routinely performed.55–59
In this work, we present the first 6D fully-coupled QD method for an ER reaction between two atoms on rigid surfaces, considering the full corrugation of the atom/molecule–surface interaction potential. This time-dependent wavepacket method has been applied to the ER recombination of H(D) atoms and a pre-covered D(H) atom on Cu(111). Section II describes the details of the method and dynamical calculations. In Section III, we compare current results with previous reduced-dimensional ones and available experimental data. Their differences are discussed. Finally, we conclude in Section IV.
II. Theory
A. Time-dependent quantum wavepacket approach
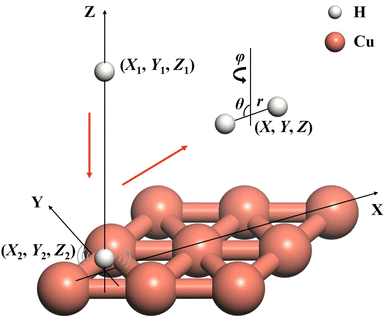
The ER reaction of two atoms on a static surface involves six DOFs, as depicted in Fig. 1. The 6D Hamiltonian (ℏ = 1 hereafter) for the reactants can be expressed in terms of the Cartesian coordinates of two atoms (subscript 1 for the incident atom and 2 for the adsorbed atom),
 | (1) |
The initial wave-packet is a product of three Gaussian functions that are imposed on the plane-waves of the incident atom in the X, Y and Z directions and the initial vibrational state wavefunction of the adsorbed atom,
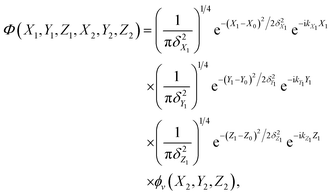 | (2) |
To obtain the product state-resolved information, it is necessary to represent the wavepacket in the diatomic product coordinate frame, where the Hamiltonian is rewritten as follows,
Ĥ = ![[K with combining circumflex]](https://www.rsc.org/images/entities/i_char_004b_0302.gif) X,Y,Z + X,Y,Z + ![[K with combining circumflex]](https://www.rsc.org/images/entities/i_char_004b_0302.gif) vib + vib + ![[K with combining circumflex]](https://www.rsc.org/images/entities/i_char_004b_0302.gif) rot + V(X, Y, Z, r, θ, φ). rot + V(X, Y, Z, r, θ, φ).
| (3) |
 | (4) |
 | (5) |
In practice, the initial wavepacket constructed in the reactant Cartesian coordinate frame is first transformed to the product coordinate frame, which is expanded by the sine discrete variable representation (DVR)61 for X, Y, Z, and r, the Gaussian–Legendre DVR for θ, and Fourier DVR for φ,62 plus a Jacobian factor r2![[thin space (1/6-em)]](https://www.rsc.org/images/entities/char_2009.gif) sin
sin![[thin space (1/6-em)]](https://www.rsc.org/images/entities/char_2009.gif) θ. The wavepacket is then propagated by the split-operator method63 in the product coordinates,
θ. The wavepacket is then propagated by the split-operator method63 in the product coordinates,
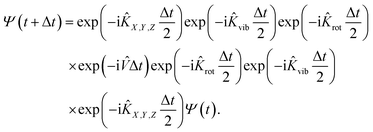 | (6) |
Specifically, the kinetic energy term is computed in the finite basis representation (FBR), while the potential energy term is evaluated at DVR grids. To prevent boundary reflections, the wavepacket is absorbed at the grid edges.64 This 6D model can be reduced to a 4D one by fixing Y and φ coordinates, which can be directly compared with that of Dai and Light (see ref. 34).
The ER reaction probability (P(E)) at a given total energy (E) is obtained by the reactive flux method at the dividing surface Z = Zf where the molecule–surface interaction is nearly zero,
P(E) = 〈ψ+E|![[F with combining circumflex]](https://www.rsc.org/images/entities/i_char_0046_0302.gif) (Zf)|ψ+E〉, (Zf)|ψ+E〉,
| (7) |
![[F with combining circumflex]](https://www.rsc.org/images/entities/i_char_0046_0302.gif) is the flux operator and |ψ+E〉 is the scattering wave function defined as,
is the flux operator and |ψ+E〉 is the scattering wave function defined as,
 | (8) |
B. Potential energy surfaces
Our 6D quantum wavepacket model describes how an impinging atom reacts with a single adsorbate on a rigid surface. For simplicity, an empirical London–Eyring–Polanyi–Sato (LEPS) function has been applied to approximate the interaction potential of two atoms plus a rigid surface with proper periodicity. The LEPS form of the H2 + Cu(111) PES is defined by| V = U1 + U2 + U3 − [Q21 + (Q2 + Q3)2 − Q1(Q2 + Q3)]1/2, | (9) |
 | (10) |
 | (11) |
To take the surface corrugation into account, the Morse parameters describing the H–Cu interaction, namely Di, αi, and qi0, depend on the lateral position of the atom in the surface unit cell. Two different PESs are used in this work, whose parameters were fitted to total energies of the density functional theory (DFT) computed by Dai and Zhang65 (referred to as the DZ PES hereafter) and by Shalashilin, Jackson and Persson38 (referred to as the SJP PES hereafter). As seen below, their different energy landscapes result in distinct product state distributions.
C. Computational details
In all QD calculations, the lateral momenta kX1 and kY1 were initialized at zero representing normal incidence. To minimize the lateral momentum components, we set the Gaussian width δX1 and δY1 to 3.0 bohr, corresponding to a broad spatial distribution (in turn a sharp distribution in the conjugated momentum space). We set the mean energy of the incident atom to 0.1 eV and the Gaussian width δZ1 to 0.1 bohr. Following the work of Dai and Light,34 we made a minor adjustment to the PES to accelerate the convergence. Specifically, we truncated the long-range H–Cu interactions at 7.0 bohr, namely that U(7.0) = U(q) and Q(7.0) = Q(q) for q > 7.0. This truncation will reduce computational cost but not introduce significant differences in the results. As a benefit of this treatment, we could place the initial wave packet at 8.0 bohr. Most parameters used in QD calculations are listed in Table 1. We set the center site where the adsorbed atom resides, as the origin and the lateral range from −9 bohr to 9 bohr, which approximately corresponds to a 3 × 3 surface cell size. In the single-adsorbate limit, the chosen size is sufficient to cover the width of the lateral wavepacket of the incident atom. As expected, the density of DVR grids here is much higher than typically used for the dissociative chemisorption of H2 and the maximum number of total basis functions reaches ∼3 × 10¹¹. To eliminate boundary reflection, the quadratic-form absorbing potentials with a length of 2.0 bohr are imposed on the edges of the grid points (left-hand side and right-hand side of X and Y, large ends of Z and r).| Parameter | H-on-D | D-on-H |
|---|---|---|
| Grid range and size in (X, Y) | X = Y = [−9, +9], NX = NY = 95 | X = Y = [−9, +9], NX = NY = 95 |
| Grid range and size in Z | Z = [0.5, 10], NZ = 97 | Z = [0.5, 11], NZ = 105 |
| Grid range and size in r | r = [0.5, 13.5], Nr = 84 | r = [0.5, 13.5], Nr = 84 |
| (jmax, mjmax) | (52, 45) | (52, 45) |
| Incident atom | X0 = 0, Y0 = 0, Z0 = 8 | X0 = 0, Y0 = 0, Z0 = 8 |
| Flux position | 8 | 9 |
| Time step | 10 | 10 |
| Propagation time | 30![[thin space (1/6-em)]](https://www.rsc.org/images/entities/char_2009.gif) 000 000 |
30![[thin space (1/6-em)]](https://www.rsc.org/images/entities/char_2009.gif) 000 000 |
III. Results and discussion
A. Reactivity
Utilizing the DZ PES, we firstly investigate the reactivity of the ER reaction between H atoms and H-covered Cu(111), where previous 4D QD calculations were available for comparison. In Fig. 2, we compare the 6D reaction probability with our 4D result and the 4D result of Dai and Light34 on the same PES, as a function of incident energy (Ei) and different isotopic combinations in normal incidence. Our 4D reaction probability is somewhat lower than that of Dai and Light at high incidence energies, due presumably to different convergence behaviors, as we have used a much larger basis set. Importantly, the 4D reaction probabilities are considerably higher than the 6D ones in both isotopic cases. This phenomenon can be attributed to the fairly confined atomic motion in the 4D model, which greatly enhances the likelihood of reactive collisions and thereby leads to a higher reaction probability. A common feature of both models is that the reaction probability for D-on-H is slightly higher than that for H-on-D. For example, at Ei = 0.08 eV, the 6D reaction probabilities are 0.038 and 0.026 for D-on-H and H-on-D, which are consistent with those reported in an early 3D quantum model,32 but are unfortunately much lower than the experimental ones of 0.47 ± 0.12 at Ei = 0.07 eV and θi = 10°.19 The disagreement between experimental and theoretical results is at least partially associated with the fact that the simulation is done in the single-adsorbate limit, while the experimental coverage is about 0.5 monolayer (ML). Note that the absolute reaction probability depends on the applied surface cell size, which corresponds roughly to a ∼0.1 ML coverage here. The larger supercell, the smaller the chance of the impinging hydrogen striking right at the adsorbed hydrogen, thus both ER and HA channels are suppressed. Indeed, previous QCT studies with a coverage of 0.5 ML have found that the formation of HD occurs via both direct ER and HA routes, where the HA mechanism is predominant.38,49 The direct ER reaction probability is generally less than 0.1,49 which is consistent with our single-adsorbate 6D quantum results for which the multi-bounce HA channel has little contribution. The current QD model cannot describe the HA channel very well because the grid size in the lateral direction is limited to keep the computational cost affordable and the wavepacket has to be adsorbed in the boundary. It will hardly cover the scenario where the hot H atom travels over a long distance and recombines with the adsorbate. Fortunately, the product state distributions from direct ER and HA mechanisms were found to not be very different.35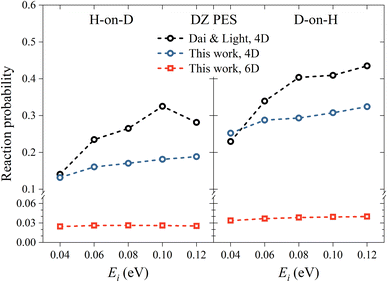 | ||
| Fig. 2 H-on-D (left panel) and D-on-H (right panel) Eley–Rideal reaction probabilities as a function of incident energy for normal incidence on the DZ PES. The data of Dai and Light are taken from ref. 34. | ||
B. Product state distributions
Next, in Fig. 3(a) and (b), we compare the vibrational state distributions of HD for the H-on-D and D-on-H reactions obtained from the 4D and 6D calculations as well as the 4D outcomes of Dai and Light.34 Here, the two sets of 4D results agree reasonably well with each other, especially in the D-on-H case. In addition, the 6D quantum model predicts apparently lower vibrational excitation than the 4D ones, especially for H-on-D, where the 6D vibrational state distribution peaks at v = 0 and decreases monotonically to v = 5. It is understandable that the energy flow in the reduced-dimensional model is limited to fewer DOFs, thus directing more energy into the vibrational motion and resulting in a higher extent of vibrational excitation. Unsurprisingly, this phenomenon was more severe in the earlier 2D collinear model,30 yielding more significant vibrational excitation in the product due to the absence of rotational DOFs.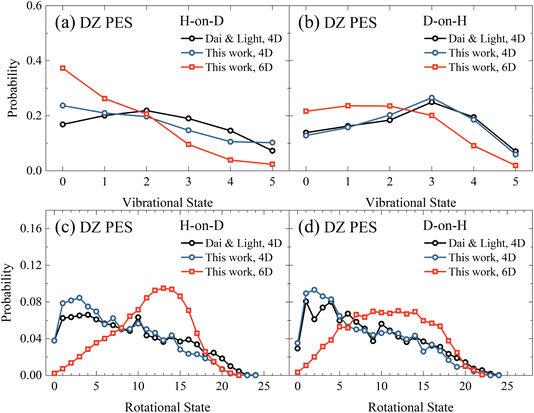 | ||
| Fig. 3 The vibrational state (a and b) and rotational state (c and d) distributions of the product HD in the H-on-D and D-on-H reactions from 4D and 6D calculations. The incident atom has an initial translational energy of 0.08 eV and collides with the surface at normal incidence in both 4D and 6D calculations, both of which are based on the DZ PES. The data of Dai and Light are taken from ref. 34. | ||
Fig. 3(c) and (d) compare rotational state distributions of HD. Again, our 4D results here are close to the 4D results of Dai and Light,34 showing the too cold rotational state distributions are dominated by low-lying states. The rotational excitation in the present 6D QD model is more significant than in 4D models due partly to the less significant vibrational excitation in the former, considering energy conservation. Moreover, in the 4D model each rotational-state j of HD has only twofold degeneracy for j > 0 since the azimuthal angle is not included, while the actual HD rotational degeneracy is 2j + 1.34 Additionally, the constrained in-plane rotational motion in the 4D model causes some oscillations in the rotational state distribution. This oscillation behavior was found to be even more pronounced in the 3D model.35 These results highlight the importance of fully describing molecular rotation in the 6D model. Interestingly, the 6D result also exhibits an obvious isotope effect, namely a broader rotational state distribution for the D-on-H reaction than for the H-on-D reaction. This difference may be partly attributed to the larger zero-point energy of adsorbed H (135.9 meV) compared to D (96.8 meV). In addition, H-on-D events correspond to light-on-heavy impulsive collisions, whose reaction impact parameters tend to be larger than those of the heavy-on-light D-on-H collisions, giving rise to a hotter rotational state distribution.33
In comparison with experiments,19 we find that the new 6D results on the DZ PES agree reasonably well with measured vibrational state distributions but significantly overestimate the rotational state distributions, as shown in Fig. 4. Specifically, the calculated mean vibrational energies from 6D QD calculations excluding vibrational zero-point energy are 0.50 eV and 0.72 eV for H-on-D and D-on-H, which are compared with 0.60 ± 0.05 eV and 0.68 ± 0.05 eV of experimental values.19 On the other hand, the experimental mean rotational energies for H-on-D and D-on-H are 0.37 ± 0.05 eV and 0.35 ± 0.05 eV, which are only half of our 6D results of 0.77 and 0.70 eV, respectively. Since the reaction is very fast and H/D atoms are much lighter than surface atoms, the influence of coverage and surface temperature on the rovibrational states of the products are expected to be relatively small.40,47,48 Therefore, this remarkable discrepancy between theory and experiment more likely stems from the inaccuracy of the PES.
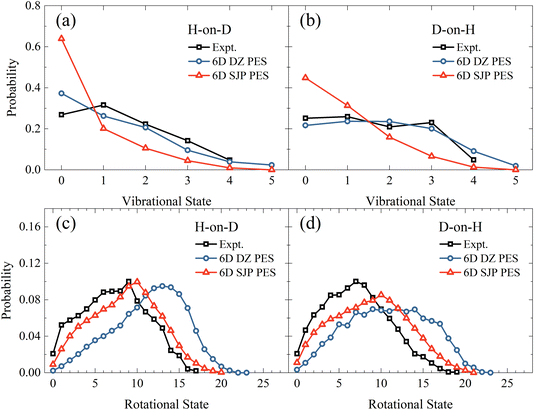 | ||
| Fig. 4 Vibrational state (a and b) and rotational state (c and d) distributions of the product HD in the H-on-D and D-on-H reactions, from 6D QD calculations based on the SJP PES and the DZ PES. The incident atom has an initial translational energy of 0.08 eV and collides with the surface at normal incidence. The experimental data are taken from ref. 19, at Ei = 0.07 eV and θi = 10°. | ||
To better understand how the PES influences the product vibrational and rotational state distributions of the ER reaction, we have then performed 6D QD calculations on another SJP PESs. As shown in Fig. 4(a) and (b), compared with the results of DZ PES, the vibrational excitation is significantly weaker on the SJP PES. The vibrational state distributions for both isotopic combinations decrease monotonically from v = 0 to v = 5, deviating substantially from experimental data.19 On the other hand, the rotational state distributions obtained on the SJP PES shift to the low-energy end and become closer to experimental results, as illustrated in Fig. 4(c) and (d). Especially in the H-on-D case, the calculated distribution peak is at j = 10, agreeing well with the experimental peak at j = 9. Despite their different absolute probabilities, we note that the rotational state distributions from the two PESs exhibit a similar isotope effect, namely the distribution for D-on-H is broader than for H-on-D.
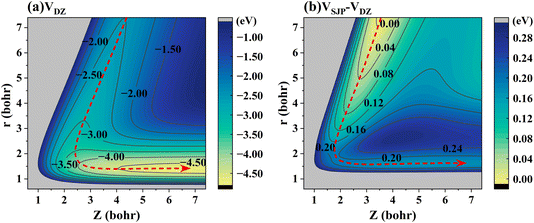
To elaborate on the correlation between the energy landscape and the dynamics in more detail, Fig. 5(a) shows a 2D energy contour plot for the H-on-D reaction channel of the DZ PES with respect to the r and Z of HD, where both H and D are located above the hollow site. It is clearly seen that the titled ER reaction is highly exothermic and barrierless, by which the released energy readily flows into the relative motion of the atoms, thereby leading to vibrational excitation of the HD product. Fig. 5(b) represents a 2D contour plot of the potential energy difference between the SJP PES and DZ PES for the H-on-D reaction channel. In this regard, the DZ PES is more exothermic than the SJP PES by 0.18 eV, which, interestingly, is close to the difference in mean vibrational energies obtained by 6D QD calculations on the two PESs. Hence, the exothermicity of the PES seems to largely control the extent of vibrational excitation.
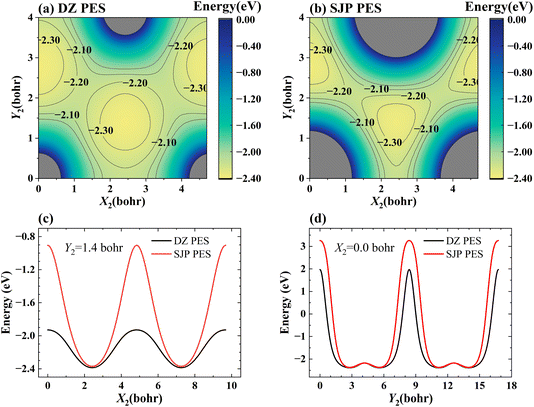
Fig. 6(a) and (b) present the 2D cuts of the two PESs as a function of two lateral coordinates of the adsorbed H atom with its height kept constant (Z2 = 1.88 bohr) when the incident H atom is far from the surface (Z1 = 20 bohr), illustrating how the PES depends on the surface corrugation. One-dimensional cuts of the PES along the X2 and Y2 directions are more clearly shown in Fig. 6(c) and (d), respectively. Apparently, the SJP PES is more corrugated than the DZ PES near the surface. As a result, on the SJP PES, reactive collisions occur in more confined sites and angles so that the rotation of the HD product is relatively less excited.
IV. Conclusion
In summary, we report in this work the first 6D quantum dynamics study of the ER reaction involving H(D) and adsorbed (D) atoms on a rigid Cu(111) surface. The total reaction probabilities and product state distributions obtained from 4D and 6D QD calculations are compared using a physically inspired PES. Their differences highlight that the reduced-dimensional model could artificially modify the energy flow among limited DOFs and emphasize the necessity of using the 6D model that fully describes the vibrational and rotational motion of the ER product. Furthermore, we compare the 6D results on two different PESs with available experimental results. The vibrational and rotational state distributions obtained from the two PESs are quite different. It is found that the greater exothermicity of the DZ PES results in a hotter vibrational state distribution in closer agreement with experiment, while the more corrugated H–Cu(111) interaction of the SJP PES is likely responsible for the less significant rotational excitation that is more consistent with experiment. However, neither of these empirical PESs is chemically accurate. These results underscore the correlation between the potential energy landscape and the energy disposal of an ER reaction. We note that the current QD model works in the single-adsorbate limit, where the probability of multi-bounce HA reaction is so low that the total reaction probability is substantially underestimated. In this respect, it will be interesting to compare QD and QCT results in the 6D model and discuss the influence of quantum effects and multi-bounce HA reactions, which will be published in a subsequent work. Moreover, to go beyond the single-adsorbate limit, a coverage-dependent PES49 constructed by an atomistic neural network may be more reliable. Further development of the QD model in combination with the coverage-dependent PES is necessary for describing both direct ER and HA processes.Conflicts of interest
There are no conflicts of interest to declare.Acknowledgements
This work is supported by the Innovation Program for Quantum Science and Technology (2021ZD0303301), the Strategic Priority Research Program of the Chinese Academy of Sciences (XDB0450101), the National Natural Science Foundation of China (22325304, 22073089, and 22241301). We acknowledge the Supercomputing Center of USTC, Hefei Advanced Computing Center, Beijing PARATERA Tech CO., Ltd for providing the high-performance computing service.References
- A. Potapov and M. McCoustra, Int. Rev. Phys. Chem., 2021, 40, 299–364 Search PubMed.
- G. B. Park, T. N. Kitsopoulos, D. Borodin, K. Golibrzuch, J. Neugebohren, D. J. Auerbach, C. T. Campbell and A. M. Wodtke, Nat. Rev. Chem., 2019, 3, 723–732 Search PubMed.
- Z. Qiu, P. Li, Z. Li and J. Yang, Acc. Chem. Res., 2018, 51, 728–735 CrossRef CAS PubMed.
- A. Fridman, Plasma Chemistry, Cambridge University Press, Cambridge, 2012 Search PubMed.
- D. Borodin, N. Hertl, G. B. Park, M. Schwarzer, J. Fingerhut, Y. Wang, J. Zuo, F. Nitz, G. Skoulatakis, A. Kandratsenka, D. J. Auerbach, D. Schwarzer, H. Guo, T. N. Kitsopoulos and A. M. Wodtke, Science, 2022, 377, 394–398 CrossRef CAS PubMed.
- H. Chadwick and R. D. Beck, Chem. Soc. Rev., 2016, 45, 3576–3594 RSC.
- B. Jiang, M. Yang, D. Xie and H. Guo, Chem. Soc. Rev., 2016, 45, 3621–3640 RSC.
- G.-J. Kroes, Phys. Chem. Chem. Phys., 2021, 23, 8962–9048 RSC.
- A. Sápi, T. Rajkumar, J. Kiss, Á. Kukovecz, Z. Kónya and G. A. Somorjai, Catal. Lett., 2021, 151, 2153–2175 CrossRef.
- I. Langmuir, Trans. Faraday Soc., 1922, 17, 607–620 RSC.
- D. D. Eley and E. K. Rideal, Nature, 1940, 146, 401–402 CrossRef CAS.
- J. Harris and B. Kasemo, Surf. Sci., 1981, 105, L281–L287 CAS.
- B. Jiang and H. Guo, J. Chem. Phys., 2019, 150, 180901 CrossRef PubMed.
- E. W. Kuipers, A. Vardi, A. Danon and A. Amirav, Phys. Rev. Lett., 1991, 66, 116–119 CrossRef CAS PubMed.
- C. T. Rettner, Phys. Rev. Lett., 1992, 69, 383–386 CrossRef CAS PubMed.
- C. T. Rettner, J. Chem. Phys., 1994, 101, 1529–1546 CrossRef CAS.
- C. T. Rettner and D. J. Auerbach, Phys. Rev. Lett., 1995, 74, 4551–4554 CrossRef CAS PubMed.
- C. T. Rettner and D. J. Auerbach, Surf. Sci., 1996, 602–608 CrossRef CAS.
- C. T. Rettner and D. J. Auerbach, J. Chem. Phys., 1996, 104, 2732–2739 CrossRef CAS.
- C. T. Rettner and D. J. Auerbach, J. Chem. Phys., 1996, 105, 8842–8848 CrossRef CAS.
- J.-Y. Kim and J. Lee, Phys. Rev. Lett., 1999, 82, 1325–1328 CrossRef CAS.
- S. Wehner and J. Küppers, J. Chem. Phys., 1998, 108, 3353–3359 CrossRef CAS.
- S. Wehner and J. Küppers, J. Chem. Phys., 1998, 109, 294–300 CrossRef CAS.
- T. Zecho, B. Brandner and J. Küppers, Surf. Sci., 1998, 418, L26–L30 CrossRef CAS.
- S. Wehner and J. Küppers, Surf. Sci., 1998, 411, 46–53 CrossRef CAS.
- D. Kolovos-Vellianitis, T. Kammler and J. Küppers, Surf. Sci., 2000, 454, 316–319 CrossRef.
- F. Khanom, A. Aoki, F. Rahman and A. Namiki, Surf. Sci., 2003, 536, 191–205 CrossRef CAS.
- T. Zaharia, A. W. Kleyn and M. A. Gleeson, Phys. Rev. Lett., 2014, 113, 053201 CrossRef CAS PubMed.
- J. Quan, F. Muttaqien, T. Kondo, T. Kozarashi, T. Mogi, T. Imabayashi, Y. Hamamoto, K. Inagaki, I. Hamada, Y. Morikawa and J. Nakamura, Nat. Chem., 2019, 11, 722–729 CrossRef CAS PubMed.
- P. Kratzer and W. Brenig, Surf. Sci., 1991, 254, 275–280 CrossRef CAS.
- B. Jackson and M. Persson, J. Chem. Phys., 1992, 96, 2378–2386 CrossRef CAS.
- M. Persson and B. Jackson, J. Chem. Phys., 1995, 102, 1078–1093 CrossRef CAS.
- B. Jackson and M. Persson, J. Chem. Phys., 1995, 103, 6257–6269 CrossRef CAS.
- J. Dai and J. C. Light, J. Chem. Phys., 1999, 110, 6511–6518 CrossRef CAS.
- C. Kalyanaraman, D. Lemoine and B. Jackson, Phys. Chem. Chem. Phys., 1999, 1, 1351–1358 RSC.
- A. J. H. M. Meijer, A. J. Farebrother, D. C. Clary and A. J. Fisher, J. Phys. Chem. A, 2001, 105, 2173–2182 CrossRef CAS.
- S. Caratzoulas, B. Jackson and M. Persson, J. Chem. Phys., 1997, 107, 6420 CrossRef CAS.
- D. V. Shalashilin, B. Jackson and M. Persson, Faraday Discuss., 1998, 110, 287–300 RSC.
- M. Persson, J. Stromquist, L. Bengtsson, B. Jackson, D. V. Shalashilin and B. Hammer, J. Chem. Phys., 1999, 110, 2240–2249 CrossRef CAS.
- D. V. Shalashilin, B. Jackson and M. Persson, J. Chem. Phys., 1999, 110, 11038–11046 CrossRef CAS.
- Z. B. Guvenc, X. Sha and B. Jackson, J. Chem. Phys., 2001, 115, 9018–9027 CrossRef CAS.
- D. Lemoine, J. G. Quattrucci and B. Jackson, Phys. Rev. Lett., 2002, 89, 268302 CrossRef PubMed.
- R. Martinazzo, S. Assoni, G. Marinoni and G. F. Tantardini, J. Chem. Phys., 2004, 120, 8761–8771 CrossRef CAS PubMed.
- C. D. Vurdu, S. Özçelik and Z. B. Güvenç, Surf. Sci., 2007, 601, 3745–3749 CrossRef CAS.
- M. Rutigliano and M. Cacciatore, Phys. Chem. Chem. Phys., 2011, 13, 7475–7484 RSC.
- E. Quintas-Sánchez, C. Crespos, P. Larrégaray, J. C. Rayez, L. Martin-Gondre and J. Rubayo-Soneira, J. Chem. Phys., 2013, 138, 024706 CrossRef PubMed.
- R. Pétuya, P. Larrégaray, C. Crespos, P. Aurel, H. F. Busnengo and A. E. Martínez, J. Phys. Chem. C, 2015, 119, 3171–3179 CrossRef.
- C. D. Vurdu and Z. B. Güvenç, J. Chem. Phys., 2011, 134, 164306 CrossRef PubMed.
- L. Zhu, C. Hu, J. Chen and B. Jiang, Phys. Chem. Chem. Phys., 2023, 25, 5479–5488 RSC.
- L. Zhou, X. Zhou, M. Alducin, L. Zhang, B. Jiang and H. Guo, J. Chem. Phys., 2018, 148, 014702 CrossRef PubMed.
- O. Galparsoro, R. Petuya, F. Busnengo, J. I. Juaristi, C. Crespos, M. Alducin and P. Larregaray, Phys. Chem. Chem. Phys., 2016, 18, 31378–31383 RSC.
- O. Galparsoro, H. F. Busnengo, A. E. Martinez, J. I. Juaristi, M. Alducin and P. Larregaray, Phys. Chem. Chem. Phys., 2018, 20, 21334–21344 RSC.
- J. Chen, X. Zhou and B. Jiang, J. Chem. Phys., 2019, 150, 061101 CrossRef PubMed.
- J. I. Juaristi, M. Alducin, R. Díez Muiño, H. F. Busnengo and A. Salin, Phys. Rev. Lett., 2008, 100, 116102 CrossRef CAS PubMed.
- J. Dai and J. C. Light, J. Chem. Phys., 1997, 107, 1676–1679 CrossRef CAS.
- G.-J. Kroes, Prog. Surf. Sci., 1999, 60, 1–85 CrossRef CAS.
- L. Zhu, Y. Zhang, L. Zhang, X. Zhou and B. Jiang, Phys. Chem. Chem. Phys., 2020, 22, 13958–13964 RSC.
- L. Zhang, L. Zhu and B. Jiang, Chin. J. Chem. Phys., 2022, 35, 143–152 CrossRef CAS.
- T. Liu, T. Peng, B. Fu and D. H. Zhang, J. Phys. Chem. Lett., 2023, 14, 9713–9719 CrossRef CAS PubMed.
- T. J. Park and J. C. Light, J. Chem. Phys., 1986, 85, 5870–5876 CrossRef CAS.
- D. T. Colbert and W. H. Miller, J. Chem. Phys., 1992, 96, 1982 CrossRef CAS.
- G. C. Corey and D. Lemoine, J. Chem. Phys., 1992, 97, 4115 CrossRef CAS.
- J. A. Flect Jr, J. R. Morris and M. D. Feit, Appl. Phys., 1976, 10, 129 Search PubMed.
- D. Neuhauser and M. Baer, J. Chem. Phys., 1989, 90, 4351–4355 CrossRef.
- J. Dai and J. Z. H. Zhang, J. Chem. Phys., 1995, 102, 6280–6289 CrossRef CAS.
| This journal is © The Royal Society of Chemistry 2024 |

