 Open Access Article
High-level analytical potential-energy-surface-based dynamics of the OH− + CH3CH2Cl SN2 and E2 reactions in full (24) dimensions†
András B. Nacsa ,
Csenge Tokaji and
Gábor Czakó
 *
*
MTA-SZTE Lendület Computational Reaction Dynamics Research Group, Interdisciplinary Excellence Centre and Department of Physical Chemistry and Materials Science, Institute of Chemistry, University of Szeged, Rerrich Béla tér 1, Szeged H-6720, Hungary. E-mail: gczako@chem.u-szeged.hu
First published on 21st February 2024
Abstract
We develop a coupled-cluster full-dimensional global potential energy surface (PES) for the OH− + CH3CH2Cl reactive system, using the Robosurfer program package, which automatically samples configurations along PES-based trajectories as well as performs ab initio computations with Molpro and fitting with the monomial symmetrization approach. The analytical PES accurately describes both the bimolecular nucleophilic substitution (SN2) and elimination (E2) channels leading to the Cl− + CH3CH2OH and Cl− + H2O + C2H4 products, respectively, and allows efficient quasi-classical trajectory (QCT) simulations. QCT computations on the new PES provide accurate statistically-converged integral and differential cross sections for the OH− + CH3CH2Cl reaction, revealing the competing dynamics and mechanisms of the SN2 and E2 (anti, syn, β–α transfer) channels as well as various additional pathways leading to induced inversion of the CH3CH2Cl reactant, H-exchange between the reactants, H2O⋯Cl− complex formation, and H2O + CH3CHCl− products via proton abstraction.
1. Introduction
Bimolecular nucleophilic substitution (SN2) is probably the best-known type of ion–molecule reaction, especially in organic chemistry. The simplest examples of these processes are the X− + CH3Y reactions, where X and Y are halogens.1–4 As we move beyond the reactions of methyl-halides, a new, so-called bimolecular elimination (E2) channel becomes possible and competes with the SN2 reaction. The prototypes of these reactions are X− + CH3CH2Y, which lead to Y− + CH3CH2X via SN2 and Y− + HX + C2H4 with E2.5–12 Thermodynamically the SN2 channel is usually favored, however, kinetic control cannot decide about the expected outcome of the competition between the SN2 and E2 pathways.9–11 Comprehensive dynamics investigations of the SN2/E2 reactions have been lacking due to the complexity of these systems until very recently. In the past few years the Wester group studied SN2/E2 processes using a crossed-beam technique combined with velocity map imaging.9,11,13,14 These experiments provided unprecedented insights into the competing dynamics of the SN2/E2 reactions, however, the direct measurement for the two channels separately was not possible, because these experiments could only detect the ionic products, which are the same (Y−) for both reactions.9,11,13,14 Therefore, dynamics simulations were needed to disentangle the competing channels. The traditional theoretical approach for SN2 reactions is direct dynamics, where the electronic structure computations of the forces are performed on-the-fly during the quasi-classical trajectory (QCT) computations. This approach was applied to the F− + CH3CH2I reaction by Hase and co-workers in 2017.9 However, direct dynamics simulations are very time consuming, thus, only a low-level of electronic structure theory can be employed and only a few trajectories can be computed, especially for these large SN2/E2 systems. Therefore, it was a real breakthrough that in 2021 we could develop a full-dimensional analytical potential energy surface (PES) for the F− + CH3CH2Cl reaction, which allowed efficient dynamics simulations.11 In collaboration with the Wester group, we revealed that E2 dominates over SN2 in the F− + CH3CH2Cl reaction, which finding was explained by the wider range of reactive attack angles for the former process.11The above-described dynamics investigations motivated several recent studies on the F− + CH3CH2Y [Y = Cl, Br, I] reactions.15–19 Moreover, theoretical studies on the more complex OH− + CH3CH2Y [Y = F, Cl, Br, I] systems have also been started very recently.17,20,21 In 2021 our group characterized the stationary points of the OH− + CH3CH2Y reactions for Y = F, Cl, Br, and I using a high-level explicitly-correlated coupled-cluster method.20 In 2022 Xie and co-workers21 investigated the competing SN2 and E2 mechanisms for the microsolvated OH−(H2O)n=0–4 + CH3CH2Y [Y = Cl, Br, I] reactions using the CCSD(T)/PP/t//MP2/ECP/d level of theory. In 2023 Zhang and co-workers17 reported MP2/aug-cc-pVDZ computations to study the effect of nucleophiles on the SN2/E2 competition in the X− + CH3CH2Cl [X = F, Cl, Br, I, and OH] reactions. Despite the above-mentioned previous work, a “dynamical simulation study” of these reactions “is lacking” as also mentioned in ref. 21. Therefore, in the present study we report a full-dimensional high-level ab initio analytical PES for the 10-atom OH− + CH3CH2Cl system utilizing the Robosurfer program package,22 thereby moving beyond our previous SN2 dynamics studies of 5–9-atom reactions.4,11,23–26 The new PES enables efficient QCT simulations for the competing SN2 and E2 channels and even beyond as we describe in the next sections of this article.
2. Computational details
The first task is to obtain an initial PES. We take the benchmark geometries20 of this 10-atom system and create new geometries by randomly distorting the structures and scattering the fragments (if there are multiple ones). For the reactants and products, we generate 500, while for the minima and transition states in the interaction region, 250 random data points and perform single-point energy computations. For these computations, we use a composite ab initio method. The core of this is the explicitly-correlated coupled-cluster singles and doubles (CCSD-F12a) method,27 with the aug-cc-pVDZ basis set.28 The next term is a Brueckner-type29 parenthesis T correction (see explanation in ref. 24), while the basis set remains the same:| δ(T) = BCCD(T)/aug-cc-pVDZ − BCCD/aug-cc-pVDZ. | (1) |
| δTZ = MP2-F12/aug-cc-pVTZ − MP2-F12/aug-cc-pVDZ. | (2) |
| Ecomposite = CCSD-F12a/aug-cc-pVDZ + δ(T) + δTZ. | (3) |
For the ab initio computations, we use the Molpro program package.31 Out of the 7000 initial computations, 6520 converged. We also set a maximal relative energy limit, 150 kcal mol−1, with respect to the global minimum: the points over that are excluded, leaving 4108 points in the starter set. The PES fitting is accomplished by the monomial symmetrization approach (MSA) of the permutationally invariant polynomial method.32 At the beginning, we do a fourth-order fitting with 2143 coefficients. To improve the accuracy, we utilize the Robosurfer program system,22 which iteratively improves the fitting dataset by running test quasi-classical trajectories and choosing potential geometries to have their single-point energies computed with Molpro and to be added to the dataset. The total number of these iterations is 304, while we gradually increase the collision energy (Ecoll) in the trajectories (1, 5, 10, 20, …, 80 kcal mol−1) and increase the fitting to the fifth order. In the final version, we have a permutationally-invariant fifth-order analytical PES as a function of exp(−rij/a) variables, where a = 3.0 bohr and rij are interatomic distances, with 19![[thin space (1/6-em)]](https://www.rsc.org/images/entities/char_2009.gif) 322 data points and 11
322 data points and 11![[thin space (1/6-em)]](https://www.rsc.org/images/entities/char_2009.gif) 581 coefficients. The coefficients are obtained by a weighted linear least-squares fit to the energy points using a weight function of E0/(E0 + E), where E0 = 0.15 hartree and E is the potential energy relative to the global minimum of the dataset (RMS). The root-mean-square fitting errors are 1.91, 3.17, 2.03 and 2.04 kcal mol−1 in the 0.00–94.13, 94.13–188.25, 188.25–470.63 and 470.63– kcal mol−1 intervals, relative to the global minimum, respectively.
581 coefficients. The coefficients are obtained by a weighted linear least-squares fit to the energy points using a weight function of E0/(E0 + E), where E0 = 0.15 hartree and E is the potential energy relative to the global minimum of the dataset (RMS). The root-mean-square fitting errors are 1.91, 3.17, 2.03 and 2.04 kcal mol−1 in the 0.00–94.13, 94.13–188.25, 188.25–470.63 and 470.63– kcal mol−1 intervals, relative to the global minimum, respectively.
On the newly-developed potential energy surface we run quasi-classical trajectory simulations and analyze the results to study the dynamics of the title reaction. We set up each trajectory by giving the reactants zero-point energy (ZPE), via setting the system to the quasi-classical ground vibrational state by the standard normal-mode sampling.33 We also randomly orient the reactants with a distance of  between them, where x is 28.3 bohr (15 Å) and b is the impact parameter. We constantly increase the value of the impact parameter from 0.0 with a 0.5 bohr step size until bmax, which value will result in no reactive trajectories. The last parameter we need to address is the Ecoll collision energy, we have seven different values for that: 1, 5, 10, 20, 30, 40 and 50 kcal mol−1. At every b–Ecoll combination, we run a thousand trajectories, resulting in 204
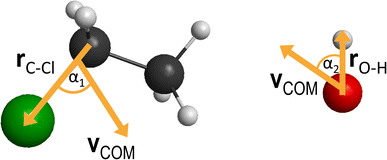
![[thin space (1/6-em)]](https://www.rsc.org/images/entities/char_2009.gif) 000 final trajectories. We propagate them with a 0.0726 fs time step until the largest interatomic distance is longer by 1 bohr than the initial largest interatomic distance. Note that this condition causes a negligible error for the trajectories resulting in bimolecular eliminations, as there could be a remaining interaction energy term: it is not guaranteed that all three fragments separate well enough, yet we assume the fragments are not in interaction at the end of the simulations. As it affects about 1% of the trajectories, it will not influence the results. We calculate reaction probabilities and excitation functions (integral cross sections (ICSs) as a function of Ecoll) for the different reaction channels. For the most prevalent reactions, we do further calculations. First, we determine the ICSs with soft and hard ZPE restrictions. Soft restriction means that we exclude trajectories where the total vibrational energy of the products is lower than the sum of their ZPEs, while in the case of hard restrictions, the vibrational energy of every product separately has to reach the corresponding ZPE value. Note, that in the case of these calculations, we treat the different channels together, so the total number of trajectories compiling with the ZPE restrictions will be the same for every reaction. This can result in a larger restricted ICS, than without the constraints, if there are other channels with a high number of ZPE violating trajectories, while the investigated channel has a low number of these kinds of trajectories. Additionally, we determine the scattering and the initial attack angle distributions (the definitions of the two attack angles can be seen in Fig. 1), relative translational energy distributions of the products and the internal energy distributions of every product molecule/ion.
000 final trajectories. We propagate them with a 0.0726 fs time step until the largest interatomic distance is longer by 1 bohr than the initial largest interatomic distance. Note that this condition causes a negligible error for the trajectories resulting in bimolecular eliminations, as there could be a remaining interaction energy term: it is not guaranteed that all three fragments separate well enough, yet we assume the fragments are not in interaction at the end of the simulations. As it affects about 1% of the trajectories, it will not influence the results. We calculate reaction probabilities and excitation functions (integral cross sections (ICSs) as a function of Ecoll) for the different reaction channels. For the most prevalent reactions, we do further calculations. First, we determine the ICSs with soft and hard ZPE restrictions. Soft restriction means that we exclude trajectories where the total vibrational energy of the products is lower than the sum of their ZPEs, while in the case of hard restrictions, the vibrational energy of every product separately has to reach the corresponding ZPE value. Note, that in the case of these calculations, we treat the different channels together, so the total number of trajectories compiling with the ZPE restrictions will be the same for every reaction. This can result in a larger restricted ICS, than without the constraints, if there are other channels with a high number of ZPE violating trajectories, while the investigated channel has a low number of these kinds of trajectories. Additionally, we determine the scattering and the initial attack angle distributions (the definitions of the two attack angles can be seen in Fig. 1), relative translational energy distributions of the products and the internal energy distributions of every product molecule/ion.
3. Results and discussion
3.1. Short description of the PES
We summarize the relative energies of the most important stationary points in Table 1 and the interested reader can find the vibrational frequencies of the reactants and products in Table S1 of the ESI.† The difference between the PES and benchmark20 relative energies is composed of two parts: one term is caused by the difference in the level of theory, while the second term is the fitting error. The first term can be described by the difference between the composite and benchmark relative energies, which is 0.8 kcal mol−1 on average. There is also the fitting error (Ecomposite − EPES) which is 1.5 kcal mol−1 on average for these stationary points, 0.9 kcal mol−1 if we consider the products only. These values are consistent with the RMS fitting error of the PES (2–3 kcal mol−1 in these regions, as discussed in Section 2).| Stationary point | Compositea | PESb | Benchmarkc |
|---|---|---|---|
| a Relative energies obtained by the composite method (CCSD-F12a/aug-cc-pVDZ + BCCD(T)/aug-cc-pVDZ − BCCD/aug-cc-pVDZ + MP2-F12/aug-cc-pVTZ − MP2-F12/aug-cc-pVDZ) used for the PES development.b Relative energies obtained on the analytical PES.c Benchmark relative energies obtained at the CCSD(T)-F12b/aug-cc-pVQZ level of theory taken from ref. 20. | |||
| C2H5OH + Cl− | −51.99 | −51.57 | −53.46 |
| HOH⋯Cl−+ C2H4 | −52.31 | −51.54 | −53.83 |
| Cl− + H2O + C2H4 | −37.16 | −36.49 | −38.91 |
| H2O + H3C–CHCl− | 9.43 | 8.55 | 9.43 |
| H− + H3C–CHClOH | 27.41 | 25.60 | 28.00 |
| H− + HOH2C–CH2Cl | 34.39 | 33.58 | 34.86 |
| PreMIN | −18.65 | −19.55 | −18.38 |
| anti-E2 PostMIN | −58.26 | −59.70 | −59.31 |
| syn-E2 PostMIN1 | −58.15 | −60.74 | −59.32 |
| syn-E2 PostMIN2 | −57.87 | −61.89 | −59.06 |
| SN2 PostMIN | −60.03 | −59.47 | −61.18 |
| SN2 PostHMIN | −68.97 | −68.71 | −70.02 |
| FSMIN | −2.30 | −4.13 | −1.79 |
| anti-E2 TS | −12.62 | −12.69 | −12.36 |
| syn-E2 TS | −3.46 | −7.84 | −3.17 |
| Walden TS | −13.44 | −13.68 | −12.98 |
| FSTS | 27.86 | 24.76 | 28.87 |
| DITS | 7.24 | 4.43 | 7.40 |
The T1-diagnostic34 values at the stationary points are only 0.013 on average, not considering the reactants and products, where we do not expect any significant multi-reference character. The largest T1 value is found for the FSTS, which is still not greater than 0.025. Based on these T1 results, we can conclude that single-reference electronic structure methods are adequate to describe the PES of the title reaction.
We schematically illustrate the most important region of the PES, the stationary points belonging to the SN2 and E2 reaction channels, in Fig. 2. The PES relative energies of these points are in good agreement with the benchmark results20 as mentioned before, the shape of the PES well describes the reactions. The SN2 can proceed via several transition states: namely the double-inversion TS (DITS), the Walden TS (WaldenTS) and the front-side TS (FSTS). The DITS eventually turns into the WaldenTS and follows the same path. Comparing the TSs, the WaldenTS is the most favored one. Front-side attack has a unique minimum, FSMIN, while the other two channels go through PreMIN, whereas the SN2 PostHMIN structures are shared between the three paths, leading to the products. The E2 reaction can follow two main pathways with special transition states and minima: the anti- or the syn-E2. The difference is arising from the orientation of the nucleophile and the leaving group at the stationary points: consider a plane that is perpendicular to the C–C–Cl plane and it crosses the two carbon atoms. In the anti case the nucleophile and the leaving group are on the different sides of this plane, while for the syn instance, they are on the same side. Kinetically, the anti-E2 is favored as the anti-E2 TS is deeper than the syn-E2 TS. The syn-E2 path can also lead to the formation of ethylene and a chloride ion–water complex (before forming the E2 products), with a dissociation energy of 15 kcal mol−1, which means that this product is stable enough that it could be observed even experimentally. Comparing the SN2 and E2 channels it is evident that the SN2 is the thermodynamically favored one by 15 kcal mol−1, but it is difficult to determine which reaction is favored kinetically as the energy difference between the anti-E2 TS and the Walden TS is less than 1 kcal mol−1.
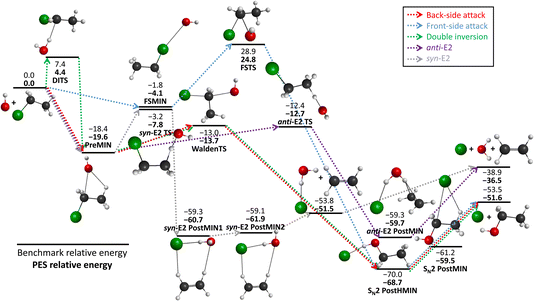 | ||
| Fig. 2 The schematic energy diagram of the OH− + CH3CH2Cl SN2 and E2 reactions; the classical relative energies (kcal mol−1) obtained on the PES developed in this work are in comparison with the benchmark, CCSD(T)-F12b/aug-cc-pVQZ single-point results (ref. 20). | ||
As long range ion–dipole interactions play an important role in the entrance channel of the title reaction, in Fig. 3 we show the potential energy curve along the O–Cα distance corresponding to collinear back-side-attack configurations. As seen, the composite energies agree very well with the benchmark CCSD(T)-F12b/aug-cc-pVQZ results. Furthermore, the PES values also fit accurately on the benchmark/composite potential and its long-range behavior is well reproduced.
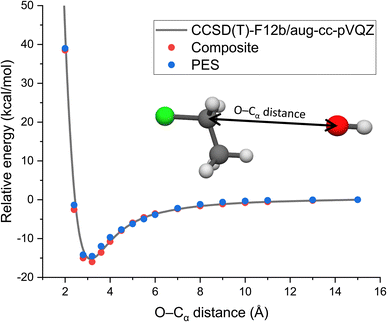 | ||
| Fig. 3 Potential along the O–Cα distance of OH− + CH3CH2Cl keeping the reactants at fixed equilibrium geometries obtained by the CCSD(T)-F12b/aug-cc-pVQZ and composite (eqn (3)) ab initio levels of theory as well as on the analytical PES. | ||
3.2. Possible reactions (and mechanisms) in the simulations, integral cross sections
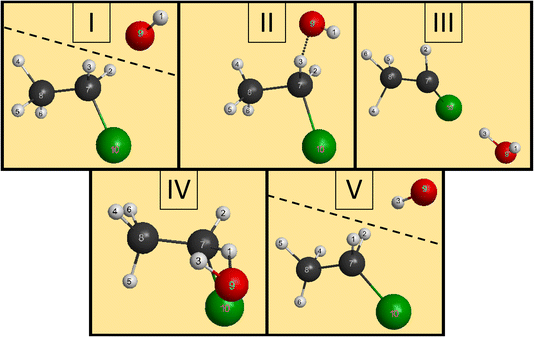
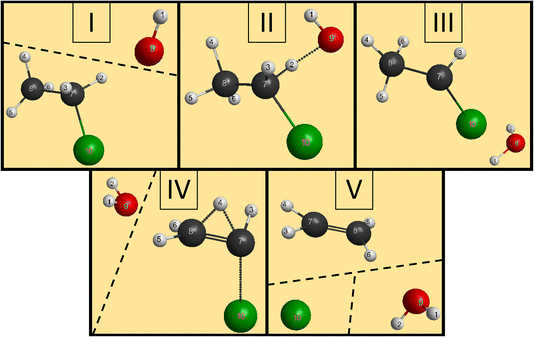
We have managed to identify six different reactions within our simulations, some with different mechanisms. The first two reactions are the induced inversion and the H-exchange. In these cases, if we investigate the chemical composition at the beginning and at the end of the trajectories, seemingly, nothing happens; we could classify them as non-reactive trajectories. However, if we have an induced-inversion reaction, as its name suggests, the stereochemistry of the ethyl chloride reactant will change. As the hydroxide ion approaches the ethyl chloride interacts with it (partially abstracts a proton from Cα, which eventually bonds back), inverting the steric orientation around Cα, and then the two reactants separate. The H-exchange reaction is similar; however, a different proton gets re-bonded and the steric change is not necessarily present in this reaction. In Fig. 4, we illustrate the most important steps of this reaction: at first, the reactants approach each other and then the OH− interacts with an α-hydrogen, a proton abstraction happens, and a water molecule forms. However, there is not enough energy in the reactants to separate, the water orbits around the remnant anion. After a while, another proton abstraction will happen, but this time the CH3CHCl− abstracts from H2O. As the final step, the new ethyl chloride and the new hydroxide ion get isolated. We can say “new”, because if we follow the indices of the H atoms, we can see that the proton from the initial OH− gets abstracted back to form the final CH3CH2Cl. Experimentally, they are indistinguishable, but using deuterium (isotope substitution on one of the reactants) could be a solution to investigate this reaction. The exchange only happens on Cα, the proton abstraction from Cβ would eventually lead to E2 reaction.The two reactions with the highest probabilities are the SN2 and the E2. For both channels we observed that the main reaction could be preceded by an H-exchange reaction (only from Cα). The stereospecificity of the SN2 reactions shows us what we expected from the energy diagram: the reactions mostly occur via Walden inversion, as retention only takes place in a negligible number of trajectories. The bimolecular elimination reactions mainly happen via the anti-E2 path, as it is kinetically more favored, rather than the syn-E2 one, but there is a third mechanism as well, although with minor presence. We call this the β–α transfer mechanism, shown in Fig. 5. The reactants come into contact and a proton abstraction happens from Cα. The H2O distances itself, while the anion is rearranged. A proton from the Cβ is shared between the two carbon atoms, while the Cα–Cl bond is elongated. Finally, the Cα–Cl bond breaks and the shared proton gets bonded to the Cα atom, forming ethylene.
The last two reactions are the formation of the chloride ion–water complex and the proton abstraction (H-Abs). The H2O⋯Cl− complex product forms via the syn-E2 reaction path, on a longer timescale it would definitely dissociate into water and chloride ion, but we detect these as products. The H-Abs reaction is simple, the proton is abstracted from Cα, as the abstraction from the β carbon leads to the E2 reaction. In addition, there is no trajectory where an H-exchange would precede the abstraction reaction.
The ICSs of the aforementioned reactions are plotted in Fig. 6 and the corresponding numerical data are given in Table S2.† E2 reaction appears to be the dominating one, while the SN2 has about five times less ICS. The other reactions also have reasonable ICSs, they are not small, but the E2 and the SN2 ones are extremely large. We can see that the values drop with increasing Ecoll (except for H-Abs), which is expected if we consider the barrier-less exothermic nature of the processes. H-exchange reactions are significant both independently and as a predecessor of E2/SN2 reactions. The E2 reactions are mainly proceeding via the anti-E2 path, but over 30 kcal mol−1 Ecoll, the dominance is not so accentuated. From 20 kcal mol−1 collision energy, H-Abs is more likely to happen than SN2, becoming the second most probable reaction.
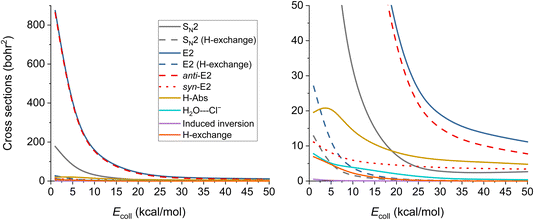 | ||
| Fig. 6 Integral cross sections of the OH− + CH3CH2Cl reaction channels at collision energies up to 50.0 kcal mol−1 (except the E2 (β–α transfer)), as a function of collision energy. | ||
3.3. SN2 QCT results
In Fig. 7, we can see the final QCT results regarding the SN2 channel. Observing the reaction probabilities (P(b)) we can see a decrease in the maximal impact parameter values up to 20–30 kcal mol−1 collision energies, from that, it somewhat stagnates. The bmax decrease with increasing Ecoll is a key feature of the barrier-less, exothermic reactions. At lower collision energies, the long-range ion–dipole interactions have time to build up, produce a reactive orientation, attract the reactants together, but with increasing Ecoll (thus velocities), the time is shorter, the species might just by-pass each other, hence the overall decrease in the reaction probabilities. The ICS curves show us an interesting phenomenon: with soft or hard restrictions, we have higher values. This can be explained by the fact that there are practically no ZPE violating trajectories at this channel (for definitions, see Section 2), which is expected, as this reaction is very exothermic (the reaction heat is −51.57 kcal mol−1 on the PES). However, the ZPE violation of the other channels decreases the total number of trajectories thereby indirectly increasing the SN2 reactivity.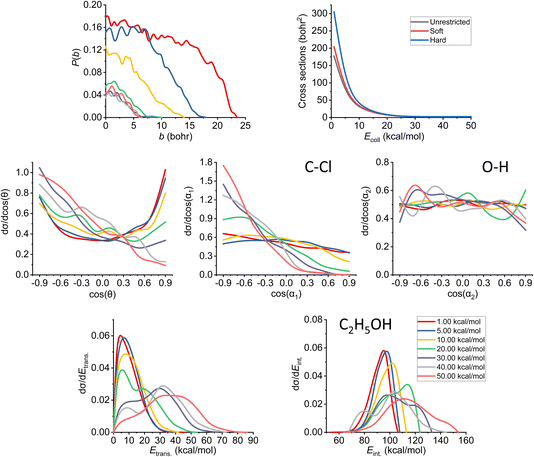 | ||
| Fig. 7 Final QCT results for the OH− + CH3CH2Cl reaction's SN2 channel: reaction probabilities (P(b)), integral cross sections with three different restrictions (for more information about the restrictions, see Computational details), normalized scattering angle distributions (cos(θ)), normalized initial attack angle distributions (cos(α1) and cos(α2)) (for the definitions, see Fig. 1), normalized product relative translational energy distributions (Etrans.) and normalized product internal energy distributions (Eint.). | ||
At low collision energies, we have quite isotropic scattering angle (cos(θ)) curves, which is a sign of indirect reactions, we have both backwards scattering (rebound mechanism, −cos(θ) region) and forward scattering (stripping mechanism, +cos(θ)). At higher collision energies, we have a more direct reaction as the backward scattering becomes more dominant, via the direct rebound mechanism, as expected for the SN2 reaction channel. The cos(α1), C–Cl attack angle plots also show us that at low Ecoll values we have isotropy, as the reaction is indirect and the reactivity is nearly independent of the initial reactant orientation, because the ion–dipole interactions can guarantee the success of the chemical reaction. As we increase the collision energy, the front-side attack (+cos(α1)) does not lead to reactive trajectories, because the reactions happen via the WaldenTS and not via the FSTS. At large Ecoll the reaction becomes more direct with back-side attack (−cos(α1)) preference, again, which can be explained by the fact that the ion–dipole interactions cannot orient the ethyl chloride. The O–H (cos(α2)) attack angles show an interesting behavior: we would expect an increasing O-side preference with increasing collision energy, since the new chemical bond will form between a carbon atom and the oxygen, but that is not the case. The curves are practically isotropic in the whole Ecoll regime, we can say there is a slight decrease in the H-side preference, but that shape can be due to the increasing statistical errors as the ICS drops at higher collision energies (leaving us with less reactive trajectories). The isotropic feature implies that the ion–dipole interaction can orient the OH− even at high collision energies, the hydroxide ion behaves like a simple, spherical ion without a specific structure. The difference between the ethyl chloride and the OH− attack angle distributions can be reasoned by comparing their moments of inertia. The former one is a large, bulky molecule, with relatively high moments of inertia, thus it takes more time and/or stronger forces to orient it, while the latter is a small and light ion with much less inertia, and can be easily rotated rapidly even at higher collision energies by the ion–dipole interactions.
Looking at the translational energy distributions (Etrans.), the first observation that can be made is that with increasing Ecoll, the reactants separate with increasing translational energies. Not only the maximal values change with the collision energies, but the shape of the curves too: at low Ecoll, we have the maxima at lower Etrans. values, but as we increase Ecoll, we get hotter and hotter curves, where the maxima are shifted towards the middle and right sides of the energy regimes. This means that the available energy in the system gets more and more transferred to the translational part with increasing collision energy, which is connected with the fact that the reaction becomes more direct. The internal energy (Eint.) distributions show the complementary behavior: the curves become colder and colder, the sharp right shoulder, which can be clearly seen at low Ecoll, gets more and more shifted to the middle region of the internal energy curves with increasing Ecoll. Previously, considering the ICS curves with restrictions, we stated that there are no ZPE violations for the SN2 reaction, and this fact is also in accord with the internal energy distributions, as the ZPE of the ethyl alcohol on our PES is 50 kcal mol−1, which is way below the minimal internal energy values. Comparing the translational and internal energy curves at Ecoll = 1 kcal mol−1 (which is practically negligible), we can see that the reaction heat mainly gets transferred into internal energy (the translational energy is very cold), while with increasing Ecoll the collision energy gets distributed between the two terms roughly equivalently (the maxima shift roughly by the same amount for both energy types).
3.4. E2 QCT results
The results of the trajectory analysis for the E2 reaction channel can be seen in Fig. 8. We have also separated the results by mechanisms using the same technique as in ref. 12, the summary of the anti-E2 reactions can be seen in Fig. 9, while the syn-E2 results are illustrated in Fig. 10. Note that, in general, we have many fewer trajectories with the latter mechanism, resulting in higher statistical errors for the plots. We describe the results for the sum of the two mechanisms, but we also highlight the differences between them.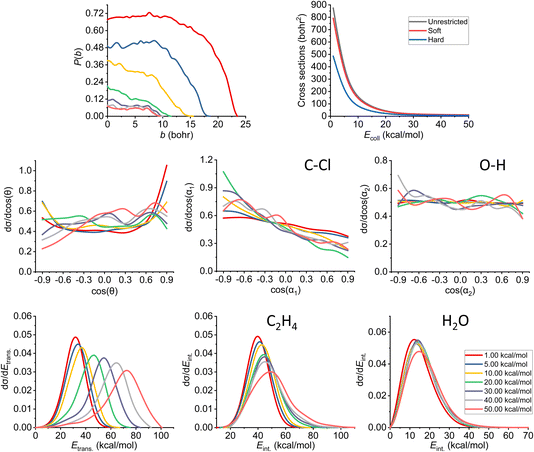 | ||
| Fig. 8 Final QCT results for the OH− + CH3CH2Cl reaction's E2 channel (for the mechanism-specific results see Fig. 9 and 10): reaction probabilities (P(b)), integral cross sections with three different restrictions (for more information about the restrictions, see Computational details), normalized scattering angle distributions (cos(θ)), normalized initial attack angle distributions (cos(α1) and cos(α2)) (for the definitions, see Fig. 1), normalized product relative translational energy distributions (Etrans.) and normalized product internal energy distributions (Eint.) (for both ethylene and water). | ||
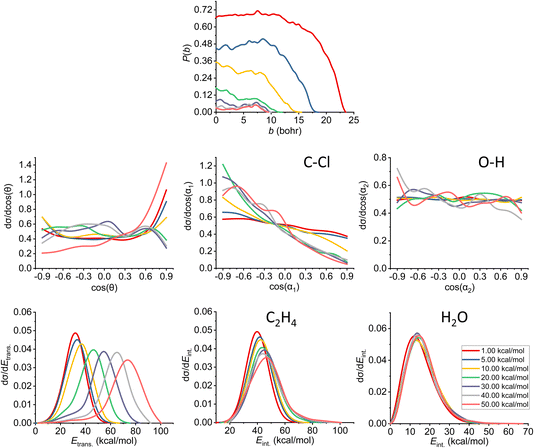 | ||
| Fig. 9 Final QCT results for the OH− + CH3CH2Cl reaction's anti-E2 channel: reaction probabilities (P(b)), normalized scattering angle distributions (cos(θ)), normalized initial attack angle distributions (cos(α1) and cos(α2)) (for the definitions, see Fig. 1), normalized product relative translational energy distributions (Etrans.) and normalized product internal energy distributions (Eint.) (for both ethylene and water). | ||
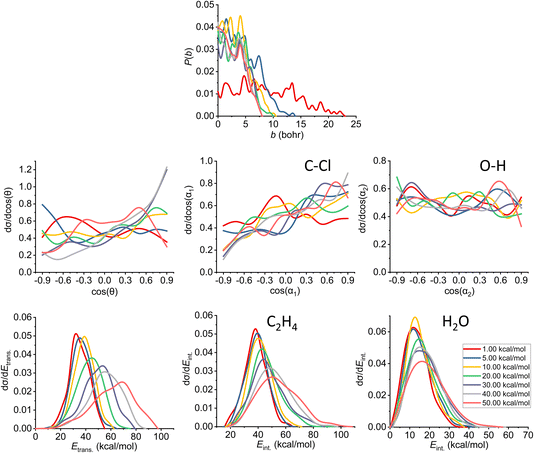 | ||
| Fig. 10 Final QCT results for the OH− + CH3CH2Cl reaction's syn-E2 channel: reaction probabilities (P(b)), normalized scattering angle distributions (cos(θ)), normalized initial attack angle distributions (cos(α1) and cos(α2)) (for the definitions, see Fig. 1), normalized product relative translational energy distributions (Etrans.) and normalized product internal energy distributions (Eint.) (for both ethylene and water). | ||
The reaction probability is the highest for the E2 channel at the collision energies investigated in this study. On average, it is 3–4 times more likely that a trajectory ends up in the E2 reaction, than in the SN2 one, however, the bmax values are very similar, these are only 0.5–1.0 bohr higher for E2. If we compare the probabilities of the two E2 mechanisms (Fig. 9 and 10), we can notice that the dominant one is the anti pathway, however, from Ecoll = 30 kcal mol−1 they become comparable, getting closer and closer to each other. Due to the smaller number of syn-E2 trajectories, it is important to note that the results for that mechanism are burdened with more statistical error. The probability of anti-E2 drops rapidly up to 30 kcal mol−1 collision energy, after that, the decrease slows down. In the case of syn-E2, the maximal probability is the lowest at 1 kcal mol−1 Ecoll with the highest bmax value. If we increase the collision energies the maximal probability gets higher and the maximal impact parameter gets lower, however, over 5 kcal mol−1 Ecoll, we cannot observe significant changes. The E2 ICSs tell us that there are ZPE violations, as the unrestricted values are higher than the ones with either soft or hard restrictions. The difference between the two constrained curves suggests that one product systematically has lower energy than ZPE, but if we use the soft restriction, the vibrational energy of the other product can compensate the missing energy.
The scattering angle shows us similar, but not as significant behavior (for both mechanisms, with more statistical error for syn) than in the case of SN2: we cannot observe direct correlation between the collisional energy and the forward scattering preference, but a feature of this reaction, the forward scattering, can be seen in the curves. Inspecting the overall C–Cl attack angle distributions, we can see that as the reaction becomes more direct, the curves lose the isotropy. This transition is not as harsh as in the case of the SN2 reaction, it can explain why the results show much larger reaction probabilities for E2: the E2 reaction can happen in a much broader attack angle interval. The main difference between the anti- and the syn-E2 can be seen here: the shape of the cos(α1) curves indicates that for anti there is a back-side attack preference, while for syn front-side attack is preferred. These findings are straightforward in light of the structures of the anti-E2 and syn-E2 transition states (Fig. 2). The cos(α2) distributions show the same findings as for SN2 in both cases: we would expect an O-side attack preference, but the OH− acts as a “spherical” ion, we can only observe a marginal agreement with our expectations at the two highest Ecoll.
If we increase the collision energy, it will increase the product relative translational energy. The maxima of the translational energy curves are shifted with the extra Ecoll, while the internal energies show minimal dependence on this parameter (especially the Eint. of the water product). The energy curves do not show a remarkable change in the overall shape, meaning that there is no straight transition from indirect to direct aspects (similarly to the E2 scattering angle distributions). The ZPEs of the ethylene and the water are about 32 and 14 kcal mol−1 on the PES, respectively, and the reaction is less exothermic than SN2, thus we expect more trajectories to be excluded because of the constraints. Considering the former values and the internal energy plots, we can see slight ZPE violations for the ethylene and more significant problems for H2O. Approximately half of the E2 trajectories violate the hard restrictions because the water does not have enough vibrational (and internal) energy, as predicted from the ICS plot earlier. Analyzing the contrast between E2 with the two different mechanisms, we can conclude that there is a modestly better energy transfer to the internal energies in the case of the syn-E2.
3.5. H-Abs QCT results
As already discussed in Section 3.2, we also note here that the proton abstraction happens from Cα in every case in the simulations (as abstraction from Cβ would end up in an E2 reaction). The plots belonging to the proton-abstraction reaction can be seen in Fig. 11. Note that these data might have the highest uncertainty as the smallest amount of reactive trajectories belongs to this channel (considering the ones that are being analyzed in more detail). The P(b) shows a general increase at small impact parameters until we reach 30 kcal mol−1 collision energy, while the bmax value drops rapidly and remains the same (7.5–8.0 bohr) from the same Ecoll. From that point, the reaction probability becomes comparable with that of E2, and overcomes the SN2 reactivity. The shape of the ICS curves completely changes with the constraints, a threshold energy appears, as the reaction itself is endothermic, thus the products are not available at low collision energies unless ZPE violation happens. We consider the soft- and hard-constrained curves to be more realistic.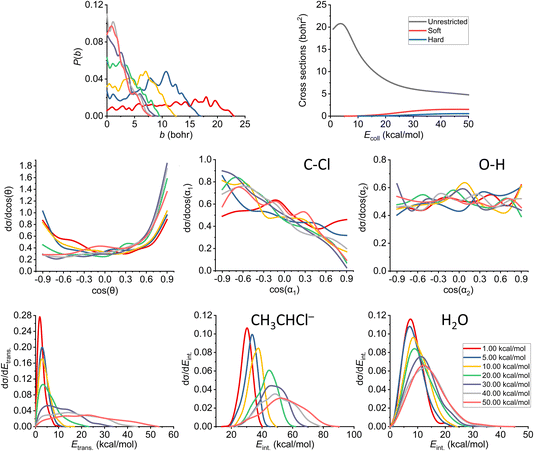 | ||
| Fig. 11 Final QCT results for the OH− + CH3CH2Cl reaction's proton-abstraction channel: reaction probabilities (P(b)), integral cross sections with three different restrictions (for more information about the restrictions, see Computational details), normalized scattering angle distributions (cos(θ)), normalized initial attack angle distributions (cos(α1) and cos(α2)) (for the definitions, see Fig. 1), normalized product relative translational energy distributions (Etrans.) and normalized product internal energy distributions (Eint.) (for both the CH3CHCl− anion and water). | ||
The reaction starts as isotropic regarding the scattering angle distributions, but as the collision energy increases, the forward scattering nature prevails, the stripping mechanism becomes dominant; the hydroxide ion strips the proton and moves forward. The cos(α1) distributions pinpoint a back-side attack preference even at low Ecoll, as the hydrogens on the Cα are more accessible from that direction. For the O–H attack angle distribution, we have the same conclusions as before: the OH− will be rapidly rotated into the reactive orientation thanks to its small moment of inertia, in contrast to the expected O-side domination, we see isotropic curves.
Considering the relative translational energy plots, we can conclude that the shape of the curves changes with increasing Ecoll, suggesting that the reaction becomes more direct. The internal energy distributions show us that the additional energy with the higher collision energies gets transferred both into the Etrans. and Eint., in the latter case more into the internal energy of the product anion. The ZPEs on the PES are roughly 41 and 14 kcal mol−1 for the larger ionic fragment and the water, respectively. For this channel, we have a large number of ZPE violating trajectories. This phenomenon can be seen not only in the ICS plot, but also in the internal energy diagrams: only a small segment of the curves is beyond the zero-point energy limit for each product.
4. Summary and conclusions
We have developed a full-dimensional reactive potential energy surface for the OH− + CH3CH2Cl reaction based on energy points belonging to a widespread of possible reaction channels. The PES fitting was done using the monomial symmetrization approach (MSA) of the permutationally invariant polynomial method.32 The PES was iteratively improved using the Robosurfer program package.22 The level of theory was chosen to be a composite level: an explicitly-correlated coupled-cluster method (CCSD-F12a) with the aug-cc-pVDZ basis set, along with Brueckner-type (T) and MP2-F12 triple-zeta corrections. We performed over 200![[thin space (1/6-em)]](https://www.rsc.org/images/entities/char_2009.gif) 000 QCT simulations at different impact parameters with different collision energies in the range of 1–50 kcal mol−1. At those setups, we could identify six different reactions: induced inversion, H-exchange, H2O⋯Cl− complex formation, proton abstraction, SN2 and E2. We also investigated the mechanisms and processes preceding the formation of the products in the above-mentioned reactions, as well as determined the reaction probabilities and excitation functions. For the last three (and most probable) reactions we performed a detailed analysis to achieve a deeper understanding of the reactions: we calculated the ICSs with different restrictions, scattering and two types of attack angle distributions, product relative translational and product internal energy distributions. These results can promote the investigation of the OH− + CH3CH2Cl system experimentally and/or the PES can be used for simulations at different conditions, even looking at other aspects of the dynamics than in the present work.
000 QCT simulations at different impact parameters with different collision energies in the range of 1–50 kcal mol−1. At those setups, we could identify six different reactions: induced inversion, H-exchange, H2O⋯Cl− complex formation, proton abstraction, SN2 and E2. We also investigated the mechanisms and processes preceding the formation of the products in the above-mentioned reactions, as well as determined the reaction probabilities and excitation functions. For the last three (and most probable) reactions we performed a detailed analysis to achieve a deeper understanding of the reactions: we calculated the ICSs with different restrictions, scattering and two types of attack angle distributions, product relative translational and product internal energy distributions. These results can promote the investigation of the OH− + CH3CH2Cl system experimentally and/or the PES can be used for simulations at different conditions, even looking at other aspects of the dynamics than in the present work.
Data availability
The data that support the findings of this study are available from the corresponding author upon reasonable request.Conflicts of interest
There are no conflicts of interest to declare.Acknowledgements
We thank the National Research, Development and Innovation Office–NKFIH, K-125317 and K-146759; Project no. TKP2021-NVA-19, provided by the Ministry of Innovation and Technology of Hungary from the National Research, Development and Innovation Fund, financed under the TKP2021-NVA funding scheme; and the Momentum (Lendület) Program of the Hungarian Academy of Sciences for the financial support. The authors are also thankful to Viktor Tajti for his help with the PES development.References
- P. Manikandan, J. Zhang and W. L. Hase, J. Phys. Chem. A, 2012, 116, 3061 CrossRef CAS PubMed.
- J. Xie, R. Otto, J. Mikosch, J. Zhang, R. Wester and W. L. Hase, Acc. Chem. Res., 2014, 47, 2960 CrossRef CAS PubMed.
- J. Xie and W. L. Hase, Science, 2016, 352, 32 CrossRef CAS PubMed.
- I. Szabó and G. Czakó, J. Phys. Chem. A, 2017, 121, 9005 CrossRef PubMed.
- F. M. Bickelhaupt, E. J. Baerends, N. M. M. Nibbering and T. Ziegler, J. Am. Chem. Soc., 1993, 115, 9160 CrossRef CAS.
- M. Mugnai, G. Cardini and V. Schettino, J. Phys. Chem. A, 2003, 107, 2540 CrossRef CAS.
- A. P. Bento, M. Solà and F. M. Bickelhaupt, J. Chem. Theory Comput., 2008, 4, 929 CrossRef CAS PubMed.
- X.-P. Wu, X.-M. Sun, X.-G. Wei, Y. Ren, N.-B. Wong and W.-K. Li, J. Chem. Theory Comput., 2009, 5, 1597 CrossRef CAS PubMed.
- E. Carrascosa, J. Meyer, J. Zhang, M. Stei, T. Michaelsen, W. L. Hase, L. Yang and R. Wester, Nat. Commun., 2017, 8, 25 CrossRef PubMed.
- V. Tajti and G. Czakó, J. Phys. Chem. A, 2017, 121, 2847 CrossRef CAS PubMed.
- J. Meyer, V. Tajti, E. Carrascosa, T. Győri, M. Stei, T. Michaelsen, B. Bastian, G. Czakó and R. Wester, Nat. Chem., 2021, 13, 977 CrossRef CAS PubMed.
- V. Tajti and G. Czakó, Phys. Chem. Chem. Phys., 2022, 24, 8166 RSC.
- J. Meyer, E. Carrascosa, T. Michaelsen, B. Bastian, A. Li, H. Guo and R. Wester, J. Am. Chem. Soc., 2019, 141, 20300 CrossRef CAS PubMed.
- T. Gstir, T. Michaelsen, B. A. Long, A. B. Nacsa, A. Ayasli, D. Swaraj, F. Zappa, F. Trummer, S. G. Ard, N. S. Shuman, G. Czakó, A. A. Viggiano and R. Wester, Phys. Chem. Chem. Phys., 2023, 25, 18711 RSC.
- Y. Li, C. Li, D. Gao and D. Wang, J. Phys. Chem. A, 2022, 126, 5527 CrossRef CAS PubMed.
- S. Zhao, G. Fu, W. Zhen, H. Wang, L. Yang and J. Zhang, Phys. Chem. Chem. Phys., 2023, 25, 28086 RSC.
- S. Zhao, G. Fu, W. Zhen, H. Wang, M. Liu, L. Yang and J. Zhang, J. Phys. Chem. A, 2023, 127, 3381 CrossRef CAS PubMed.
- S. Zhao, H. Wang, G. Fu, W. Zhen, M. Liu, L. Yang and J. Zhang, Precis. Chem., 2023, 1, 507 CrossRef CAS.
- H. Wang, X. Liu, S. Zhao, G. Fu, W. Zhen, L. Yang and J. Zhang, Precis. Chem., 2024, 2, 40 CrossRef CAS.
- D. A. Tasi, C. Tokaji and G. Czakó, Phys. Chem. Chem. Phys., 2021, 23, 13526 RSC.
- X. Wu, S. Zhang and J. Xie, Phys. Chem. Chem. Phys., 2022, 24, 12993 RSC.
- T. Győri and G. Czakó, J. Chem. Theory Comput., 2020, 16, 51 CrossRef PubMed.
- A. Giricz, G. Czakó and D. Papp, Chem.–Eur. J., 2023, 29, e202302113 CrossRef CAS PubMed.
- D. A. Tasi, T. Győri and G. Czakó, Phys. Chem. Chem. Phys., 2020, 22, 3775 RSC.
- D. A. Tasi and G. Czakó, Chem. Sci., 2021, 12, 14369 RSC.
- D. A. Tasi and G. Czakó, J. Chem. Phys., 2022, 156, 184306 CrossRef CAS PubMed.
- T. B. Adler, G. Knizia and H.-J. Werner, J. Chem. Phys., 2007, 127, 221106 CrossRef PubMed.
- T. H. Dunning Jr, J. Chem. Phys., 1989, 90, 1007 CrossRef.
- K. A. Brueckner, Phys. Rev., 1954, 96, 508 CrossRef CAS.
- H.-J. Werner, T. B. Adler and F. R. Manby, J. Chem. Phys., 2007, 126, 164102 CrossRef PubMed.
- H.-J. Werner, P. J. Knowles, G. Knizia, F. R. Manby, M. Schütz, et al., Molpro, version 2015.1, a package of ab initio programs, see https://www.molpro.net Search PubMed.
- Z. Xie and J. M. Bowman, J. Chem. Theory Comput., 2010, 6, 26 CrossRef CAS PubMed.
- W. L. Hase, Encyclopedia of Computational Chemistry, Wiley, New York, 1998, pp. 399–407 Search PubMed.
- T. J. Lee and P. R. Taylor, Int. J. Quantum Chem., 1989, S23, 199 Search PubMed.
Footnote |
| † Electronic supplementary information (ESI) available: Vibrational frequencies of the reactants and products as well as numerical values of the integral cross sections. See DOI: https://doi.org/10.1039/d3fd00161j |
| This journal is © The Royal Society of Chemistry 2024 |

