 Open Access Article
Creative Commons Attribution 3.0 Unported Licence
Identification and quantification of fluorinated polymers in consumer products by combustion ion chromatography and pyrolysis-gas chromatography-mass spectrometry†
Lisa
Skedung‡
 *a,
Eleni
Savvidou‡
 *c,
Steffen
Schellenberger
b,
Anders
Reimann
a,
Ian T.
Cousins
 c and
Jonathan P.
Benskin
 *c
*c
aRISE Research Institutes of Sweden, Department Materials and Surface Design, Stockholm, Sweden. E-mail: lisa.skedung@ri.se
bRISE Research Institutes of Sweden, Unit Environment and Sustainable Chemistry, Stockholm, Sweden
cStockholm University, Department of Environmental Science, Stockholm, Sweden. E-mail: Eleni.Savvidou@aces.su.se; Jon.Benskin@aces.su.se
First published on 6th December 2023
Abstract
Total fluorine was determined in 45 consumer product samples from the Swedish market which were either suspected or known to contain fluorinated polymers. Product categories included cookware (70–550![[thin space (1/6-em)]](https://www.rsc.org/images/entities/char_2009.gif) 000 ppm F), textiles (10–1600 ppm F), electronics (20–2100 ppm F), and personal care products (10–630
000 ppm F), textiles (10–1600 ppm F), electronics (20–2100 ppm F), and personal care products (10–630![[thin space (1/6-em)]](https://www.rsc.org/images/entities/char_2009.gif) 000 ppm F). To confirm that the fluorine was organic in nature, and deduce structure, a qualitative pyrolysis-gas chromatography-mass spectrometry (pyr-GC/MS) method was validated using a suite of reference materials. When applied to samples with unknown PFAS content, the method was successful at identifying polytetrafluoroethylene (PTFE) in cookware, dental products, and electronics at concentrations as low as 0.1–0.2 wt%. It was also possible to distinguish between 3 different side-chain fluorinated polymers in textiles. Several products appeared to contain high levels of inorganic fluorine. This is one of the few studies to quantify fluorine in a wide range of consumer plastics and provides important data on the concentration of fluorine in materials which may be intended for recycling, along with insights into the application of pyr-GC/MS for structural elucidation of fluorinated polymers in consumer products.
000 ppm F). To confirm that the fluorine was organic in nature, and deduce structure, a qualitative pyrolysis-gas chromatography-mass spectrometry (pyr-GC/MS) method was validated using a suite of reference materials. When applied to samples with unknown PFAS content, the method was successful at identifying polytetrafluoroethylene (PTFE) in cookware, dental products, and electronics at concentrations as low as 0.1–0.2 wt%. It was also possible to distinguish between 3 different side-chain fluorinated polymers in textiles. Several products appeared to contain high levels of inorganic fluorine. This is one of the few studies to quantify fluorine in a wide range of consumer plastics and provides important data on the concentration of fluorine in materials which may be intended for recycling, along with insights into the application of pyr-GC/MS for structural elucidation of fluorinated polymers in consumer products.
Environmental significanceDue to their unique physical–chemical properties, per- and polyfluoroalkyl substances (PFAS) are used across a wide range of consumer products. PFAS may be released into the environment over the course of a product's lifecycle (including during manufacture, use and disposal). While class-wide regulation to mitigate PFAS exposure is currently under consideration, appropriate analytical tools are still needed to support enforcement. The present work determined total fluorine across four different product categories (cookware, textiles, electronics and personal care products), and compared these levels to proposed regulatory guidelines. Thereafter, a new approach based on pyrolysis gas chromatography-mass spectrometry was validated for identifying the nature (i.e., organic or inorganic) and structure of the fluorine. In addition to providing new measurements of total fluorine in consumer products suitable for inventories and environmental emission estimates, this study lays the groundwork for new analytical approaches for identifying PFAS in consumer products which may be suitable for future regulatory enforcement. |
Introduction
Per- and polyfluoroalkyl substances (PFAS) encompass a diverse class of over 12![[thin space (1/6-em)]](https://www.rsc.org/images/entities/char_2009.gif) 000 chemicals containing at least one perfluoromethyl (CF3) or methylene (–CF2–) group.1,2 Collectively, these chemicals span a wide range of physical–chemical properties, from low molecular weight, highly polar, water-soluble acids (e.g. trifluoroacetic acid) to high molecular weight, water- and oil-repelling polymers (e.g. polytetrafluoroethylene (PTFE)). The unique properties of PFAS have led to their widespread use in materials such as food packaging, paper, textiles, plastics, and cosmetic products.3 However, PFAS are also highly persistent and have been linked to adverse effects in humans and in animal models4 as well as in wildlife.5 This is particularly concerning considering that PFAS already contaminate the global environment,6,7 and occur in the tissues of humans and wildlife everywhere.8
000 chemicals containing at least one perfluoromethyl (CF3) or methylene (–CF2–) group.1,2 Collectively, these chemicals span a wide range of physical–chemical properties, from low molecular weight, highly polar, water-soluble acids (e.g. trifluoroacetic acid) to high molecular weight, water- and oil-repelling polymers (e.g. polytetrafluoroethylene (PTFE)). The unique properties of PFAS have led to their widespread use in materials such as food packaging, paper, textiles, plastics, and cosmetic products.3 However, PFAS are also highly persistent and have been linked to adverse effects in humans and in animal models4 as well as in wildlife.5 This is particularly concerning considering that PFAS already contaminate the global environment,6,7 and occur in the tissues of humans and wildlife everywhere.8
As a result of their widespread occurrence and problematic risk profile, efforts to restrict the use of PFAS have ramped up over the last 2 decades. In 2020, the EU's Chemicals Strategy for Sustainability indicated that use of PFAS should be phased out unless proven essential for society,9 and on January 13, 2023, a broad restriction proposal was submitted to the European Chemicals Agency (ECHA), by Sweden, Norway, Denmark, Germany and the Netherlands, which targets the entire PFAS class.10 This proposal is expected to go into force by 2025.11 Among the conditions of the proposal is the requirement that products should not exceed 50 mg F kg−1 (parts per million – ppm), which includes both non-polymeric and polymeric PFAS. According to data for the Nordic market, fluorinated polymers are the most prevalent PFAS used in consumer products.3 This subclass of PFAS includes side-chain fluorinated polymers, fluoropolymers, and perfluoropolyethers.12 Fluoropolymers consist of a polymeric carbon backbone with fluorine atoms (F) bound to carbon and are used in particularly large quantities compared to the other two categories of fluorinated polymers.3 PTFE dominates the fluoropolymer market, with 53% of total global consumption, followed by polyvinylidene fluoride (PVDF) and fluorinated ethylene propylene (FEP), contributing 16% and 10% of global consumption, respectively.13 Side-chain fluorinated polymers (SFPs) consist of a polymeric hydrocarbon backbone of variable composition (e.g., acrylate and/or methacrylate, urethane, and oxetane) with polyfluoroalkyl (and possibly perfluoroalkyl) side chains. Historically, SFPs contained side chains comprising 8 fully fluorinated carbon atoms (C8 chemistry); but more contemporary SFPs utilize C4 or C6 chemistries.14 Finally, perfluoropolyethers comprise hydrocarbon backbones separated by oxygen atoms (ether linkages) and, like fluoropolymers, the fluorine atoms are bound directly to the polymeric backbone. Typically, in the polymeric backbone of perfluoropolyethers, –CF2–, –CF2CF2–, and possibly –CF(CF3)CF2– units are separated by ether linkages.12
Total fluorine determination, for example by particle-induced gamma ray emission spectroscopy (PIGE) or combustion ion chromatography (CIC), is commonly used for quantifying fluorinated polymers across all consumer product categories.15–18 However, these techniques may be subject to false positives from inorganic fluorine19 and more importantly, do not offer structural information. The former problem can be overcome by measuring extractable organic fluorine (EOF), but this approach also overlooks structure. Furthermore, most fluorinated polymers are generally not extractable using organic solvents typically employed for PFAS analysis.20 Alternatively, structural information on polymers can be obtained via methods such as matrix assisted laser desorption ionization (MALDI)21 or indirect approaches such as the total oxidizable precursors (TOP) assay,22 photoTOP,23 or the total hydrolysable precursors method,24 but these techniques are limited to characterization of SFPs and tend to under-report concentrations.23 Thus, universal approaches for structural elucidation of fluorinated polymers are clearly needed.
Pyrolysis-gas chromatography-mass spectrometry (pyr-GC/MS) is a commonly used method for identifying plastic and plastic additives,25 and involves pyrolyzing a sample directly (i.e. without extraction) at temperatures between 250–1000 °C, followed by online analysis of the degradation products.25 Pyr-GC/MS has been successfully applied for distinguishing PTFE from SFPs in textiles of firefighter turnout gear18 and for studying thermal decomposition of PFAS,26–28 but to the best of our knowledge has not yet been investigated for structural elucidation of PFAS in consumer products.
The objectives of the present work were to carry out a broad survey of fluorine content in consumer products from the Swedish Market using CIC and evaluate the potential of pyr-GC/MS for characterizing the nature of the fluorine. Collectively, these data represent the most extensive survey of fluorine content in materials and provide important information on both the concentration and identity of PFAS in these products. This work offers a new means of screening polymeric PFAS in consumer products that may be suitable for enforcing the EU-wide PFAS restriction proposal, when it comes into force.
Materials and methods
Samples
Products from 4 different product categories (cookware, textiles, electronics, and personal care products) were provided by industry partners in the POPFREE Industry project29 or obtained from stores/companies in Sweden (see overview in Table S1† of the supporting information; ESI†). All samples (with the exception of the C1 ceramic baking plate) were analyzed for total fluorine by CIC and a subset were subjected to follow-up analysis by pyr-GC/MS (Table S1†). A detailed overview of the 45 samples from each product category is as follows.Instrumental analysis
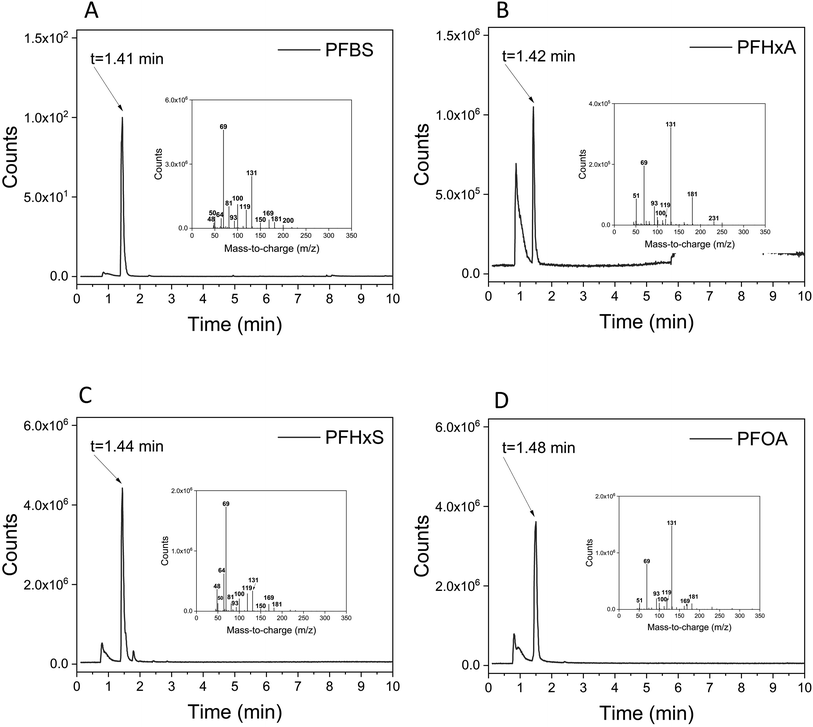
While pyr-GC/MS is a well-established technique, it has not been widely adopted for structural elucidation of PFAS in consumer products. In order to examine the potential of PFAS to form “fingerprint-like” pyrolysis products suitable for identification in consumer products, we examined the pyrolysis GC(EI)MS spectra produced from authentic standards of perfluorohexanoate (PFHxA), perfluorooctanoate (PFOA), and perfluorohexane sulfonate (PFHxS) purchased from Sigma-Aldrich, and perfluorobutane sulfonate (PFBS) purchased from Dyneon (Belgium) as well as four reference polyamide textiles (one uncoated, one coated with C4F9SO2N– “C4-SFP”, one with C6F13C2H2– “C6-SFP”, and one with C8F17C2H2– “C8-SFP”) that were prepared in-house14 (for details see Fig. S2†). Two cookware products known to contain a PTFE coating (C2 and C11) and one baking plate (C1) known to contain a ceramic Si-based coating were also used as references. Finally, pure polymer granulates of fluorinated ethylene propylene (FEP) and perfluoroalkoxy alkanes (PFA) which were kindly donated by a Swedish cable producer were analyzed.
Quality control
We previously demonstrated that fluorine measurements on our CIC were F-specific.30 Moreover, a series of internal validation and interlaboratory comparisons have confirmed total fluorine measurements to be accurate, reproducible, and in good concordance with other laboratories across a wide range of matrices.16,17,22,31 Ongoing QC in the present work involved (at minimum) triplicate combustions of boat blanks, a PFOS/PFOA standard and a certified reference material (CRM, BCR-461, fluorine in clay) for each batch of samples. Measurements of the CRM showed good agreement with the reference value (568 ± 60 mg of F kg−1), with an average recovery of 91 ± 8%, indicating good method accuracy and precision. Around 30% of the samples in each batch were measured in duplicates. Finally, analysis of 16 samples by PIGE (see ESI and Fig. S1†), showed no statistical difference (Wilcoxon-test; p > 0.05) and a reasonable correlation with data produced by CIC (r2 > 0.71). Limits of detection (LODs) were estimated using the mean concentration measured in boat blanks plus 3 times the standard deviation. To avoid carryover, two to three boat blanks were measured after samples where high F content was expected. The average LOD for all analyzed batches was 22 μg F g−1.Results and discussion
Pyrolysis GC/MS method validation
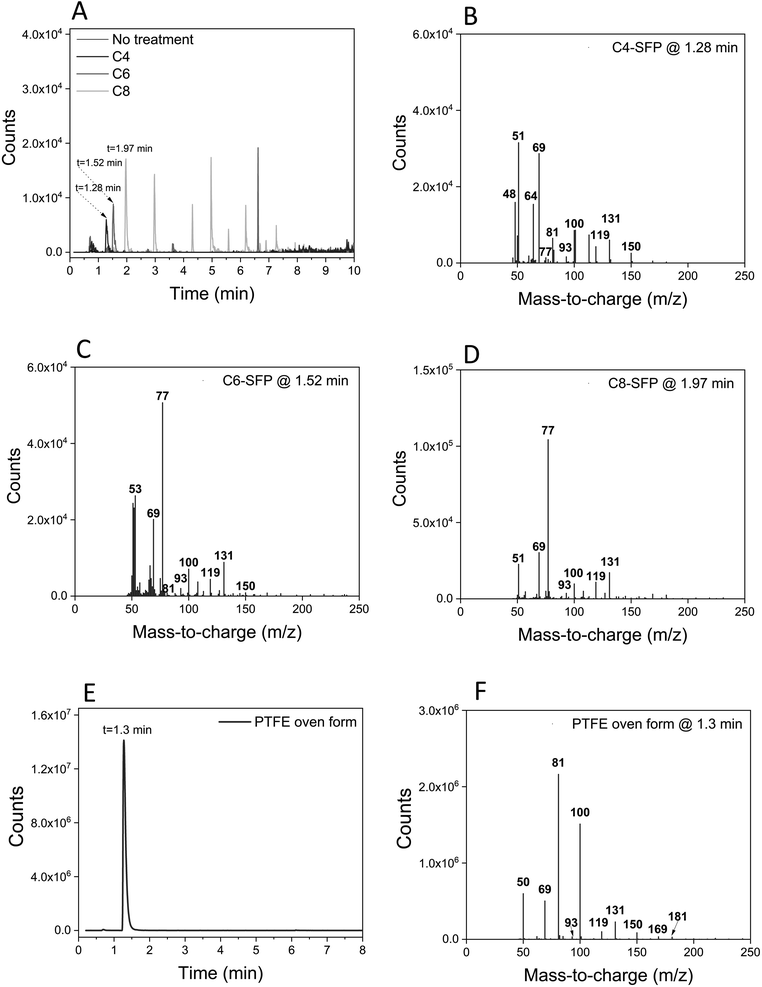
We also examined later eluting peaks in the chromatograms, which we hypothesised could contain higher molecular weight pyrolysis products suitable for de novo structural elucidation of SFPs. For the C4-SFP, a peak at 9.23 min contained a potentially diagnostic ion at m/z 341 (tentatively [C4F9SO2NC3H8]+), along with characteristic fluorinated ions at m/z 69, 100, and 131, confirming the occurrence of a fluorinated pyrolysis product at this retention time. Likewise, a peak at 6.62 min in the C6-SFP chromatogram contained an ion at m/z 434 (tentatively [C6F13C2H4OC4H7O]+) along with a number of typical fluorinated ions (m/z 51, 69, 77, 100, 119 and 131). Finally, examination of the C8-SFP chromatogram revealed a peak at 6.19 min (m/z 505; tentatively C12H11F13O2) which again contained characteristic fluorinated ions (m/z 51, 69, 77, 100, 119, 131 and 169). In comparison, none of the aforementioned ions were observed at the same retention times in the uncoated textile. In fact, the only peak observed in the uncoated textile that risked triggering a false positive eluted very late in the program (10.66 min), and only contained two ions (m/z 77 and 131) in common with fluorinated ions. Confirmation of the presence of a SFP should therefore require positive matches for more than two typical PFAS ions (Table S2†) eluting at the same retention time. Clearly, late eluting peaks in the chromatogram can aid in structural elucidation, but we note that these peaks are typically much less intense than the early eluting peaks in the chromatogram and may therefore be more difficult to detect. Overall, we recommend the use of m/z 131 as a first step in screening for SFPs in textiles. With few exceptions, this ion is both sensitive and highly specific to SFPs and provided much less interference compared to the total ion chromatogram. Although ion m/z 77 is more intense, it is a common ion for many pyrolysis products and less specific to PFAS.
A ceramic baking plate was also included as a reference material to verify the absence of typical PFAS ions (Fig. S3†). Indeed, none of the characteristic ions previously observed for PTFE or the PFAA standards were observed at 1.3 min for the ceramic baking plate, confirming the utility of this region for monitoring PTFE-related polymers (see e.g. Fig. S3†vs.Fig. 1). However, the observation of environmentally persistent cyclic siloxane pyrolysis products was notable (Fig. S3†) and requires further investigation when considering the life-cycle of Si-based alternatives.
Electronics
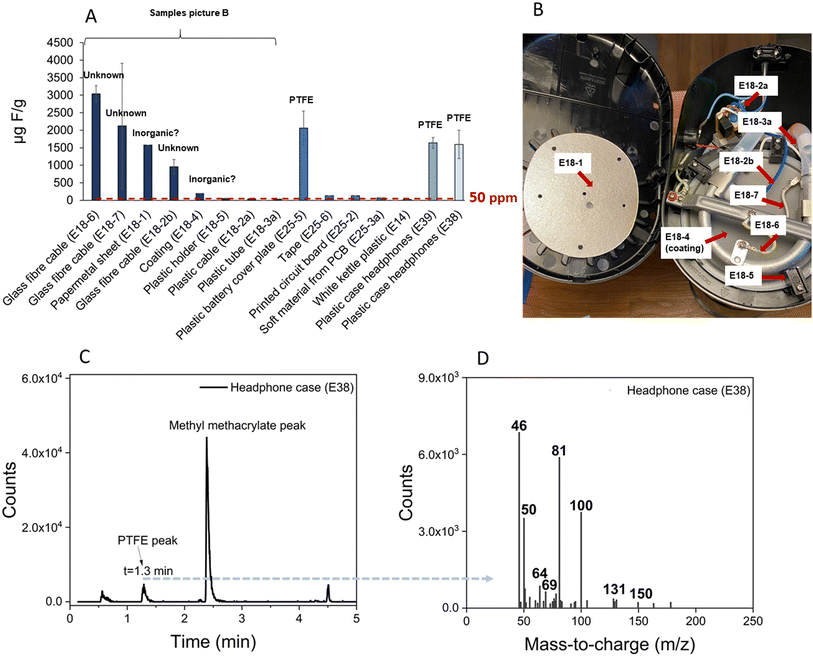
Total fluorine concentrations in electronics ranged from <22–3040 μg F g−1, with 12 out of 15 samples exceeding the 50 μg F g−1 (ppm) regulatory limit suggested in the recent class-wide restriction proposal. Ten of these products were further characterized by pyr-GC/MS. Surprisingly, the plastic headphone cases (E38 and E39) and loudspeaker plastic back plate (E25-5) showed relatively high fluorine concentrations (1595, 1641 and 2064 μg F g−1). Pyr-GC/MS analysis of these samples revealed a peak with a retention time (1.3 min) and fragment ions (m/z 69, 81, 100, 131) which were characteristic of PTFE-related polymers (Fig. 3). The highest concentrations of fluorine were observed in the two glass fibre cables of the coffee maker (E18-6: 3043 μg F g−1 and E18-7: 2121 μg F g−1). Within the coffee maker, high concentrations occurred in the papermetal sheet (E18-1; 1580 μg F g−1), another glass fibre cable (E18-2b; 957 μg F g−1) and a coating (E18-4; 198 μg F g−1), while the other plastic cable (E18-2a), the plastic tube (E18-3a) and the plastic holder (E18-5) contained low levels of fluorine (38–53 μg F g−1). Follow-up analysis of the papermetal sheet (E18-1), heat plate coating (E18-4), and glass fibre cables (E18-2b and E18-6) by pyr-GC/MS revealed no evidence of organofluorine. For the former two samples, we speculate that the fluorine may be from mica, an inorganic pigment/filler that is commonly used in cookware to provide pearlescent aesthetics and for heat protection in high-temperature applications. As for the glass fibre cables, the total ion chromatograms indicate a silicone coating, but we could not determine the origin of the fluorine. Clearly, all four products require further investigation to identify the structure of the fluorine measured in them. We speculate that analysis of the ash leftover after pyrolysis, for example by scanning electron microscopy and/or energy-dispersive X-ray spectroscopy (SEM-EDS), may offer a means of confirming the presence of inorganic fluorine, but this requires further investigation.Personal care products
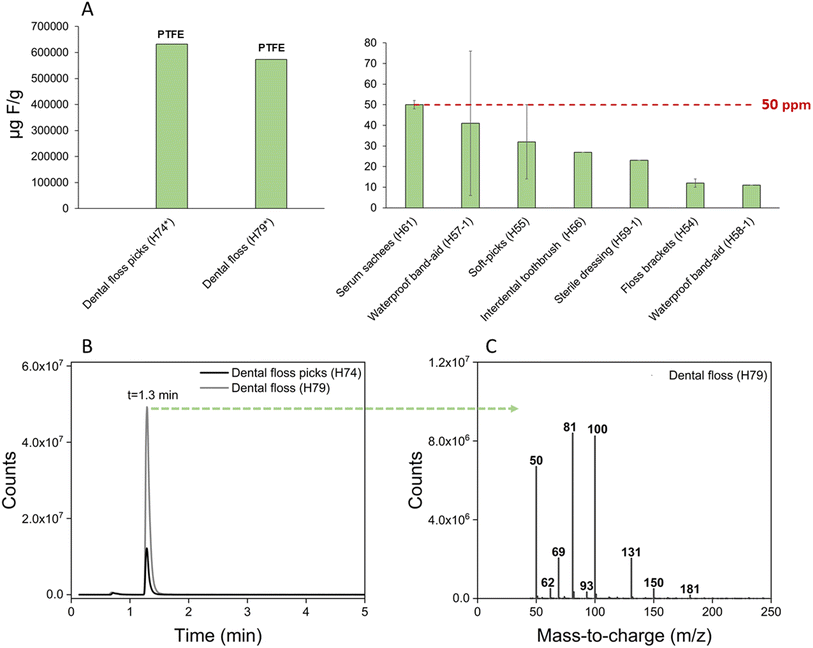
Total fluorine concentrations in the nine personal care products ranged from <22–630![[thin space (1/6-em)]](https://www.rsc.org/images/entities/char_2009.gif) 000 μg F g−1 (Fig. 4), with two products exceeding the proposed 50 μg F g−1 regulatory limit. The first product, floss picks (H74; 632
000 μg F g−1 (Fig. 4), with two products exceeding the proposed 50 μg F g−1 regulatory limit. The first product, floss picks (H74; 632![[thin space (1/6-em)]](https://www.rsc.org/images/entities/char_2009.gif) 670 μg F g−1), contained PTFE according to the packaging, which was ultimately confirmed by pyr-GC/MS. The second product, dental floss (H79; 573
670 μg F g−1), contained PTFE according to the packaging, which was ultimately confirmed by pyr-GC/MS. The second product, dental floss (H79; 573![[thin space (1/6-em)]](https://www.rsc.org/images/entities/char_2009.gif) 835 μg F g−1), not only contained fluoride according to the packaging, but also PTFE, according to pyr-GC/MS analysis. These data highlight the importance of follow-up analysis by pyr-GC/MS for confirming the nature of total fluorine measurements. While the exact proportion of total fluorine attributed to PTFE vs. fluoride remains unclear, we can reasonably assume that most is from PTFE, since this appears to comprise the entirety of the floss material (the fluoride, in comparison, appears to be a coating on the floss).
835 μg F g−1), not only contained fluoride according to the packaging, but also PTFE, according to pyr-GC/MS analysis. These data highlight the importance of follow-up analysis by pyr-GC/MS for confirming the nature of total fluorine measurements. While the exact proportion of total fluorine attributed to PTFE vs. fluoride remains unclear, we can reasonably assume that most is from PTFE, since this appears to comprise the entirety of the floss material (the fluoride, in comparison, appears to be a coating on the floss).
Cookware
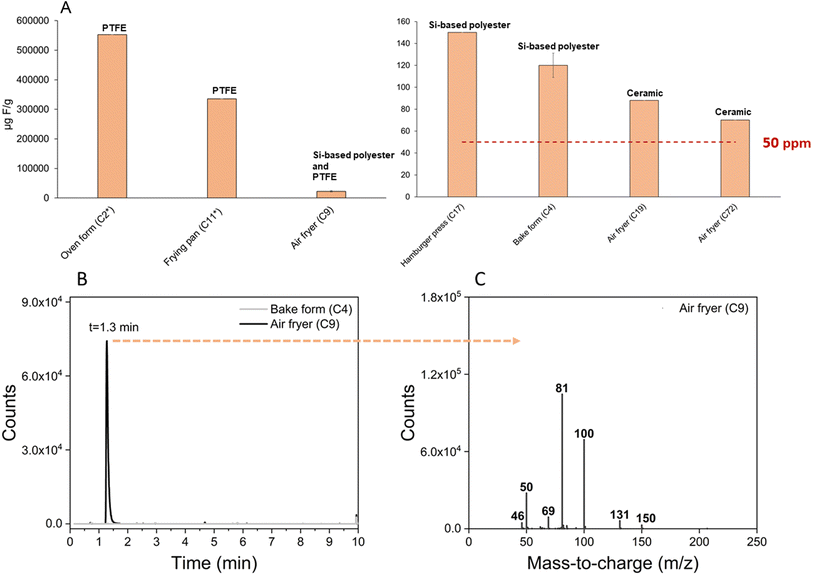
All analyzed cookware coatings contained fluorine concentrations (range 70–550![[thin space (1/6-em)]](https://www.rsc.org/images/entities/char_2009.gif) 000 μg F g−1) which exceeded the 50 ppm limit suggested in the restriction proposal. The highest fluorine concentrations were observed in oven form C2, frying pan C11, and air fryer C9 (553
000 μg F g−1) which exceeded the 50 ppm limit suggested in the restriction proposal. The highest fluorine concentrations were observed in oven form C2, frying pan C11, and air fryer C9 (553![[thin space (1/6-em)]](https://www.rsc.org/images/entities/char_2009.gif) 064 μg F g−1, 335
064 μg F g−1, 335![[thin space (1/6-em)]](https://www.rsc.org/images/entities/char_2009.gif) 127 μg F g−1, and 22
127 μg F g−1, and 22![[thin space (1/6-em)]](https://www.rsc.org/images/entities/char_2009.gif) 723 μg F g−1, respectively), which had concentrations several orders of magnitude higher than the other products. For C2 and C11, high concentrations were expected due to the known PTFE coating (see prior section on pyr-GC/MS method validation). For the remaining five products (i.e. air fryer C9, bake form C4, hamburger press C17, air fryer C19 and air fryer C72) the coating was unknown. These products were therefore all subjected to further analysis by pyr-GC/MS. Note that the bake plate C1 was not analyzed with CIC due to the challenges of removing and collecting the extremely fine powder formed when trying to scrape off the coating.
723 μg F g−1, respectively), which had concentrations several orders of magnitude higher than the other products. For C2 and C11, high concentrations were expected due to the known PTFE coating (see prior section on pyr-GC/MS method validation). For the remaining five products (i.e. air fryer C9, bake form C4, hamburger press C17, air fryer C19 and air fryer C72) the coating was unknown. These products were therefore all subjected to further analysis by pyr-GC/MS. Note that the bake plate C1 was not analyzed with CIC due to the challenges of removing and collecting the extremely fine powder formed when trying to scrape off the coating.
For C4 (bake form) and C9 (air fryer), total ion chromatograms were consistent with one another but quite different from the PTFE (C2 and C11) and ceramic (C1) reference materials. The peaks in the total ion chromatogram indicated a siloxane-based polyester coating. An extracted ion chromatogram (m/z 100) was needed to observe a peak at 1.3 min with a mass spectrum corresponding to PTFE for the air fryer (C9) (Fig. 5). This analysis was repeated three times and PTFE was found in all three analyses. However, no PTFE was found in the bake form (C4). It is not known whether the PTFE content in C9 was intentionally added or present due to cross-contamination during the factory coating process. For the remaining products (C17, C19, and C72) no evidence for the presence of PFAS was obtained by pyr-GC/MS. The chromatogram of the hamburger press (C17) suggested a polyester-based coating while the chromatograms of the remaining air fryers (C19 and C72) were indicative of ceramic Si-based coatings due to the formation of cyclic siloxanes during pyrolysis. While the presence of fluorine in these samples remains unclear, we speculate that contamination could have occurred during production, since PFAS-free products may still be produced in the same facilities and production lines as products containing PTFE. The low fluorine levels could also be due to the use of mica, as described previously in electronics equipment.
Textiles
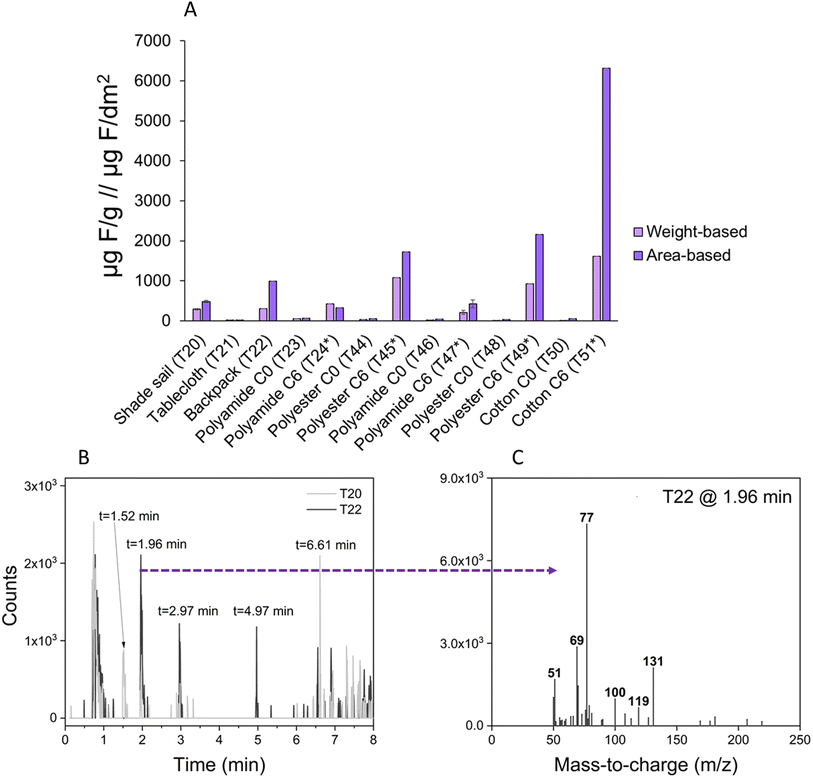
Weight-based concentrations of fluorine in treated textiles ranged from 200–1600 μg F g−1 and were non-quantifiable (i.e. below or close to LOD of 13 μg F g−1) in the textiles treated with a PFAS-free finish (“C0”; Fig. 6 and Table S3†). Pyr-GC/MS analysis generated total ion chromatograms that appeared similar for both C6-SFP and C0-coated textiles; only by examining the extracted ion chromatogram for m/z 131 could clear differences be observed (Fig. S4 and S5†). Both the retention time and mass spectrum of the first eluting peak (∼1.5–1.7 min; Fig. S4 and S5†) in the m/z 131 extracted ion chromatogram of samples T45, T49, and T51 (all listing C6 finishes) were identical to that of the C6-reference material, confirming the use of this SFP in these products.Three unknown textile samples (shade sail T20, tablecloth T21, and backpack T22) were analyzed, and based on the quantified total fluorine concentration (>50 ppm) the shade sail textile T20 and backpack T22 were further investigated by pyr-GC/MS. Although the intensity was low, the presence of PFAS could be confirmed in both products by matching retention times and characteristic fragment ions (m/z 69, 77, 100, 119 and 131) to those of the reference materials. For example, shade sail T20 produced peaks with retention times (1.52 and 6.61 min) corresponding to a C6-SFP, whereas backpack T22 produced peaks (retention times 1.96, 2.97 and 4.97 min) and corresponding mass spectra which confirmed a C8-SFP treatment. These results clearly demonstrate that unknown textiles can be screened for intentionally added PFAS using a combination of CIC and pyr-GC/MS, with the latter approach offering information about the structure of the SFP (i.e. C4, C6 or C8).
The 50 ppm restriction limit suggested in the recent PFAS restriction proposal appears to distinguish textiles containing SFP-treatments from PFAS-free treatments (i.e. C0) quite well. However, since the surface of the textile is normally fluorinated, weight-based concentrations can be strongly influenced by fabric density. For this reason, we converted weight-based concentrations into area-based concentrations, which produced values ranging from 20–6315 μg F dm−2 (Fig. 6). Especially the cotton-based textile T51 showed a considerable change due to its density (3.9 g dm−2). Conceivably, a manufacturer could switch to higher density base textiles in order to stay under the 50 ppm limit. Therefore, in the case of textiles and other coated materials, we propose the creation of area-based concentration limits, in addition to the existing weight-based limits.
Conclusions
For the first time, a broad selection of consumer products was characterized for total fluorine by CIC and information on the structure of the fluorine deduced by pyr-GC/MS. The combination of these two methods offers a promising and efficient strategy for enforcing the 50 ppm PFAS limit in materials and consumer products specified in the class-wide PFAS restriction proposal. Products containing over 50 ppm fluorine contain intentionally added PFAS that are often fluorinated polymers of various types. Compared to methods that employ extraction before analysis, the methods applied in this study are based on direct thermal breakdown of samples which makes them faster and better suited for detection of polymers. Additionally, once the structure of the polymer is deduced, TF concentrations (e.g. μg F g−1) can be easily converted to molecular concentrations (i.e. μg C6F13/g in the case of a C6-SFP). For example, the polyester C6 SFP (T45; 1078 μg F g−1) would equate to 1078 μg F g−1 × 319 μg C6F13/19 μg F = 18![[thin space (1/6-em)]](https://www.rsc.org/images/entities/char_2009.gif) 099 μg C6F13/g. As pointed out by Liagkouridis et al. (2022),22 expressing SFP concentrations in terms of the mass of side chain (as opposed to fluorine equivalents) facilitates estimation of both the structure and quantity of PFAA degradation products.
099 μg C6F13/g. As pointed out by Liagkouridis et al. (2022),22 expressing SFP concentrations in terms of the mass of side chain (as opposed to fluorine equivalents) facilitates estimation of both the structure and quantity of PFAA degradation products.
Finally, several aspects of the pyr-GC/MS methodology must be improved before this method can be fully implemented. This includes further expansion of pyr-GC/MS spectral libraries for PFAS, and testing of “softer” ionization sources which preserve structural information for de novo structural elucidation. We also note that the higher detection limits associated with CIC and pyr-GC/MS make these techniques unsuitable for enforcing individual PFAS limits (e.g. the 25 ppb limit for PFOA), which require a more sensitive, targeted approach. This approach can also help companies understand if and what type of PFAS they have in their assortment to aid decision making for prioritisation of PFAS- substitution work. Finally, we note the challenges associated with inorganic fluorine, which we suspected to occur in some products but could not confirm unequivocally.
Author contributions
Lisa Skedung: conceptualization, project administration, investigation, formal analysis, visualization, writing – original draft, writing – review and editing, funding acquisition; Eleni Savvidou: investigation, formal analysis, visualization, writing – original draft, writing – review and editing; Steffen Schellenberger: visualization, investigation, writing – original draft, writing – review and editing; Anders Reimann: investigation, writing – review and editing; Ian Cousins: writing – original draft, writing – review and editing, funding acquisition; Jon Benskin: conceptualization, investigation, visualization, writing – original draft, writing – review and editing.Conflicts of interest
There are no conflicts of interest to be declared.Acknowledgements
The project received funding from POPFREE Industry – Towards a PFAS-free and circular industry, VINNOVA (grant number 2021-04200), Swedish Research Council FORMAS (grant number 2020-01978). Graham Peaslee and Seán Roche from the University of Notre Dame are thanked for carrying out the PIGE analysis. The POPFREE Industry partners are acknowledged for providing most of the samples for the study.References
- CompTox Chemicals Dashboard, https://comptox.epa.gov/dashboard/chemical-lists/pfasmaster, (accessed 15 November 2022) Search PubMed.
- Z. Wang, A. M. Buser, I. T. Cousins, S. Demattio, W. Drost, O. Johansson, K. Ohno, G. Patlewicz, A. M. Richard, G. W. Walker, G. S. White and E. Leinala, A New OECD Definition for Per- and Polyfluoroalkyl Substances, Environ. Sci. Technol., 2021, 55, 15575–15578 CrossRef CAS PubMed.
- J. Glüge, M. Scheringer, I. T. Cousins, J. C. DeWitt, G. Goldenman, D. Herzke, R. Lohmann, C. A. Ng, X. Trier and Z. Wang, An overview of the uses of per- and polyfluoroalkyl substances (PFAS), Environ. Sci.: Processes Impacts, 2020, 22, 2345–2373 RSC.
- S. E. Fenton, A. Ducatman, A. Boobis, J. C. DeWitt, C. Lau, C. Ng, J. S. Smith and S. M. Roberts, Per- and Polyfluoroalkyl Substance Toxicity and Human Health Review: Current State of Knowledge and Strategies for Informing Future Research, Environ. Toxicol. Chem., 2021, 40, 606–630 CrossRef CAS PubMed.
- G. T. Ankley, P. Cureton, R. A. Hoke, M. Houde, A. Kumar, J. Kurias, R. Lanno, C. McCarthy, J. Newsted, C. J. Salice, B. E. Sample, M. S. Sepúlveda, J. Steevens and S. Valsecchi, Assessing the Ecological Risks of Per- and Polyfluoroalkyl Substances: Current State-of-the Science and a Proposed Path Forward, Environ. Toxicol. Chem., 2021, 40, 564–605 CrossRef CAS PubMed.
- J. W. Washington, K. Rankin, E. L. Libelo, D. G. Lynch and M. Cyterski, Determining global background soil PFAS loads and the fluorotelomer-based polymer degradation rates that can account for these loads, Sci. Total Environ., 2019, 651, 2444–2449 CrossRef CAS PubMed.
- D. Muir and L. T. Miaz, Spatial and Temporal Trends of Perfluoroalkyl Substances in Global Ocean and Coastal Waters, Environ. Sci. Technol., 2021, 55, 9527–9537 CrossRef CAS PubMed.
- A. O. De Silva, J. M. Armitage, T. A. Bruton, C. Dassuncao, W. Heiger-Bernays, X. C. Hu, A. Kärrman, B. Kelly, C. Ng, A. Robuck, M. Sun, T. F. Webster and E. M. Sunderland, PFAS Exposure Pathways for Humans and Wildlife: A Synthesis of Current Knowledge and Key Gaps in Understanding, Environ. Toxicol. Chem., 2021, 40, 631–657 CrossRef CAS PubMed.
- European Commission, Chemicals Strategy for Sustainability, https://circabc.europa.eu/ui/group/8ee3c69a-bccb-4f22-89ca-277e35de7c63/library/dd074f3d-0cc9-4df2-b056-dabcacfc99b6/details?download=true, (accessed 21 September 2023) Search PubMed.
- European Chemicals Agency, ANNEX XV RESTRICTION REPORT-Per- and Polyfluoroalkyl Substances (PFAS), Proposal for a Restriction, https://echa.europa.eu/documents/10162/1c480180-ece9-1bdd-1eb8-0f3f8e7c0c49, (accessed 21 September 2023) Search PubMed.
- European Chemicals Agency, The PFAS Restriction Proposal - Media Briefing Brussels, 2023, https://echa.europa.eu/documents/10162/2082415/2023-02-07_pfas+media+briefing_en.pdf/1661579d-353a-2fb0-1062-38fc3eb4bd78?t=1675849038730 (accessed 21 September 2023) Search PubMed.
- R. C. Buck, J. Franklin, U. Berger, J. M. Conder, I. T. Cousins, P. de Voogt, A. A. Jensen, K. Kannan, S. A. Mabury and S. P. van Leeuwen, Perfluoroalkyl and polyfluoroalkyl substances in the environment: Terminology, classification, and origins, Integr. Environ. Assess. Manage., 2011, 7, 513–541 CrossRef CAS PubMed.
- B. Améduri, The Promising Future of Fluoropolymers, Macromol. Chem. Phys., 2020, 221, 1900573 CrossRef.
- S. Schellenberger, P. Gillgard, A. Stare, A. Hanning, O. Levenstam, S. Roos and I. T. Cousins, Facing the rain after the phase out: Performance evaluation of alternative fluorinated and non-fluorinated durable water repellents for outdoor fabrics, Chemosphere, 2018, 193, 675–684 CrossRef CAS PubMed.
- A. E. Robel, K. Marshall, M. Dickinson, D. Lunderberg, C. Butt, G. Peaslee, H. M. Stapleton and J. A. Field, Closing the Mass Balance on Fluorine on Papers and Textiles, Environ. Sci. Technol., 2017, 51, 9022–9032 CrossRef CAS PubMed.
- L. Schultes, G. F. Peaslee, J. D. Brockman, A. Majumdar, S. R. McGuinness, J. T. Wilkinson, O. Sandblom, R. A. Ngwenyama and J. P. Benskin, Total Fluorine Measurements in Food Packaging: How Do Current Methods Perform?, Environ. Sci. Technol. Lett., 2019, 6, 73–78 CrossRef CAS.
- M. Z. Lauria, A. Naim, M. Plassmann, J. Fäldt, R. Sühring and J. P. Benskin, Widespread Occurrence of Non-Extractable Fluorine in Artificial Turfs from Stockholm, Sweden, Environ. Sci. Technol. Lett., 2022, 9, 666–672 CrossRef CAS PubMed.
- D. J. Muensterman, I. A. Titaley, G. F. Peaslee, L. D. Minc, L. Cahuas, A. E. Rodowa, Y. Horiuchi, S. Yamane, T. N. J. Fouquet, J. C. Kissel, C. C. Carignan and J. A. Field, Disposition of Fluorine on New Firefighter Turnout Gear, Environ. Sci. Technol., 2022, 56, 974–983 CrossRef CAS PubMed.
- K. W. Pütz, S. Namazkar, M. Plassmann and J. P. Benskin, Are cosmetics a significant source of PFAS in Europe? product inventories, chemical characterization and emission estimates, Environ. Sci.: Processes Impacts, 2022, 24, 1697–1707 RSC.
- J. Zweigle, B. Bugsel and C. Zwiener, Efficient PFAS prioritization in non-target HRMS data: systematic evaluation of the novel MD/C-m/C approach, Anal. Bioanal. Chem., 2023, 415, 1791–1801 CrossRef CAS PubMed.
- K. Rankin and S. A. Mabury, Matrix Normalized MALDI-TOF Quantification of a Fluorotelomer-Based Acrylate Polymer, Environ. Sci. Technol., 2015, 49, 6093–6101 CrossRef CAS PubMed.
- I. Liagkouridis, R. Awad, S. Schellenberger, M. M. Plassmann, I. T. Cousins and J. P. Benskin, Combined Use of Total Fluorine and Oxidative Fingerprinting for Quantitative Determination of Side-Chain Fluorinated Polymers in Textiles, Environ. Sci. Technol. Lett., 2022, 9, 30–36 CrossRef CAS.
- J. Zweigle, B. Bugsel, C. Capitain and C. Zwiener, PhotoTOP: PFAS Precursor Characterization by UV/TiO2 Photocatalysis, Environ. Sci. Technol., 2022, 56, 15728–15736 CrossRef CAS PubMed.
- V. A. Nikiforov, Hydrolysis of FTOH precursors, a simple method to account for some of the unknown PFAS, Chemosphere, 2021, 276, 130044 CrossRef CAS PubMed.
- F. Akoueson, C. Chbib, S. Monchy, I. Paul-Pont, P. Doyen, A. Dehaut and G. Duflos, Identification and quantification of plastic additives using pyrolysis-GC/MS: A review, Sci. Total Environ., 2021, 773, 145073 CrossRef CAS PubMed.
- F. Xiao, P. C. Sasi, B. Yao, A. Kubátová, S. A. Golovko, M. Y. Golovko and D. Soli, Thermal Stability and Decomposition of Perfluoroalkyl Substances on Spent Granular Activated Carbon, Environ. Sci. Technol. Lett., 2020, 7, 343–350 CrossRef CAS.
- A. Alinezhad, P. Challa Sasi, P. Zhang, B. Yao, A. Kubátová, S. A. Golovko, M. Y. Golovko and F. Xiao, An Investigation of Thermal Air Degradation and Pyrolysis of Per- and Polyfluoroalkyl Substances and Aqueous Film-Forming Foams in Soil, ACS ES&T Engg, 2022, 2, 198–209 Search PubMed.
- A. Alinezhad, H. Shao, K. Litvanova, R. Sun, A. Kubatova, W. Zhang, Y. Li and F. Xiao, Mechanistic Investigations of Thermal Decomposition of Perfluoroalkyl Ether Carboxylic Acids and Short-Chain Perfluoroalkyl Carboxylic Acids, Environ. Sci. Technol., 2023, 57, 8796–8807 CrossRef CAS PubMed.
- POPFREE Industry – Towards a PFAS-free and circular industry, https://www.ri.se/en/popfree/popfree-industry, accessed 13 December 2022.
- K. M. Spaan, B. Yuan, M. M. Plassmann, J. P. Benskin and C. A. de Wit, Characterizing the Organohalogen Iceberg: Extractable, Multihalogen Mass Balance Determination in Municipal Wastewater Treatment Plant Sludge, Environ. Sci. Technol., 2023, 57, 9309–9320 CrossRef CAS PubMed.
- A. Kärrman, L. W. Y. Yeung, K. M. Spaan, F. Thomas Lange, M. Anh Nguyen, M. Plassmann, C. A. de Wit, M. Scheurer, R. Awad and J. P. Benskin, Can determination of extractable organofluorine (EOF) be standardized? First interlaboratory comparisons of EOF and fluorine mass balance in sludge and water matrices, Environ. Sci.: Processes Impacts, 2021, 23, 1458–1465 RSC.
- P. Thomas, The use of fluoropolymers for non-stick cooking utensils, Surf. Coat. Int. (1991-2000), 1998, 81, 604–609 CrossRef CAS.
Footnotes |
| † Electronic supplementary information (ESI) available. See DOI: https://doi.org/10.1039/d3em00438d |
| ‡ Shared first authorship. |
| This journal is © The Royal Society of Chemistry 2024 |

