
 Open Access Article
 This Open Access Article is licensed under a
 Creative Commons Attribution 3.0 Unported Licence
Carbon monoxide as an indicator of indoor air quality
Tunga
Salthammer
 *
*
Fraunhofer WKI, Department of Material Analysis and Indoor Chemistry, 38108 Braunschweig, Germany. E-mail: tunga.salthammer@wki.fraunhofer.de
First published on 14th February 2024
Abstract
Carbon monoxide has long been known as an indoor air pollutant, but has rarely been in the focus of scientific interest. This circumstance is certainly disadvantageous for the health-related assessment of indoor air quality, because exposure to carbon monoxide is often associated with serious or fatal poisoning. From an analytical perspective, the problem is that increased carbon monoxide concentrations often occur unexpectedly and within a short period of time, usually in connection with incomplete combustion processes. Therefore, the exposure of the general population to carbon monoxide cannot be determined using environmental surveys. In recent years, however, carbon monoxide has again received significantly greater attention. A number of studies have been carried out on carbon monoxide exposure under certain conditions, for example when using candles, gas stoves or in waterpipe cafés. In addition, the World Health Organization has derived guideline values for different exposure times. Due to its molecular properties, carbon monoxide is very suitable for selective and sensitive measurement with high time resolution using infrared techniques. In addition, sensor technology has made significant progress, so that robust devices are now available for online monitoring. Carbon monoxide can definitely be considered a priority pollutant for indoor air. Actually, increased concentrations are always associated with health risk. It is therefore recommended to use carbon monoxide as an indicator of indoor air quality. This can be realized in a variety of ways and preferably in combination with other parameters.
 Tunga Salthammer | Tunga Salthammer holds a diploma in Chemistry, received a Dr rer. nat. in Physical Chemistry from the Technical University of Braunschweig and was appointed as a professor in 2012. He joined the Fraunhofer WKI in 1990 and is the deputy director of the institute. Since 2007, he has been an Adjunct Professor at the Queensland University of Technology in Brisbane. He has also been a Visiting Professor at the Technical University of Denmark and at Tsinghua University in Beijing. His research interests include VVOC/VOC/SVOC emission studies, indoor chemistry, airborne particles, and settled dust. |
Environmental significanceCarbon monoxide is generally considered a priority indoor pollutant because involuntary exposure can result in serious or fatal poisoning. However, increased concentrations typically occur over a certain period of time, usually in connection with incomplete combustion processes. In addition, the sensitive spectrometric analysis methods are not really suitable for routine operation. In the past, the substance therefore received less attention in indoor surveys than was actually necessary. The rapid development of sensor technology now offers the possibility of establishing carbon monoxide as an indicator of indoor air quality. In a network of multiple sensors, carbon monoxide is an important parameter for controlling ventilation, air quality and energy management as well as for protecting people and buildings. |
1 Introduction
Shortly after the synthesis and correct chemical description of carbon monoxide in the year 1800, the substance was used as a component of city gas for lighting streets and apartments and also for operating gas stoves. In 1888, Mason1 provided a description of fatal poisoning by carbon monoxide, also relying on Humphry Davy's findings from self-experimentation.2 Nevertheless, carbon monoxide received little attention as an indoor air pollutant until Yocom et al.3 reported the indoor/outdoor relationship of CO, SO2, and particulate matter in 1971. In the following, systematic studies were established on the occurrence of carbon monoxide indoors4,5 and on its release from indoor sources such as kerosene space heaters6 and tobacco products.7 Since then, various monographs on carbon monoxide as an indoor pollutant have been published.8–10 A systematic literature search by the World Health Organization11 led to the derivation of indoor air quality guidelines in 2010.Carbon monoxide is a typical reaction product released into the environment through natural processes such as atmospheric reactions, volcano activities and wildfire. Tropospheric background concentrations are typically below 200 ppb (0.23 mg m−3).12 However, anthropogenic processes such as the burning of biomass and road traffic also account for a significant proportion of emissions. As early as 1966, Haagen-Smit13 measured traffic-related peak concentrations of up to 120 ppm (137 mg m−3) in the greater Los Angelos area. Zhang et al.14 were able to show that cookstoves, which are particularly common in developing countries, release large amounts of CO. This is both an individual health problem for the exposed people and a global problem due to the large number of such devices.15 Nevertheless, based on simulations and the evaluation of measurement data, the Intergovernmental Panel on Climate Change (IPCC) assumes that global CO pollution has been declining since 2000.16
The concentration of CO in indoor air can fluctuate significantly in a short period of time, making continuous measurement strategies necessary.17 Although carbon monoxide is monitored in many studies, the substance is rarely in the focus of indoor and outdoor air quality research. This may also be due to the fact that the molecule is not perceptible to the sensory system and that inhalation at moderate concentrations does not cause acute pulmonary effects. The lack of symptoms increases the risk that carbon monoxide poisoning will progress gradually and, at very high concentrations, lead to immediate death. Carbon monoxide is now seen as a contributor to various adverse health effects18 and every year around 30![[thin space (1/6-em)]](https://www.rsc.org/images/entities/char_2009.gif) 000 people die worldwide from unintentional carbon monoxide poisoning.19 Hampson20 has analyzed the mortality due to carbon monoxide poisoning in the United States and comes to the conclusion that in this country the number of intentional deaths is decreasing, but is still significantly higher than the number of unintentional deaths. Raub et al.21 estimate that many annual deaths from fires in the Unites States are caused by CO poisoning.
000 people die worldwide from unintentional carbon monoxide poisoning.19 Hampson20 has analyzed the mortality due to carbon monoxide poisoning in the United States and comes to the conclusion that in this country the number of intentional deaths is decreasing, but is still significantly higher than the number of unintentional deaths. Raub et al.21 estimate that many annual deaths from fires in the Unites States are caused by CO poisoning.
Accidental carbon monoxide poisoning indoors can occur in many cases. These include the use of coal stoves for heating,22 biomass-fired cooking stoves,23–25 gas stoves in tents26 and mobile homes, the use of water pipes in private areas and in cafés,27,28 defective air conditioning systems and clogged exhaust systems.29 There are even reports that sleeping people in mobile homes are intentionally fumigated with CO for the purpose of robbery.30
In principle, cases of poisoning caused by carbon monoxide are easy to prevent or at least reduce. First of all, comprehensive information about the properties of the substance, the sources and the nature of the hazard is required. Furthermore, it is of great advantage that technically robust and inexpensive sensor technologies are available that are suitable for online monitoring of carbon monoxide in the air.31 The idea of measuring indoor air pollutants, including carbon monoxide, with a network of sensors was published in 1996 by Oyabu et al.32 Further progress was closely linked to the development of electronic components and software tools. In 2004, Zampolli et al.33 presented an electronic nose for low-cost indoor air quality monitoring applications. In 2016, Kumar et al.34 proposed using air quality sensors for energy management in commercial buildings. Since then, the advantages of indoor CO monitoring have been convincingly presented in a number of publications.31,35–37 At the same time, the advances in sensor technology became apparent.38–42
The toxicologically and epidemiologically based guidelines of the World Health Organization were recently updated.43 This makes carbon monoxide a key pollutant for evaluating indoor air quality.44 In principle, the number of parameters that can be used to assess indoor air quality from a practical perspective is limited. The possible pros and cons of carbon monoxide monitoring are discussed in the following sections.
2 Methods
This work aims to provide scientifically sound arguments for using carbon monoxide as an indicator of indoor air quality. Therefore, it is not a systematic review according to the PRISMA45 criteria, but the cited literature references are viewed as representative. The selection was made after searching the Web of Science, Scopus, PubMed and Google Scholar databases using the keywords “carbon monoxide, poisoning, indoor, air quality, guide value, infrared, photoacoustics, metal oxide sensor, electrochemical sensor, gas sensor, monitoring, network, calibration, regression model, smart home”. The physical data was taken from the sources cited.Statistical calculations were performed using OriginPro 2021b (OriginLab Corporation). The figures were created using OriginPro 2021b and PowerPoint 365 (Microsoft).
3 Physical properties of carbon monoxide
Carbon monoxide is a colorless and odorless gas with a molar mass of 28.01 g mol−1.46 At T = 298 K and p = 101325 Pa, 1 ppm ≙ 1.14 mg m−3. The density of 1.25 kg m−3 is almost identical to the density of air.46 The solubility in water is low and the Henry constant is correspondingly small47 (see also Table 1). The experimentally determined bond length in the carbon monoxide molecule is 112.8 pm.48 This suggests that the resonance structure of one σ bond and two π bonds shown in Table 1 dominates.49 The triple bond also explains the low dipole moment of 0.11 D, since the negative charge is shifted from the more electronegative oxygen atom to the carbon atom. The physical properties of carbon monoxide are summarized in Table 1.
| Parameter | Property | Ref. |
|---|---|---|
| IUPAC name | Carbon monoxide | |
| Chemical formula | CO | |
| CAS no. | 630-08-0 | |
| Molecular structure |
⊖|C![[triple bond, length as m-dash]](https://www.rsc.org/images/entities/char_e002.gif) O|⊕ O|⊕ |
49 |
| Ionization energy | 14.014 eV | 52 |
| Dissociation energy | 11.09 eV | 52 |
| Proton affinity at C | 594 kJ mol−1 | 53 |
| Proton affinity at O | 426.3 kJ mol−1 | 53 |
| Molecular weight | 28.01 g mol−1 | 46 |
| Density | 1.250 kg m−3 (273 K) | 46 |
| Melting point | −205.1 °C | 46 |
| Boiling point | −191.5 °C | 46 |
| Dipole moment | 0.11 D | 46 |
| Solubility in water | 0.02319% (293 K, 101.33 kPa) | 54 |
| Henry constant | 9.7 × 10⁻⁶ mol m−3 Pa−1 (298 K) | 47 |
| k OH | 1.5 × 10⁻¹³ cm3 molecule−1 s−1 (298 K) | 12 |

|
−0.53 V (298 K, pH 7) | 55 |
As a linear diatomic molecule with C∞ν geometry, carbon monoxide only has symmetric valence vibrations in the direction of the connected atoms. Rotation and vibration spectra can be described to a good approximation by the rotation constant B0 = 1.9313 cm−1 and the vibration force constant k = 1855 N m−1 for the 12C16O isotope.50 The experimentally determined spectroscopic constants agree well with theory.51 The oscillation process is superimposed by rotational transitions. Every vibration transition is associated with a change in the rotational quantum number ΔJ ± 1. Since ΔJ = 0 is forbidden, the vibration/rotation spectrum of carbon monoxide consists of a P-branch and an R-branch. Without taking the rotational fine structure into account, the wavenumbers of the v0 → v1 transition are 2114 cm−1 (4.73 μm) and 2170 cm−1 (4.61 μm). Significantly weaker vibration bands lie at 4292 cm−1 (2.33 μm) and 6410 cm−1 (1.56 μm).
4 Chemistry of carbon monoxide
The major sources for the formation of carbon monoxide are atmospheric reactions and combustion processes. In the atmosphere carbon monoxide is formed when hydrocarbons, especially methane, react with hydroxy radicals according to eqn (1).12 | (1) |
Carbon monoxide also reacts with OH radicals (see Table 1) to form carbon dioxide and the hydroperoxyl radical.12 The net reaction is shown in eqn (2). In the troposphere, carbon monoxide has an average lifetime of 30–90 days.12
 | (2) |
In urban areas, the incomplete combustion of fuel, gas and biomass is the main source of the formation of carbon monoxide. This is shown in eqn (3) using the example of propane combustion with a substoichiometric oxygen content.
| 2C3H8 + 7O2 → 2CO2 + 8H2O + 2C + 2CO | (3) |
The partial oxidation of methane according to eqn (4) also leads to the formation of carbon monoxide. This process is used industrially to produce synthesis gas.
| 2CH4 + O2 → 2CO + 4H2 | (4) |
Other reactions take place, the Boudouard equilibrium (5) and the water-gas shift equilibrium (6) being the most important. Both reactions are endothermic in the direction of CO formation.
| C + CO2 ⇌ 2CO | (5) |
| 2CO + H2O ⇌ CO2 + H2 | (6) |
Carbon monoxide is a weak Lewis base but has the ability to act as a donor ligand to transition metals and form metal carbonyls.56 The molecule has an affinity for the divalent iron of hemoglobin that is approximately 300 times higher than oxygen. Even at low CO concentrations in the breathing air, this leads to the formation of carboxyhemoglobin (CO-Hb), which is then no longer available for oxygen transport.57 Therefore, if intoxication is suspected, the CO-Hb level in the blood is often measured.58 However, the measurement must be carried out quickly because CO-Hb dissociates with a half-life of a few hours.59 Carbon monoxide does not have a direct pulmonary irritant effect, but cardiological symptoms can occur when exposed to CO during physical exertion.60
5 Measurement techniques
Carbon monoxide can be determined quantitatively using gas chromatography in combination with a flame ionization detector.61,62 However, from today's perspective, the method is outdated and is therefore rarely used. The electronic transitions of carbon monoxide are in the UV-C range.52 This is utilized in atmospheric sciences to detect CO in the lower ppb range using photoionization techniques with laser excitation.63 An alternative technique, but not very popular for indoor applications, is Tunable Diode Laser Spectroscopy (TDLS).63 A method that is also rarely used for indoor applications and will not be discussed further here is cavity ringdown spectroscopy (CRDS).64 Carbon monoxide has only a low proton affinity on both the C atom and the O atom (see Table 1). Therefore, the molecule is not suitable for detection using proton transfer reaction mass spectrometry (PTR-MS) with H3O+ as reagent ion. Edtbauer et al.65 utilized Kr+ for chemical ionization to measure CO in car exhaust by PTR-MS. The concentration range between 0.1 mg m−3 and 200 mg m−3 is of particular interest for indoor applications. The appropriate analytical methods are introduced in the following sections and an overview is provided in Table 2.| Method | Comment | Ref. |
|---|---|---|
| Gas chromatography | No longer used for measuring CO in indoor air | 61 and 62 |
| LOD: 1 ppb | ||
| NDIR | Standardized European method | 67 |
| LOD: calculated from the instrument baseline | ||
| PAS (optical filter) | Frequently used indoors | 70 |
| LOD: 0.2 ppm, 4.7 μm filter with a bandwidth of 3% | ||
| PAS (laser excitation) | Photoacoustic and photothermal spectroscopy | 71 |
| Not common for monitoring indoor air | ||
| LOD: 6–15 ppb, 4.6 μm quantum cascade laser | ||
| TLDS | Not common for monitoring indoor air | 77 |
| LOD: 1.4 ppb, 4.7 μm | ||
| CRDS | Not common for monitoring indoor air | 64 |
| LOD: Lower ppb range | ||
| MOS | Suitable for indoor applications | 76 |
| LOD: 5–10 ppm, depending on sensor | ||
| ECS | Suitable for indoor applications | 37 and 38 |
| Working range: 0.1–15 mg m−3 (specific sensor) |
5.1 Non-dispersive infrared (NDIR)
Non-dispersive infrared (NDIR) uses an IR light source that is modulated to compensate for thermal drift.66 In the sample cell, the absorption of the target component is measured and converted into a concentration according to the Lambert–Beer law. The desired wavelength can be selected via an optical filter placed before or after the sample cell. Older devices do not use optical filters but rather filter cells filled with interfering gases. A non-absorbing gas such as nitrogen is used as a reference. This can be achieved using a parallel beam path with a second sample cell or the target compound and the reference gas are passed alternately through the same cell. The detector often consists of cells that are filled with the target gas. If the IR radiation arriving in the detectors is different, the gases are heated differently, which in turn leads to different pressures in the cells. The European standard prEN 14626 (ref. 67) describes a method for the measurement of carbon monoxide by non-dispersive infrared spectroscopy in ambient air and gives examples of technical designs. The NDIR principle is suitable for use in handheld devices, although limitations in terms of precision and repeatability must be accepted. The detection of multiple gases in mixed states can also be achieved with NDIR.685.2 Photoacoustic spectroscopy (PAS)
Photoacoustic spectroscopy (PAS) is closely related to NDIR and there are also various technical versions.69 The appropriate excitation wavelength is selected for measuring a specific gas in air. In the case of carbon monoxide, this is typically around 4.7 μm. Wavelength selection can be achieved using an optical filter or a laser. For a commercial device, the manufacturer specifies a detection limit of 0.2 ppm when using a 4.7 μm optical filter with a bandwidth of 3%.70 Pinto et al.71 used a continuous wave cascade laser (4.59 μm) for excitation. Zifarelli et al.72 applied laser-assisted PAS to simultaneously detect four gas species, including CO. The photoacoustic principle is based on the excitation of the target compound in the sample cell (stopped-flow technique) by the intensity-modulated light source. The absorbed light energy heats the molecules in the cell, resulting in periodic pressure fluctuations. These are recorded with a pressure-sensitive membrane, converted into an electrical signal and finally into a concentration. The schematic structure of a photoacoustic spectrometer is shown in Fig. 1. An alternative is to measure the change in other thermal properties of the target compound, for example the refractive index. This variant is called photothermal spectroscopy (PTS).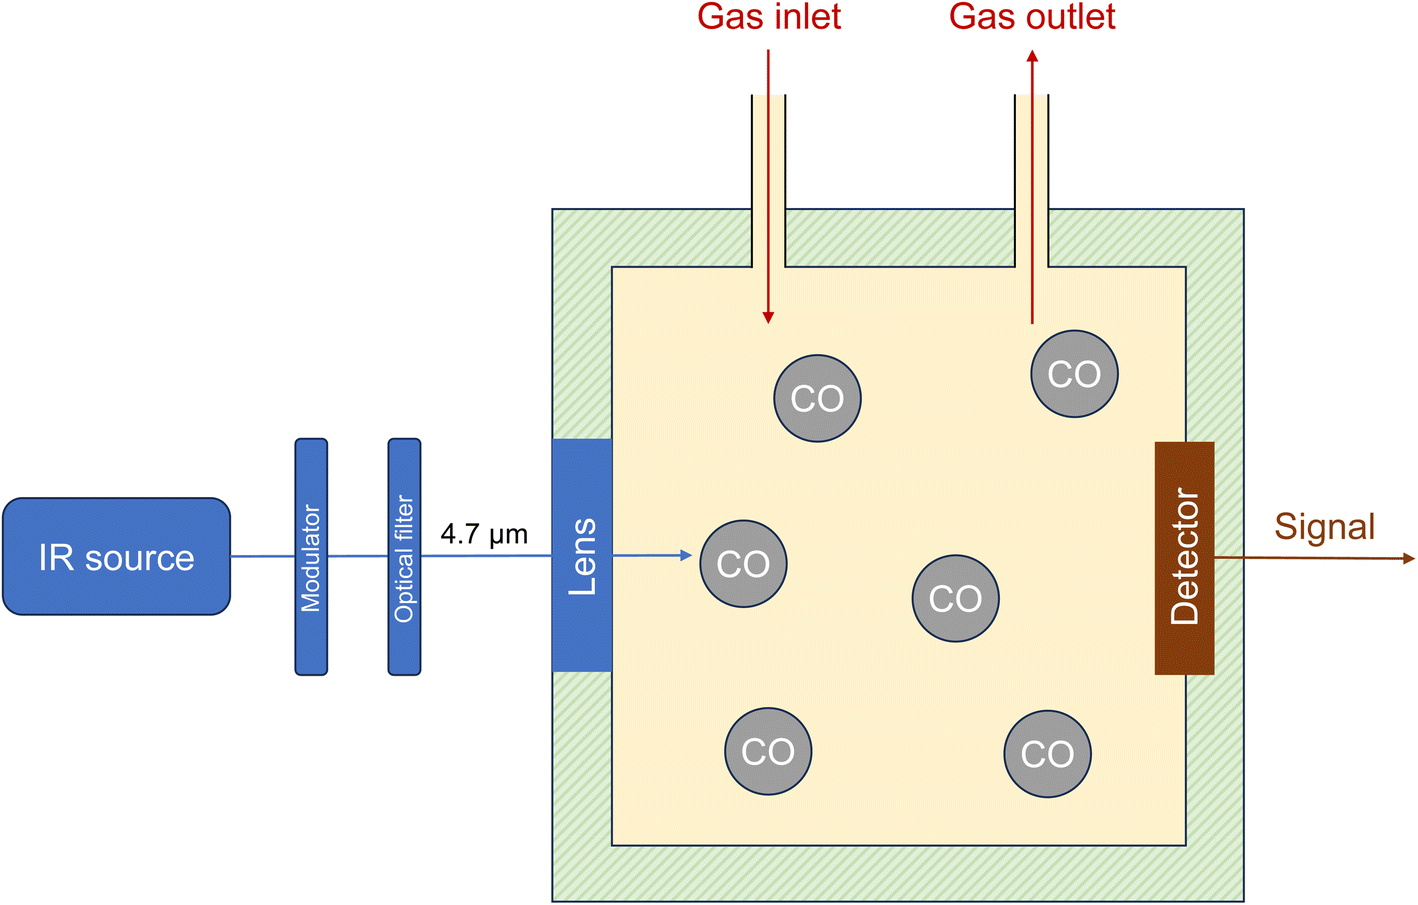 | ||
| Fig. 1 Principle of photoacoustic spectroscopy (PAS). The specific technical versions of devices69 may differ from this figure. | ||
5.3 Electrochemical sensors (ECS)
Electrochemical sensors (ECS) use the redox potential for the oxidation of carbon monoxide to carbon dioxide.73 The potential difference ΔE0versus the normal hydrogen electrode for 298 K and pH 7 is provided in Table 1. Fig. 2 demonstrates the principle of the method. Carbon monoxide diffuses through a polymer film into the sensor. Oxidation to CO2 takes place at the working electrode, which is made of platinum. This metal has a catalytic effect and is chemically stable. The protons migrate to the counter electrode, which is also made of platinum, and react with molecular oxygen to form water. The electrons released during oxidation flow from the working electrode through the external circuit and are measured amperometrically. Technical sensors also have a reference electrode with a constant potential (not shown in Fig. 2). Electrochemical sensors are generally susceptible to interference, especially to hydrogen.74 However, Cross et al.75 showed that carefully calibrated and trained sensors can adequately display ambient urban pollution concentrations. Afshar-Mohajer et al.38 examined a commercially available sensor and found that this type only provides reliable values at concentrations ≤12 ppm (13.7 mg m−3).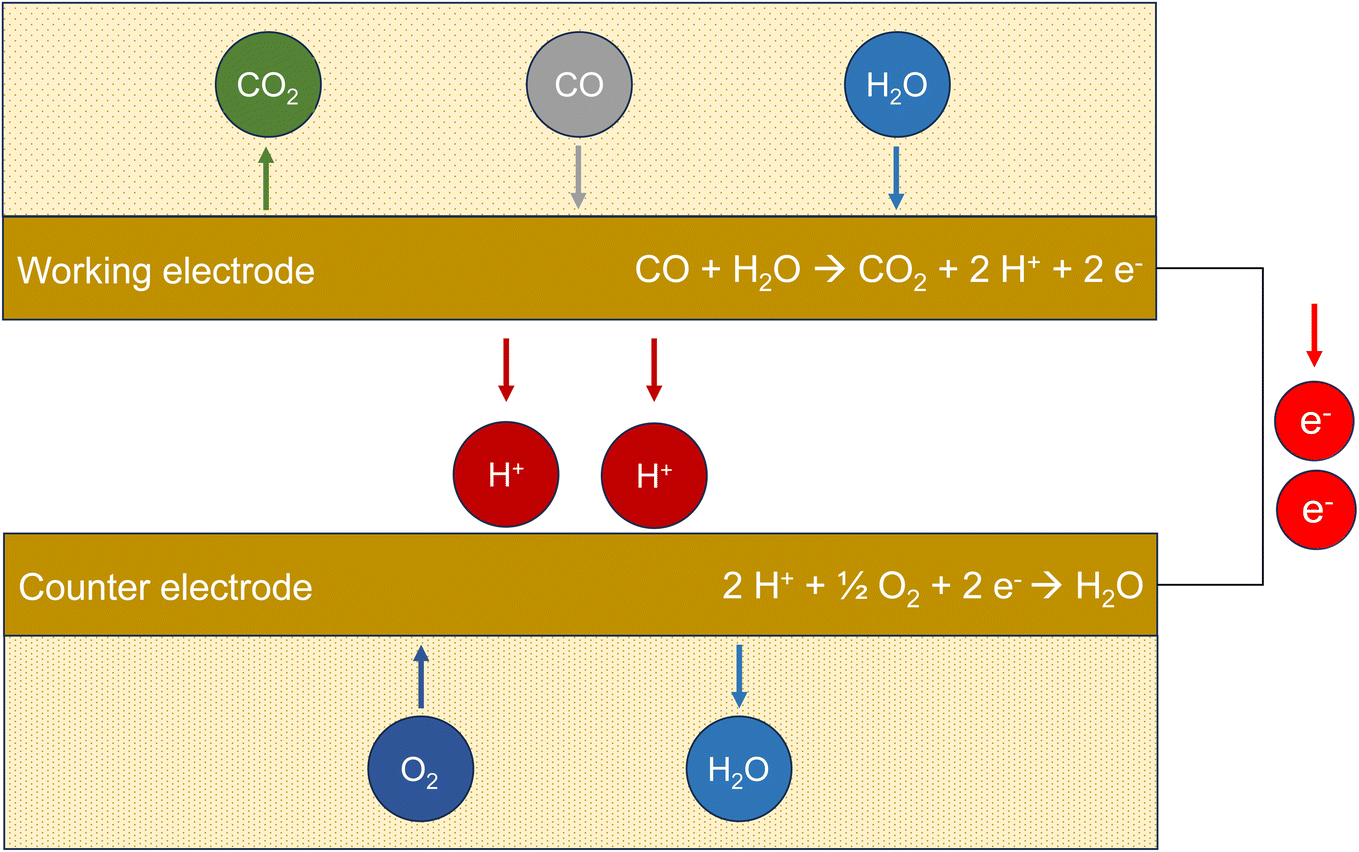 | ||
| Fig. 2 Working principle of an electrochemical sensor (ECS). The measured variable is the electrical current flow from the working electrode to the counter electrode after oxidation of CO. | ||
5.4 Metal oxide sensors (MOS)
Certain semiconducting metal oxides change their conductivity under the influence of interfering gases. In clean air, oxygen molecules adsorb on the sensor surface. Oxygen ions are formed by removing electrons from the semiconductor material. In the case of an n-type semiconductor such as tin(IV) oxide (SnO2), this reduces the electron density and the conductivity decreases. If carbon monoxide molecules diffuse to the surface of the semiconductor, they react with the adsorbed oxygen to form CO2 (see Fig. 3). A steady-state is established between adsorption and desorption of oxygen, carbon monoxide and carbon dioxide. This leads to a reduction in the oxygen coverage on the surface of the sensor. As a result, electrons are released into the semiconductor again and the conductivity increases. The associated change in electrical resistance can be measured. Oxidizing gases cause a decrease of conductivity in the n-type semiconductor. Fine et al.76 provide a detailed overview of metal oxide sensors, discuss technical details for measuring carbon monoxide and specify detection limits between 5 ppm and 10 ppm, depending on the respective sensor.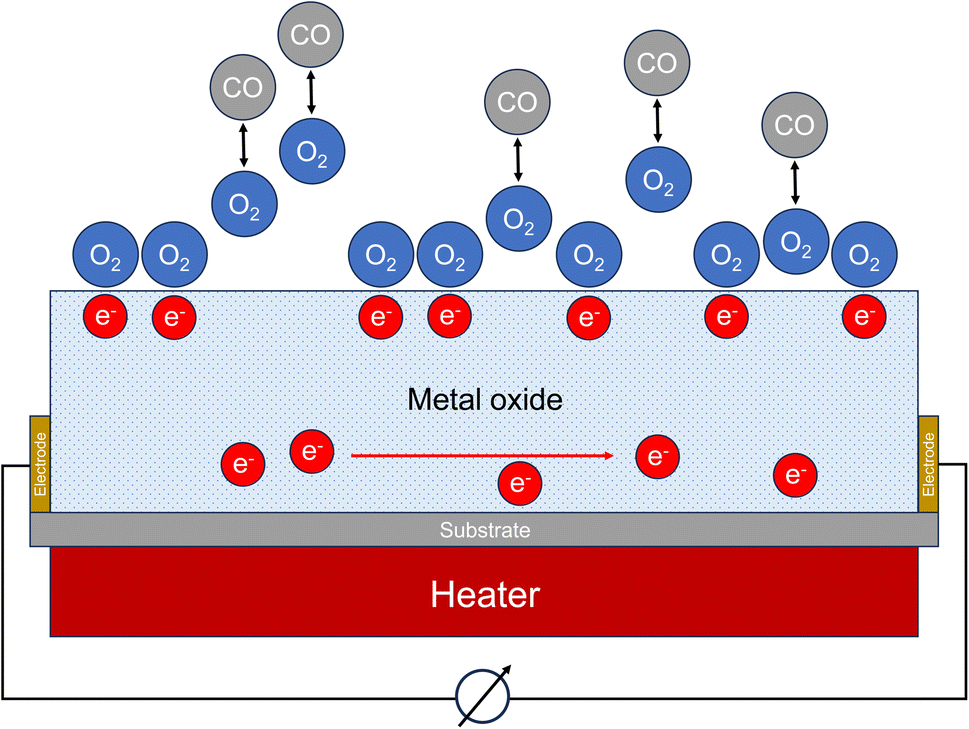 | ||
| Fig. 3 Working principle of a metal oxide sensor (MOS). The measured variable is the change of the electrical resistance. | ||
6 CO concentrations in indoor and outdoor air
In the ambient air, carbon monoxide concentrations are only increased near busy roads or near other combustion events such as wildfires. With the exception of undetected leaks, for example in heating systems, carbon monoxide is not continuously released into the indoor air. This means that the background values in indoor air and ambient air are usually low. However, if a source is present, it is mostly strong and often leads to peak concentrations over a short period of time, which makes measurement and exposure evaluation correspondingly more difficult. This is demonstrated in Fig. 4. The time course of the CO concentration during a cooking event in a WKI kitchen (76 m3) with the standard of a Western European household is shown. Several dishes were prepared on a gas stove and 8 persons participated. The room temperature was 24–30 °C and the relative humidity was 34–59%. The CO background concentration was in the range of 0.5 ppm, rose sharply during food preparation and dropped just as quickly after the stove was switched off and the windows were opened. However, after preparing the third dish and after closing the window, the concentration remained constantly at an elevated level until the final ventilation step. The data come from a so far unpublished study and were provided by Dr Erik Uhde (Fraunhofer WKI).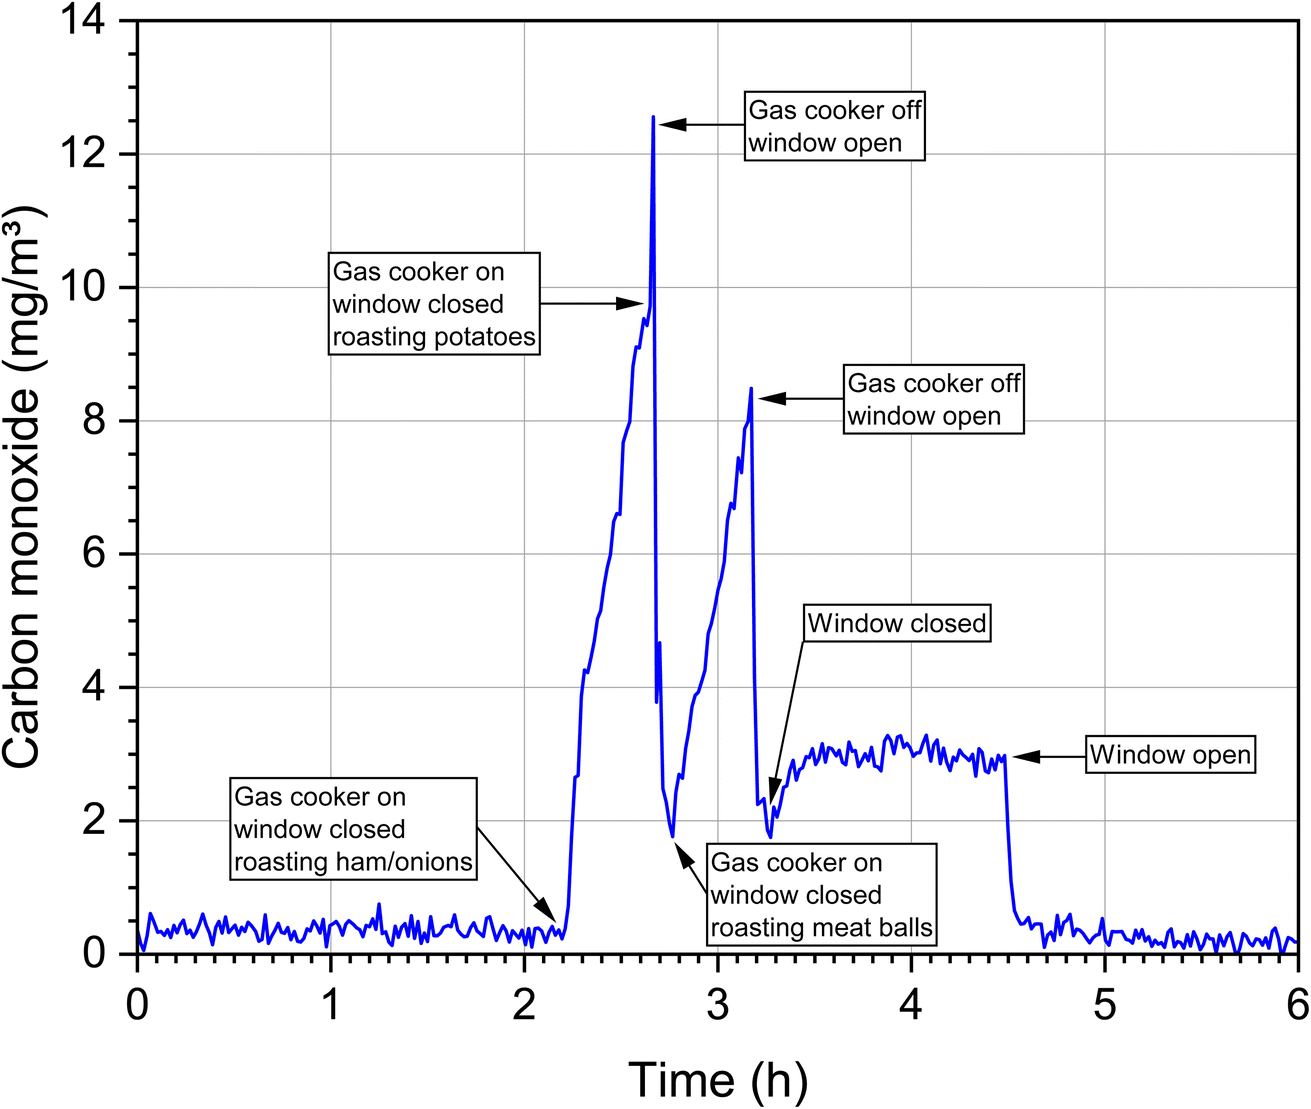 | ||
| Fig. 4 Time course of the carbon monoxide concentration (measured using photoacoustics, Innova 1512, LumaSense) in a modern kitchen when preparing food with a gas cooker without exhaust to the outside. The data come from a so far unpublished WKI study and were provided by Dr Erik Uhde, Fraunhofer WKI. | ||
Table 3 summarizes data on indoor carbon monoxide emission sources and source-dependent concentration ranges. The selection is not complete, but provides a representative overview and the information necessary for further discussion. A functioning wood oven with an appropriate exhaust only leads to a small increase in the CO concentration.78 Significantly higher values result from sources that have no exhaust to the outside, such as ethanol stoves,79 candles,80 mosquito coils,81 conventional tobacco products7 and water pipes.82,83 The source dependence of CO concentrations can also be observed very well in indoor measurements. In the case of the Portuguese schools,84 both outdoor and indoor air concentrations are in the background range. In Athens, the concentrations measured in schools and offices were significantly higher.85 Unusually high concentrations were measured in the Gaza Strip,86 which was mainly due to poor outdoor air quality. In a study of 514 US homes,87 59% of concentrations were less than 6 mg m−3, but in 21% the concentration was higher than the WHO 8 h guideline value of 10 mg m−3 (see next section). The high concentrations in Ghalyun cafés88 and in a motorsport arena89 are also noticeable. In general, elevated CO levels are often observed in sports arenas.90
| Value/range | Comments | Ref. |
|---|---|---|
| a Converted from ppm to mg m−3. | ||
| 0–4.71 mg m−3 | 48 h exposure in 5 European cities (smokers) | 95 |
| 0–11.51 mg m−3 | 48 h exposure in 5 European cities (non-smokers) | 95 |
| 0.2–8 mg m−3 | 1 h mean, 354 offices in Athensa | 85 |
| 0.2–15 mg m−3 | 1 h mean, 328 school classrooms in Athensa | 85 |
| 0.13–26.27 mg m−3 | 36 School classrooms, Gaza Strip, Palestine | 86 |
| 0.11–28.01 mg m−3 | Outdoor air in Gaza Strip, Palestine | 86 |
| 7.0–128.1 mg m−3 | 1 h mean, 68 Ghalyun cafés in Ardabil, Iran | 88 |
| 1.1–7.0 mg m−3 | 68 outdoor locations in Ardabil, Iran | 88 |
| 0.01–1.70 mg m−3 | 73 Portugiese school classrooms during occupation | 84 |
| 0.01–1.30 mg m−3 | 20 Locations in outdoor air, Portugal | 84 |
| ≤6 mg m−3 (59%) | 514 US homesa | 87 and 96 |
| ≥11 mg m−3 (21%) | 514 US homesa | 87 and 96 |
| 0–824 mg m−3 | 24 h mean, 56 kitchen, Mbarara, Ugandaa | 24 |
| 1.7–185.3 mg m−3 | Range, 12 households, Janakpur, Nepala | 97 |
| ≤6–150 mg m−3 | 8 Indoor go-cart facilities, viewer and track area | 89 |
| 30.1 mg m−3 (10 P) | 4 h waterpipe (narghile) smoking sessiona | 98 |
| 74.1 mg m−3 (90 P) | 4 h waterpipe (narghile) smoking sessiona | 98 |
| 0.56–5.11 mg m−3 | 30 min average, 7 wood-burning ovens, 7 private homes | 78 |
| 0.03–280 gCO kg−1 | Mean emission factor, 61 fossil and biofueled cookstoves | 14 |
| 28–170 gCO kg−1 | Emission factor, 44 biofueled cookstoves, field tests | 92 |
| 10–70 gCO kg−1 | Emission factor, 14 biofueled cookstoves, lab tests | 92 |
| 3.6–13.8 mg m−3 | 1 h average, 9 nonvented ethanol fireplaces, chambera | 79 |
| 144–531 mg h−1 | 7 Burning incense, chamber | 99 |
| 150.4–220.0 mg h−1 | 5 Mosquito coils, chamber | 81 |
| 7.2–15.6 mg unit−1 h−1 | Steady-state, 24 scented/unscented candles, chamber | 80 |
A particular problem that continues to primarily affect people in Africa, Asia and South America is carbon monoxide emissions from cookstoves. This leads to very high and regular recurring exposures. The causes have been known for a long time14 but there is obviously still a lack of remedy, as many current publications show.23–25,91 In the study by Nakora et al.,24 56 kitchens in Uganda were examined for 24 h concentrations of carbon monoxide. In only 6 cases were the values below 4 mg m−3, the WHO 24 h guideline value (see next section). Overall, the concentrations were significantly increased, the median was 43 mg m−3. These findings are not really surprising, as biofuel-fired cookstoves can release large amounts of carbon monoxide14,92 (see Table 3).
The compiled results show that for carbon monoxide, both the temporal concentration curves and the maximum concentrations always depend on the respective situation. Other reviews come to similar conclusions.93,94 Consequently, no generally useable, statistically based reference values can be derived. It is therefore advantageous that toxicologically and epidemiologically derived guideline values are available for CO.
7 Indoor air quality guidelines
In 2010, the World Health Organization (WHO)11 published indoor guidelines for selected indoor pollutants including CO. In 2021, the WHO43 adjusted the 24 hours air quality guideline (AQG) level for CO on the basis of a review by Lee et al.,100 the 2010 values for 15 min, 1 hour and 8 hours were adopted (see Table 4). In the same year the German Committee on Indoor Air Guide Values accepted the hygienic guidelines for CO from the WHO.Toyinbo et al.101 published an open database for indoor air guidelines in 2022. The evaluation of this database resulted in 48 entries for national carbon monoxide guideline values. Dimitroulopoulou et al.102 have statistically processed these data. In total, 36 values corresponded to the averaging times of the WHO values (15 min, 1 h 8 h, 24 h), which are also listed in Table 4. The overall range of the 36 data is 3 mg m−3 to 125 mg m−3. The most common averaging time is 8 h (13 values) and the modal value (the value that occurs most often) for the 8 h average is 10 mg m−3, which is in accordance with the WHO guideline. In addition, the modal value of the 15 min also corresponds to the WHO recommendation, while small deviations can be observed for 24 h with a modal value of 8 mg m−3.102
8 Discussion
8.1 The applicability of sensors for indoor air quality monitoring
The determination of all gaseous and particulate components in the room air requires a high measurement effort103 and is unsuitable for daily routine operation. The question therefore arises which parameters make sense from an indoor hygiene and risk management perspective, whether these parameters can be measured reliably and how the information can be processed in a smart control system for air exchange, air quality and heating. It must be noted that different parameters fulfill different tasks. A high CO2 or PM2.5 value is to be interpreted differently than a high CO value (see discussion below). The automatic measurement of air quality parameters in the outside air has been standard for many years. The monitoring stations are connected via a network, which makes the prediction of trends for specific regions possible.104 Such a networked system cannot be established between selected indoor environments for various reasons such as individual differences, data protection, etc. However, the outside air data, if measured close to the building, can be used for the control of indoor climate.35 Classic parameters that have always been measured indoors are temperature and relative humidity. Furthermore, the technical development of sensors has progressed significantly in recent years, which makes the devices interesting for indoor applications.31,34,40,105,106 This is accompanied by the rapid development of powerful regression models and machine learning tools.36,107 In general, the use of air quality sensors is not new. Fire detectors based on particle measurements work reliably and are now installed in many indoor spaces. The measures taken to protect against air pollution and infections caused by airborne viruses, especially in public facilities, have made us aware (albeit far too late) of the need for effective air exchange and showed that this can also be controlled via online measurement of the CO2 concentration.108–110 Sensors are also widely used for air monitoring and controlling in factory farming.111In addition to temperature and humidity, the potentially suitable parameters are carbon dioxide, carbon monoxide, nitrogen oxides (NOx), ozone, particles (especially PM2.5) and TVOC (total volatile organic compounds). The measurement of carbon dioxide and PM2.5 by use of sensors is now possible with good accuracy. Ozone and NOx interfere with each other, which can be partially compensated by careful calibration and machine learning tools. However, the suitability of ozone and NOx sensors in routine operation has not yet been sufficiently tested. A special case is the TVOC sensor. It is not a single substance that is measured, but rather an ensemble of many substances with different composition and properties. Neither MOS nor ECS technology is suitable for TVOC measurement according to the definition of this parameter in ISO 16000-6,112 since the response function always depends on the individual composition of the calibration mixture. Taking into account the very limited informative value of TVOC,113 a photoinization detector (PID) might be used for screening purposes and to visualize trends. However, a TVOC sensor is not suitable for checking compliance with guideline values and should only be used as a supplement.
8.2 Assessing the reliability of CO sensors using Bayesian statistics
It is obvious that using sensors to monitor indoor air quality makes sense. In the case of carbon monoxide, there is the additional aspect that an increased value also means a potential source of danger. In general, however, sensors work less reliably than high quality devices.42 The question therefore arises as to how accurately a sensor can identify a real CO problem in a building. Ott114 has already addressed this problem using Bayesian statistics. Based on a data set with 8573 carbon monoxide measurements (1 hour average), Ott supposed that CO problems occur in approximately 10% of buildings (P{A} = 0.10). This means that no problem will occur in 90% of the buildings (P{Ā} = 0.90). Furthermore, he assumed that a CO sensor correctly indicates that a preset value has been exceeded in 95% of all cases (P{B|A} = 0.95), true positive). In 10% of all cases the sensor gives an alarm when no problem exists (P{B|Ā} = 0.10), false positive). According to Bayes' theorem, the prior conditional probability that a CO problem actually exists can be calculated using eqn (7) and is P{A|B} = 0.5135. A denotes the prior event and B is the posterior event.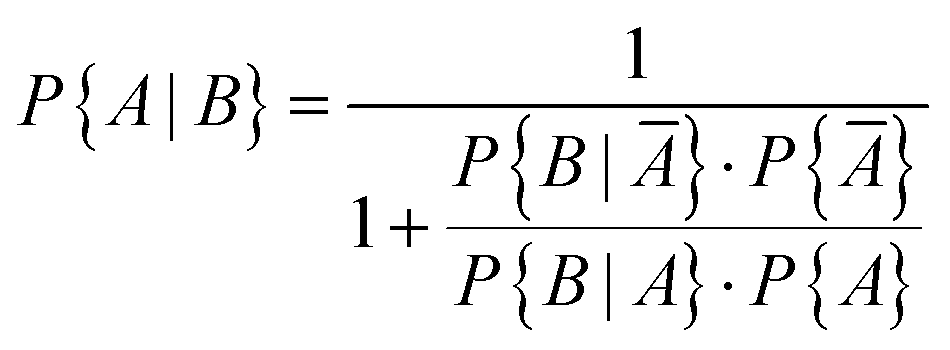 | (7) |
However, it would be a big mistake to only use the statistical risk of P{A} = 0.10 based on one measurement to assess the situation. Carbon monoxide is not released continuously like many other indoor pollutants, but is caused by special, only partially foreseeable circumstances. The individual risk of being exposed to high CO concentrations in waterpipe cafés or when preparing food on a gas stove is significantly increased compared to other scenarios (see Table 3). The problem can be handled in two ways. If the individual risk is known, this can be used instead of the statistical risk to calculate the probability of increased CO pollution. Fig. 5 shows the course of eqn (7) for different sensor responses as a function of P{A}. The effect is particularly large with small probabilities of prior events A. Alternatively, the responses from two or more sensors can be combined. This was also treated mathematically by Ott.114 With the above parameters, the probability that a CO problem exists increases to 0.9093 when using a second sensor with identical response characteristics (see also Fig. 5). When comparing the curves for one and two sensors, the steep rise of the two sensor response is immediately apparent. The advantage is that even with small P{A} values, regardless of whether they are statistically or individually based, there is a high probability that CO pollution is correctly indicated. Provided that the sensors work reliably within the specified error intervals, this technical solution is suitable for both simple alarm detectors and smart systems.
 | ||
| Fig. 5 Course of eqn (7) as a function of P{A} and different sensor characteristics. The designation of the parameters was taken from Ott.114 | ||
8.3 The role of carbon monoxide sensors in IAQ monitoring
The World Health Organization43 has classified carbon monoxide as one of the key pollutants in the indoor environment. Due to the acute toxicity of the substance, four guideline values depending on the duration of exposure were derived (see Table 4). A European Union committee115 also lists carbon monoxide as a high priority chemical. It must be emphasized again that the special problem of carbon monoxide is the silent and often imperceptible fatal poisoning caused by incomplete combustion. Therefore Logue et al.116 state that reducing pollutant exposures from gas cooking burners should be a public health priority. The incomplete combustion of pure hydrocarbons proceeds according to eqn (3). In this reaction only few particles are formed, so that a particle sensor hardly protects against carbon monoxide poisoning. A CO2 sensor is also not helpful here, since carbon dioxide and carbon monoxide are formed in the same molar ratio according to eqn (3) and CO2 sensors give a signal in the concentration range of 800–1000 ppm. At best, a smart CO2 sensor could detect a risk from an unexpectedly rapid increase in carbon dioxide concentration.It is therefore advisable to measure carbon monoxide directly for prevention reasons, especially if there are potential sources or special circumstances that could lead to poisoning. Furthermore, a CO sensor can be valuable for assessing the outdoor air, which might influence the air exchange rate. However, to monitor and control indoor and outdoor air quality, a CO sensor should always be integrated into a network of several sensors. In a smart home,35 under normal circumstances, the parameter CO will only play a minor role as a control variable, but in the event of a dangerous situation, CO can serve to quickly increase the air exchange. The combination of sensors can also make sense for other reasons. Choi et al.117 recommend that fire detectors that rely on particle measurement be additionally equipped with CO sensors in order to reduce the number of false alarms triggered by normal household activities.
In general, multi sensor fusion of indoor air pollutants is an emerging research topic.118,119 The sensor responses are then evaluated in a data management system using suitable algorithms based on indoor air quality guidelines. However, this can lead to complex and error-prone processes. Not only are reliable sensors necessary for the respective measurement variable, there is also the risk of over-parameterization and the use of unsuitable guidelines. It might also be counterproductive to measure more parameters than necessary. The basic variables temperature and humidity are undisputed. Morawska et al.120 state that the two most relevant candidates for routine regulatory IAQ monitoring are the WHO priority parameters PM2.5 and CO. Carbon dioxide is also useful, because it can serve as an indicator of pollutants and pathogens emitted by the occupant, as well as a means of assessing ventilation rates, especially in spaces with high occupancy such as school classrooms.121 Reis et al.37 applied a PM10 sensor to assess indoor air quality in addition to the parameters mentioned. However, it was found that PM10 and PM2.5 are correlated, making PM10 measurement obsolete.
Information about the quality of inexpensive carbon monoxide sensors varies. Liu et al.122 tested a monitor that works on the electrochemical principle and found that the device is robust in terms of accuracy, long-term stability and sensitivity for detecting ambient concentrations. Afshar-Mohajer et al.38 report deviations from linearity at high CO concentrations in another type of electrochemical sensor. In the Tryner et al.40 study of kitchen activity monitoring, the data from a pre-calibrated electrochemical CO sensor were accurate enough to produce the same qualitative conclusions as reference monitors. However, empirical linear calibration models with sensor-specific coefficients were necessary for quantitative results. The review by Sá et al.42 comes to analogous results with regard to the qualitative and quantitative usability of sensor signals. The methods for characterizing the performance of low-cost air quality sensors were studied by Kang et al.41 Their analysis showed that the experimental designs are very different and the results can therefore only be compared to a limited extent. The correlation coefficient is most often used for statistical assessment of sensor data versus reference data and is significantly influenced by environmental settings, reference instruments, and regression models used. From Fig. 6 it is clear that sensors with binary 0/1 responses no longer correspond to the current state of the art. The incoming signal must be interpreted correctly and the outgoing signal must be adapted to the respective situation. Therefore, a smart sensor not only requires reliable calibration, but also the implementation of intelligent algorithms and information on statistical and individual risk.
 | ||
| Fig. 6 Performance of a carbon monoxide sensor for monitoring and assessing indoor air quality. | ||
In summary, the results of the various studies show that carbon monoxide sensors do not achieve the precision of high-end devices that work with non-dispersive infrared or photoacoustic techniques. Nevertheless, the use of such sensors for indoor applications is consistently recommended because their technical quality is usually sufficient for monitoring indoor air and the advantages clearly outweigh the disadvantages. The respective sensor equipment in terms of sensor type, parameters, location and signal processing must be designed for the individual building and use. An office building,118 for example, requires a different IAQ management system than a smart home.35 It is certainly trivial to point out that a CO sensor should not be placed too far away from a potential carbon monoxide source.
9 Conclusion
Carbon monoxide is undoubtedly a priority pollutant and is one of the indoor-related compounds whose exposure can cause massive health problems or even fatal consequences. This is well-known and therefore it is difficult to understand that the indoor monitoring of carbon monoxide has long been underrepresented compared to other pollutants. From an analytical point of view, it is an advantage that carbon monoxide can be measured online and with high precision due to its spectroscopic properties. The disadvantage is that the necessary NDIR and PAS devices are hardly suitable for routine operation. A big step forward was the development of sensor technology, accompanied by powerful regression models and machine learning algorithms. Not only must the sensor be carefully calibrated against carbon monoxide, possible interference must also be taken into account, as well as the number of true and false positive signals and the statistical probability of an increased CO concentration (see Fig. 6). Moreover, different sensor types have different features, so their suitability must be checked beforehand. A problem that has received little attention so far concerns their long-term stability.Today we have the technical means for the assessment of indoor air quality using carbon monoxide sensors and we should use this opportunity consistently, which would certainly significantly reduce the number of involuntary carbon monoxide poisonings. Various alternatives are conceivable for practical implementation. If very high CO concentrations are to be expected, a single alarm monitor may be sufficient. To improve the performance of early fire indicators and to reduce false alarms, CO sensors can be combined with each other or with other sensors.107,117 For the purpose of controlling indoor air quality and energy management in living spaces, CO sensors can be integrated into a smart network.31,35 In addition to the climatic parameters temperature and humidity, such a network should at least include the pollutant parameters CO, PM2.5 and CO2.120
Conflicts of interest
The author has no conflicts of interest to declare.Acknowledgements
I would like to thank Dr Erik Uhde, Fraunhofer WKI, for valuable information on the technical design of air quality sensors and for providing unpublished data from an experiment on the formation of pollutants during the WKI cooking event.References
- W. P. Mason, Fatal poisoning by carbon monoxide, J. Am. Chem. Soc., 1888, 10, 176–178 CrossRef.
- C. P. Hopper, P. N. Zambrana, U. Goebel and J. Wollborn, A brief history of carbon monoxide and its therapeutic origins, Nitric Oxide, 2021, 111–112, 45–63 CrossRef CAS PubMed.
- J. E. Yocom, W. L. Clink and W. A. Cote, Air Quality Relationships, J. Air Pollut. Control Assoc., 1971, 21, 251–259 CrossRef CAS PubMed.
- W. Ott and P. Flachsbart, Measurement of carbon monoxide concentrations in indoor and outdoor locations using personal exposure monitors, Environ. Int., 1982, 8, 295–304 CrossRef CAS.
- B. Brunekreef, H. Smit, K. Biersteker, J. Boleij and E. Lebret, Indoor carbon monoxide pollution in The Netherlands, Environ. Int., 1982, 8, 193–196 CrossRef CAS.
- B. P. Leaderer, Air pollutant emissions from kerosene space heaters, Science, 1982, 218, 1113–1115 CrossRef CAS PubMed.
- J. Girman, M. Apte, G. Traynor, J. Allen and C. Hollowell, Pollutant emission rates from indoor combustion appliances and sidestream cigarette smoke, Environ. Int., 1982, 8, 213–221 CrossRef CAS.
- D. B. Coultas and W. E. Lambert, Indoor Air Pollution, in Carbon Monoxide, ed. Samet, J. M. and Spengler, J. D, The John Hopkins University Press, Baltimore, MD, 1991, ch. 8, pp. 187–208 Search PubMed.
- Indoor Air Quality – A Comprehensive Reference Book, ed. Maroni M., Seifert B. and Lindvall T., Elsevier Science B.V., Amsterdam, 1995 Search PubMed.
- M. L. Burr, Combustion products, in Indoor Air Quality Handbook, ed. J. D. Spengler, J. M. Samet and J. F. McCarthy, McGraw-Hill, New York, 2001, ch. 29, pp. 29.3–29.25 Search PubMed.
- World Health Organization, WHO Guidelines for Indoor Air Quality: Selected Pollutants, WHO Regional Office for Europe: Copenhagen, 2010 Search PubMed.
- J. H. Seinfeld and S. N. Pandis, Atmospheric Chemistry and Physics, John Wiley & Sons Inc., Hoboken, 2016 Search PubMed.
- A. J. Haagen-Smit, Carbon monoxide levels in city driving, Arch. Environ. Health, 1966, 12, 548–551 CrossRef CAS PubMed.
- J. Zhang, K. Smith, R. Uma, Y. Ma, V. Kishore, K. Lata, M. Khalil, R. Rasmussen and S. Thorneloe, Carbon monoxide from cookstoves in developing countries: 1. Emission factors, Chemosphere: Global Change Sci., 1999, 1, 353–366 CrossRef CAS.
- H. Shen, Z. Luo, R. Xiong, X. Liu, L. Zhang, Y. Li, W. Du, Y. Chen, H. Cheng, G. Shen and S. Tao, A critical review of pollutant emission factors from fuel combustion in home stoves, Environ. Int., 2021, 157, 106841 CrossRef CAS PubMed.
- Intergovernmental Panel on Climate Change, Climate Change 2021 – the Physical Science Basis, Cambridge University Press, Cambridge, 2021 Search PubMed.
- U. Krüger, M. Kraenzmer and O. Strindehag, Field studies of the indoor air quality by photoacoustic spectroscopy, Environ. Int., 1995, 21, 791–801 CrossRef.
- Z. Chen, et al., Health effects of exposure to sulfur dioxide, nitrogen dioxide, ozone, and carbon monoxide between 1980 and 2019: A systematic review and meta?analysis, Indoor Air, 2022, 32, e13170 CAS.
- M. E. Moberg, et al., Global, regional, and national mortality due to unintentional carbon monoxide poisoning, 2000–2021: results from the Global Burden of Disease Study 2021, Lancet, 2023, 8, e839–e849 Search PubMed.
- N. B. Hampson, US mortality from carbon monoxide poisoning 1999-2014: Accidental and intentional deaths, Ann. Am. Thorac. Soc., 2016, 13, 1768–1774 Search PubMed.
- J. A. Raub, M. Mathieu-Nolf, N. B. Hampson and S. R. Thom, Carbon monoxide poisoning — a public health perspective, Toxicology, 2000, 145, 1–14 CrossRef CAS PubMed.
- L. Qin, M. Zhai and H. Cheng, Indoor air pollution from the household combustion of coal: Tempo-spatial distribution of gaseous pollutants and semi-quantification of source contribution, Sci. Total Environ., 2023, 882, 163502 CrossRef CAS PubMed.
- C. Ang’u, N. J. Muthama, M. A. Mutuku and M. H. M’IKiugu, Household air pollution and its impact on human health: the case of Vihiga County, Kenya, Air Qual., Atmos. Health, 2022, 15, 2255–2268 CrossRef.
- N. Nakora, D. Byamugisha and G. Birungi, Indoor air quality in rural Southwestern Uganda: particulate matter, heavy metals and carbon monoxide in kitchens using charcoal fuel in Mbarara Municipality, SN Appl. Sci., 2020, 2, 2037 CrossRef CAS.
- E. M. Asefa and M. T. Mergia, Human exposure to indoor air pollution in Ethiopian households, Heliyon, 2022, 8, e11528 CrossRef CAS PubMed.
- J. T. Thurman, R. Leavitt, J. T. Buchanan, J. Shreffler, M. R. Huecker and T. Early, Carbon monoxide levels produced by propane/isobutane canister stoves inside a tent, Wilderness Environ. Med., 2023, 34, 513–516 CrossRef PubMed.
- S. S. Retzky, Carbon monoxide poisoning from hookah smoking: an emerging public health problem, J. Med. Toxicol., 2017, 13, 193–194 CrossRef CAS PubMed.
- L. Eichhorn, D. Michaelis, M. Kemmerer, B. Jüttner and K. Tetzlaff, Carbon monoxide poisoning from waterpipe smoking: a retrospective cohort study, Clin. Toxicol., 2017, 56, 264–272 CrossRef PubMed.
- J. Emsley, Molecules at an Exhibition, Oxford University Press, Oxford, 1998 Search PubMed.
- S. Anderson, Gassed and robbed: An emerging motif?, Contemporary Legend, 2007, New Series, Vol. 10, pp. 52–73 Search PubMed.
- P. Kumar, A. N. Skouloudis, M. Bell, M. Viana, M. C. Carotta, G. Biskos and L. Morawska, Real-time sensors for indoor air monitoring and challenges ahead in deploying them to urban buildings, Sci. Total Environ., 2016, 560–561, 150–159 CrossRef CAS PubMed.
- T. Oyabu, Y. Matsuura and H. Kimura, Identification for gaseous indoor air-pollutants using NDV, Sens. Actuators, B, 1996, 36, 308–311 CrossRef CAS.
- S. Zampolli, I. Elmi, F. Ahmed, M. Passini, G. Cardinali, S. Nicoletti and L. Dori, An electronic nose based on solid state sensor arrays for low-cost indoor air quality monitoring applications, Sens. Actuators, B, 2004, 101, 39–46 CrossRef CAS.
- P. Kumar, C. Martani, L. Morawska, L. Norford, R. Choudhary, M. Bell and M. Leach, Indoor air quality and energy management through real-time sensing in commercial buildings, Energy Build., 2016, 111, 145–153 CrossRef.
- A. Schieweck, E. Uhde, T. Salthammer, L. C. Salthammer, L. Morawska, M. Mazaheri and P. Kumar, Smart homes and the control of indoor air quality, Renewable Sustainable Energy Rev., 2018, 94, 705–718 CrossRef.
- L. Morawska, et al., Applications of low-cost sensing technologies for air quality monitoring and exposure assessment: How far have they gone?, Environ. Int., 2018, 116, 286–299 CrossRef CAS PubMed.
- J. Reis, D. Lopes, D. Graça, A. P. Fernandes, A. I. Miranda and M. Lopes, Using low-cost sensors to assess real-time comfort and air quality patterns in indoor households, Environ. Sci. Pollut. Res., 2022, 30, 7736–7751 CrossRef PubMed.
- N. Afshar-Mohajer, C. Zuidema, S. Sousan, L. Hallett, M. Tatum, A. M. Rule, G. Thomas, T. M. Peters and K. Koehler, Evaluation of low-cost electro-chemical sensors for environmental monitoring of ozone, nitrogen dioxide, and carbon monoxide, J. Occup. Environ. Hyg., 2018, 15, 87–98 CrossRef CAS PubMed.
- Y. Liu, X. Zhu, X. Qin, W. Wang, Y. Hu and D. Yuan, Identification and characterization of odorous volatile organic compounds emitted from wood-based panels, Environ. Monit. Assess., 2020, 192, 348 CrossRef CAS PubMed.
- J. Tryner, M. Phillips, C. Quinn, G. Neymark, A. Wilson, S. H. Jathar, E. Carter and J. Volckens, Design and testing of a low-cost sensor and sampling platform for indoor air quality, Build. Environ., 2021, 206, 108398 CrossRef PubMed.
- Y. Kang, L. Aye, T. D. Ngo and J. Zhou, Performance evaluation of low-cost air quality sensors: A review, Sci. Total Environ., 2022, 818, 151769 CrossRef CAS PubMed.
- J. P. Sá, M. C. M. Alvim-Ferraz, F. G. Martins and S. I. Sousa, Application of the low-cost sensing technology for indoor air quality monitoring: A review, Environ. Technol. Innovation, 2022, 28, 102551 CrossRef.
- World Health Organization, WHO Global Air Quality Guidelines, World Health Organization, Geneva, 2021 Search PubMed.
- P. Kumar, A. Singh, T. Arora, S. Singh and R. Singh, Critical review on emerging health effects associated with the indoor air quality and its sustainable management, Sci. Total Environ., 2023, 872, 162163 CrossRef CAS PubMed.
- M. J. Page, et al., The PRISMA 2020 statement: an updated guideline for reporting systematic reviews, BMJ, 2021, 372, n71 CrossRef PubMed.
- J. R. Rumble, T. J. Bruno and M. J. Doa, Handbook of Chemistry and Physics, CRC Press, Boca Raton, 102st edn, 2021 Search PubMed.
- R. Sander, Compilation of Henry's law constants (version 5.0.0) for water as solvent, Atmos. Chem. Phys., 2023, 23, 10901–12440 CrossRef CAS.
- P. W. Atkins, J. de Paula and J. Keeler, Physical Chemistry, Oxford University Press, Oxford, 2018 Search PubMed.
- L. Pauling, The Nature of the Chemical Bond, Cornell University Press, Ithaca, NY, 1960 Search PubMed.
- J. M. Hollas, Modern Spectroscopy, John Wiley & Sons Ltd, Chichester, 2004 Search PubMed.
- N. Mina-Camilde, I. C. Manzanares and J. F. Caballero, Molecular constants of carbon monoxide at v = 0, 1, 2, and 3: a vibrational spectroscopy experiment in physical chemistry, J. Chem. Educ., 1996, 73, 804–807 CrossRef CAS.
- K. P. Huber and G. Herzberg, Molecular Spectra and Molecular Structure. IV: Constants of Diatomic Molecules, Springer Science+Business Media, New York, NY, 1979 Search PubMed.
- E. P. L. Hunter and S. G. Lias, Evaluated gas phase basicities and proton affinities of molecules: an update, J. Phys. Chem. Ref. Data, 1998, 27, 413–656 CrossRef CAS.
- J. Bierhals, Ullmann's Encyclopedia of Industrial Chemistry, WILEY-VCH, Weinheim, 2001, Vol. 6, pp. 679–693 Search PubMed.
- M. Jitaru, Electrochemical carbon dioxide reduction – fundamental and applied topics, J. Univ. Chem. Technol. Metall., 2007, 42, 333–344 CAS.
- F. A. Cotton, G. Wilkinson, C. A. Murillo and M. Bochmann, Advanced Inorganic Chemistry, John Wiley and John Wiley & Sons Ltd, New York, NY, 1999 Search PubMed.
- D. L. Nelson and M. M. Cox, Lehninger Principles of Biochemistry, W.H. Freeman, New York, 6th edn, 2012 Search PubMed.
- N. B. Hampson, C. A. Piantadosi, S. R. Thom and L. K. Weaver, Practice recommendations in the diagnosis, management, and prevention of carbon monoxide poisoning, Am. J. Respir. Crit. Care Med., 2012, 186, 1095–1101 CrossRef CAS PubMed.
- C. A. Piantadosi, Biological chemistry of carbon monoxide, Antioxid. Redox Signaling, 2002, 4, 259–270 CrossRef CAS PubMed.
- D. S. Sheps, M. C. Herbst, A. L. Hinderliter, K. F. Adams, L. G. Ekelund, J. J. O'Neil, G. M. Goldstein, P. A. Bromberg, J. L. Dalton, M. N. Ballenger, S. M. Davis and G. G. Koch, production of arrhythmias by elevated carboxyhemoglobin in patients with coronary artery disease, Ann. Intern. Med., 1990, 113, 343–351 CrossRef CAS PubMed.
- A. Marenco and J. C. Delaunay, Automated gas chromatographic determination of atmospheric carbon monoxide at the parts-per-billion level, Anal. Chem., 1981, 53, 567–570 CrossRef CAS.
- F. Bruner, Gas Chromatographic Environmental Analysis, VCH Publishers Inc., New York, NY, 1993 Search PubMed.
- B. J. Finlayson-Pitts and J. N. Pitts, Chemistry of the Upper and Lower Atmosphere, Academic Press, San Diego, 2000 Search PubMed.
- H. Chen, A. Karion, C. W. Rella, J. Winderlich, C. Gerbig, A. Filges, T. Newberger, C. Sweeney and P. P. Tans, Accurate measurements of carbon monoxide in humid air using the cavity ring-down spectroscopy (CRDS) technique, Atmos. Meas. Tech., 2013, 6, 1031–1040 CrossRef.
- A. Edtbauer, E. Hartungen, A. Jordan, G. Hanel, J. Herbig, S. Jürschik, M. Lanza, K. Breiev, L. Märk and P. Sulzer, Theory and practical examples of the quantification of CH4, CO, O2, and CO2 with an advanced proton-transfer-reaction/selective-reagent-ionization instrument (PTR/SRI-MS), Int. J. Mass Spectrom., 2014, 365–366, 10–14 CrossRef CAS.
- T.-V. Dinh, I.-Y. Choi, Y.-S. Son and J.-C. Kim, A review on non-dispersive infrared gas sensors: Improvement of sensor detection limit and interference correction, Sens. Actuators, B, 2016, 231, 529–538 CrossRef CAS.
- prEN 14626 Ambient Air – Standard Method for the Measurement of the Concentration of Carbon Monoxide by Non-dispersive Infrared Spectroscopy, European Committee for Standardization, Brussels, 2022 Search PubMed.
- J.-G. Liang, Y. Jiang, J.-K. Wu, C. Wang, S. von Gratowski, X. Gu and L. Pan, Multiplex-gas detection based on non-dispersive infrared technique: A review, Sens. Actuators, A, 2023, 356, 114318 CrossRef CAS.
- K. H. Michaelian, Photoacoustic IR Spectroscopy, WILEY-VCH, Weinheim, 2010 Search PubMed.
- LumaSense Technologies, Gas Detection Limits, Advanced Energy Industries Inc., Denver, CO, 2019 Search PubMed.
- D. Pinto, H. Moser, J. P. Waclawek, S. Dello Russo, P. Patimisco, V. Spagnolo and B. Lendl, Parts-per-billion detection of carbon monoxide: A comparison between quartz-enhanced photoacoustic and photothermal spectroscopy, Photoacoustics, 2021, 22, 100244 CrossRef PubMed.
- A. Zifarelli, R. De Palo, P. Patimisco, M. Giglio, A. Sampaolo, S. Blaser, J. Butet, O. Landry, A. Müller and V. Spagnolo, Multi-gas quartz-enhanced photoacoustic sensor for environmental monitoring exploiting a Vernier effect-based quantum cascade laser, Photoacoustics, 2022, 28, 100401 CrossRef PubMed.
- A. Yasuda, N. Yamaga, K. Doi, T. Fujioka and S. Kusanagi, A planar electrochemical carbon monoxide sensor, J. Electrochem. Soc., 1992, 139, 1091–1095 CrossRef CAS.
- M. Majder-Lopatka, T. Wesierski, A. Dmochowska, Z. Salamonowicz and A. Polanczyk, The influence of hydrogen on the indications of the electrochemical carbon monoxide sensors, Sustainability, 2019, 12, 14 CrossRef.
- E. S. Cross, L. R. Williams, D. K. Lewis, G. R. Magoon, T. B. Onasch, M. L. Kaminsky, D. R. Worsnop and J. T. Jayne, Use of electrochemical sensors for measurement of air pollution: correcting interference response and validating measurements, Atmos. Meas. Tech., 2017, 10, 3575–3588 CrossRef CAS.
- G. F. Fine, L. M. Cavanagh, A. Afonja and R. Binions, Metal oxide semi-conductor gas sensors in environmental monitoring, Sensors, 2010, 10, 5469–5502 CrossRef CAS PubMed.
- G. W. Sachse, G. F. Hill, L. O. Wade and M. G. Perry, Fast?response, high?precision carbon monoxide sensor using a tunable diode laser absorption technique, J. Geophys. Res.: Atmos., 1987, 92, 2071–2081 CrossRef CAS.
- T. Salthammer, T. Schripp, S. Wientzek and M. Wensing, Impact of operating wood-burning fireplace ovens on indoor air quality, Chemosphere, 2014, 103, 205–211 CrossRef CAS PubMed.
- T. Schripp, T. Salthammer, S. Wientzek and M. Wensing, Chamber studies on nonvented decorative fireplaces using liquid or gelled ethanol fuel, Environ. Sci. Technol., 2014, 48, 3583–3590 CrossRef CAS PubMed.
- T. Salthammer, J. Gu, S. Wientzek, R. Harrington and S. Thomann, Measurement and evaluation of gaseous and particulate emissions from burning scented and unscented candles, Environ. Int., 2021, 155, 106590 CrossRef CAS PubMed.
- S. Lee and B. Wang, Characteristics of emissions of air pollutants from mosquito coils and candles burning in a large environmental chamber, Atmos. Environ., 2006, 40, 2128–2138 CrossRef CAS.
- H. Fromme and W. Schober, Waterpipes and e-cigarettes: Impact of alternative smoking techniques on indoor air quality and health, Atmos. Environ., 2015, 106, 429–441 CrossRef CAS.
- J. A. Shearston, J. Eazor, L. Lee, M. J. R. Vilcassim, T. A. Reed, D. Ort, M. Weitzman and T. Gordon, Effects of electronic cigarettes and hookah (waterpipe) use on home air quality, Tob. Control, 2023, 32, 36–41 CrossRef PubMed.
- J. Madureira, I. Paciência, C. Pereira, J. P. Teixeira and E. d. O. Fernandes, Indoor air quality in Portuguese schools: levels and sources of pollutants, Indoor Air, 2016, 26, 526–537 CrossRef CAS PubMed.
- A. Chaloulakou, I. Mavroidis and A. Duci, Indoor and outdoor carbon monoxide concentration relationships at different microenvironments in the Athens area, Chemosphere, 2003, 52, 1007–1019 CrossRef CAS PubMed.
- M. Elbayoumi, N. A. Ramli, N. F. F. Md Yusof and W. A. Madhoun, The effect of seasonal variation on indoor and outdoor carbon monoxide concentrations in Eastern Mediterranean climate, Atmos. Pollut. Res., 2014, 5, 315–324 CrossRef CAS.
- S. Pigg, D. Cautley and P. W. Francisco, Impacts of weatherization on indoor air quality: A field study of 514 homes, Indoor Air, 2018, 28, 307–317 CrossRef CAS PubMed.
- M. Fazlzadeh, R. Rostami, S. Hazrati and A. Rastgu, Concentrations of carbon monoxide in indoor and outdoor air of Ghalyun cafes, Atmos. Pollut. Res., 2015, 6, 550–555 CrossRef CAS.
- J. Wolf, K. Berlin, L. Fembacher, D. Heitmann, W. Matzen, L. Nitschke, M. Sysoltseva and H. Fromme, Air quality in indoor go-kart facilities in Germany, Indoor Air, 2018, 28, 950–962 CrossRef CAS PubMed.
- H. Salonen, T. Salthammer and L. Morawska, Human exposure to air contaminants in sports environments, Indoor Air, 2020, 30, 1109–1129 CrossRef CAS PubMed.
- M. Fandino-Del-Rio, J. L. Kephart, K. N. Williams, T. Shade, T. Adekunle, K. Steenland, L. P. Naeher, L. H. Moulton, G. F. Gonzales, M. Chiang, S. Hossen, R. T. Chartier, K. Koehler and W. Checkley, Household air pollution concentrations after liquefied petroleum gas interventions in rural Peru: findings from a one-year randomized controlled trial followed by a one-year pragmatic crossover trial, Environ. Health Perspect., 2022, 130 Search PubMed.
- C. A. Roden, T. C. Bond, S. Conway, A. B. Osorto Pinel, N. MacCarty and D. Still, Laboratory and field investigations of particulate and carbon monoxide emissions from traditional and improved cookstoves, Atmos. Environ., 2009, 43, 1170–1181 CrossRef CAS.
- Y. Zhang; P. K. Hopke and C. Mandin, Handbook of Indoor Air Quality, Springer Nature, Singapore, 2022 Search PubMed.
- H. Fromme, Indoor Air Quality, Springer Nature, Cham, 2023 Search PubMed.
- L. Georgoulis, O. Hänninen, E. Samoli, K. Katsouyanni, N. Künzli, L. Polanska, Y. Bruinen de Bruin, S. Alm and M. Jantunen, Personal carbon monoxide exposure in five European cities and its determinants, Atmos. Environ., 2002, 36, 963–974 CrossRef CAS.
- P. W. Francisco, S. Pigg, D. Cautley, W. B. Rose, D. E. Jacobs and S. Cali, Carbon monoxide measurements in homes, Sci. Technol. Built Environ., 2018, 24, 118–123 CrossRef.
- S. Bartington, I. Bakolis, D. Devakumar, O. Kurmi, J. Gulliver, G. Chaube, D. Manandhar, N. Saville, A. Costello, D. Osrin, A. Hansell and J. Ayres, Patterns of domestic exposure to carbon monoxide and particulate matter in households using biomass fuel in Janakpur, Nepal, Environ. Pollut., 2017, 220, 38–45 CrossRef CAS PubMed.
- H. Fromme, S. Dietrich, D. Heitmann, H. Dressel, J. Diemer, T. Schulz, R. A. Jörres, K. Berlin and W. Völkel, Indoor air contamination during a waterpipe (narghile) smoking session, Food Chem. Toxicol., 2009, 47, 1636–1641 CrossRef CAS PubMed.
- J. J. Jetter, Z. Guo, J. A. McBrian and M. R. Flynn, Characterization of emissions from burning incense, Sci. Total Environ., 2002, 295, 51–67 CrossRef CAS PubMed.
- K. K. Lee, N. Spath, M. R. Miller, N. L. Mills and A. S. Shah, Short-term exposure to carbon monoxide and myocardial infarction: A systematic review and meta-analysis, Environ. Int., 2020, 143, 105901 CrossRef CAS PubMed.
- O. Toyinbo, L. Hägerhed, S. Dimitroulopoulou, M. Dudzinska, S. Emmerich, D. Hemming, J.-H. Park and U. Haverinen-Shaughnessy, Open database for international and national indoor environmental quality guidelines, Indoor Air, 2022, 32, e13028 CrossRef PubMed.
- S. Dimitroulopoulou, M. R. Dudzińska, L. Gunnarsen, L. Hägerhed, H. Maula, R. Singh, O. Toyinbo and U. Haverinen-Shaughnessy, Indoor air quality guidelines from across the world: An appraisal considering energy saving, health, productivity, and comfort, Environ. Int., 2023, 178, 108127 CrossRef CAS PubMed.
- T. Salthammer, Y. Zhang, J. Mo, H. M. Koch and C. J. Weschler, Assessing human exposure to organic pollutants in the indoor environment, Angew. Chem., Int. Ed., 2018, 57, 12228–12263 CrossRef CAS PubMed.
- P. Sicard, E. Agathokleous, S. C. Anenberg, A. De Marco, E. Paoletti and V. Calatayud, Trends in urban air pollution over the last two decades: A global perspective, Sci. Total Environ., 2023, 858, 160064 CrossRef CAS PubMed.
- A. Baldelli, Evaluation of a low-cost multi-channel monitor for indoor air quality through a novel, low-cost, and reproducible platform, Meas.: Sens., 2021, 17, 100059 Search PubMed.
- H. Fritz, et al., Design, fabrication, and calibration of the Building EnVironment and Occupancy (BEVO) Beacon: A rapidly-deployable and affordable indoor environmental quality monitor, Build. Environ., 2022, 222, 109432 CrossRef.
- P. Vorwerk, J. Kelleter, S. Müller and U. Krause, Distance-based analysis of early fire indicators on a new indoor laboratory dataset with distributed multi-sensor nodes, Fire, 2023, 6, 323 CrossRef.
- S. N. Rudnick and D. K. Milton, Risk of indoor airborne infection transmission estimated from carbon dioxide concentration: Indoor airborne transmission of infectious diseases, Indoor Air, 2003, 13, 237–245 CrossRef CAS PubMed.
- L. Stabile, A. Pacitto, A. Mikszewski, L. Morawska and G. Buonanno, Ventilation procedures to minimize the airborne transmission of viruses in classrooms, Build. Environ., 2021, 202, 108042 CrossRef CAS PubMed.
- T. Salthammer, C. Fauck, A. Omelan, S. Wientzek and E. Uhde, Time and spatially resolved tracking of the air quality in local public transport, Sci. Rep., 2022, 12, 3262 CrossRef CAS PubMed.
- M. H. Lashari, S. Karim, M. Alhussein, A. A. Hoshu, K. Aurangzeb and M. S. Anwar, Internet of Things-based sustainable environment management for large indoor facilities, PeerJ Comput. Sci., 2023, 9, e1623 CrossRef PubMed.
- ISO 16000-6, Indoor Air – Part 6: Determination of Organic Compounds (VVOC, VOC, SVOC) in Indoor and Test Chamber Air by Active Sampling on Sorbent Tubes, Thermal Desorption and Gas Chromatography Using MS or MS FID, International Organization for Standardization, Geneva, 2021 Search PubMed.
- T. Salthammer, TVOC – revisited, Environ. Int., 2022, 167, 107440 CrossRef CAS PubMed.
- W. R. Ott, Environmental Statistics and Data Analysis, Lewis Publishers, Boca Raton, 1995 Search PubMed.
- K. Koistinen, D. Kotzias, S. Kephalopoulos, C. Schlitt, P. Carrer, M. Jantunen, S. Kirchner, J. McLaughlin, L. Molhave, E. O. Fernandes and B. Seifert, The INDEX project: executive summary of a European Union project on indoor air pollutants, Allergy, 2008, 63, 810–819 CrossRef CAS PubMed.
- J. M. Logue, N. E. Klepeis, A. B. Lobscheid and B. C. Singer, Pollutant exposures from natural gas cooking burners: a simulation-based assessment for Southern California, Environ. Health Perspect., 2014, 122, 43–50 CrossRef PubMed.
- H.-b. Choi, E.-h. Hwang and D.-m. Choi, Indoor air quality sensor utilization for unwanted fire alarm improvement in studio-type apartments, Fire, 2023, 6, 255 CrossRef.
- Q. P. Ha, S. Metia and M. D. Phung, Sensing data fusion for enhanced indoor air quality monitoring, IEEE Sens. J., 2020, 20, 4430–4441 Search PubMed.
- A. N. Hikmah and C. B. D. Kuncoro, Sensor fusion with seven parameters for indoor air quality monitoring system, International Conference on Electrical Engineering, Computer Science and Informatics (EECSI), Palembang, 2023, pp. 110–115 Search PubMed.
- L. Morawska, et al., Indoor air quality standards in public buildings, Science, 2024 DOI:10.1126/science.adl0677.
- T. Salthammer, E. Uhde, T. Schripp, A. Schieweck, L. Morawska, M. Mazaheri, S. Clifford, C. He, G. Buonanno, X. Querol, M. Viana and P. Kumar, Children's well-being at schools: Impact of climatic conditions and air pollution, Environ. Int., 2016, 94, 196–210 CrossRef CAS PubMed.
- X. Liu, R. Jayaratne, P. Thai, T. Kuhn, I. Zing, B. Christensen, R. Lamont, M. Dunbabin, S. Zhu, J. Gao, D. Wainwright, D. Neale, R. Kan, J. Kirkwood and L. Morawska, Low-cost sensors as an alternative for long-term air quality monitoring, Environ. Res., 2020, 185, 109438 CrossRef CAS PubMed.
| This journal is © The Royal Society of Chemistry 2024 |