 Open Access Article
Unveiling the inhibitory mechanism of aureusidin targeting xanthine oxidase by multi-spectroscopic methods and molecular simulations
Pei He ,
Haiqi Xu,
Can Yang,
Dehong Yu,
Yi Liu,
Jiana Du and
Yanfang Li
 *
*
School of Chemical Engineering, Sichuan University, Chengdu, 610065, China. E-mail: lyf471@vip.163.com; Tel: +86 28 8540 5220
First published on 9th January 2023
Abstract
Xanthine oxidase (XO) is a key target for gout treatment. Great efforts have been made towards the discovery and development of new XO inhibitors. Aureusidin (AUR), a natural compound, emerges as the second reported XO inhibitor with an aurone skeleton with an IC50 value of 7.617 ± 0.401 μM in vitro. The inhibitory mechanism of AUR against XO was explored through enzyme kinetic studies, multi-spectroscopic methods, computer simulation techniques, and ADME prediction. The results showed that AUR acts as a rapid reversible and mixed-type XO inhibitor and its binding to XO was driven by hydrogen bonding and hydrophobic interaction. Moreover, AUR presented a strong fluorescence quenching effect through a static quenching process and induced a conformation change of XO. Its binding pattern with XO was revealed through molecular docking, and its affinity toward XO was enhanced through interactions with key amino acid residues in the active pocket of XO. Further, AUR demonstrated good stability and pharmacokinetic behavior properties in molecular dynamics simulation and ADME prediction. In short, the current work clarified in depth the inhibitory mechanism of AUR on XO firstly and then provided fresh insights into its further development as a natural potent XO inhibitor with aurone skeleton.
1 Introduction
Hyperuricemia is an abnormal metabolic syndrome caused by human purine metabolism disorder. Persistent hyperuricemia is the basis for the development of chronic gout. According to the statistics of modern epidemiology, with the development of society and the change of dietary structure, the prevalence and incidence rate of hyperuricemia and gout are increasing worldwide.1Xanthine oxidase (XO, EC1.1.3.22) is a versatile metalloflavoprotein enzyme, which is widely distributed within various mammals' tissues.2 As a key oxidase involved in purine metabolism, it catalyzes the oxidation of hypoxanthine to xanthine and then to uric acid. Noticeably, its over-catalysis is a potential factor contributing to elevated serum uric acid level. The overproduction or low excretion of urate can lead to hyperuricemia and subsequently to gout.3,4 This makes XO a key target for the treatment of Hyperuricemia and gout.5
Currently, three drugs (allopurinol, febuxostat, and topiroxostat) targeting XO inhibition have been approve and widely used for the treatment of hyperuricemia and gout through reducing the level of uric acid. However, in certain cases, some side effects, including fever, allergic rash, diarrhea, abdominal pain, bone marrow suppression, and even hepatotoxicity, nephrotoxicity and Stevens–Johnson syndrome, cannot be ignored.6–8 Therefore, alternative XO inhibitors with lower toxicity and better clinical efficacy are an urgent-need.
Compared with synthetic compounds, plants derived inhibitors possess higher structural diversity and lower toxicity. In this regard, many research groups have focused on naturally-occurring compounds from plants as potential sources of new and effective XO inhibitors. Consequently, some natural XO inhibitors have been reported, including flavonoids, glycosides, terpenes and phenylpropanoids, etc.9,10 As biologically and pharmacologically diversely polyphenols, flavonoids presented attractive XO inhibitory potency and become the most studied and reported natural XO inhibitors.11,12 Zhao et al. investigated the structure–activity relationship and interaction mechanism of flavonoids and XO, their work revealed the patterns of hydroxyl and methoxyl groups on aryl ring A and B of flavonoids were closely associated with their bioactivity and binding affinity on XO protein. Especially, hydroxyl groups substituted at C5 and C4′ of flavonoid are requirement of maintaining the high inhibition.16 Interestingly, some flavonoids displayed good alleviates hyperuricemia effect in vivo.10,13
In 1996, a natural aurone sulfuretin was isolated from heartwood of Rhus verniciflua and showed micromolar inhibitory activity against XO.14 Structurely, aurones are a benzofuranone heterocyclic ring containing a phenyl group linked through a carbon–carbon exocyclic double bond, which belong to a minor class of heterocyclic secondary metabolites belonging to the flavonoids family.15 Noteworthy, its high stability, simplicity and excellent drug-likeness scores, render aurones an interesting source of potential leads. Based on the skeleton of sulfuretin, a number of A- and B-ring carboxylated aurone derivatives were synthesized and evaluated for their ability to inhibit XO in vitro.24 However, no more information rather than IC50 value can be obtained. Compare with sulfuretin, another naturally occurring aurone aureusidin possess one more hydroxyl group substituted at C5 position. Consider the similarities of aurone and flavonoids in skeleton, further based on the finding of Zhao et al., we suppose aureusidin may present similar or higher inhibitory activity against XO. The result of inhibition assay (IC50 = 7.617 ± 0.401 μM) confirmed our suspicion, which means that aureusidin emerges as the second nature XO inhibitor with aurone skeleton.
For potent enzyme inhibitor, it is of great important to investigate of its inhibitory mechanism and binding mode with protein, which would provide valuable information for the further optimization and therapeutic application of small molecule ligand, thus accelerate the development of drug candidate. To the best of our knowledge, no systematical study on the inhibition mechanism of aurones on XO had been reported. In this regard, in current study, an integrated multi-spectroscopic investigation, combined with molecular docking and simulation techniques were used to explore enzyme kinetics of AUR on XO, as well as the influence of AUR on the activity and structure of enzyme in vitro, so as to further reveal the inhibition mechanism of AUR against XO protein. The integration of these methods will provide new insights for understanding the theoretical basis of activity screening and structural modification of natural XO inhibitors.
2 Materials and methods
2.1 Chemical and reagents
XO (isolated from bovine milk) supplied by Sigma-Aldrich (6 U mg−1, batch number P2332145) and Xanthine (purity > 98%, Cat. No. X104264) purchased from Shanghai Aladdin Bio-Chem Technology Co., Ltd (Shanghai, China) were prepared as stock solution with 50 mmol L−1 PBS (pH 7.4), and both of them were prepared freshly before use. Aureusidin (AUR, purity > 95%) and allopurinol were purchased from Shanghai Yuanye Biotechnology Co., Ltd (Shanghai, China). ANS (8-anilino-1-naphthalenesulfonic acid ammonium salt, purity > 95%) was obtained from TCI (TCI, Shanghai). The stock solution of AUR (20 mmol L−1) was prepared in DMSO for all experiments and the final concentrations of DMSO were kept below 1%. All stock solutions were stored at 4 °C for further use. All other reagents were analytical grade and the water used was ultra-pure water.2.2 Apparatus
The EnSpire Enzyme Marker (Thermos Fisher, USA) was used in enzyme kinetic assay and molecular fluorescence variable temperature experiment. 3D fluorescence spectra were recorded by RF-6000 fluorescence spectrometer (SHIMADZU, Japan). The infrared spectra were collected by a Nicolet-6700 Fourier infrared spectrometer (Thermo, USA).2.3 XO inhibition assays
The inhibition assay against XO was performed according to the previous method with minor modifications.16 In brief, in 200 μL reaction system, the fixed concentration of XO (50 μL, 0.025 U mL−1) and various concentrations of AUR (100 μL) were incubated at 37 °C for 30 minutes. Subsequently, the assay was initiated with the addition of substrate xanthine (50 μL, 0.5 mM). The absorbance of the mixture was measured at 295 nm every 15 second for 5 minutes. The half maximum inhibitory concentration (IC50) values were calculated by GraphPad Prism 8.0 (GraphPad Software, Inc., San Diego, CA, USA). The measurement was performed three times, and the result was expressed as means ± standard deviations. ANOVA and Duncan's multiple range tests were carried out. Differences with P < 0.05 were considered significant. The inhibition ratio is calculated by eqn (1).17
 | (1) |
2.4 Kinetic studies
Inhibition reversibility was determined by maintaining the concentration of xanthine (0.25 mM), five concentrations of XO (from 0.03 to 0.15 U mL−1) were adapted for the test in combination with four concentrations of AUR (0–30 μM). Then inhibition reversibility of AUR against XO was concluded by plotting the reaction velocity and enzyme concentration. In addition, the inhibition type was investigated by maintaining concentration of XO (0.025 U mL−1) and selecting xanthine concentrations (from 0.0625 to 0.1875 mM). The reaction velocity was measured by adding varied concentrations of AUR (from 0 to 30 μM) and the inhibition type was analyzed by Lineweaver–Burk plot and described by the following equations:18
 | (2) |
 | (3) |
 | (4) |
2.5 Fluorescence titrations
Fluorescence titrations at three different temperatures (298, 304, and 310 K) were carried out on the enzyme marker with 96-well plate, and the excitation and emission wavelengths were set at 280 nm and 300–500 nm, respectively, meanwhile the slit width was set at 5.0 nm. All test samples contained a fixed XO concentration of 0.16 U mL−1 and AUR concentrations ranging from 0 to 26.7 μM. Considering AUR itself has fluorescence, a separate control was set at each concentration. All mixtures were balanced for 30 minutes before measurement. The PBS solution corresponds to a suitable blank to correct the background fluorescence intensity.20
 | (5) |
 | (6) |
2.6 ANS-binding fluorescence probe experiment
ANS (100 μL, 20 μM) and XO (50 μL, 0.22 U mL−1) were mixed in 96-well plate and incubated at 298 K for 1 hour, then AUR solution (50 μL) with different concentrations was added into the mixture in sequence and measured after 30 minutes of stewing, with 3 wells set up for each concentration. The excitation wavelength was set at 380 nm, while the scanning emission wavelength range was 400–650 nm, and the slit width was set at 5 nm.2.7 Three-dimensional fluorescence spectroscopy
3D fluorescence spectra of free XO (0.1 U mL−1) and XO–AUR complex (the concentration of AUR was 100 μM) were scanned at room temperature. The excitation and emission wavelengths range were set to 200–400 nm and 200–440 nm, respectively. While the excitation and emission slit were set at 5 nm and 10 nm, respectively. The wavelength increments were both 5 nm.2.8 Fourier translation infrared spectroscopy
FT-IR spectra of XO and XO–AUR complex were collected at a resolution of 4 cm−1 within the frequency range of 1800–1400 cm−1. Average spectrum after 128 scans was coadded and Fourier transformed. The concentration of XO was 0.5 U mL−1 and AUR was 200 μM. All IR spectra were net of background and measured at room temperature.2.9 Docking studies
In order to explain the higher potential of AUR and its binding mode in the active site of XO, molecular docking was performed using the Glide module of Schrödinger (Schrödinger LLC, NY, USA). The X-ray crystal structure of XO (Protein Data Bank ID: 3NVY) was retrieved from the RCSB Protein Data Bank (http://www.rcsb.org/pdb). The 3D structure of AUR was built in maestro building window. The complex structure of XO was prepared by preserving the conformation of a protein according to the preparation guidelines of the protein master, including supplementing incomplete residues, adding hydrogen, and keeping the active site ligand only. The pH value of protein and AUR were set as the default values (7.0 ± 2.0). Then, Receptor Grid Generation module was utilized to define the active/binding site of protein through corresponding co-crystallized ligand, it was excluded from grid generation. The redocking of cognate ligand was performed to evaluate the reliability of the docking model and the RMSD value was 1.95 A (<2 Å), which means the docking model is credible. Other parameters were set at default values in Schrödinger.2.10 Molecular dynamics simulation
Molecular dynamics (MD) can calculate the long- and short-range interactions between ligand and protein as well as the interaction energy and conformational changes so as to obtain more accurate calculation results. In general, MD simulated trajectories could provide some important information, such as root mean square deviations and fluctuations (RMSD/RMSF), hydrogen bonding distance measurements, and GROMACS energies, to evaluate the stability of complex. Therefore, to further understand the action mode of AUR in the biological environment as well as to test the stability of XO–AUR complex, MD simulation was carried out on GROMACS 2019.5.22Firstly, at the end of molecular docking, the target molecule was separated from the protein complex in Schrödinger software, and then the molecule and protein structures were saved as .pdb files respectively, which were the initial structures for further MD simulations. Then, GROMACS with a GROMOS96 force field was used to generate protein topology. Meanwhile, ligand topology was obtained from ATB site https://atb.uq.edu.au/index.py. To maintain periodic boundary conditions, during MD simulation process using cubic cells, the minimum distance between protein atoms and cell wall was set to 1 Å. The design of box size followed the standard that the distance between protein atoms and wall was greater than 1 nm to maintain periodic boundary conditions,23 and a simple point charge solvent model (SPC) 216 was applied to solvate the system (the type of solvent is water). Generally, the simulation system was balanced by adding counterions such as Cl− or Na+ to achieve a physiologically neutral state, so 171 Na+ and 168 Cl− were added in current simulation. The system energy was minimized to eliminate spatial conflicts, indexing and modifying mdp files for the thermal coupling group and subsequent location restrictions. During the simulation, the Berendsen coupling algorithm was used to keep the temperature and pressure of each component constant. The Particle Mesh Ewald (PME) method was employed to compute the long-range coulombic and Lennard-Jones interaction energies of protein–ligand interactions and ligand dynamics. Different modules in the GROMACS software package were applied to analyze the results of MD simulation to obtain RMSD, RMSF, H-bond and GROMACS energy.
2.11 ADME prediction
Considering the ADME properties of drug candidate is quite important, so, the QikProp module (Schrödinger) was adapted for ADME prediction of AUR in silico. Various properties of AUR as well as febuxostat, quercetin were obtained, such as partition coefficient (QPlogp octanol/water), water solubility, percentage of human oral absorption, and hydrogen bond donor/acceptor. It is worth noting that molecular preprocessing of AUR using the Ligprep module was required before performing QikProp calculations.3 Results and discussion
3.1 Inhibition activity and kinetic study
The results of in vitro inhibition experiments showed that AUR had an efficient inhibitory effect against XO (IC50 = 7.617 ± 0.401 μM). Which was greater than that of positive control allopurinol (IC50 = 4.482 ± 0.165 μM). As shown in Fig. 1, the XO inhibition continued to increase with the increase of AUR concentration, indicating that AUR could significantly inhibit the XO activity in a concentration-dependent manner. Moreover, at a certain concentration, the XO inhibition tended to reach a maximum value, later increasing the AUR concentration also did not have a large effect on the XO inhibitory activity.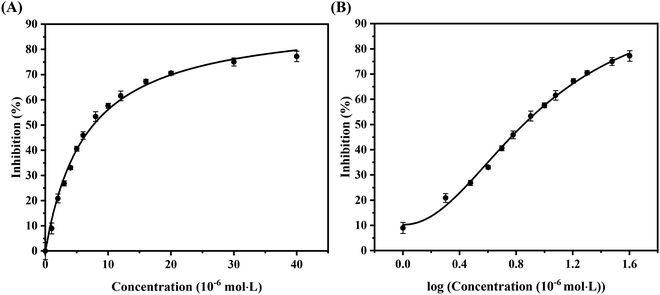 | ||
| Fig. 1 (A) Inhibitory rate of AUR on XO. (B) The horizontal axis is the logarithm of the concentration of the AUR (n = 3). | ||
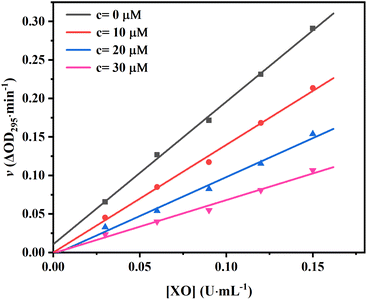
To confirm the reversibility of AUR against XO, the kinetic curves of v versus [XO] at different AUR concentrations were plotted. As shown in Fig. 2, all straight lines crossed the origin and the slope of the line tended to decrease with the increase of AUR concentration from 0 μM to 30 μM, indicating that the inhibition of XO by AUR was reversible. Zhang et al. found that the IC50 values for quercetin was 2.74 ± 0.04 μM.18 Muzychka et al. reported that sulfuretin, as the first natural XO inhibitor with aurone skeleton, showed micromolar inhibitory activity against XO (IC50 = 3.10 ± 0.38 μM).24 The result confirmed that AUR has similar inhibitory effect on XO, like other plants derived flavonoids, which could be used as effective XO inhibitor to further treat hyperuricemia and gout.
To further identify the inhibition type of AUR on XO, a double reciprocal Lineweaver–Burk plot was drawn according to eqn (2). As shown in Fig. 3, four lines intersected in the second quadrant with Km and Km/Vmax increased but Vmax decreased, which revealed that AUR acts as a mixed-type (competitive and noncompetitive) XO inhibitor, same as quercetin (the flavonoid).18 The ratio (α) of uncompetitive inhibition constant (Kis) to competitive inhibition constant (Ki) was calculated to be 0.31 (Kis vs. Ki = 0.56 vs. 1.80 μM), which suggested that Kis value was smaller (2 fold) than corresponding Ki value, indicating that AUR tended to easily and firmly bind to XO–xanthine complex rather than free XO. In addition, the secondary plots of the slope and Y-intercept vs. [AUR] (Fig. 3 inset) were all linearly fitted, which illustrated that AUR only had one single or one class of binding site on XO.
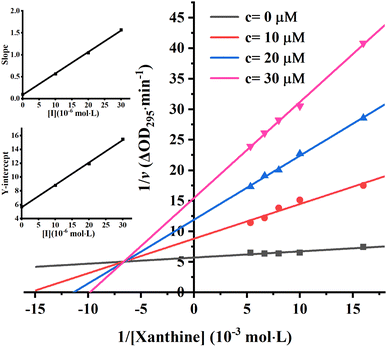 | ||
| Fig. 3 Lineweaver–Burk plots. c(XO) = 0.025 U mL−1, c(AUR) = 0, 10, 20 and 30 μM; the secondary plot represented slope and Y-intercept vs. [AUR] in the inset, respectively. | ||
3.2 Fluorescence quenching mechanism
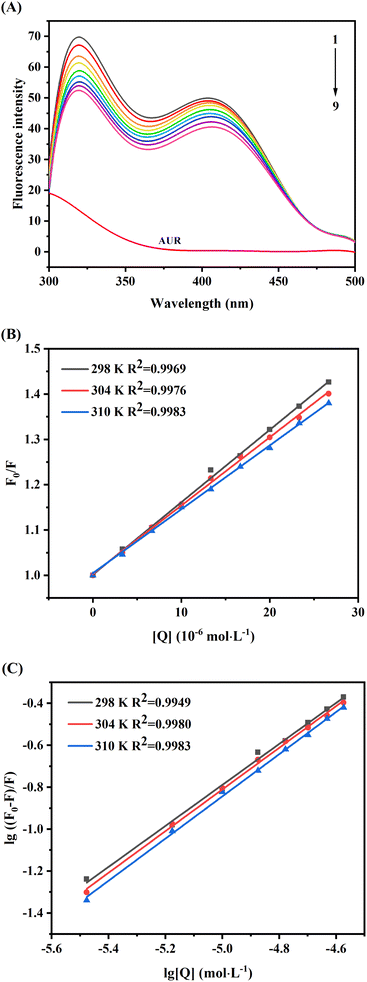
Due to its convenience, sensitivity and reliability, fluorescence spectroscopy is commonly used to investigate the ligand protein binding. The intrinsic fluorescence of proteins is due to the aromatic amino acids tryptophan (Trp), tyrosine (Tyr) and phenylalanine (Phe), among which, amino acid Trp has more contributions than Tyr and Phe.25 Changes in the microenvironment near these aromatic amino acids lead to changes in the fluorescence spectrum and may also cause shift in the maximum emission wavelength. Based on this principle, the affinity of ligand with XO can be analyzed by fluorescence spectroscopy, which can provide information about binding mechanism, constant (Ka) and site (n).26As shown in Fig. 4A, two obvious fluorescence emission peaks of XO can be observed at 340 nm and 410 nm, and the intrinsic fluorescence intensity of AUR (labeled as curve m) was weak. And the fluorescence intensity of XO (curves from 1 to 9) was decreased remarkably with increasing the concentration of AUR and the maximum emission peak wavelength did not change significantly, which indicated that AUR could effectively quench the intrinsic fluorescence of XO. As shown in Fig. 4B, the curves of F0/F and [Q] at three temperatures (298, 304, and 310 K) exhibit high linearity, indicating that only one type of quenching process, i.e., static quenching or dynamic quenching, has occurred.
According to the Stern–Volmer eqn (5), the plots of F0/F versus [Q] at three temperatures (298, 304, and 310 K) were depicted in Fig. 4B. As shown in Table 1, the quenching constant (Ksv) decreased with the increasing temperature, and the bimolecular quenching constant (Kq) were greater than the maximum diffusion collision quenching rate constant (2.0 × 10¹⁰ L mol−1 s−1),27 indicating that the fluorescence quenching mechanism of XO caused by AUR was likely a static quenching process.
| T | lg![[thin space (1/6-em)]](https://www.rsc.org/images/entities/char_2009.gif) K K |
Ksv (×104 L mol−1) | Ra | K (×104 L mol−1) | Rb | n | ΔH (kJ mol−1) | ΔS (J mol−1 K−1) | ΔG (kJ mol−1) |
|---|---|---|---|---|---|---|---|---|---|
| a Ra and Rb are the correlation coefficients of quenching constant Ksv and binding constant K, respectively. | |||||||||
| 298 K | 4.096 | 1.619 | 0.999 | 1.247 | 0.998 | 0.977 | 12.97 | 121.95 | −36.33 |
| 304 K | 4.155 | 1.545 | 0.999 | 1.429 | 0.999 | 0.993 | −37.06 | ||
| 310 K | 4.184 | 1.437 | 0.999 | 1.528 | 0.999 | 1.006 | −37.79 | ||
It was assumed that molecules bind independently onto a set of equivalent sites on a macromolecule. The binding constant K and binding site n can be calculated from the modified Stern–Volmer eqn (6), and the calculated results were summarized in Table 1. With the change of temperature from 298 to 310 K, the K values were gradually augmented, indicating that increased temperature was helpful to improve the stability of AUR–XO complex. The number of binding sites n was close to 1 at different temperatures, suggesting that AUR had one single or one class of binding site on XO, which was consistent with the result of Lineweaver–Burk analysis.
Thermodynamic parameters calculating of AUR–XO complex can further provide the potential interaction forces, such as hydrophobic interaction, van der Waals force, electrostatic force, and hydrogen bond. The enthalpy change (ΔH), entropy change (ΔS), and Gibbs free energy change (ΔG) of AUR–XO system at different temperatures were calculated by Van Twofer eqn (7) and Gibbs–Helmholtz eqn (8). Then, the main binding force was determined according to the positive/negative values of corresponding parameters.21 As exhibited in Table 1, ΔH > 0, ΔS > 0, demonstrating that the binding process was driven by hydrophobic force, and the negative value of ΔG indicated the binding process of AUR and XO was spontaneous.
 | (7) |
| ΔG = ΔH − TΔS | (8) |
Furthermore, as displayed in Table 1, ΔH > 0, ΔS > 0, demonstrating that the hydrophobic force was dominant in the combination process of this system, and the increase of temperature was helpful to improve the stability of the complex. The negative value of ΔG indicated the binding process of AUR and XO was spontaneous.
3.3 ANS-binding fluorescence probe experiment
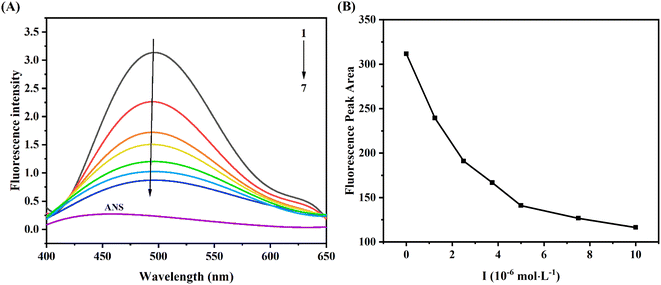
ANS, as a comprehensive fluorescent probe, was used to explore the change of hydrophobic tendency of protein.28 As seen from Fig. 5A, the fluorescence intensity of ANS was weak, when it bound to XO, the fluorescence intensity was significantly enhanced (curve 1). Moreover, with the increase of AUR concentration, the fluorescence intensity of ANS–XO complex decreased significantly accompanied by a slight blue shift, which might be due to the competition between AUR and ANS of occupying the hydrophobic cavity of XO. With the increase of AUR concentration, this hydrophobic cavity was occupied more by AUR, which prevented ANS from entering the hydrophobic cavity of enzyme and reduced the fluorescence of ANS–XO complex.In addition, the fluorescence peak area consistently decreased with the addition of AUR (Fig. 5B), which indicated that AUR would continue to occupy the hydrophobic region of XO under unsaturated concentration. Usually, the changes of the hydrophobic surface are not only associated with conformational changes of the active site of protein, but also related to the conformational change of whole enzyme. Thus, the above results provided some evidence for AUR mediated conformational state of XO.
3.4 Conformational changes of XO upon addition of AUR
![[double bond, length as m-dash]](https://www.rsc.org/images/entities/char_e001.gif) O stretching vibrations in the range of 1600–1700 cm−1; α-helical structure in the range of 1645–1660 cm−1; β-folded structure in the range of 1615–1640 cm−1; β-turns in the range of 1660–1700 cm−1; random structure in the range of 1640–1650 cm−1. Since FT-IR is less sensitive to liquids than to solids, the protein secondary structure information was obtained by split-peak fitting of the spectra results by origin software.31–33
O stretching vibrations in the range of 1600–1700 cm−1; α-helical structure in the range of 1645–1660 cm−1; β-folded structure in the range of 1615–1640 cm−1; β-turns in the range of 1660–1700 cm−1; random structure in the range of 1640–1650 cm−1. Since FT-IR is less sensitive to liquids than to solids, the protein secondary structure information was obtained by split-peak fitting of the spectra results by origin software.31–33As shown in Fig. 7, the peak positions shifted and the absorbance changed after the addition of AUR, indicating that the binding of AUR to XO affected the structure of XO protein. Changes in the secondary structure of XO protein were quantified by calculation and statistics, and the results were shown in Table 2. The content of β-sheet and β-turn decreased, while α-helix and random structure increased, indicating that the structure of XO protein shifted from β-sheet and β-turn to α-helix and random structure due to the addition of AUR. Combined with the RMSD results of molecular dynamics simulation, binding to AUR results in more compact protein structure.
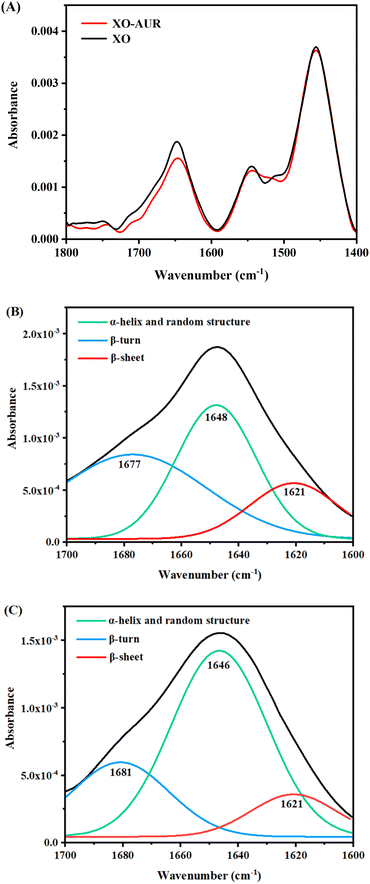 | ||
| Fig. 7 (A) FT-IR spectrum of free XO and XO–AUR system, c(XO) = 0.5 U mL−1, c(AUR) = 300 μM. (B) Split-peak fitting of XO. (C) Split-peak fitting of XO–AUR. | ||
| α-Helix and random structure/% | β-Sheet/% | β-Turn/% | |
|---|---|---|---|
| XO | 42.13 | 17.50 | 40.37 |
| XO–AUR | 64.62 | 12.07 | 23.31 |
3.5 Molecular docking
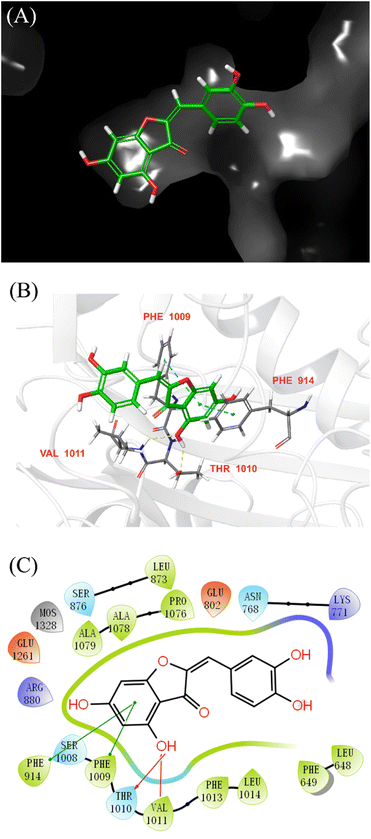
Molecular docking was performed to further elucidate the binding mode of AUR and XO. Quercetin was redocked to the active site of XO, and the RMSD values between their crystallographic and redocked conformations met the requirement (less than 2 Å), which means current docking model was credible. According to the scoring order of the combined objects simulated by Schrödinger software, the docking model with the maximum binding energy was selected as the analysis object. As shown in Fig. 8, AUR is located in a pocket surrounded by several amino acid residues (Leu648, Phe649, Leu1014, Phe1013, Val1011, Phe1009, Phe914, Ala1079, Ala1078, Pro1076 and Leu873), which all belong to the Mo–Pt structural domain. Among them, Phe914, Phe1009, Thr1010 and Val1011 were reported to play a key role in XO catabolism. In addition, the docking model diagram also reveals that the binding of AUR and XO depends on hydrogen bonding force and hydrophobic force. Thr1010 and Val1011 initiate the catalytic process by deprotonating the hydroxyl group in the Mo–Pt center. Meanwhile, Phe914 and Phe1009 stabilize the intermediate complex formed during the reaction by hydrogen bonding. The B-ring of AUR extends into the hydrophobic cavity consisting of Phe1013 and Leu1014, Phe649 and Leu648. Interestingly, the pose of AUR in active site is quite similar to that of quercetin,34 the 5-OH group in both inhibitors displayed hydrogen-bond interactions with Thr1010 and Val1011. However, the 7-OH group of quercetin with Arg880 and Thr1010 could not be observe in current docking diagram of AUR. This may be the reason for the difference in activity between two inhibitors, in short, above results indicated that AUR was encapsulated in the hydrophobic cavity and goes in line with the previous information obtained using fluorescent probe competition experiment.3.6 Molecular dynamics simulation
Binding of ligand to protein is a dynamic phenomenon, which occurs in less than one nanosecond. Therefore, molecular dynamics simulation method was used to conduct 50 ns to evaluate the stability, flexibility, and dynamic changes of XO–AUR complex system.35 Correspondingly, RMSD, RMSF, the radius of rotation (Rg), and the solvent accessible surface area (SASA) were analyzed to clarify the structural characteristics of free XO and XO–AUR complex in the whole simulation time.In general, the RMSD value reflects the shift of backbone atoms in the molecular system, which makes it a criterion to judge whether the system reaches the simulated dynamic equilibrium state.36 The RMSD value of blank 3NVY and 3NVY–AUR complex system within the dynamic simulation time (0–50 ns) were shown in Fig. 9A. There is a certain amplitude fluctuation on the whole curve, which indicates that some dynamic changes have taken place in the skeleton structure of 3NVY during the simulation process. However, after 35 ns, the curves of the complex tends to be stable and the RMSD value varied within 0.05 nm, indicating that the combination of 3NVY and AUR is stable and the system had reached a dynamic equilibrium state. Which is in good agreement with the results of FT-IR spectroscopy experiment.
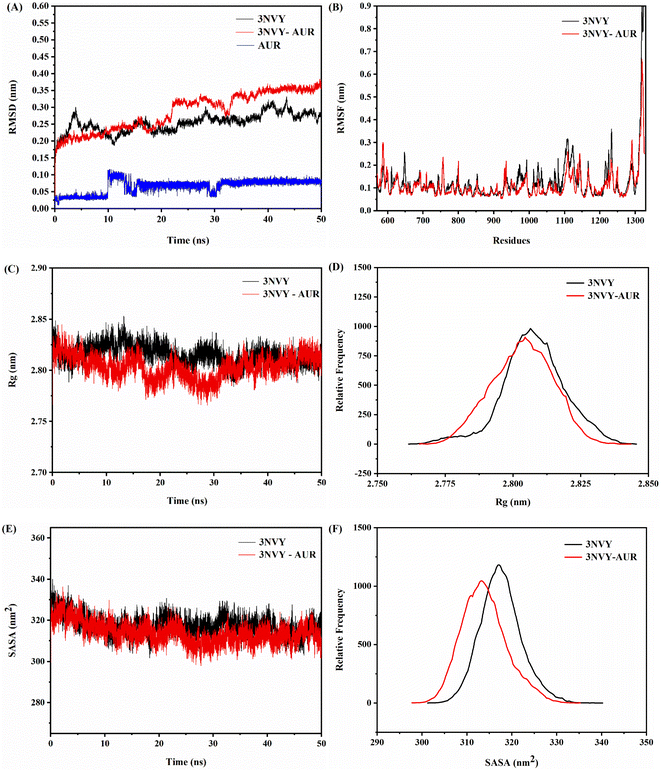 | ||
| Fig. 9 RMSD analysis (A), RMSF analysis (B), changes in Rg values (C), relative distribution frequency of Rg (D), changes in SASA values (E), and relative distribution frequency of SASA (F) for XO complexed with AUR (PDB ID: 3NVY). | ||
In contrast, RMSF can further analyze the flexibility of protein amino acid residues. A larger RMSF value usually indicates a larger shift of the corresponding amino acid residues relative to the mean position during the simulation, and a larger degree of freedom of the corresponding atoms.36 The comparative analysis of RMSF curves of blank 3NVY and 3NVY–AUR were shown in Fig. 9B. After binding to AUR, the RMSF value of 3NVY decreased and the flexibility of amino acid residues was reduced, and there was no significant difference in amino acid fluctuations (Leu648, Phe649, Leu1014, Phe1013, Val1011, Phe1009, Phe914, Ala1079, Ala1078, Pro1076 and Leu873) that have interacted with the molecule can be observed in the whole simulation process.
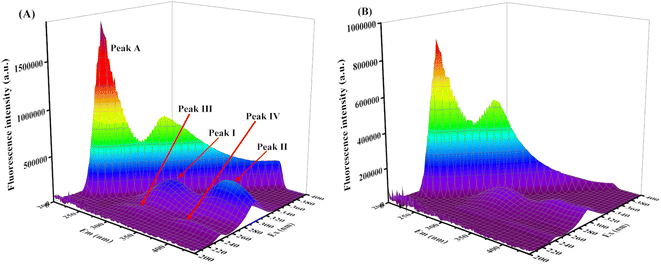
In addition, Rg is an important physical quantity to characterize the overall structural tightness of protein. The smaller the fluctuation of Rg value, the more stable the system structure is.37 It can be seen from the Rg value changes of blank 3NVY and 3NVY–AUR complex in Fig. 9C and D that the overall Rg curve of blank 3NVY fluctuates up and down to a certain extent, which means that the degree of loose pool of blank 3NVY structure varies dimensionally during simulation. In contrast, the Rg constant curve of 3NVY–AUR complex has a small fluctuation range and the overall Rg value is lower than that of blank 3NVY, which indicates that the addition of AUR makes the overall structure of 3NVY more compact and it is consistent with the result of 3D fluorescence.
Noticeably, SASA is an important parameter to describe the hydrophobicity of protein, which indicates the surface area of protein accessible to solvent and is a decisive factor in protein folding and stability studies. A lower SASA value for protein indicates higher protein density and more stable protein structure. The binding of small molecule ligand with protein will affect the structure of protein and causes changes in SASA. Fig. 9E showed that the SASA changes of blank 3NVY and 3NVY–AUR complex system during 50 ns. The overall SASA of 3NVY–AUR system keep relatively stable in the range from 230 to 245 nm, which is lower than that of blank 3NVY, suggesting that XO protein structure became more stable after binding with AUR. The relative frequency analysis (Fig. 9F) indicated that the SASA value of the AUR–XO complex was decreased obviously compared with individual 3NVY. This implied that the binding of AUR led to the closing of hydrophobic cavity of XO protein, which confirmed the finding of ANS-binding fluorescence probe experiment.
3.7 ADME prediction
As mentioned by Ferreira et al.,38 proper ADME properties, including absorption, distribution, metabolism properties were essential for a good drug candidate. Therefore, in the identification process of hit compound, estimating ADME properties of hit compound is of great importance. Multiple ADME properties of AUR along with allopurinol and febuxostat were predicted in silico using the QikProp v. 5.5 (Schrödinger) so as to evaluate its drug-like properties. As illustrated in Table 3, AUR meet the criteria of Lipinski drug likeness and perform well in topological polar surface area, hydrogen bond acceptor/donor and human intestinal absorption. It exerts better Caco-2 permeability and higher plasma protein binding capacity as compared to two reference drugs. It belongs to class III category and non-AMES toxicity, which can be derive from the acute oral toxicity prediction. In a word, aureusidin can be considered safe.| No. | Molecule | AUR | Febuxostat | Quercetin | Recommended values |
|---|---|---|---|---|---|
| 1 | CNS | −2 | −2 | −2 | −2 (inactive)–2 (active) |
| 2 | MW | 286.24 | 316.374 | 302.24 | 130–725 |
| 3 | SASA | 497.789 | 610.76 | 509.582 | 300.0–1000.0 |
| 4 | Volume | 835.084 | 1038.522 | 858.572 | 500.0–2000.0 |
| 5 | Donor HB | 3 | 1 | 4 | 0.0–6.0 |
| 6 | Accpt HB | 4.5 | 5.75 | 5.25 | 2.0–20.0 |
| 7 | QPlogPo/w | 0.978 | 2.984 | 0.35 | −2.0–6.5 |
| 8 | QPlogS | −2.678 | −5.646 | −2.764 | −6.5–0.5 |
| 9 | QPPCaco | 55.241 | 58.136 | 19.948 | <25 poor, >500 great |
| 10 | QPlogBB | −1.933 | −1.402 | −2.317 | −3.0–1.2 |
| 11 | Metab | 5 | 3 | 5 | 1–8 |
| 12 | QPlogKhsa | −0.292 | −0.055 | −0.352 | −1.5–1.5 |
| 13 | HOA% | 63.855 | 75.998 | 52.262 | <25% poor, >80% high |
| 14 | PSA | 123.856 | 91.801 | 140.856 | 7.0–200.0 |
| 15 | Rule of five | 0 | 0 | 0 | Maximum is 4 |
| 16 | Rule of three | 0 | 0 | 1 | Maximum is 3 |
4 Conclusion
In current study, enzyme kinetics assay, multispectroscopic methods (including fluorescence spectrum, and FT-IR spectrum), and molecular simulation were employed to explore the inhibitory mechanism of AUR on XO. In conclusion, AUR acted as a rapid reversible and mixed-type XO inhibitor (IC50 = 7.617 ± 0.401 μM), its binding to XO was spontaneous and dominated mainly by hydrophobic interaction. AUR quenched the fluorescence chromophore of XO by forming XO–AUR complex in a static quenching mechanism. In particular, it could occupy the catalytic center (Mo–Pt domain), prevent the entrance of substrate and induce the conformational changes of secondary structures of XO, which further affected the tertiary structure of XO protein. In addition, AUR showed good stability and pharmacokinetic behavior properties in molecular dynamics simulation and ADMET prediction. Overall, our work unveiled the binding mechanism of AUR to XO, also provided valuable information concerning the future therapeutic application of AUR as natural XO inhibitor.Conflicts of interest
The authors declare that they have no potential conflict of interest.Acknowledgements
This work was supported by the Science and Technology Department of Sichuan Province in China (grant number 2022YFS0433). Schrödinger software was provided by the West China School of Pharmacy.References
- P. Richette and T. Bardin, Lancet, 2010, 375, 318–328 CrossRef CAS.
- F. Borges, E. Fernandes and F. Roleira, Curr. Med. Chem., 2002, 9, 195–217 CrossRef.
- J. Maiuolo, F. Oppedisano, S. Gratteri, C. Muscoli and V. Mollace, Int. J. Cardiol., 2016, 213, 8–14 CrossRef.
- R. L. Wortmann, Curr. Opin. Rheumatol., 2002, 14, 281–286 CrossRef.
- K. Okamoto, B. T. Eger, T. Nishino, E. F. Pai and T. Nishino, Nucleosides, Nucleotides Nucleic Acids, 2008, 27, 888–893 CrossRef.
- P. Pacher, A. Nivorozhkin and C. Szabo, Pharmacol. Rev., 2006, 58, 87–114 CrossRef.
- M. Rezaeinasab, A. Benvidi, S. Gharaghani, S. Abbasi and H. R. Zare, Enzyme Microb. Technol., 2019, 121, 29–36 CrossRef.
- L. K. Stamp, R. O. Day and J. Yun, Nat. Rev. Rheumatol., 2016, 12, 235–242 CrossRef PubMed.
- S. M. Feng, S. J. Wu, F. Xie, C. S. Yang and P. Shao, Trends Food Sci. Technol., 2022, 123, 87–102 CrossRef.
- J. L. Serrano, J. Figueiredo, P. Almeida and S. Silvestre, J. Evidence-Based Complementary Altern. Med., 2020, 2020, 1–17 CrossRef.
- F. Q. Wang, X. Zhao, X. Su, D. N. Song, F. M. Zou and L. N. Fang, Food Funct., 2021, 12, 12503–12512 RSC.
- R. R. Ou, L. Z. Lin, M. M. Zhao and Z. Q. Xie, Int. J. Biol. Macromol., 2020, 162, 1526–1535 CrossRef.
- J. Zhao, L. Huang, C. Y. Sun, D. S. Zhao and H. J. Tang, Food Chem., 2020, 323, 126807 CrossRef.
- L. Costantino, G. Rastelli and A. Albasini, Pharmazie, 1996, 51, 994–995 Search PubMed.
- G. Sui, T. Li, B. Zhang, R. Wang, H. Hao and W. Zhou, Bioorg. Med. Chem., 2021, 29, 115895 CrossRef.
- J. Zhao, L. Huang, C. Sun, D. Zhao and H. Tang, Food Chem., 2020, 323, 126807 CrossRef.
- Y. Wang, G. Zhang, J. Yan and D. Gong, Food Chem., 2014, 163, 226–233 CrossRef.
- C. Zhang, R. Wang, G. Zhang and D. Gong, Int. J. Biol. Macromol., 2018, 112, 405–412 CrossRef PubMed.
- S. Lin, G. Zhang, Y. Liao and D. Gong, Food Funct., 2016, 7, 2849–2861 RSC.
- Y. Liu, C. Han, T. Lu, Y. Liu, H. Chen, C. Yang, Y. Tu and Y. Li, Int. J. Biol. Macromol., 2021, 190, 463–473 CrossRef PubMed.
- N. Bijari, Y. Shokoohinia, M. R. Ashrafi-Kooshk, S. Ranjbar, S. Parvaneh, M. Moieni-Arya and R. Khodarahmi, J. Lumin., 2013, 143, 328–336 CrossRef.
- D. Van Der Spoel, E. Lindahl, B. Hess, G. Groenhof, A. E. Mark and H. J. Berendsen, J. Comput. Chem., 2005, 26, 1701–1718 CrossRef PubMed.
- F. Janati-Fard, M. R. Housaindokht, H. Monhemi and A. Nakhaeipour, Int. J. Biol. Macromol., 2018, 106, 284–292 CrossRef PubMed.
- O. V. Muzychka, O. L. Kobzar, A. V. Popova, M. S. Frasinyuk and A. I. Vovk, Bioorg. Med. Chem., 2017, 25, 3606–3613 CrossRef PubMed.
- R. Ou, L. Lin, M. Zhao and Z. Xie, Int. J. Biol. Macromol., 2020, 162, 1526–1535 CrossRef.
- S. Lin, L. Zeng, G. Zhang, Y. Liao and D. Gong, Spectrochim. Acta, Part A, 2017, 178, 71–78 CrossRef PubMed.
- P. Alam, A. S. Abdelhameed, R. K. Rajpoot and R. H. Khan, J. Photochem. Photobiol., B, 2016, 157, 70–76 CrossRef PubMed.
- H. Tang, P. Song, J. Li and D. Zhao, Int. J. Biol. Macromol., 2019, 135, 303–313 CrossRef.
- L. Dumitrascu, N. Stanciuc and I. Aprodu, Int. J. Biol. Macromol., 2016, 88, 306–312 CrossRef PubMed.
- C. Ren, W. Xiong, J. Li and B. Li, Food Hydrocolloids, 2019, 92, 155–162 CrossRef.
- F. Zeeshan, M. Tabbassum, L. Jorgensen and N. J. Medlicott, Appl. Spectrosc., 2018, 72, 268–279 CrossRef PubMed.
- M. Fevzioglu, O. K. Ozturk, B. R. Hamaker and O. H. Campanella, Int. J. Biol. Macromol., 2020, 164, 2753–2760 CrossRef PubMed.
- C. Zhang, G. Zhang, J. Pan and D. Gong, Food Res. Int., 2016, 89, 152–160 CrossRef PubMed.
- H. Cao, J. M. Pauff and R. Hille, J. Nat. Prod., 2014, 77, 1693 CrossRef PubMed.
- D. P. Yeggoni, C. Kuehne, A. Rachamallu and R. Subramanyam, RSC Adv., 2017, 7, 5002–5012 RSC.
- H. Ma, T. Zou, H. Li and H. Cheng, Int. J. Biol. Macromol., 2020, 162, 1546–1554 CrossRef PubMed.
- N. A. Alsaif, T. A. Wani, A. H. Bakheit and S. Zargar, Int. J. Biol. Macromol., 2020, 165, 2451–2461 CrossRef PubMed.
- L. L. G. Ferreira and A. D. Andricopulo, Drug Discovery Today, 2019, 24, 1157–1165 CrossRef PubMed.
| This journal is © The Royal Society of Chemistry 2023 |

