
 Open Access Article
 This Open Access Article is licensed under a Creative Commons Attribution-Non Commercial 3.0 Unported Licence
Assessing the efficiency of water-soluble organic compound biodegradation in clouds under various environmental conditions†
Lucas
Pailler
*a,
Nolwenn
Wirgot
b,
Muriel
Joly
b,
Pascal
Renard
a,
Camille
Mouchel-Vallon‡
 a,
Angelica
Bianco
a,
Maud
Leriche
a,
Martine
Sancelme
b,
Aurélie
Job
b,
Luc
Patryl
c,
Patrick
Armand
c,
Anne-Marie
Delort
b,
Nadine
Chaumerliac
a and
Laurent
Deguillaume
*ad
a,
Angelica
Bianco
a,
Maud
Leriche
a,
Martine
Sancelme
b,
Aurélie
Job
b,
Luc
Patryl
c,
Patrick
Armand
c,
Anne-Marie
Delort
b,
Nadine
Chaumerliac
a and
Laurent
Deguillaume
*ad
aUniversité Clermont Auvergne, CNRS Laboratoire de Météorologie Physique, F-63000 Clermont-Ferrand, France. E-mail: laurent.deguillaume@uca.fr; lucas.pailler@doctorant.uca.fr
bUniversité Clermont Auvergne, CNRS, SIGMA Clermont, Institut de Chimie de Clermont-Ferrand, Clermont-Ferrand 63000, France
cCEA, DAM, DIF, Arpajon 91297, France
dUniversité Clermont Auvergne, CNRS, Observatoire de Physique du Globe de Clermont Ferrand, UMS 833, Clermont-Ferrand, France
First published on 10th March 2023
Abstract
The objective of this research was to evaluate the role of atmospheric microorganisms in chemical transformations occurring within clouds. To achieve this objective, we measured in the laboratory the rates of biodegradation for four chemical compounds of interest in atmospheric chemistry (formic and acetic acids, formaldehyde and hydrogen peroxide). We implemented them in an explicit model of cloud chemistry simulating the exchange processes between air and droplets and chemical reactivity in both phases. The biodegradation rates were not kept constant; rather, they depended on the concentration of the four targeted species. For this purpose, a series of incubation experiments were performed in the laboratory with microbial strains isolated from cloud water by modulating the initial concentration of the substrate and ambient temperature (5 °C and 17 °C). Different simulations were carried out to investigate the role of biological activity in contrasting environmental conditions (season, day/night). Sensitivity tests were also performed on parameters controlling the chemical reactivity and exchanges between phases such as the cloud liquid water content or acidity. Analysis revealed that biodegradation in the aqueous phase was competitive with the abiotic processes of transformations for the four compounds, especially in summer (up to 94% in terms of relative contribution). The concentration of formic acid exerted the most significant impact in both the aqueous phase and in terms of total concentration in the cloud. In summer, biodegradation had a strong impact, during both day and night, on formic acid concentration, inducing a loss of 23 and 65%, respectively. At night, in summer, biodegradation was the main sink for formic acid, acetic acid and formaldehyde (81, 56 and 98%, respectively). Sensitivity tests (pH and liquid water content – LWC) further demonstrated the added value of modulating the biodegradation efficiency according to the concentrations of each compound. For instance, the decrease of formic acid aqueous concentration due to biodegradation is between 50 and 70% more important when LWC is reduced by a factor of 3.
Environmental significanceThe role of microorganisms in cloud chemistry was recently highlighted considering their ability to degrade organic compounds and oxidants. This works aims at assessing by a modeling approach the environmental conditions for which the biodegradations of 4 key compounds (acetic and formic acids, formaldehyde and H2O2) are favored and thus play a significant role in the cloud multiphasic chemical budget. The results foreground that microbial degradation is competitive with chemical sinks whatever the environmental situation. The concentrations of formic acid are the most strongly impacted both in the aqueous and the gaseous phases. Sensitivity tests on cloud physico-chemical properties (liquid water content and acidity) demonstrate the importance to modulate biodegradation rates with the concentrations in atmospheric chemistry models. |
1. Introduction
A cloud is a multiphasic environment that is difficult to investigate by performing laboratory experiments or field campaigns due to its inherent complexity. Consequently, numerical models of different complexities have been developed to simulate the multiphase chemistry of clouds.1,2 These models have been used to represent the transformations of organic and inorganic species during the lifetime of clouds. Models can be used to simulate processes with different levels of complexity: 0D models help to understand the detailed processes as they include microphysical processes and explicit chemical mechanisms with hundreds of chemical species and reactions considering chemical and thermo-dynamical data from laboratory experiments.3–8 These models allow us to evaluate the effect of individual microphysical and chemical processes in the context of atmospheric chemistry. This is a crucial step in developing our understanding of cloud chemistry and to parameterize the most significant processes in larger scale models with the objective of evaluating the impacts of clouds on air quality and climate change.9,10Currently, most of these models only consider abiotic processes. Nevertheless, microorganisms (bacteria, yeasts and fungi) have been discovered to be alive and metabolically active in cloud water.11,12 These microorganisms can resist and survive even when exposed to harsh conditions (cold shock, oxidative stress, osmotic stress and UV radiation).13 They can act as biocatalysts and transform organic matter, thus contributing to cloud chemistry.14–16 More specifically, microorganisms can degrade compounds such as formaldehyde, methanol and organic acids by virtue of their metabolism.17,18 Microorganisms can also act indirectly on cloud chemistry through their interactions with oxidants; to protect themselves from oxidative stress, microorganisms can transform hydrogen peroxide (H2O2), a major source of hydroxyl radicals (HO˙)19 and one of the main sources of atmospheric oxidants.
Under laboratory conditions, comparisons between biotic and abiotic transformation rates in microcosms mimicking cloud environments and in cloud water have clearly demonstrated that biodegradation can be competitive with radical chemistry.20,21 However, such laboratory experiments have been performed under bulk conditions that were not representative of the multiphasic cloud system with thermodynamic and chemical equilibriums between the gas and liquid phases. Some recent modeling researchers thus proposed to overcome these experimental limits by integrating biological contributions within cloud chemistry models.22,23
The first study to consider biodegradation processes in a cloud chemistry model was published by Fankhauser et al.22 Microbial consumption rates for the small organic molecules commonly detected in cloud water have been incorporated in the 0D-GAMMA model. In this model, biodegradation rates are constant, and the liquid water content (LWC) is reduced to extremely low values since only the volume of droplets containing bacteria is considered. The authors showed that biodegradation rates were efficient enough to modify organic acid concentrations in droplets containing microorganisms but not the overall droplet population. Khaled et al.23 analyzed the potential effect of microorganisms on the chemical composition of cloud water by performing sensitivity tests that modulated biological and chemical process parameters over large ranges (cell concentrations, loss rates for organics by chemical and biological processes and the solubility of organics). These researchers concluded that the organics of intermediate solubility (effective Henry's law constant Heff between 104 to 106 M atm−1) such as formic and acetic acid may be the compounds that are most affected by biodegradation in cloud water.
These previous modeling studies assumed that the microbiological activity remained constant with different concentrations and that the degradation of a substrate by microorganisms differs fundamentally from chemical reactivity. Biodegradation involves enzymes that catalyze the transformation of a substrate into a product and whose activity is regulated by the concentration of the substrate. Hence, biodegradation rates vary constantly with substrate concentration. This means that we need to make adequate assumptions in the model to represent biodegradation effects more realistically with regard to cloud chemistry.
In the present study, we experimentally determined biodegradation constants for four chemical compounds representing substrates for microorganisms. Formic and acetic acids along with formaldehyde were chosen because of their importance in cloud chemistry; these compounds were implemented in a model of cloud chemistry. These compounds are known to enter the central metabolism of several microorganisms; these metabolites are used to maintain energy levels by the production of ATP to synthesize larger molecules and create biomass. The metabolic pathways of these compounds are relatively well known and imply a relatively low number of enzymatic steps. H2O2 was also considered to investigate the indirect effect of microorganisms on the oxidant capacity of cloud water. The biodegradation rates of these substrates were experimentally determined using three bacterial strains isolated from cloud water sampled at the top of the puy de Dôme mountain (PUY, France) and known to efficiently degrade these compounds. Biodegradation rates were evaluated for different initial concentrations of the substrate and for two temperatures (5 and 17 °C). To implement biological degradation in this model, we restricted microbial activity to one enzymatic reaction although the metabolic pathways of microorganisms are clearly more complex.
These biodegradation rates were implemented in a detailed model of cloud chemistry which described explicitly the chemistry in both the gaseous and aqueous phases together with the dynamical mass transfer between these two phases.7,24 Contrary to previous modeling studies, biodegradation rates were modulated by the substrate concentrations. The objective of this research was to compare the efficiency of photochemistry vs. microbiology with regard to the effects of selected “key” environmental parameters such as temperature, actinic flux, pH, cloud liquid water content and cell concentration. We did not consider all of the environmental parameters known to modulate microbial metabolic activity and viability in the cloud aqueous phase such as pH or actinic flux. Microorganisms other than bacteria have largely been neglected while all forms of bacteria were considered to be active. Warm cloud events were simulated at temperatures of 5 °C and 17 °C; these temperatures are representative of mid-latitude clouds and different seasons (winter vs. summer). This research aims at providing a new concept for the role of microorganisms in the atmospheric transformation of chemical compounds and considers realistic biodegradation rates and the modulation of many environmental parameters.
2. Methods
2.1. Biodegradation experiments
We utilized three bacterial strains of Pseudomonas, which represents one of the most encountered genera in clouds.15,25–31 These strains belong to the Gamma-Proteobacteria class reported previously15 and were selected due to their ability to degrade chemical compounds in clouds.17,20 These bacteria were formally identified (based on 16S rRNA gene sequences) as Pseudomonas graminis (13b-3, DQ512786) for formic acid and hydrogen peroxide degradation, Pseudomonas sp. (14b-10, DQ512794) for acetic acid degradation and Pseudomonas syringae (12b-8, DQ512783) for formaldehyde degradation.These bacteria were grown on R2A medium and were incubated in artificial cloud solution. This solution mimics the chemical composition of clouds that are representative of air masses that are influenced by marine environments (see ESI, S1, S2 and Table SM1 for experimental details†). We chose this solution because most of the clouds sampled at PUY are influenced by marine environments. The bacteria concentration to chemical concentration ratio was kept as close as possible to cloud conditions but due to methodological constraints (detection limits and the quantification of degradation rates), bacteria concentrations were adjusted at 107 cells per mL for acetic acid and formaldehyde and 105 cells per mL for hydrogen peroxide and formic acid. The artificial cloud solution in which bacteria were incubated was concentrated by a factor of 100 specifically for acetic acid and formaldehyde, to keep the same cell/chemical concentration ratio during the determination of biodegradation rates. Previous studies in a laboratory environment have shown that maintaining a constant ratio of cell concentration vs. degraded chemical compound concentration (in the range of the investigated concentrations) allows the evaluation of biodegradation rates independently of the absolute cell and chemical concentrations18 The artificial cloud water was then supplemented with increasing concentrations of formic acid, acetic acid, formaldehyde or H2O2 to estimate their biodegradation rates (ESI, S3†).
All biodegradation experiments were performed under sterile conditions in triplicate (independent replicates). Two control solutions were also monitored to test substrate stability (without bacteria) and substrate release by bacteria (without substrate supplementation). Incubation experiments were performed at two different temperatures (5 °C and 17 °C) to represent winter and summer conditions. The concentrations of substrates were monitored by ion chromatography or fluorescence spectroscopy (see ESI, S4 for further details relating to chemical analysis†). Further information relating to the incubation experiments is given in ESI (S5†). The calculations used for biodegradation rates are detailed in ESI (S6†) and the results are reported in Table SM2.†
2.2. Model setup
The cloud chemistry model used in this research was based on the Dynamically Simple Model for Atmospheric Chemical Complexity (DSMACC)32 using the Kinetic PreProcessor (KPP)33 which was modified to take into account the aqueous phase. The aqueous phase mechanism CLEPS (Cloud Explicit Physico-chemical Scheme) considers the detailed chemical reactions of HxOy, chlorine, carbonates, NOy, sulfur, and the chemistry of the transition metals for iron, manganese and copper in the aqueous phase.34–36 It also considers the oxidation of organic species for C1 to C4 carbon atoms based on a protocol described previously.7 In total, 850 aqueous reactions and 465 equilibria were included in the aqueous phase mechanism. For organic compounds, 87 chemical species were considered in the mechanism corresponding to 657 chemical forms (hydrated forms and anionic forms). In CLEPS, the most recent structure–activity relationships (SARs) were used to document missing data. For example, Doussin and Monod's SAR37 was used to estimate rate constants and branching ratios for the HO˙ oxidation and the GROMHE SAR38 allowed for the determination of solubility (Henry's law constants) and hydration constants. The chemical aqueous mechanisms implemented in the cloud chemistry model for the four studied compounds are given in ESI (S7a†).The aqueous phase mechanism was coupled with the latest version of the explicit gas phase mechanism MCM v3.3.1 (Master Chemical Mechanism).39 The mass transfer between the two phases was kinetically described previously.40 The model calculated photolysis rates with the TUV v4.5 model.41 The TUV model was also modified to calculate aqueous phase photolysis rates. The model explicitly predicts H+ concentration as part of the solution of the system of ordinary differential equations (ODEs). Therefore, pH may evolve dynamically during the simulation time; it can also be fixed at a constant value for sensitivity tests.
We chose a chemical scenario that was representative of low NOx conditions for simulations. Initial concentrations, emissions and dry depositions in the gaseous phase were adapted from the work of McNeill et al.6 and of Mouchel-Vallon et al.7 (ESI S7b and Table SM3†). To obtain a chemical photo-stationary state, an eight-day-long simulation was performed modeling only gas phase chemistry. This so-called “spinup” simulation leads to a complex chemical environment that is characterized by gaseous inorganics, organics and oxidant concentrations that are representative of low-NOx conditions. Spinup simulations were performed to represent two different seasons (summertime vs. wintertime cases). The temperature and actinic flux were different and thus simulated the effect of seasonality. For maximum intensity, the actinic flux was 1.7-fold higher for the summer case. For the summer case, the temperature was set to 17 °C and for wintertime conditions, the temperature was set to 5 °C. These two temperatures are identical to the temperatures maintained during incubation experiments, thus allowing us to evaluate biodegradation rates. To validate the spinup parameters, concentrations obtained on the last day of simulations were compared to in situ measurements monitored at the puy de Dôme station (PUY); this is considered to be a remote station (i.e., a low NOx environment).42 To mimic the winter chemical environment, isoprene emissions were reduced from 5.0 × 10⁶ to 2.5 × 10⁶ molecules cm−3 s−1 and the deposition rates of the different chemicals were reduced by a factor of one-third for the wintertime spinup parameters to account for reduced plant foliage. The gaseous concentrations of a selection of key species in atmospheric chemistry for the two spinup simulations are presented in ESI (S7c, Fig. SM1 and SM2†). At the end of the spinup, we noticed that, as expected, the concentrations of oxidants were higher in summer than in winter. Simulated HOx (HO˙, HO2˙) concentrations were compared to previous studies (both modelling evaluation and in situ measurements) and present realistic level and modulations with the different environmental condition (day vs. night, summer vs. winter) (see ESI S7d†) for more details). Summer conditions also favored higher organic concentrations (see Table SM4 for further details†). Cloud simulations were run using the concentrations obtained at the end of the spinup simulation as input parameters. The different simulations are presented in Fig. 1.
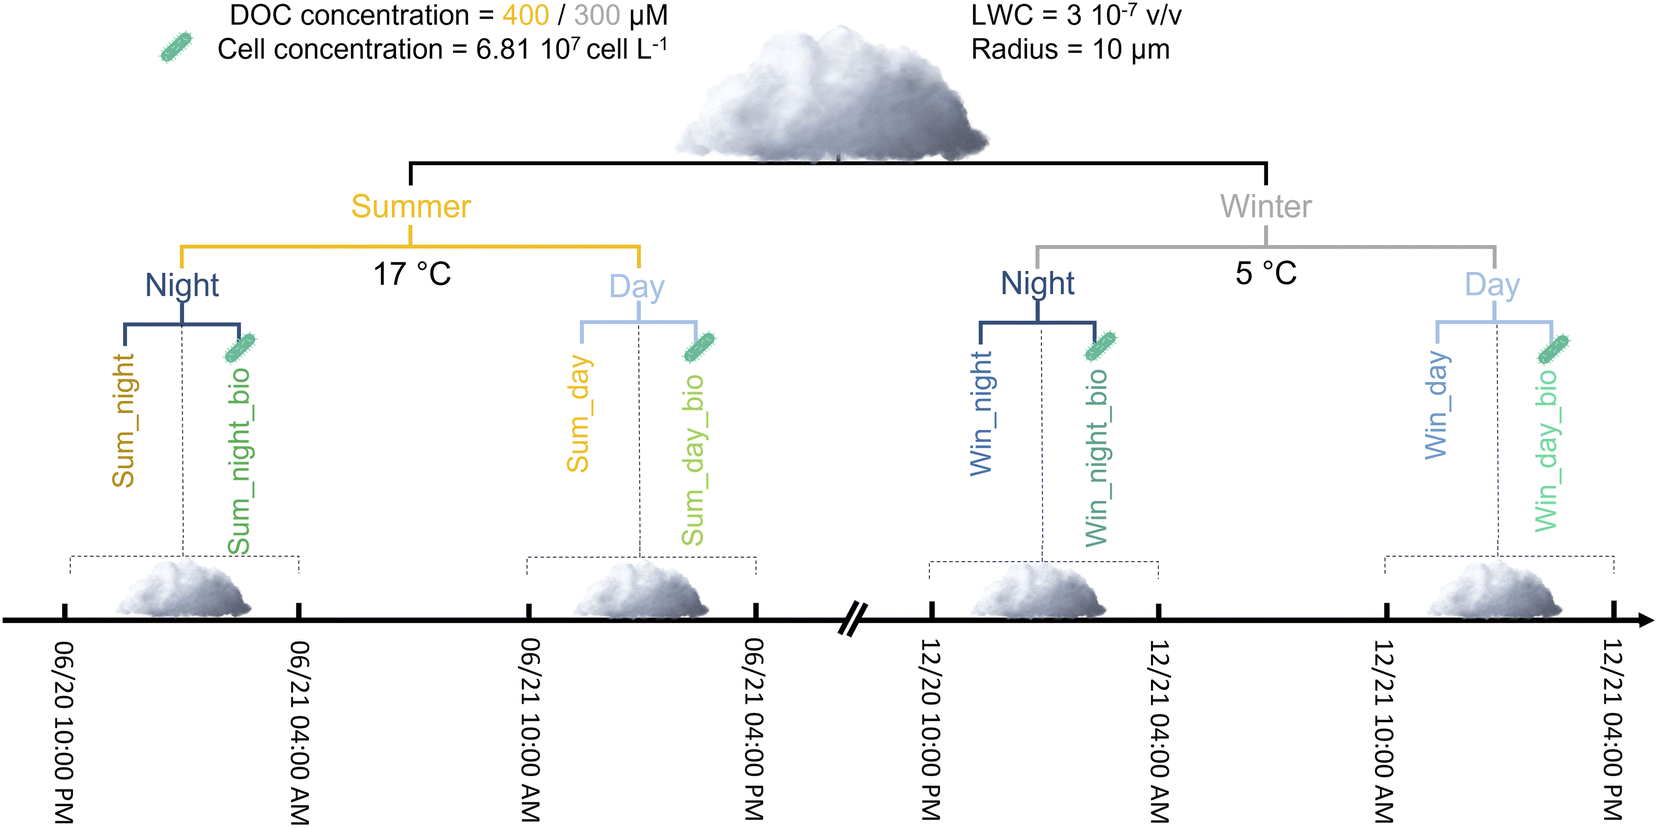 | ||
| Fig. 1 Conditions of the different simulations: chemical scenarios, environmental parameters and microphysical properties. Dissolved organic carbon (DOC) concentrations are indicated for summer (yellow) and winter (grey). | ||
The cloud aqueous phase appeared on the 6th day at 10 PM (night cloud simulation) or the 7th day at 10 AM (day cloud simulation) and both cloud simulations lasted 6 hours (Fig. SM3†). The radius of the cloud droplets was fixed at 10 μm and the liquid water content (LWC) was equivalent to 3 × 10⁻⁷ v/v. The acidity was set constant at pH = 5.5; this value is close to the pH used for biodegradation experiments. LWC, radius and pH values are representative of measurements performed on real clouds sampled at the PUY station. During the cloud simulations, emission and deposition rates were identical to the ones used for spinup simulations. Aqueous HO˙ concentration also represents a crucial parameter since it drives the oxidation of organic matter. Usually, numerical models overestimate the concentration of this radical in cloud droplets in comparison to field measurements.8,43 To consider the scavenging of HO˙ by organic matter, the aqueous mechanism involved two main processes. First, organics present in the gas phase and for which the reactivity was not described in CLEPS were still transferred in the aqueous phase and reacted with HO˙ radicals with a reaction rate of 3.8 × 10⁸ M s−1. This value was proposed previously43 to estimate the sink for aqueous HO˙ by considering dissolved organic carbon (DOC). Second, we considered the concentration of DOC reacting with HO˙ at the same rate. In contrast to the concentration of organics passing from gas to droplets, this concentration remained constant. The objective of this was to represent the soluble organic fraction dissolved from aerosol particles. These hypotheses enabled the reduction of HO˙ by one order of magnitude (from 10−13 to 10−14 M for maximal values simulated during the day in summer conditions) which is closer to the values observed in situ.44,45
2.3. Implementation of biodegradation rates in the model
Biological degradation reactions were implemented in the CLEPS mechanism to describe the biodegradation of formic and acetic acids, formaldehyde and H2O2 (Fig. 2a). Formic and acetic acids are transformed by bacteria in the aqueous phase into CO2 and the biodegradation of H2O2 leads to the formation of H2O and O2. For formaldehyde, we considered that bacteria lead to the formation of methanol and formic acid, as reported previously.17 A ratio of 50/50 was chosen since no quantitative data exist on the modulation of the methanol/formic acid ratio by bacteria metabolism.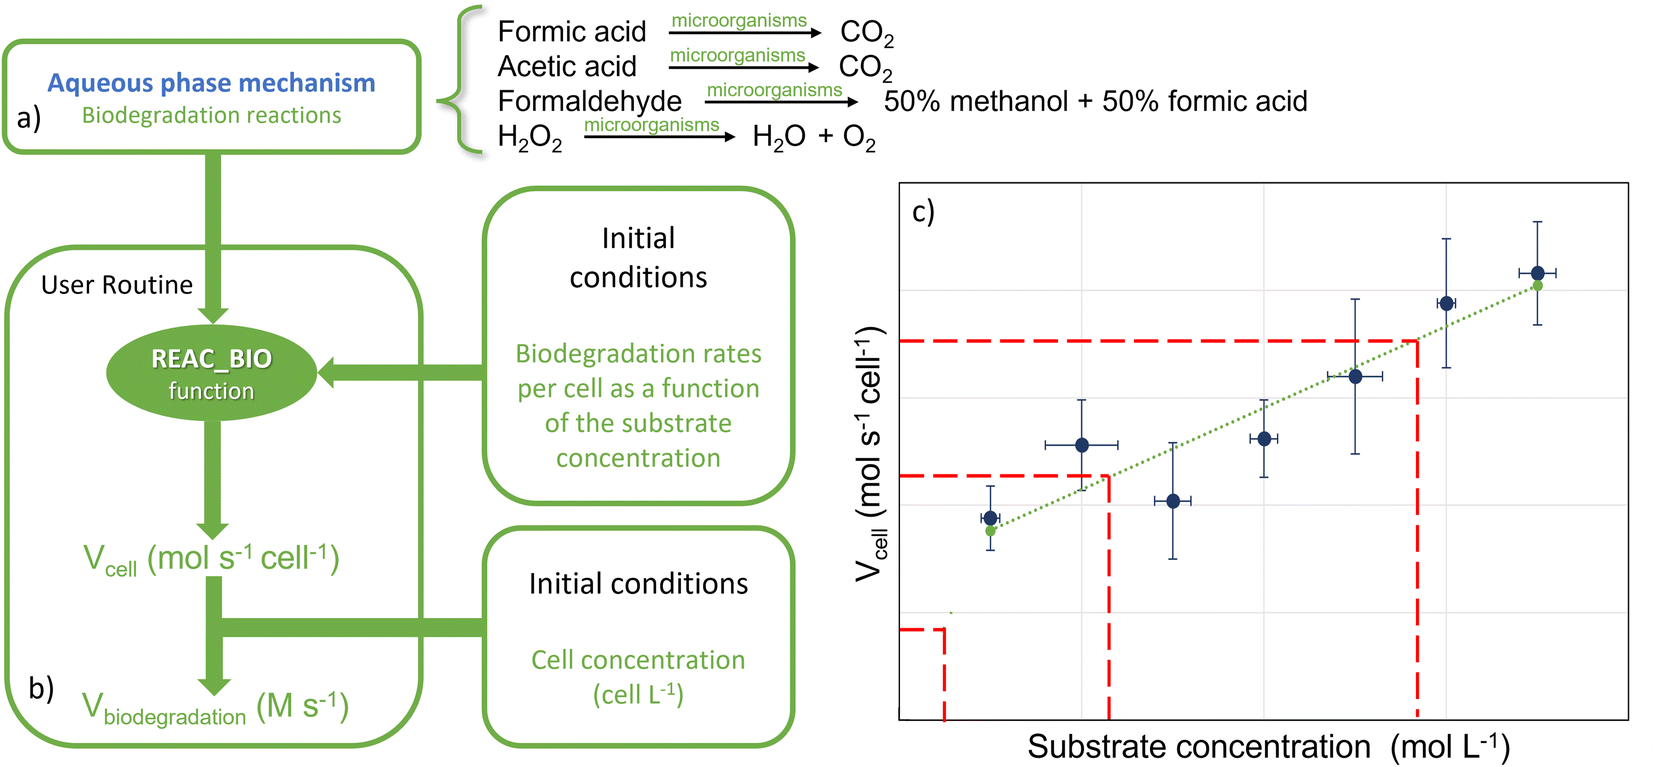 | ||
| Fig. 2 (a) Schematic description of the implementation of biodegradation in the model. Four reactions were added to the CLEPS aqueous phase mechanism. (b) The model uses the REAC_BIO function that calculates biodegradation rates for the four organic compounds as a function of the simulated concentrations at each time step. (c) The function read an input file (represented on the right) containing the linear fit (the dotted green line) calculated on the basis of the experimental data (the blue points). The rate was calculated using a linear fit in mol s−1 cell−1 that was then multiplied by the cell concentration to obtain the biodegradation rate in M s−1. | ||
The biodegradation rates per cell obtained in the laboratory were expressed in mol s−1 cell−1 (Section 2.1) and were measured for different concentrations of substrates and for two temperatures. Fig. 2 depicts how biodegradation reactions, rates and cell concentrations were considered in the model. The biodegradation rates per cell for formic and acetic acids, formaldehyde and H2O2 at the two different temperatures were used as input data (Fig. 2c). At each time step, the aqueous concentrations of these four compounds evolved temporally in a manner that was dependent on the reactivity and mass transfer; these changes were monitored by the model. For the concentration ranges of these four compounds, the rates of biodegradation per cell varied linearly as a function of the substrate concentrations (see Section 3.1). For this, we created a new routine in the model that read the linear function for formic and acetic acids, formaldehyde and H2O2 and interpolates biodegradation rates per cell for the simulated substrate concentration (Fig. 2b). The estimated biodegradation rates per cell Vcell (mol s−1 cell−1) for each compound were multiplied by the concentration of cells Ccell (cells L−1) in the cloud water to derive the final biodegradation rates Vbiodegradation (M s−1):
 | (1) |
At each time step, the model re-evaluated the biodegradation rates (M s−1) of the four substrates which depended on the substrate concentrations; these rates competed with the chemical losses (M s−1) as calculated by the model of cloud chemistry.
3. Results and discussion
3.1. Experimental biodegradation rates
The experimental rates measured are listed in Table SM2.† The rates of biodegradation were influenced in different ways by the substrate concentration according to the compound being investigated. Indeed, rates increased linearly with substrate concentration for all compounds except for acetic acid. For the latter, biodegradation rates did not vary with substrate concentration. This linear dependence of the biodegradation rate on substrate concentration confirmed that if the biodegradation rate was kept constant, as in Fankhauser et al.22 and Khaled et al.,23 then this leads to an overestimation for low concentrations and an underestimation for high concentrations. In particular, for formic acid (mostly deprotonated at the considered pH, as acetic acid), which in real cloud water varies from less than 1 to more than 100 μM,42 the biodegradation rate spanned over three orders of magnitude. Considering the variation of biodegradation rate with substrate concentration is essential to understand the effect of microbial activity on cloud water chemistry.Fig. SM4 (ESI S8†) represents the evolution of biodegradation rates as a function of the substrate concentration. The linear functions calculated for each compound are reported in Table SM5.† At 17 °C, the biodegradation rates were higher than for 5 °C, especially at high substrate concentrations. For example, the slope for formic acid was 45-fold higher in summer and for formaldehyde and H2O2, it was 1.5-fold higher than in winter. The biodegradation rate for acetic acid was 3.5-fold higher in summer than in winter.
The experimental biodegradation rates for the selected strains were compared to previous experimental research that evaluated the biodegradation rates of microorganisms in clouds. Many previous research studies involved single strains incubated with a single substrate.17,29,46–49 However, as with the present study, some studies used more complex systems that were closer to cloud environments, including artificial cloud water20 or real cloud samples containing the entire endogenous microflora.21Table 1 lists the biodegradation rates reported in these two previous research studies in comparison with the values obtained in the current research.
| Temperature (°C) | Concentration (μM) | Experimental rates (mol s−1 cell−1) | Calculated rates (mol s−1 cell−1) | ||
|---|---|---|---|---|---|
| Real cloud21 | Pure strains20 | Pure strains | |||
| This work | |||||
| a The last column is relative to the rates determined for the concentration values of these two referenced studies using equations given in Table SM5 in comparison with our current research. | |||||
| Formic acid | 17 | 4.9 | 7.7 × 10⁻¹⁹ | — | 3.8 × 10⁻¹⁸ |
| 17 | 15.0 | — | 0.8–8 × 10⁻¹⁸ | 2.2 × 10⁻¹⁷ | |
| 17 | 33.2 | 6.4 × 10⁻¹⁹ | — | 5.5 × 10⁻¹⁷ | |
| 17 | 42.7 | 1.9 × 10⁻¹⁸ | — | 7.3 × 10⁻¹⁷ | |
| 5 | 15.0 | — | 0.4–5 × 10⁻¹⁸ | 1.7 × 10⁻¹⁸ | |
| Acetic acid | 17 | 4.5 | 4.6 × 10⁻¹⁸ | — | 1.1 × 10⁻¹⁸ |
| 17 | 20.0 | — | 0.4–5 × 10⁻¹⁸ | 1.1 × 10⁻¹⁸ | |
| 17 | 23.2 | 2.2 × 10⁻¹⁸ | — | 1.1 × 10⁻¹⁸ | |
| 17 | 25.4 | 1.4 × 10⁻¹⁸ | — | 1.1 × 10⁻¹⁸ | |
| 5 | 20.0 | — | 0.1–1 × 10⁻¹⁸ | 3.2 × 10⁻¹⁹ | |
| Formaldehyde | 17 | 1.5 | 1.0 × 10⁻¹⁹ | — | 2.2 × 10⁻¹⁸ |
| 17 | 2.7 | 3.7 × 10⁻²⁰ | — | 3.7 × 10⁻¹⁸ | |
| 17 | 6.1 | 1.1 × 10⁻¹⁹ | — | 7.8 × 10⁻¹⁹ | |
| Hydrogen peroxide | 17 | 33.4 | 2.3 × 10⁻¹⁸ | — | 4.0 × 10⁻¹⁸ |
| 17 | 57.7 | 2.5 × 10⁻¹⁸ | — | 6.8 × 10⁻¹⁸ | |
Vaïtilingom et al.20 investigated 17 strains isolated from cloud water and incubated at temperatures relevant for clouds (5 °C and 17 °C). These authors investigated the biodegradation of carboxylic acids at concentrations that were representative of cloud systems. The biodegradation rates for formic and acetic acids varied from 0.8 × 10⁻¹⁸ to 8.0 × 10⁻¹⁸ mol s−1 cell−1 and from 0.4 10−18 to 5 10−18 mol s−1 cell−1, respectively, at 17 °C and 0.4 × 10⁻¹⁸ and 5 × 10⁻¹⁸ mol s−1 cell−1 at 5 °C. Table SM5† shows calculations for biodegradation rates associated with the concentrations of formic and acetic acids for the experiments described by Vaïtilingom et al.20 (15 μM) at 17 °C and 5 °C (Table 1). The rate of biodegradation of formic acid was higher in our study at 17 °C although the rates calculated for formic acid and acetic acid at 5 °C were in the same range as those reported by Vaïtilingom et al.20
Incubations performed by Vaïtilingom et al.21 at 17 °C on real clouds showed that endogenous microorganisms can transform carboxylic acids such as formic and acetic acid but also formaldehyde and H2O2. Interestingly, the biodegradation rates determined in our study are in the same range as those measured by Vaïtilingom et al.;21 this shows that our results can be extrapolated to the real cloud environment which contains thousands of potential substrates and a mix of microbial strains. For formic acid and formaldehyde, we notice that the biodegradation rates observed in our study were higher than those measured in real clouds. The lack of competition between substrates and bacteria, and the pure strain chosen to degrade the targeted compound can explain this statement. Some microorganisms could preferentially degrade substrates other than formaldehyde and formate since other sources of carbon are available in natural clouds.
3.2. Simulations: the effect of biodegradation on aqueous concentrations
Winter and summer simulations present different environmental parameters that can exert strong influences on multiphase chemistry and the mass transfer between gaseous and aqueous phases. First, the mass transfer of all soluble species is modified by temperature (higher solubility with decreasing temperature). Second, the oxidative capacity of the atmosphere is modulated by temperature, actinic flux and the intensity of emissions and depositions. In the present study, very different aqueous HOx (HO˙ and HO˙/O2˙−) radical concentrations were simulated (Fig. SM5a and b†). For HO˙, maximum concentrations during the day were equal to 9.2 × 10⁻¹⁴ M and 2.5 × 10⁻¹⁴ M in summer and winter, respectively. During the night, maximum HO˙ concentrations were around one order of magnitude lower than during the day (8.0 × 10⁻¹⁵ and 3.5 × 10⁻¹⁵ M on average for summer and winter simulations, respectively). Finally, the initial concentrations of the gaseous environment were also notably different with lower concentrations of organic compounds (for weaker emission of isoprene) and of HxOy compounds in the winter scenario (Fig. SM2, Tables SM4 and S7d†). This led to a very contrasted multiphase chemical composition and reactivity in the simulated clouds.Model results for all simulation cases are presented in Fig. 3 which shows the time evolution of formic and acetic acids, formaldehyde and H2O2 concentrations in the aqueous phase. As expected, differences were evident between the two seasonal scenarios in terms of oxidative capacity and organic content.
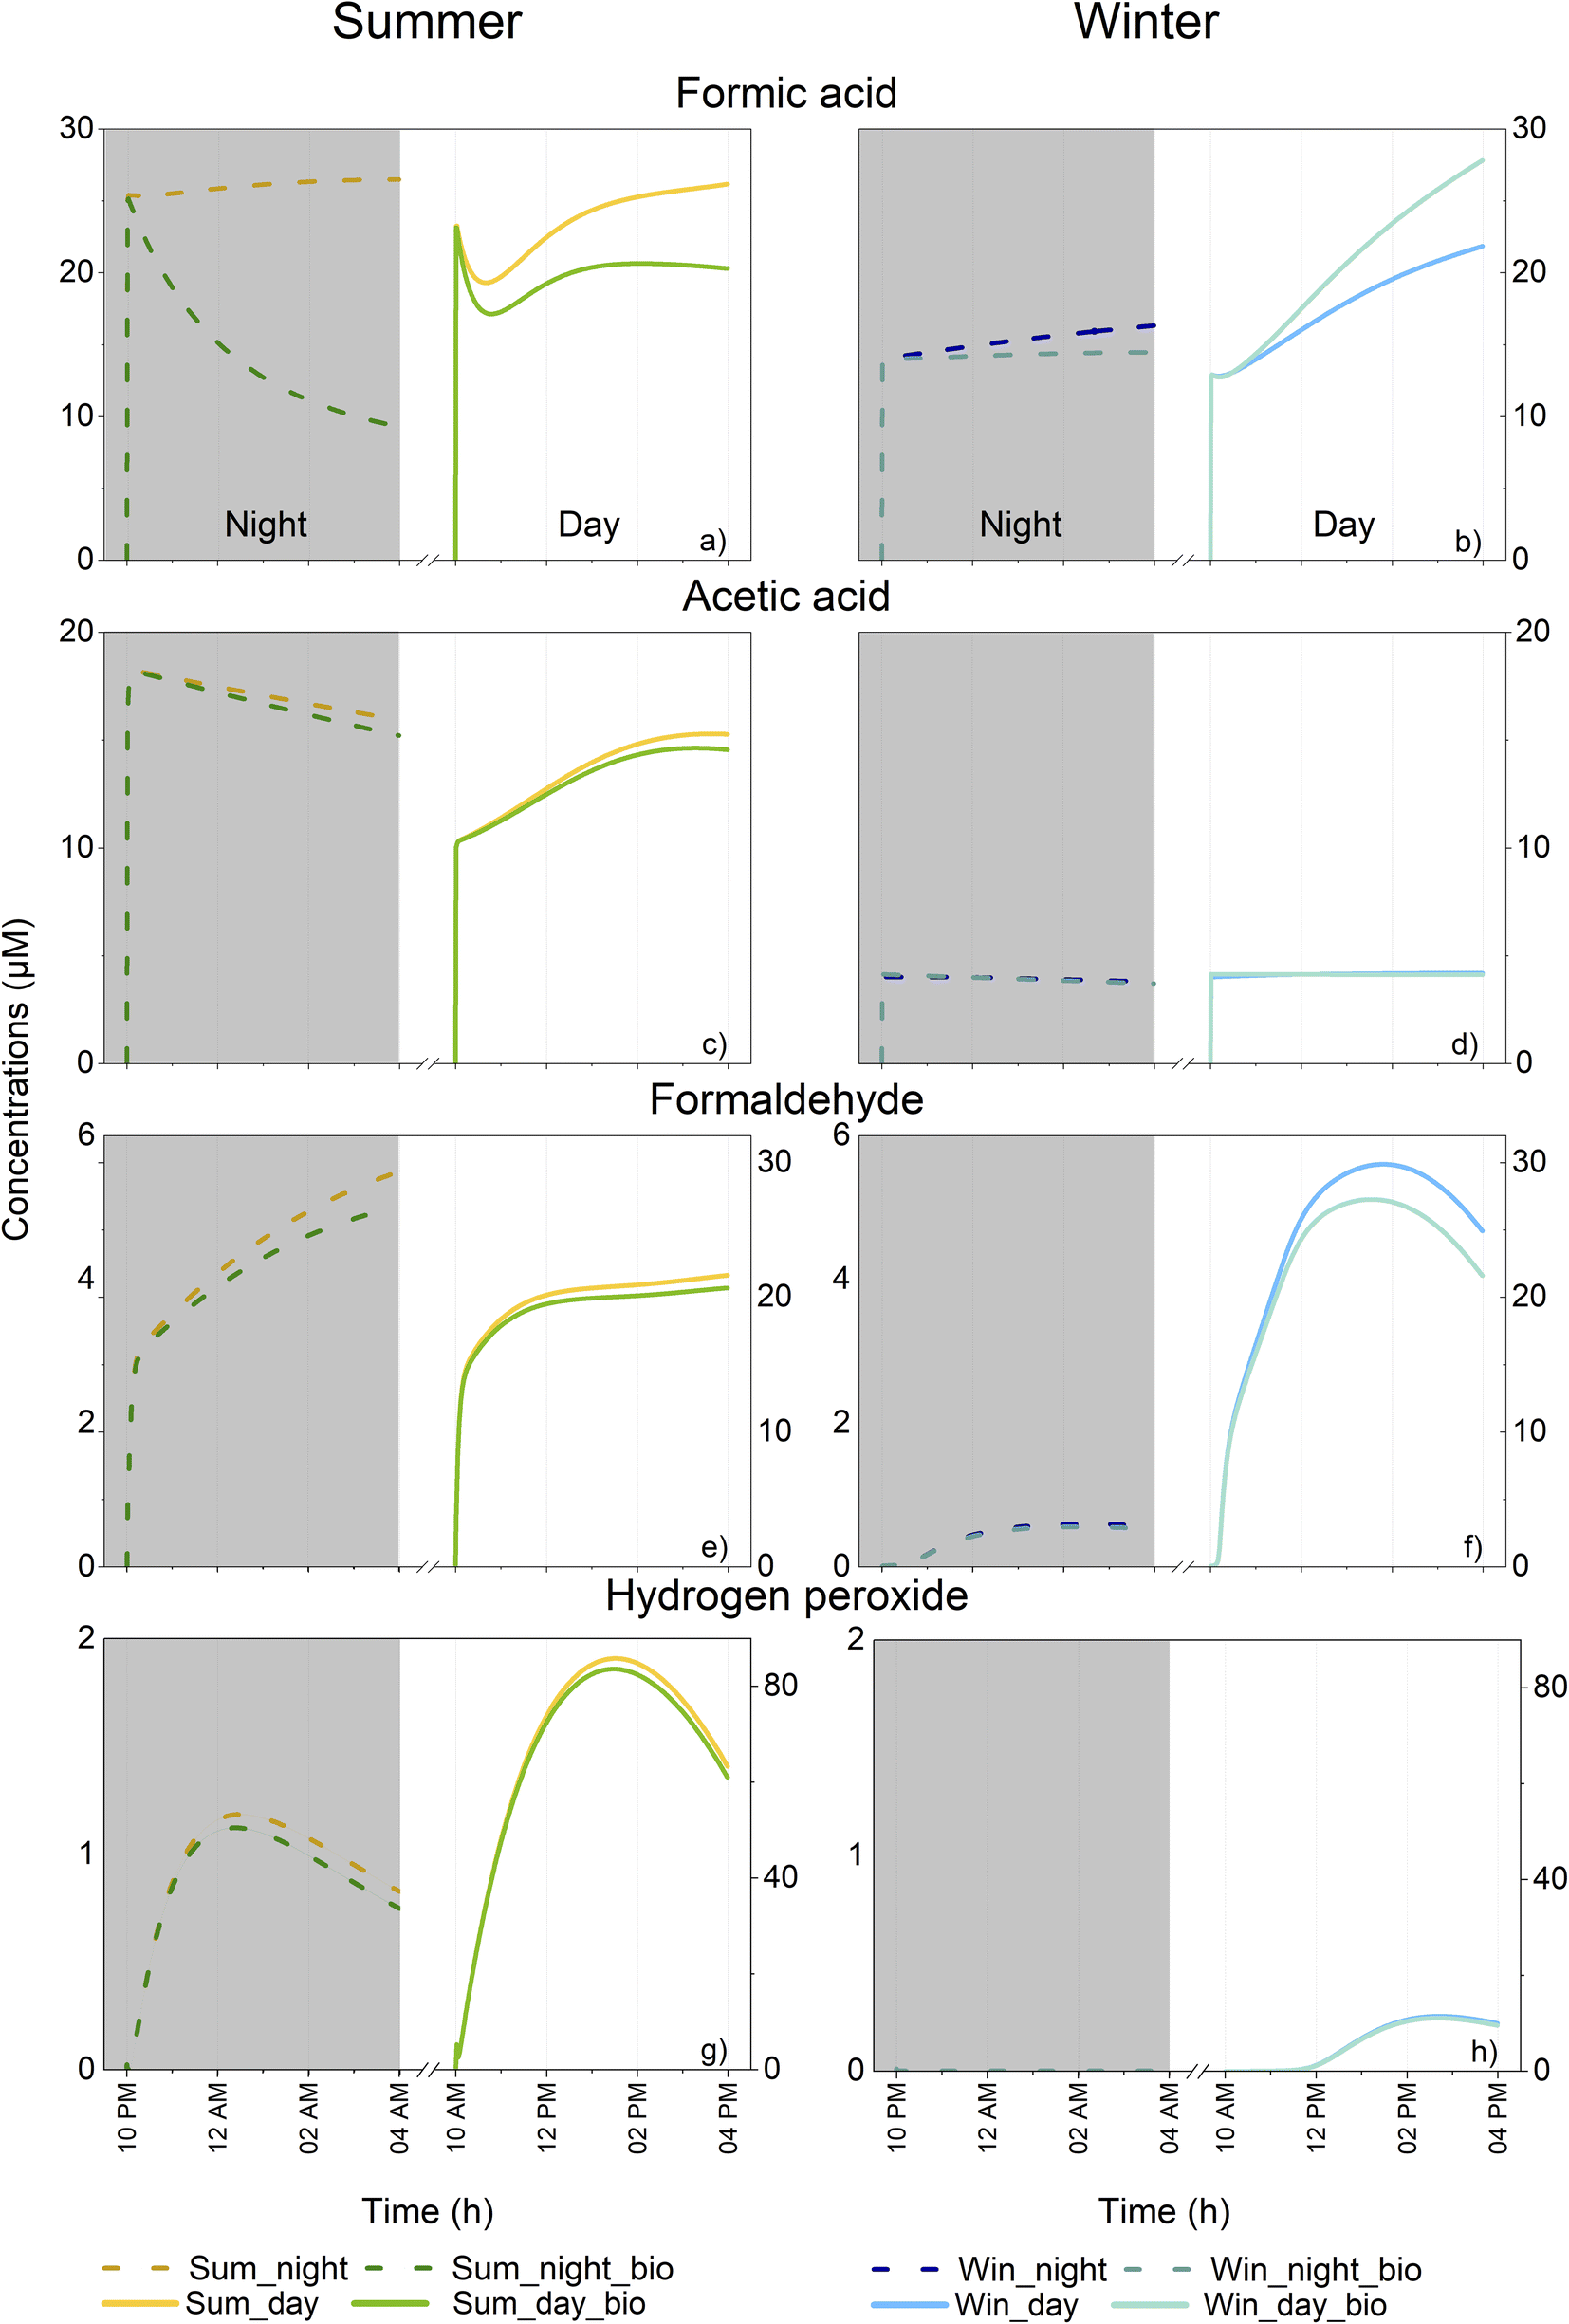 | ||
| Fig. 3 Time evolution of the concentrations in the aqueous phase (μM) of formic and acetic acids, formaldehyde and hydrogen peroxide for summer (left) and winter (right) simulations at night (dashed line) and day (solid line). Each simulation was performed with and without the consideration of biodegradation. Note that a secondary scale for formaldehyde and hydrogen peroxide concentrations is used to represent their lower concentrations at night. | ||
During the day, formic acid concentrations presented different temporal profiles depending on the scenarios involved. Reduced concentrations were observed at the beginning of the summer simulation (from 23 to 19 μM) followed by an increase to 26 μM (Fig. 3a). Formic acid concentration for the winter simulations increased with time (from 13 to 22 μM) (Fig. 3b). Even if the solubility of gaseous formic acid was elevated during winter, its initial aqueous concentration was higher in summer (23 μM vs. 13 μM); this is due to the higher concentration of formic acid in the gas phase during summer (Table SM4†). The same tendency was observed for night-time simulations with a more elevated initial concentration in summer vs. winter and a small production of formic acid for both scenarios (from 25 to 26 μM in summer and from 13.5 to 14.5 μM in winter). In summer, accounting for biodegradation rates in the model had a strong impact on formic acid concentration and induced a loss of 23 and 65% during the day and night, respectively. For daytime simulation, the temporal evolution of formic acid concentration followed the same trend either with or without the consideration of biodegradation; for night-time conditions, a trend inversion was observed and formic acid was consumed. This means that the production observed in the case without microorganisms was largely reduced by biodegradation. In winter, the night-time concentration of formic acid was also impacted with a clear reduction of 11% at the end whereas during the day, an increase was observed (a 22% increase, from 22 to 28 μM).
As with formic acid, the concentrations of acetic acid were higher during summertime (Fig. 3c and d). For both scenarios, acetic acid was produced during the day and was consumed during the night. A maximal increase was observed during the summer (from 10 to 15 μM). Incorporating biodegradation in the model led to a small deviation in the acetic acid concentration (5% of the maximal reduction for daytime summer conditions at the end of simulation).
In contrast to the two previous compounds, formaldehyde was more concentrated in the aqueous phase during winter than during summer for daytime simulations (maximal concentrations of 22 μM in summer and 30 μM in winter) (Fig. 3e and f). During the night, concentrations were much lower due to the low gaseous mixing ratios of formaldehyde (Table SM4†). Formaldehyde was produced during both night and day simulations, irrespective of the season involved. Biodegradation exerted only a slight effect on the daytime concentration of formaldehyde during the summer (a 5% decrease) and winter (a 14% decrease).
For daytime simulations, the time evolution of H2O2 concentration was characterized by a bell-shaped curve for all simulations reaching up to 86 μM in summer (Fig. 3g) and 11 μM in winter (Fig. 3h), respectively. Simulations for night-time conditions presented with lower maximal concentrations (1.2 μM for summer and 3.1 × 10⁻⁴ μM for winter). For all simulations, concentrations of H2O2 were not strongly impacted by biodegradation with the highest reduction of H2O2 equal to 12% at the end of the night-time summer simulation.
3.3. Simulations: analysis of sources and sinks
To assess the role of biology in cloud chemistry in a quantitative manner, we investigated the sinks and sources of the targeted compounds as a function of time by calculating the production and degradation rates (in M s−1). Fig. 4 represents these rates integrated throughout the duration of the simulation (6 h). The first 10 minutes of the simulation were not considered since they correspond to the period required for the multiphase chemical system to reach its equilibrium (i.e., mass transfer). Only chemical reactions whose contributions to total degradation and production rates exceeded 1% were considered. In total, for all simulations, the selected reactions represent more than 97% of the total production/degradation rates. | ||
| Fig. 4 Aqueous chemical budgets for formic and acetic acids, formaldehyde and H2O2 during summer and winter simulations at day and night, with or without biodegradation. Production rates (positive values) and destruction rates (negative values) were integrated over the entire simulation (the first 10 minutes were excluded in these calculations). Chemical (blue) and biological (light green) sources are presented together with the chemical (yellow) and biological (green) sinks. The equilibrium for the formaldehyde budget is marked in pink. Mass transfer is presented in orange. Ox: oxidants; “Org + Ox”: a sum of organic compounds reacting with oxidants; “HO2˙ self-reaction”: reaction of HO2˙/O2˙− with itself; HMS: hydroxymethanesulfonate. Note that the scale for the rates is different for simulations at day and night. | ||
First, as expected, the calculated rates for daytime were higher than those evaluated for night-time since photochemistry induced more efficient kinetic transformations. For daytime simulations, these fluxes were more important in summer than in winter due to a higher temperature and actinic flux.
When biodegradation was considered, an additional sink and source for formic acid were added. Indeed, the biodegradation of formaldehyde also produces formic acid. In summer, this supplementary sink induced a reduction in the concentration of formic acid (for both day and night). At night, biodegradation was the main sink for formic acid (81% in summer). Note that for this condition (summer, night), biodegradation modifies the HOx budget. A weak increase of the HO˙ concentration is simulated with biodegradation (Fig. SM5a†): HO˙ is less consumed by formic acid that is biodegraded. The opposite trend is observed for the HO2˙/O2˙− concentration (Fig. SM5b†) that is slightly lower with biodegradation: when considering biodegradation, the oxidation formate by HO˙ producing O2˙− is reduced. In winter, the biodegradation rate was lower than in summer and then the contribution of biodegradation was reduced. However, at night, this remained a significant sink (approximately 50%) and represented a source of formic acid (13%). During the day, the concentrations increased due to the new source of formic acid induced by formaldehyde biodegradation (representing approximately 50% of the total source).
Surprisingly, even if the concentration of acetic acid in the aqueous phase did not change significantly, as shown in Fig. 3c and d, biodegradation remained a non-negligible sink for acetic acid. Considering the sinks of acetic acid, in the presence of microorganisms, we observed a reduction in the contribution of mass transfer for all simulations except for winter night-time simulation where the mass transfer became a source of acetic acid. As simulated for formic acid, the relative contribution of biodegradation to the total sink was higher at night for both seasons (from 34 to 56% in summer and from 64 to 98% in winter simulation) (Fig. 4c and d).
During the day, formaldehyde biodegradation represents a significant sink as its relative contribution was approximately 56% in summer and 80% in winter (Fig. 4f). At night, the role of microorganisms was even stronger than for daytime simulation and its contribution exceeded 98% in summer and 44% in winter (Fig. 4e). This sink is so important that mass transfer was reversed.
Biodegradation did not significantly impact the chemical budget for H2O2. This confirms the absence of the impact of biodegradation on the time evolution of concentration (Fig. 3).
Fig. 5 compares the biotic and abiotic sinks (relative contribution in %) for the four compounds investigated when neglecting mass transfer. By this comparison, we aimed to compare chemical and biological transformations in the cloud aqueous phase. First, even if the concentration of formic acid was strongly impacted by biodegradation, photochemistry was dominant for most of the simulations. It is important to note that during the summer simulation, the concentration of HO˙ was especially strong and the rate constant for formate (dominant form at pH 5.5) was approximately 30-fold higher than for formic acid. The significant contribution of microorganisms was, nevertheless, observed for night-time simulations. Acetic acid and formaldehyde biodegradation was far more efficient than their chemical transformations. The main abiotic sink was HO˙ oxidation and was between 25- and 100-fold lower than the values observed for formate; this was because their kinetic constants with HO˙ were weaker. H2O2 was significantly impacted by biodegradation in the summer simulation but only during the daytime.
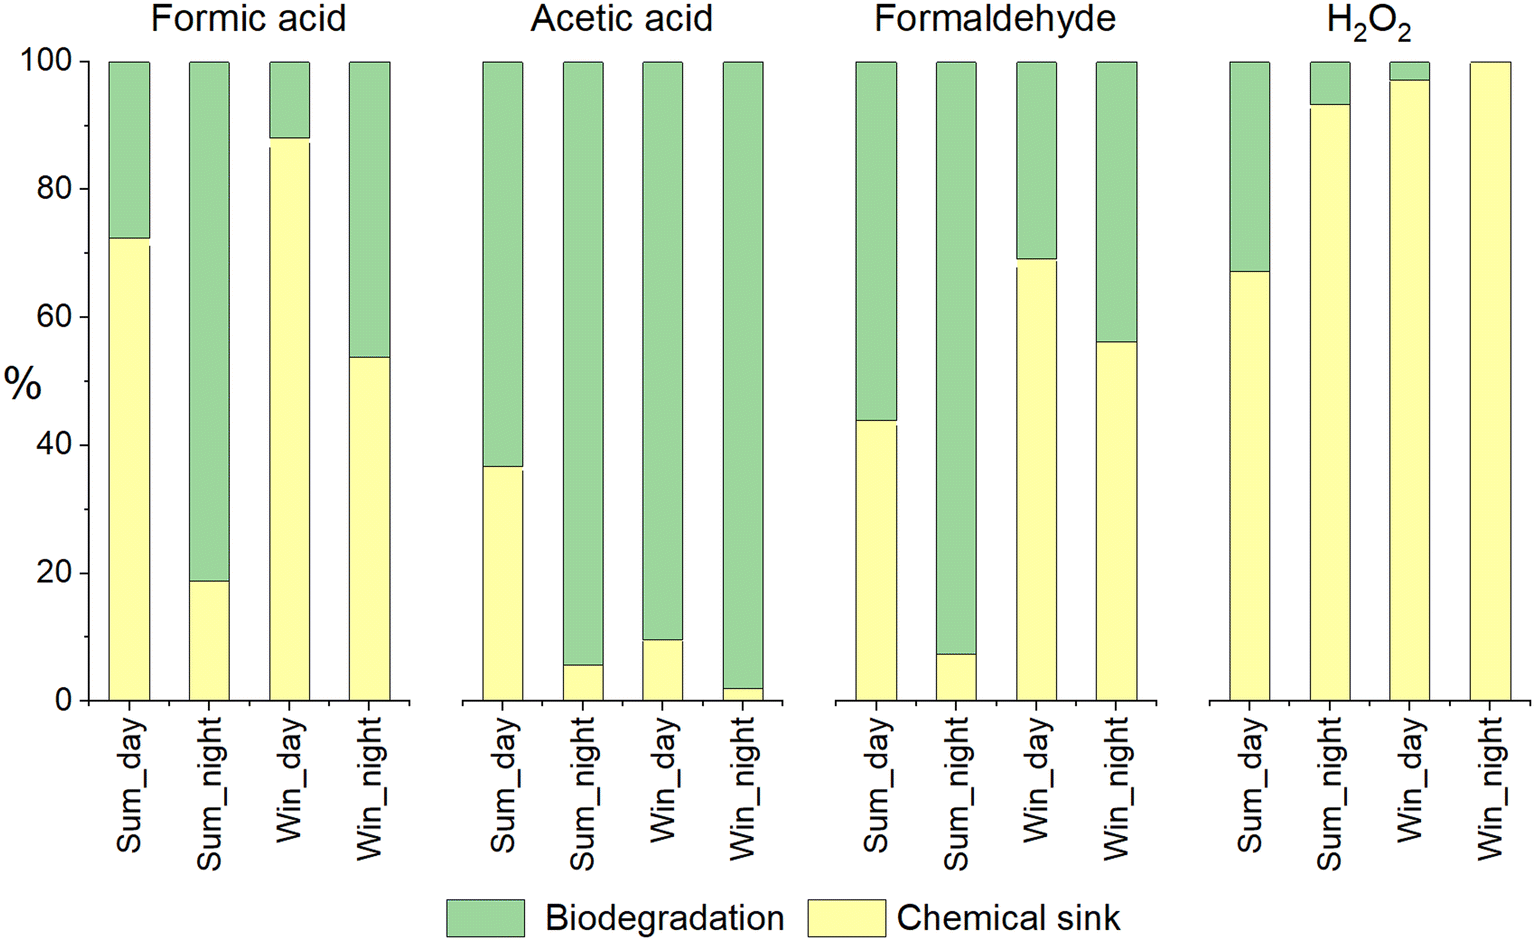 | ||
| Fig. 5 The relative contributions of chemical (yellow) and biological (green) sinks in the percentage of total chemical sinks. Here, mass transfer was not considered. | ||
3.4. Simulations: analysis of the biodegradation efficiency on multiphase cloud chemistry
Next, we aimed to evaluate the role of aqueous phase transformations in the multiphase cloud chemical budget (gas phase + aqueous phase). To this extent, we analyzed the concentrations of the total species (the sum of the aqueous and gas phase concentrations in molecules cm−3) (Fig. 6a–d) and the mean rates of sources and sinks of the total species (in molecules cm−3 s−1) (Fig. 6e–h) for the summer simulations (day and night). We decided to focus this analysis on the summer scenario since biodegradation rates made the largest contribution to the aqueous degradation of the targeted species.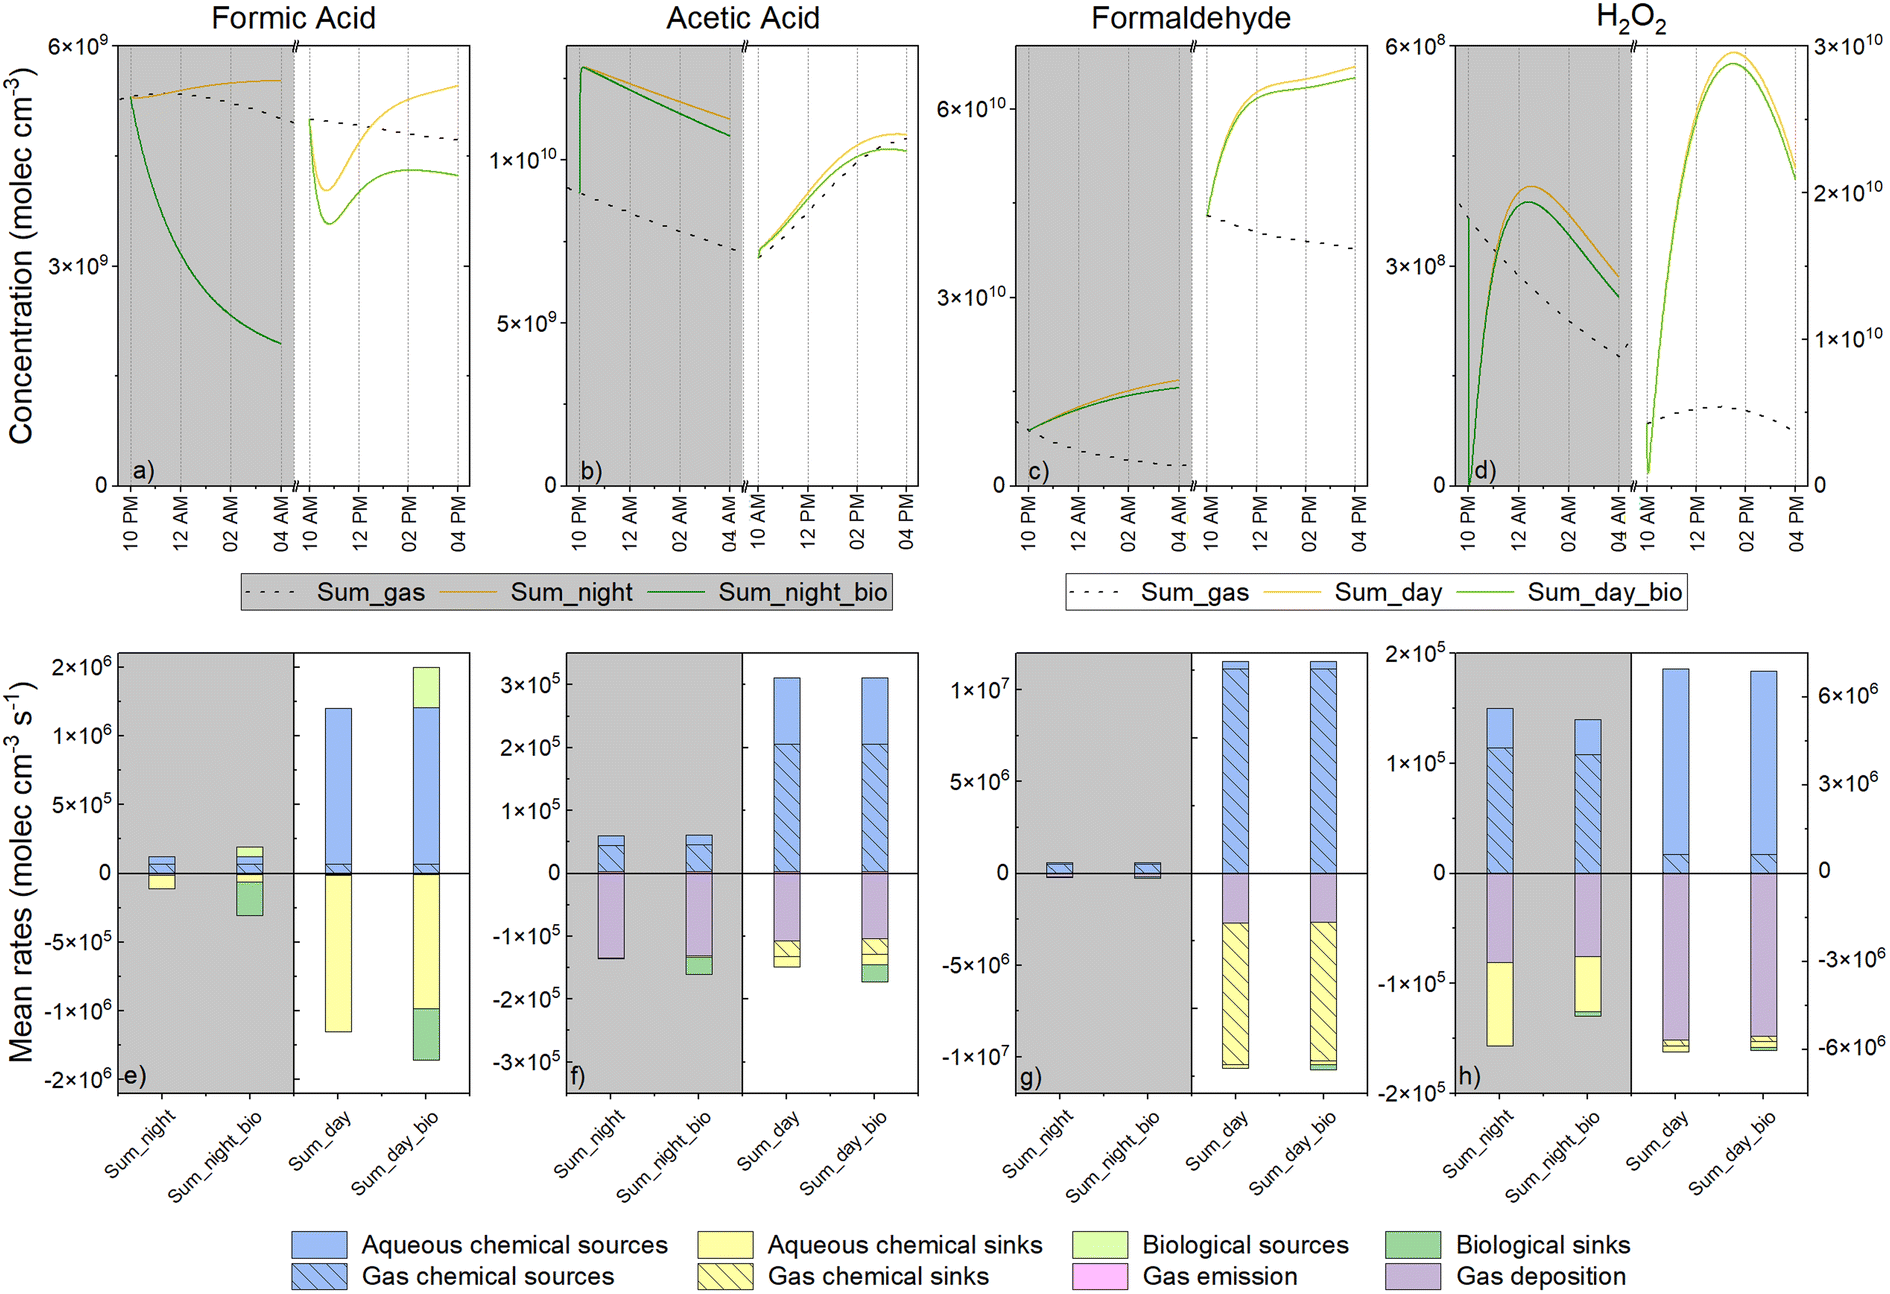 | ||
| Fig. 6 Total concentration (top) and total chemical budget (bottom) of the four compounds (formic and acetic acids, formaldehyde and H2O2) used in simulations. The total concentration is the sum (in molecules cm−3) of the aqueous and the gas phase concentrations of different simulations with (green) and without (yellow) consideration of biodegradation. The total chemical budget considers the aqueous transformations: chemical sinks (yellow) and sources (blue) and biodegradation (green); and the gas phase transformations: the chemical sinks (hatched yellow) and sources (hatched blue) as well as the emission (pink) and deposition (purple) processes. The mass transfer was zero as it balanced between the gas and the aqueous phase. | ||
First, when considering the simulations without biodegradation, we noted that the presence of cloud strongly modified the total concentrations of the targeted species. Formic acid was produced much more efficiently by aqueous phase chemistry than via gas phase reactivity (Fig. 6e). At the end of the simulations, the total concentrations of formic acid in comparison with the clear sky simulations (i.e., without cloud) were enhanced by 15% and 10% for daytime and night-time simulations, respectively (Fig. 6a). Similarly, during the day, H2O2 was predominantly produced in the aqueous phase thereby strongly enhancing its total concentration (maximal concentration was approximately 5-fold higher) (Fig. 6d). Aqueous chemical sources led to a slight increase in the concentration of acetic acid during the day (Fig. 6b). At night, the instantaneous production of acetic was observed at the beginning of the simulation due to the reaction of peracetic acid with HSO3− quickly producing acetic acid in the aqueous phase; however, afterwards, the consumption rates were similar with or without clouds because gas phase acetic acid deposition was the dominant sink (Fig. 6f). Formaldehyde chemistry was mainly driven by gas-phase chemistry although aqueous reactivity induced a global production increase of 43% and 41% during the day and night, respectively.
As observed in Section 3.3. analyzing the aqueous phase chemistry, total H2O2, formaldehyde and acetic acid concentrations were less affected when considering biodegradation (Fig. 6b and d) than formic acid. Formic acid is so importantly degraded by microorganisms in the aqueous phase that the total species is impacted, especially at night. At the end of the simulations, reductions of 23% and 66% were simulated in the total formic acid concentration for day and night runs, respectively, in comparison to abiotic simulations (Fig. 6a). This degradation would have been more important if formaldehyde biodegradation did not induce such an efficient production of formic acid (19% and 35% during the day and night, respectively) (Fig. 6e).
3.5. Simulations: the sensitivity of LWC, pH and cell concentration
The implementation of biodegradation rates in the model demonstrated that these rates may represent a significant sink in the aqueous phase, thus leading in some cases to a perturbation of the concentration in the gas phase with a consequential impact on the global chemical budget. In the preceding sections, various chemical scenarios were presented (winter vs. summer, day vs. night), but other relevant parameters could strongly perturb the physicochemical processes occurring in clouds, such as microphysical properties, acidity and microbial load. The aim of this next evaluation was to determine how these parameters may modulate the contribution of biodegradation in clouds. The different sensitivity tests are presented in Table SM6.†The concentrations and chemical budgets in the aqueous phase only are presented in Fig. SM6 and SM7.†Fig. 7 illustrates the total concentration (aqueous + gaseous phase concentrations) and total chemical budget of formic acid (considering these two phases). Fig. SM8, SM9 and SM10† present the same results for acetic acid, formaldehyde and H2O2, respectively. The most significant conclusions arising from these findings are discussed below.
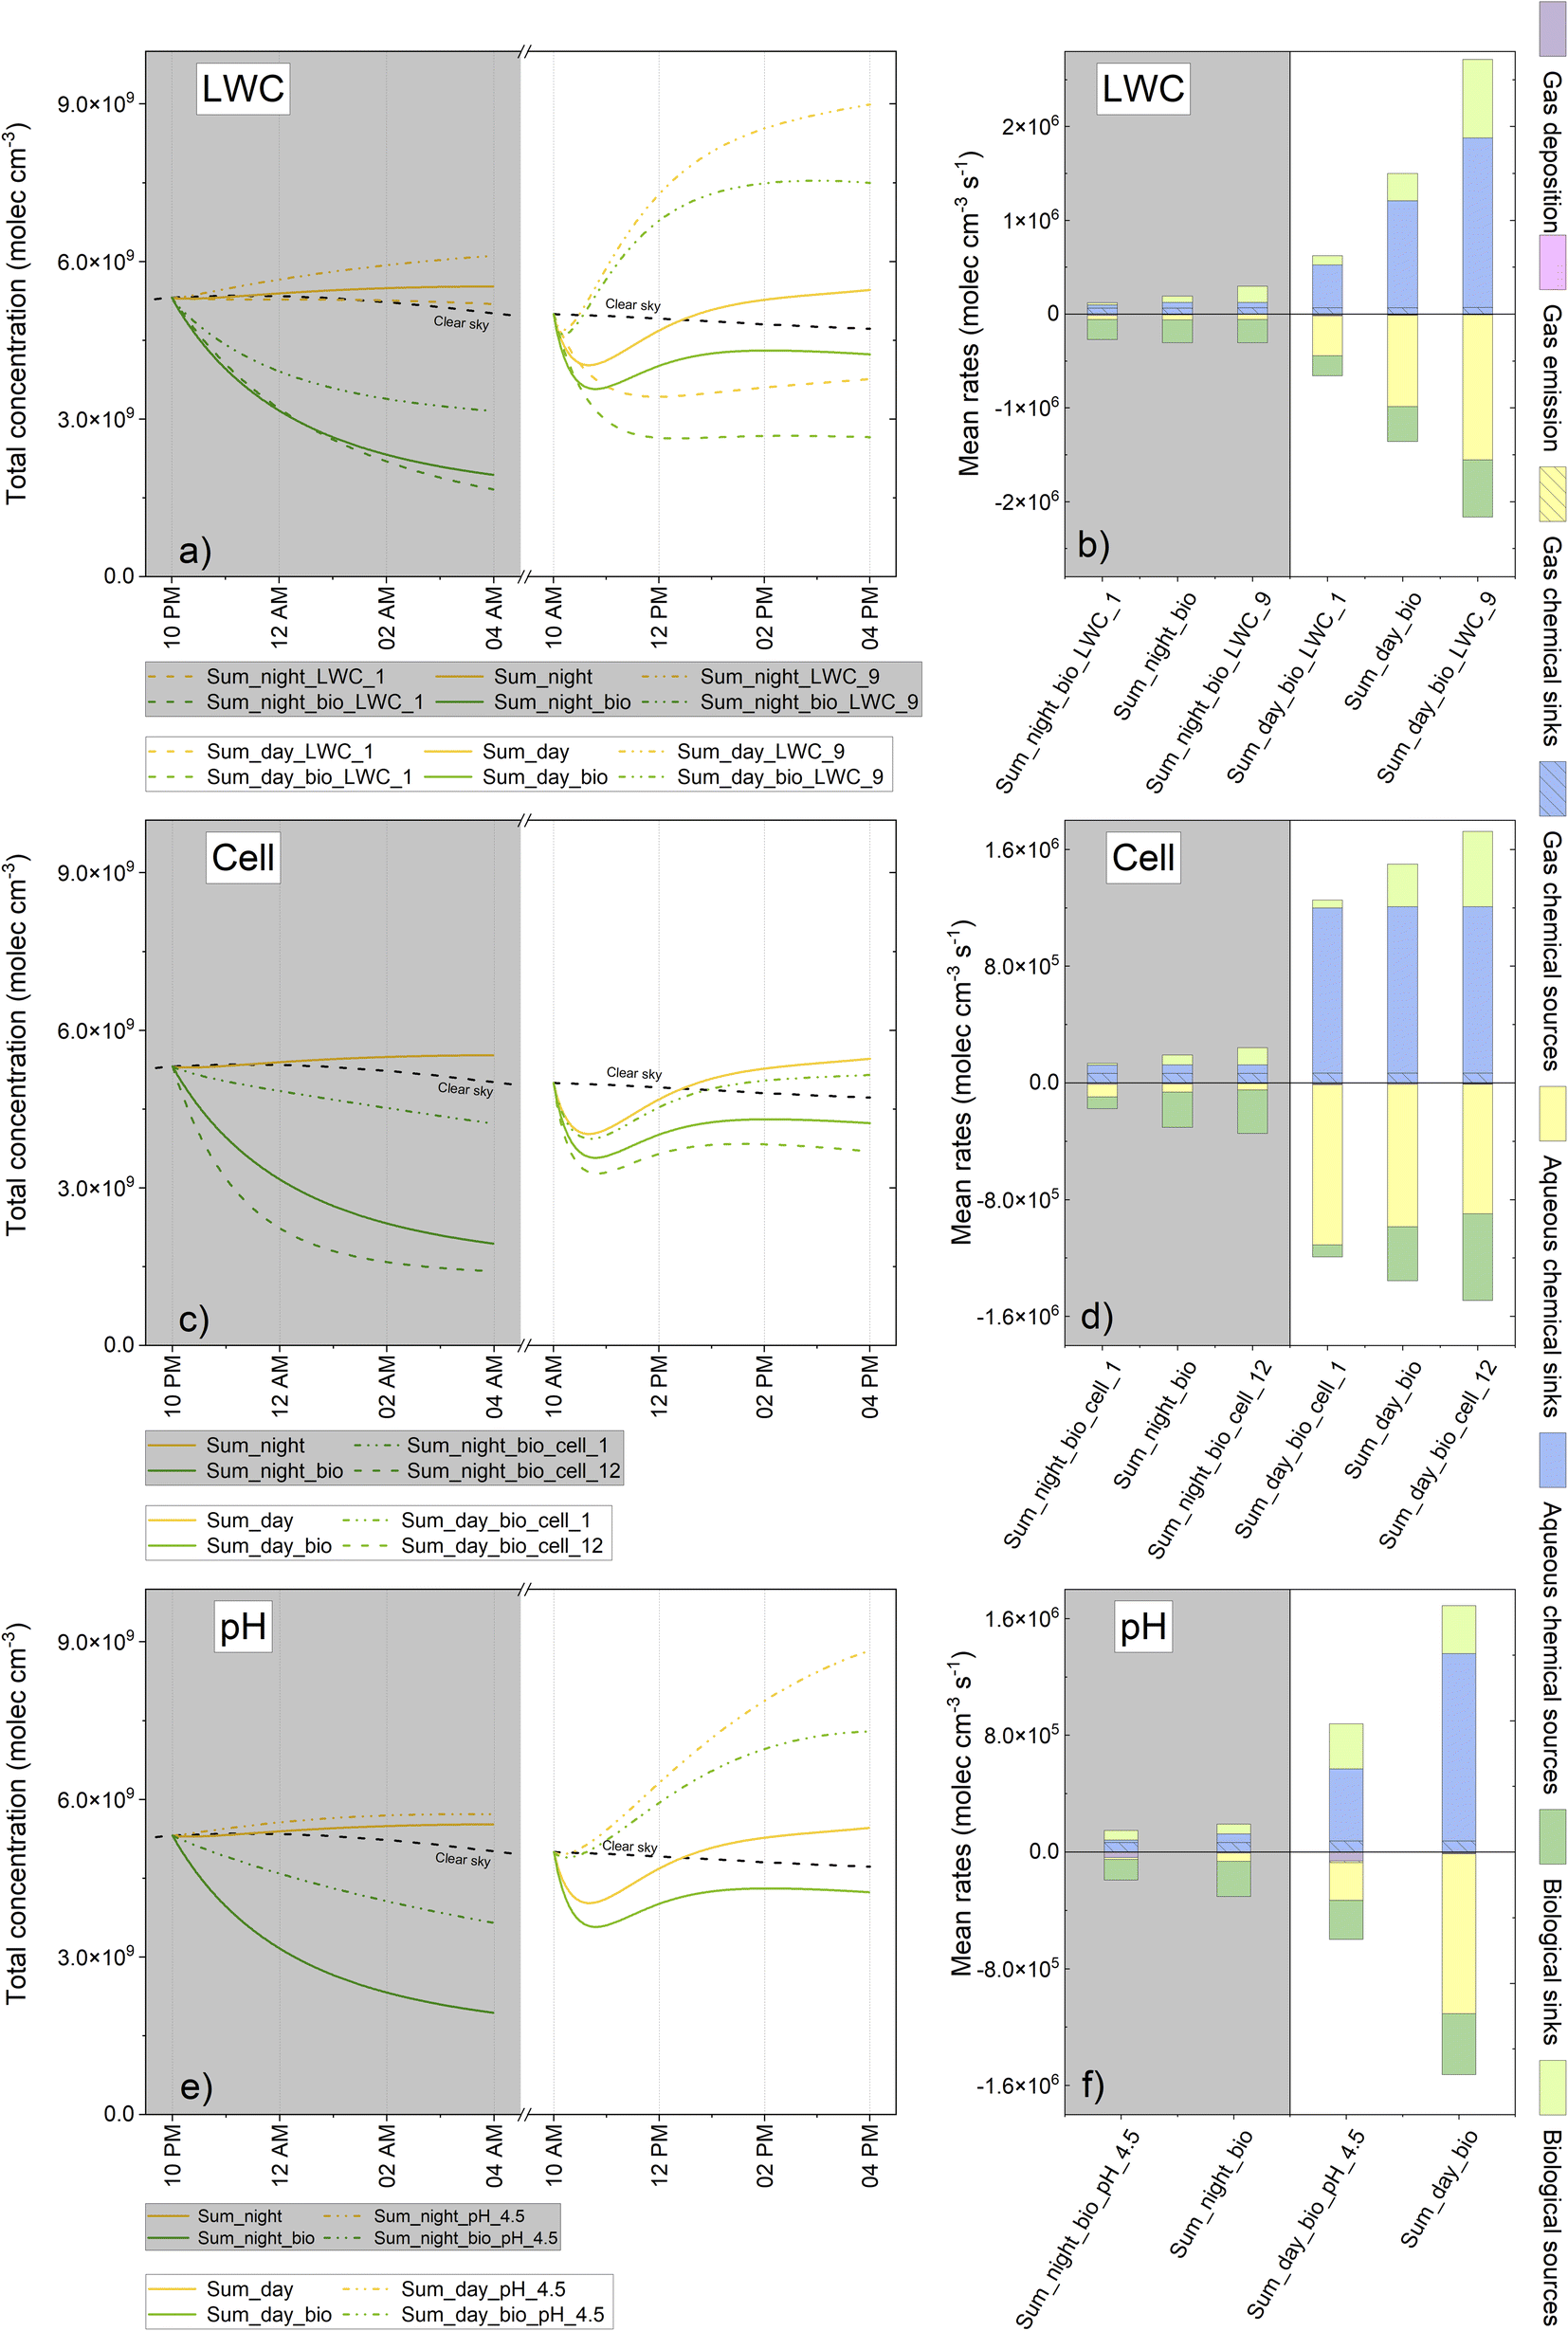 | ||
| Fig. 7 Total concentrations (left) and multiphase chemical budgets (right) for formic acid when considering the LWC (“_LWC_1”: 1 × 10⁻⁷ v/v; ”_LWC_9”: 9 × 10⁻⁷ v/v), the cell concentration (“_cell_1”: 1.27 × 10⁴ cells mL−1; “_cell_12”: 12.35 × 10⁴ cells mL−1) and the pH variations (“_pH_4.5”: 4.5). The total concentration is the sum (in molecules cm−3) of the aqueous and the gas phase concentrations of the different simulations with (green) and without (yellow) biodegradation. The total chemical budget considers the aqueous transformations: chemical sinks (yellow) and sources (blue) and biodegradation (green); and the gas phase transformations: the chemical sinks (hatched yellow) and sources (hatched blue) as well as the emission (pink) and deposition (purple) processes. The mass transfer was zero as it balanced between the gas and the aqueous phases. | ||
As illustrated in Fig. SM6a–d,† modifying the LWC significantly impacted upon the aqueous phase concentration of organic compounds. The higher the LWC, the more diluted the droplet was and vice versa. Thus, the mean chemical rates (sinks and sources) exhibited a global decrease as the LWC increased; this was the case for all chemical species (Fig. SM7a–d†).
For formic acid, the low cloud LWC favored the role of microorganisms in the aqueous phase. Indeed, biodegradation rates were enhanced when the substrate concentration increased; biodegradation relative contributions to the aqueous phase sinks increased from 28 to 39% during the day and from 81 to 83% during the night when modifying the LWC from 3 × 10⁻⁷ to 1 × 10⁻⁷ v/v, as reported in Fig. SM7a.† The aqueous phase concentration of formic acid was therefore more strongly impacted by microorganisms for low LWC (Fig. SM6a†). When considering the total concentration (aqueous + gaseous phase concentrations) (Fig. 7a), conclusions were different: with an elevated LWC, the aqueous chemical fluxes (sinks and sources) were enhanced since more chemical species were transferred into the aqueous phase (Fig. 7b). Therefore, even if the efficiency of biodegradation was more important at a lower LWC, the impact of the cloud on the total concentration was higher when the LWC increased. The contribution of biodegradation to the total degradation rates was very similar for each test on the LWC (around 30 and 80% of the total sinks during the daytime and night-time, respectively, according to Fig. 7b). Furthermore, biodegradation led to a slightly stronger loss of the total concentration at the end of the simulations for lower LWC during the day (from 20 to 29% for a LWC of 9 × 10⁻⁷ and 1 × 10⁻⁷ v/v, respectively, according to Fig. 7a). During night-time, this total concentration loss varied between 50 and 70% for all simulations.
Regarding acetic acid, the rate of biodegradation was not concentration dependent and remained constant; therefore, the role of microorganisms in the aqueous phase was more competitive for a higher LWC (from 21 to 97% of the aqueous degradation mean rates for LWC from 1 to 9 × 10⁻⁷ v/v at night and from 11 to 77% at daytime) since other sink fluxes were reduced (Fig. SM7b†). When considering the total chemical budget, the observed tendency was almost the same. The major difference was the additional sink for deposition formed by the main sink. Consequently, the total concentration (aqueous + gaseous phase concentrations) was more impacted at 9 × 10⁻⁷ v/v (a loss of 11 and 8% concentration at the end of the simulation for day and night, respectively, when considering biodegradation) than at 1 × 10⁻⁷ v/v (9% at day and less than 1% of concentration at night) (Fig. SM8a†).
For formaldehyde, the aqueous phase production was much higher when the LWC decreased; the mass transfer was modulated, and the aqueous concentrations remained weakly modified for the different tests (Fig. SM7c†). The rates of biodegradation were almost the same for different LWCs, thus inducing a more important sink contribution at a higher LWC in the aqueous phase. The total concentration of formaldehyde was mostly driven by gas phase chemistry (Fig. SM9b†); however, at an LWC of 9 × 10⁻⁷ v/v—, the contribution of aqueous phase chemistry was higher; thus, biodegradation induced a significant reduction of total formaldehyde, especially during the day.
When considering H2O2, the variation of LWC values did not exert a strong impact on the aqueous phase concentration (Fig. SM6d†). We observed a slightly more important contribution of biodegradation in the aqueous phase at a higher LWC since other sinks in the aqueous phase were reduced (Fig. SM7d†). We found that the total H2O2 concentration was maximal at 9 × 10⁻⁷ v/v because the aqueous production of H2O2 was more efficient (Fig. SM10a†). Total concentration was more impacted at a higher LWC although biodegradation did not seem to exert a significant impact on the total chemical budget of H2O2 (Fig. SM10b†).
Modifying the cell concentration led to a significant effect on the aqueous concentrations of formic acid. For example, considering the highest cell concentration, the concentrations of formic acid were reduced by 14% (day) and 27% (night) compared to reference simulations (Fig. SM6e†). For the lowest cell concentration, we still noted a reduction in the aqueous concentrations of formic acid, especially for night-time conditions. As with the reference simulations, we observed that the aqueous concentrations of formaldehyde, acetic acid and H2O2 were not significantly affected by the modulation of cell concentration (Fig. SM6f–h†).
Analyzing the chemical budget in the aqueous phase clearly indicated that for formaldehyde and acetic acid, the contribution of biodegradation to the aqueous sinks became more dominant for the highest cell concentrations even during the day with maximal irradiation (Fig. SM7f and g†). This finding remained unchanged for H2O2 even when we increased the cell concentration (Fig. SM7h†). For the lowest cell value and for all compounds, the contribution of biodegradation was no longer a dominant sink except for formic acid during the night.
The same conclusions were drawn with regard to the total concentrations of different compounds (Fig. 7c, SM8c, SM9c and SM10c†) with only a visible effect on cell concentrations on formic acid budget and concentrations (Fig. 7c and d).
pH influenced aqueous phase chemistry and modified mass transfer by controlling the solubility of acidic compounds. The effective Henry's law constants for formic and acetic acids reduced by factors of 9 and 4, respectively, at 17 °C when modifying the pH from 5.5 to 4.5 (Table SM7†). This explains why the aqueous phase concentrations for formic and acetic acids were more than two-fold lower at pH 4.5 (Fig. SM6i and j†).
For formic acid, this lower concentration induced a reduction in the rate of biodegradation (approximately 40% lower than at a higher pH) (Fig. SM7i†). The degradation of formic acid by the HO˙ radical was also reduced since the acidic form was the dominant form and presented with a kinetic constant with a HO˙ concentration that was 30-fold lower than that of the anionic form (ESI S7a, reactions R264 & R265†). Therefore, the relative contribution of biodegradation to the aqueous sinks was higher than at pH 5.5 (28 and 81% for pH 5.5 during the night and day, respectively, and 51% and 92% for pH 4.5 during the night and day, respectively) (Fig. SM7i†). Furthermore, the aqueous concentration of formic acid was impacted by biodegradation to a lesser extent (Fig. SM6i†). During the day, without biodegradation, the total concentration of formic acid increased with decreasing pH because the aqueous phase consumption processes are far less efficient (Fig. 7f). At the end of the simulation, even considering biodegradation, the total formic acid concentration was reduced by a lesser extent at pH 4.5 than at pH 5.5 (Fig. 7e).
As observed at pH 5.5, the aqueous concentration of acetic acid was not significantly impacted by the microorganisms at a lower pH (Fig. SM6j†). When considering the aqueous chemical budget (Fig. SM7j†), the degradation by HO˙ became negligible because the concentration of HO˙ was slightly lower (Fig. SM11†) and the oxidation rate of the acidic form was 7-fold lower than that for the basic form (ESI S7a, reactions R322 & 323†). The relative contribution of biodegradation consequently became more important in the aqueous degradation of acetic acid; during the day, this contributed to 49% of its consumption and became dominant (99%) during the night (Fig. SM7j†). The total concentration of acetic acid was not significantly impacted when the pH was reduced (Fig. SM8e†).
The aqueous concentration of formaldehyde was slightly reduced at pH 4.5 due to less efficient aqueous production (Fig. SM6k and SM7k†); the same tendencies were observed for total formaldehyde concentration and chemical budget (Fig. SM9e and f†).
The H2O2 production in the aqueous phase is mainly driven by the self-reaction of HO2˙/O2˙−which occurred in a pH-dependent manner (ESI S7a, reactions R8 & R9†). The aqueous production of H2O2 was reduced when the pH was reduced (Fig. SM7l†); furthermore, the aqueous concentration also decreased slightly (Fig. SM6l†). As the production in the aqueous phase was reduced, the total concentration was lower at pH 4.5, especially during daytime simulations (Fig. SM10e†). The role of microorganisms did not differ significantly when modulating pH.
4. Conclusion
The biodegradation of the organic species investigated herein competed with abiotic degradation in the aqueous phase for all environmental conditions and became dominant when the water content of the cloud and/or the cell concentration increased. The same effect was observed when the acidity of the droplets increased.The aqueous concentration of formic acid was the most impacted by biodegradation, especially during the night-time. When LWC decreased, the aqueous concentration of formic acid increased further and was thus more impacted by the activity of microorganisms. When the acidity of the droplets increased, the reactivity of the aqueous phase globally decreased; furthermore, the effect of biodegradation on the chemical budget of formic acid became increasingly more important.
Mass transfer was the dominant sink in the aqueous phase and controlled air/droplet exchange for both acetic acid and formaldehyde. Biotic and abiotic transformations in the aqueous phases of these two compounds were far less efficient than for formic acid. Mass transfer became less important at a high LWC because an increase in cell concentration and an increasingly acidic pH induced a more significant contribution of biological activity during the degradation of these chemical species. The production of H2O2 in the aqueous phase during the day was so important that it induced an extremely efficient transfer to the gas phase which represents the dominant sink. Biodegradation competed with the abiotic degradation of H2O2 in the aqueous phase but was less important when compared to the efficiency of mass transfer during the day.
By analyzing the total concentration of the targeted species (gas + droplets) and without considering biodegradation, we observed a significant effect of the cloud with a global increase in concentrations at the end of the simulation by the cloudy processes when compared to clear sky simulations (i.e., without clouds) for all simulations (sensitivity tests included). The only simulation where cloud processes tended to reduce the total concentration was the case of formic acid with a low cloud water content. The consideration of biodegradation rates did not change these conclusions for acetic acid, formaldehyde and hydrogen peroxide. However, for formic acid, the consideration of biodegradation induced a systematic reduction in the total concentration at the end of the simulation when compared to clear sky simulations, except for two simulations: when the LWC was high and when the pH was more acidic.
In this study, we demonstrated the need to modulate the rate of biodegradation according to the substrate concentration. Indeed, as highlighted in this study, the concentrations of chemical species were strongly modulated by different parameters such as the LWC or pH (for acid/base). For low water content (i.e., the aqueous concentrations were high), considering that a constant biodegradation rate could lead to underestimate the contribution of microorganisms in the total budget of the different compounds; for high pH (i.e., the high solubility of carboxylic acids), this assumption can also lead to the same underestimation.
The study of cloud water reported by Vaïtilingom et al.21 highlighted the potential role of biodegradation in cloud chemistry by demonstrating the fact that endogenous microflora can degrade chemical compounds as efficiently as abiotic pathways. The findings of our present study support this conclusion but also highlight the primary role of exchange between the interstitial air and cloud droplets in controlling the transformation processes of chemical compounds. Thus, only the concentration of formic acid was strongly impacted in the cloud by biodegradation; this process was found to be extremely efficient in our study; the concentration of the other three compounds was strongly controlled by mass transfer. The findings of our present study did not support the hypothesis put forward by Vaïtilingom et al.21 and confirmed by Wirgot et al.;19 these groups both stated that the oxidative capacity of the cloud (i.e., H2O2) could be modified by the cloud microflora; H2O2 was only slightly impacted by biodegradation.
Nevertheless, the knowledge on ecology of bacteria in the atmosphere is limited; this implies that, at this moment, modeling studies on the role of microorganisms in atmospheric chemistry still consider rough assumptions. For example, the modulation of biodegradation rates by environmental factors such as light intensity and acidity should be investigated.51 Additionally, little is known also on the preferred degradation of one substrate over another by microorganisms in a complex organic medium. Bacteria are also known to produce substances, such as biosurfactants and siderophores, whose impact on the physics and chemistry (notably heterogeneous) of the cloud is certainly neglected.4,25,52
Even if this work presents some limitations, it allows discussing the possible role of biodegradation in a broader context. Formic acid could be efficiently consumed in warm clouds, at relatively high temperatures (10–20 °C), conditions typically encountered in tropical environments.53 The recent study by Franco et al.54 highlighted the important role of clouds in formic acid production via multiphase reactivity. Their modeling investigations indicated overestimated concentrations of formic acid in the tropics; various reasons were given in this work to explain this statement (especially the elevated isoprene emissions) but biological activity (especially at night) could strongly reduce formic acid levels in these regions. Oppositely, over boreal forests, biological activity would be less effective and overall, the presence of clouds could lead to an increase in formic acid concentrations (for clouds with long enough lifetimes). This could lead to an increase in formic acid levels over these regions and explain the satellite observation of a large source of formic acid in the boreal forest, which models are unable to reproduce.55 More broadly, the approach we developed in this work could become the basis for implementing biological sources and sinks of organic compounds, dependent on environmental conditions, in regional to global chemistry models with the aim of reducing the modeling uncertainties related to the fate of atmospheric organic compounds.
Author contributions
LD, NC and AMD designed the project. LPai and PR were responsible for the modeling and performed the simulations and data analysis. NW, MJ, MS, AB and AJ conducted the laboratory experiments and determined the rates of biodegradation in the model. CMV developed the model to consider biodegradation rates. LPai, PR and LD conducted scientific analyses. LPai, PR and LD prepared the manuscript, analyzed the data, and designed the figures, with contributions from all authors. AB, PA, LPat, CMV, NC, NW, MJ, ML, AMD and NC revised the manuscript.Conflicts of interest
There are no conflicts to declare.Acknowledgements
This research was mainly supported by CEA/CNRS (contract number: CEA CAJ_18-100/C34067 – CNRS 217485). The authors are also grateful to the Agence Nationale de la Recherche (ANR) for its financial support through the BIOCAP project (Reference: ANR-13-BS06-0004). The authors would also like to thank the instrument site CO-PDD belonging to the OPGC observatory (Observatoire de Physique du Globe de Clermont-Ferrand) and the LaMP laboratory (Laboratoire de Météorologie Physique) supported by the Université Clermont Auvergne (UCA) by the Centre National de la Recherche Scientifique (CNRS-INSU) and by the Centre National d'Etudes Spatiales (CNES). The authors also thank I-Site CAP 20–25.References
- M. C. Barth, B. Ervens, H. Herrmann, A. Tilgner, V. F. McNeill, W. G. Tsui, L. Deguillaume, N. Chaumerliac, A. Carlton and S. M. Lance, Box model intercomparison of cloud chemistry, J. Geophys. Res.: Atmos., 2021, 126, e2021JD035486 Search PubMed.
- B. Ervens, Modeling the processing of aerosol and trace gases in clouds and fogs, Chem. Rev., 2015, 115, 4157–4198 CrossRef CAS PubMed.
- P. Bräuer, C. Mouchel-Vallon, A. Tilgner, A. Mutzel, O. Böge, M. Rodigast, L. Poulain, D. van Pinxteren, R. Wolke, B. Aumont and H. Herrmann, Development of a protocol for the auto-generation of explicit aqueous-phase oxidation schemes of organic compounds, Atmos. Chem. Phys., 2019, 19, 9209–9239 CrossRef.
- A. G. González, A. Bianco, J. Boutorh, M. Cheize, G. Mailhot, A.-M. Delort, H. Planquette, N. Chaumerliac, L. Deguillaume and G. Sarthou, Influence of strong iron-binding ligands on cloud water oxidant capacity, Sci. Total Environ., 2022, 829, 154642 CrossRef PubMed.
- H. Herrmann, A. Tilgner, P. Barzaghi, Z. Majdik, S. Gligorovski, L. Poulain and A. Monod, Towards a more detailed description of tropospheric aqueous phase organic chemistry: CAPRAM 3.0, Atmos. Environ., 2005, 39, 4351–4363 CrossRef CAS.
- V. F. McNeill, J. L. Woo, D. D. Kim, A. N. Schwier, N. J. Wannell, A. J. Sumner and J. M. Barakat, Aqueous-phase secondary organic aerosol and organosulfate formation in atmospheric aerosols: a modeling study, Environ. Sci. Technol., 2012, 46, 8075–8081 CrossRef CAS PubMed.
- C. Mouchel-Vallon, L. Deguillaume, A. Monod, H. Perroux, C. Rose, G. Ghigo, Y. Long, M. Leriche, B. Aumont, L. Patryl, P. Armand and N. Chaumerliac, CLEPS 1.0: A new protocol for cloud aqueous phase oxidation of VOC mechanisms, Geosci. Model Dev., 2017, 10, 1339–1362 CrossRef CAS.
- A. Tilgner, P. Bräuer, R. Wolke and H. Herrmann, Modelling multiphase chemistry in deliquescent aerosols and clouds using CAPRAM3.0i, J. Atmos. Chem., 2013, 70, 221–256 CrossRef CAS.
- S. Rosanka, R. Sander, B. Franco, C. Wespes, A. Wahner and D. Taraborrelli, Oxidation of low-molecular-weight organic compounds in cloud droplets: global impact on tropospheric oxidants, Atmos. Chem. Phys., 2021, 21, 9909–9930 CrossRef CAS.
- S. Rosanka, R. Sander, A. Wahner and D. Taraborrelli, Oxidation of low-molecular-weight organic compounds in cloud droplets: development of the Jülich Aqueous-phase Mechanism of Organic Chemistry (JAMOC) in CAABA/MECCA (version 4.5.0), Geosci. Model Dev., 2021, 14, 4103–4115 CrossRef CAS.
- L. Deguillaume, M. Leriche, P. Amato, P. A. Ariya, A. M. Delort, U. Pöschl, N. Chaumerliac, H. Bauer, A. I. Flossmann and C. E. Morris, Microbiology and atmospheric processes: chemical interactions of primary biological aerosols, Biogeosciences, 2008, 5, 1073–1084 CrossRef CAS.
- A.-M. Delort, M. Vaïtilingom, P. Amato, M. Sancelme, M. Parazols, G. Mailhot, P. Laj and L. Deguillaume, A short overview of the microbial population in clouds: Potential roles in atmospheric chemistry and nucleation processes, Atmos. Res., 2010, 98, 249–260 CrossRef CAS.
- M. Joly, P. Amato, M. Sancelme, V. Vinatier, M. Abrantes, L. Deguillaume and A.-M. Delort, Survival of microbial isolates from clouds toward simulated atmospheric stress factors, Atmos. Environ., 2015, 117, 92–98 CrossRef CAS.
- P. Amato, L. Besaury, M. Joly, B. Penaud, L. Deguillaume and A.-M. Delort, Metatranscriptomic exploration of microbial functioning in clouds, Sci. Rep., 2019, 9, 4383 CrossRef PubMed.
- P. Amato, M. Joly, L. Besaury, A. Oudart, N. Taib, A. I. Moné, L. Deguillaume, A.-M. Delort and D. Debroas, Active microorganisms thrive among extremely diverse communities in cloud water, PLoS One, 2017, 12, e0182869 CrossRef PubMed.
- H. Herrmann, T. Schaefer, A. Tilgner, S. A. Styler, C. Weller, M. Teich and T. Otto, Tropospheric aqueous-phase chemistry: Kinetics, mechanisms, and its coupling to a changing gas phase, Chem. Rev., 2015, 115, 4259–4334 CrossRef CAS PubMed.
- S. Husárová, M. Vaïtilingom, L. Deguillaume, M. Traikia, V. Vinatier, M. Sancelme, P. Amato, M. Matulová and A.-M. Delort, Biotransformation of methanol and formaldehyde by bacteria isolated from clouds. Comparison with radical chemistry, Atmos. Environ., 2011, 45, 6093–6102 CrossRef.
- M. Vaïtilingom, P. Amato, M. Sancelme, P. Laj, M. Leriche and A.-M. Delort, Contribution of microbial activity to carbon chemistry in clouds, Appl. Environ. Microbiol., 2010, 76, 23–29 CrossRef PubMed.
- N. Wirgot, V. Vinatier, L. Deguillaume, M. Sancelme and A. M. Delort, H2O2 modulates the energetic metabolism of the cloud microbiome, Atmos. Chem. Phys., 2017, 17, 14841–14851 CrossRef CAS.
- M. Vaïtilingom, T. Charbouillot, L. Deguillaume, R. Maisonobe, M. Parazols, P. Amato, M. Sancelme and A. M. Delort, Atmospheric chemistry of carboxylic acids: microbial implication versus photochemistry, Atmos. Chem. Phys., 2011, 11, 8721–8733 CrossRef.
- M. Vaïtilingom, L. Deguillaume, V. Vinatier, M. Sancelme, P. Amato, N. Chaumerliac and A.-M. Delort, Potential impact of microbial activity on the oxidant capacity and organic carbon budget in clouds, Proc. Natl. Acad. Sci. U. S. A., 2013, 110, 559–564 CrossRef PubMed.
- A. M. Fankhauser, D. D. Antonio, A. Krell, S. J. Alston, S. Banta and V. F. McNeill, Constraining the impact of bacteria on the aqueous atmospheric chemistry of small organic compounds, ACS Earth Space Chem., 2019, 3, 1485–1491 CrossRef CAS.
- A. Khaled, M. Zhang, P. Amato, A. M. Delort and B. Ervens, Biodegradation by bacteria in clouds: an underestimated sink for some organics in the atmospheric multiphase system, Atmos. Chem. Phys., 2021, 21, 3123–3141 CrossRef CAS.
- C. Rose, N. Chaumerliac, L. Deguillaume, H. Perroux, C. Mouchel-Vallon, M. Leriche, L. Patryl and P. Armand, Modeling the partitioning of organic chemical species in cloud phases with CLEPS (1.1), Atmos. Chem. Phys., 2018, 18, 2225–2242 CrossRef CAS.
- H. E. Ahern, K. A. Walsh, T. C. J. Hill and B. F. Moffett, Fluorescent pseudomonas isolated from Hebridean cloud and rain water produce biosurfactants but do not cause ice nucleation, Biogeosciences, 2007, 4, 115–124 CrossRef CAS.
- N. DeLeon-Rodriguez, T. L. Lathem, L. M. Rodriguez-R, J. M. Barazesh, B. E. Anderson, A. J. Beyersdorf, L. D. Ziemba, M. Bergin, A. Nenes and K. T. Konstantinidis, Microbiome of the upper troposphere: Species composition and prevalence, effects of tropical storms, and atmospheric implications, Proc. Natl. Acad. Sci. U. S. A., 2013, 110, 2575–2580 CrossRef CAS PubMed.
- W. Hu, H. Niu, K. Murata, Z. Wu, M. Hu, T. Kojima and D. Zhang, Bacteria in atmospheric waters: Detection, characteristics and implications, Atmos. Environ., 2018, 179, 201–221 CrossRef CAS.
- P. S. Kourtev, K. A. Hill, P. B. Shepson and A. Konopka, Atmospheric cloud water contains a diverse bacterial community, Atmos. Environ., 2011, 45, 5399–5405 CrossRef CAS.
- T. Šantl-Temkiv, K. Finster, B. M. Hansen, L. Pašić and U. G. Karlson, Viable methanotrophic bacteria enriched from air and rain can oxidize methane at cloud-like conditions, Aerobiologia, 2013, 29, 373–384 CrossRef.
- M. Vaïtilingom, E. Attard, N. Gaiani, M. Sancelme, L. Deguillaume, A. I. Flossmann, P. Amato and A.-M. Delort, Long-term features of cloud microbiology at the puy de Dôme (France), Atmos. Environ., 2012, 56, 88–100 CrossRef.
- C. Xu, M. Wei, J. Chen, X. Sui, C. Zhu, J. Li, L. Zheng, G. Sui, W. Li, W. Wang, Q. Zhang and A. Mellouki, Investigation of diverse bacteria in cloud water at Mt. Tai, China, Sci. Total Environ., 2017, 580, 258–265 CrossRef CAS PubMed.
- K. M. Emmerson and M. J. Evans, Comparison of tropospheric gas-phase chemistry schemes for use within global models, Atmos. Chem. Phys., 2009, 9, 1831–1845 CrossRef CAS.
- V. Damian, A. Sandu, M. Damian, F. Potra and G. R. Carmichael, The kinetic preprocessor KPP-a software environment for solving chemical kinetics, Comput. Chem. Eng., 2002, 26, 1567–1579 CrossRef CAS.
- L. Deguillaume, M. Leriche, A. Monod and N. Chaumerliac, The role of transition metal ions on HOx radicals in clouds: a numerical evaluation of its impact on multiphase chemistry, Atmos. Chem. Phys., 2004, 4, 95–110 CrossRef CAS.
- M. Leriche, D. Voisin, N. Chaumerliac, A. Monod and B. Aumont, A model for tropospheric multiphase chemistry: application to one cloudy event during the CIME experiment, Atmos. Environ., 2000, 34, 5015–5036 CrossRef CAS.
- Y. Long, T. Charbouillot, M. Brigante, G. Mailhot, A.-M. Delort, N. Chaumerliac and L. Deguillaume, Evaluation of modeled cloud chemistry mechanism against laboratory irradiation experiments: The HxOy/iron/carboxylic acid chemical system, Atmos. Environ., 2013, 77, 686–695 CrossRef CAS.
- J. F. Doussin and A. Monod, Structure–activity relationship for the estimation of OH-oxidation rate constants of carbonyl compounds in the aqueous phase, Atmos. Chem. Phys., 2013, 13, 11625–11641 CrossRef.
- T. Raventos-Duran, M. Camredon, R. Valorso, C. Mouchel-Vallon and B. Aumont, Structure-activity relationships to estimate the effective Henry's law constants of organics of atmospheric interest, Atmos. Chem. Phys., 2010, 10, 7643–7654 CrossRef CAS.
- M. E. Jenkin, J. C. Young and A. R. Rickard, The MCM v3.3.1 degradation scheme for isoprene, Atmos. Chem. Phys., 2015, 15, 11433–11459 CrossRef CAS.
- S. E. Schwartz, Mass-transport considerations pertinent to aqueous phase reactions of gases in liquid-water clouds, Chemistry of Multiphase Atmospheric System, 1986, vol. G6, pp. 415–471 Search PubMed.
- S. Madronich and S. Flocke, The role of solar radiation in atmospheric chemistry, Handbook of Environmental Chemistry, ed. P. Boule, Springer-Verlag, Heidelberg, Berlin, Heidelberg, 1999, pp. 1–26 Search PubMed.
- L. Deguillaume, T. Charbouillot, M. Joly, M. Vaïtilingom, M. Parazols, A. Marinoni, P. Amato, A. M. Delort, V. Vinatier, A. Flossmann, N. Chaumerliac, J. M. Pichon, S. Houdier, P. Laj, K. Sellegri, A. Colomb, M. Brigante and G. Mailhot, Classification of clouds sampled at the puy de Dôme (France) based on 10 yr of monitoring of their physicochemical properties, Atmos. Chem. Phys., 2014, 14, 1485–1506 CrossRef CAS.
- T. Arakaki, C. Anastasio, Y. Kuroki, H. Nakajima, K. Okada, Y. Kotani, D. Handa, S. Azechi, T. Kimura, A. Tsuhako and Y. Miyagi, A general scavenging rate constant for reaction of hydroxyl radical with organic carbon in atmospheric waters, Environ. Sci. Technol., 2013, 47, 8196–8203 CrossRef CAS PubMed.
- A. Bianco, M. Passananti, H. Perroux, G. Voyard, C. Mouchel-Vallon, N. Chaumerliac, G. Mailhot, L. Deguillaume and M. Brigante, A better understanding of hydroxyl radical photochemical sources in cloud waters collected at the puy de Dôme station – experimental versus modelled formation rates, Atmos. Chem. Phys., 2015, 15, 9191–9202 CrossRef CAS.
- A. Lallement, V. Vinatier, M. Brigante, L. Deguillaume, A. M. Delort and G. Mailhot, First evaluation of the effect of microorganisms on steady state hydroxyl radical concentrations in atmospheric waters, Chemosphere, 2018, 212, 715–722 CrossRef CAS PubMed.
- P. Amato, F. Demeer, A. Melaouhi, S. Fontanella, A. S. Martin-Biesse, M. Sancelme, P. Laj and A. M. Delort, A fate for organic acids, formaldehyde and methanol in cloud water: their biotransformation by micro-organisms, Atmos. Chem. Phys., 2007, 7, 4159–4169 CrossRef CAS.
- P. A. Ariya, O. Nepotchatykh, O. Ignatova and M. Amyot, Microbiological degradation of atmospheric organic compounds, Geophys. Res. Lett., 2002, 29, 2077 CrossRef.
- V. Côté, G. Kos, R. Mortazavi and P. A. Ariya, Microbial and “de novo” transformation of dicarboxylic acids by three airborne fungi, Sci. Total Environ., 2008, 390, 530–537 CrossRef PubMed.
- M. Matulová, S. Husárová, P. Capek, M. Sancelme and A.-M. Delort, Biotransformation of various saccharides and production of exopolymeric substances by cloud-borne Bacillus sp. 3B6, Environ. Sci. Technol., 2014, 48, 14238–14247 CrossRef PubMed.
- P. Renard, A. Bianco, J.-L. Baray, M. Bridoux, A.-M. Delort and L. Deguillaume, Classification of clouds sampled at the puy de Dôme station (France) based on chemical measurements and air mass history matrices, Atmosphere, 2020, 11, 732 CrossRef CAS.
- Y. Liu, C. K. Lim, Z. Shen, P. K. H. Lee and T. Nah, Effects of pH and light exposure on the survival of bacteria and their ability to biodegrade organic compounds in clouds: implications for microbial activity in acidic cloud water, Atmos. Chem. Phys., 2023, 23, 1731–1747 CrossRef CAS.
- P. Renard, I. Canet, M. Sancelme, N. Wirgot, L. Deguillaume and A. M. Delort, Screening of cloud microorganisms isolated at the Puy de Dôme (France) station for the production of biosurfactants, Atmos. Chem. Phys., 2016, 16, 12347–12358 CrossRef CAS.
- P. A. Dominutti, P. Renard, M. Vaïtilingom, A. Bianco, J. L. Baray, A. Borbon, T. Bourianne, F. Burnet, A. Colomb, A. M. Delort, V. Duflot, S. Houdier, J. L. Jaffrezo, M. Joly, M. Leremboure, J. M. Metzger, J. M. Pichon, M. Ribeiro, M. Rocco, P. Tulet, A. Vella, M. Leriche and L. Deguillaume, Insights into tropical cloud chemistry in Réunion (Indian Ocean): results from the BIO-MAÏDO campaign, Atmos. Chem. Phys., 2022, 22, 505–533 CrossRef CAS.
- B. Franco, T. Blumenstock, C. Cho, L. Clarisse, C. Clerbaux, P. F. Coheur, M. De Mazière, I. De Smedt, H. P. Dorn, T. Emmerichs, H. Fuchs, G. Gkatzelis, D. W. T. Griffith, S. Gromov, J. W. Hannigan, F. Hase, T. Hohaus, N. Jones, A. Kerkweg, A. Kiendler-Scharr, E. Lutsch, E. Mahieu, A. Novelli, I. Ortega, C. Paton-Walsh, M. Pommier, A. Pozzer, D. Reimer, S. Rosanka, R. Sander, M. Schneider, K. Strong, R. Tillmann, M. Van Roozendael, L. Vereecken, C. Vigouroux, A. Wahner and D. Taraborrelli, Ubiquitous atmospheric production of organic acids mediated by cloud droplets, Nature, 2021, 593, 233–237 CrossRef CAS PubMed.
- T. Stavrakou, J. F. Müller, J. Peeters, A. Razavi, L. Clarisse, C. Clerbaux, P. F. Coheur, D. Hurtmans, M. De Mazière, C. Vigouroux, N. M. Deutscher, D. W. T. Griffith, N. Jones and C. Paton-Walsh, Satellite evidence for a large source of formic acid from boreal and tropical forests, Nat. Geosci., 2012, 5, 26–30 CrossRef CAS.
Footnotes |
| † Electronic supplementary information (ESI) available. See DOI: https://doi.org/10.1039/d2ea00153e |
| ‡ Laboratoire d'Aérologie, Université de Toulouse, CNRS, UPS, Toulouse, France |
| This journal is © The Royal Society of Chemistry 2023 |