 Open Access Article
Evaluation of Kdo-8-N3 incorporation into lipopolysaccharides of various Escherichia coli strains†
Zeynep Su
Ziylan
 a,
Geert-Jan
de Putter
a,
Meike
Roelofs
a,
Jan Maarten
van Dijl
a,
Geert-Jan
de Putter
a,
Meike
Roelofs
a,
Jan Maarten
van Dijl
 b,
Dirk-Jan
Scheffers
 c and
Marthe T. C.
Walvoort
 *a
*a
aStratingh Institute for Chemistry, Faculty of Science and Engineering, University of Groningen, Nijenborgh 7, 9747 AG Groningen, The Netherlands. E-mail: m.t.c.walvoort@rug.nl
bDepartment of Medical Microbiology, University of Groningen, University Medical Center Groningen, Hanzeplein 1, 9700 RB Groningen, The Netherlands
cGroningen Biomolecular Sciences and Biotechnology Institute, Faculty of Science and Engineering, University of Groningen, Nijenborgh 7, 9747 AG Groningen, The Netherlands
First published on 26th September 2023
Abstract
8-Azido-3,8-dideoxy-α/β-D-manno-oct-2-ulosonic acid (Kdo-8-N3) is a Kdo derivative used in metabolic labeling of lipopolysaccharide (LPS) structures found on the cell membrane of Gram-negative bacteria. Several studies have reported successful labeling of LPS using Kdo-8-N3 and visualization of LPS by a fluorescent reagent through click chemistry on a selection of Gram-negative bacteria such as Escherichia coli strains, Salmonella typhimurium, and Myxococcus xanthus. Motivated by the promise of Kdo-8-N3 to be useful in the investigation of LPS biosynthesis and cell surface labeling across different strains, we set out to explore the variability in nature and efficiency of LPS labeling using Kdo-8-N3 in a variety of E. coli strains and serotypes. We optimized the chemical synthesis of Kdo-8-N3 and subsequently used Kdo-8-N3 to metabolically label pathogenic E. coli strains from commercial and clinical origin. Interestingly, different extents of labeling were observed in different E. coli strains, which seemed to be dependent also on growth media, and the majority of labeled LPS appears to be of the ‘rough’ LPS variant, as visualized using SDS-PAGE and fluorescence microscopy. This knowledge is important for future application of Kdo-8-N3 in the study of LPS biosynthesis and dynamics, especially when working with clinical isolates.
Introduction
The Gram-negative bacterial cell envelope is a crucial structure that plays an important role in maintaining cellular integrity, but is also a protective barrier against external stress, a regulator of nutrient uptake and involved in host–pathogen interactions.1 Important for bacterial cellular integrity is the production of membrane-bound lipopolysaccharides (LPS). LPS generally function as the first defense layer against environmental stress and preserve the structural integrity of the bacterial cell envelope found in virtually all Gram-negative bacteria.2 LPS consist of three main parts: (1) a lipophilic region, lipid A, that is embedded into the membrane, (2) a core oligosaccharide region attached to lipid A, that further divides into inner core and outer core, and (3) O-antigen, a highly diverse polysaccharide chain that is linked to the core region and extends out of the cell surface. The length and structure of LPS highly varies among Gram-negative bacterial strains, and even among serotypes, mostly due to the variety of carbohydrates on the outer core and O-antigen regions. However, in almost all Gram-negative bacteria the contents of lipid A and inner core regions are highly conserved with only small variations to the length and position of lipid chains.3-Deoxy-D-manno-oct-2-ulosonic acid (Kdo), a bacteria-specific anionic monosaccharide composed of an eight-carbon backbone, is part of the inner core region of LPS and is specifically responsible for linking the inner core region to lipid A. Due to its unique position and highly conserved presence in the core of LPS, Kdo is thought of as a marker for LPS formation.2,3 Kdo has an anionic character that increases the strength of neighboring LPS interactions and lowers the permeability of the outer membrane that acts as a protective barrier against foreign compounds.4,5 In Escherichia coli strains, the smallest structure of LPS that still allows cellular growth and viability has been found to contain two Kdo residues linked to lipid A.2 This structure, known as Kdo2-lipid A, is a wide-spread motif among bacterial LPS structures, although a structure with only one Kdo unit attached to lipid A is found in some Gram-negative bacteria such as Haemophilus influenzae6,7 and Bordetella pertussis.8 Because of its key position in the LPS structure, Kdo is considered an attractive monosaccharide to target in the biosynthetic pathway of LPS for the investigation of Gram-negative bacteria and their LPS production.9
Gram-negative bacteria employ two biosynthesis methods to produce Kdo-linked LPS: a de novo pathway and a salvage pathway (Fig. S1, ESI†). In the de novo pathway, Kdo is produced from ribulose 5-phosphate, which is a product generated from D-glucose through the pentose phosphate pathway, by the action of several enzymes.10–12 In the Kdo salvage pathway, exogenous Kdo is imported by the sialic acid transporter NanT, which was recently found to be involved in the uptake of Kdo and a derivative of Kdo in E. coli cells.13 The Kdo from either pathway is subsequently activated to its CMP derivative (CMP-Kdo) by CMP-Kdo synthase, and transferred to lipid A by CMP-Kdo transferase (Fig. S1, ESI†).13
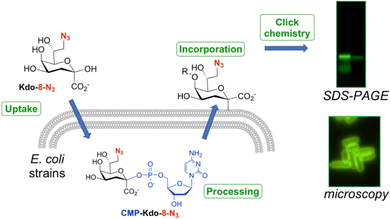
8-Azido-3,8-dideoxy-α/β-D-manno-oct-2-ulosonic acid (Kdo-8-N3) is a synthetic derivative of the natural compound Kdo that contains an azide moiety on the primary carbon. Several studies have used this modified Kdo substrate to metabolically label LPS in a selection of Gram-negative bacteria (Fig. 1).9,13–18 Labeling experiments involve the uptake of Kdo-8-N3 inside the bacterial cytosol, where it is processed to the nucleotide-activated CMP-Kdo-8-N3 form. Next, Kdo-transferase adds Kdo-8-N3 to the growing lipid A structure, after which the glycoconjugate is flipped to the extracellular surface. A subsequent click reaction with a fluorescent label allows the visualization of labeled LPS structures using SDS-PAGE gel imaging and fluorescence microscopy on whole cells. In the first account in 2012, Kdo-8-N3 was chemically synthesized and used as a tool to label LPS and to selectively visualize the cell membrane of E. coli K-12, Salmonella thyphimurium, and Legionella pneumophila strain Paris using fluorescence microscopy.9 Bacteria were incubated in a minimal medium (M9) with Kdo-8-N3 and subsequently reacted with a fluorophore through copper-catalyzed click chemistry. This method was further improved by growing the bacterial cells in a richer media (LB) supplemented with lower concentrations of Kdo-8-N3 and using an intact-cell compatible, strain-promoted click reaction.13–15 Using this method, Kdo-8-N3 was also incorporated into LPS in a variety of Gram-negative bacteria, such as an E. coli mutant strain that produces highly truncated LPS structures, an E. coli mutant strain lacking de novo Kdo biosynthesis (ClearColi K-12), E. coli serotype O6, Klebsiella pneumoniae K6, and two antibiotic-resistant E. coli strains. Furthermore, the LPS of Brucella abortus,16Myxococcus xanthus DZ2,17 and of Gram-negative bacteria found in the murine gut microbiota18 were labeled using different concentrations of Kdo-8-N3 in various growth media.
Whereas successful incorporation of Kdo-8-N3 into the LPS was reported in several Gram-negative bacteria, it has been estimated that the efficiency of Kdo-8-N3 incorporation is <1% compared to native Kdo, which may be caused by low uptake or poor efficiency of the 8-azido analogue in the enzymatic processing steps.9,14 To increase uptake efficiency, minimal media (e.g., M9 medium) are often used to introduce unnatural carbohydrate analogues, as this was shown to stimulate carbohydrate uptake.19 On the other hand, growth in rich media (e.g. LB medium) is also able to support analogue incorporation.20 Because we anticipate that Kdo-8-N3 will be widely used and very useful for the study of bacterial LPS and membranes in general,21 we are convinced it is important to understand under which conditions Kdo-8-N3 labeling is most likely achieved, and how to best check for successful incorporation.
In this study, the efficiency and reproducibility of the Kdo-8-N3 labeling method is investigated as a tool to visualize LPS in Gram-negative bacteria, focusing on E. coli strains. The method of Kdo-8-N3 incorporation into LPS was reproduced and optimized for the non-pathogenic E. coli K-12 strain (E. coli BW25113), followed by the incorporation of Kdo-8-N3 in a collection of 15 pathogenic E. coli strains from commercial and clinical origin. Labeled LPS was visualized using gel electrophoresis (SDS-PAGE) and fluorescence microscopy. Our findings show that the efficiency of Kdo-8-N3 incorporation and subsequent labeling of LPS is highly dependent on both the specific strain of bacteria and the growth medium.
Results
Chemical synthesis of Kdo and Kdo-8-N3
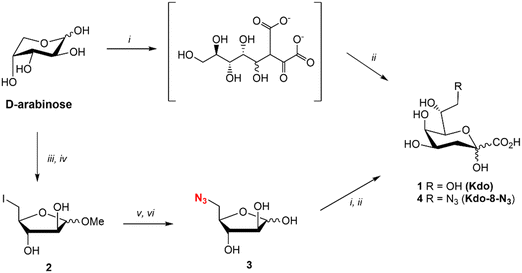
Kdo (1) was synthesized using the reported method for the synthesis of ammonium Kdo by Kosma et al.22 (Fig. 2). The two-step synthesis consisted of the aldol reaction between commercial D-arabinose and oxaloacetate at pH 12, followed by decarboxylation with NiCl2 at pH 5 and 50 °C to yield Kdo (1). The synthesis of Kdo-8-N3 (4) followed a similar synthetic protocol. For this, 5-azido-5-deoxy-D-arabinose (3: Ara-5-N3) was synthesized from commercial D-arabinose in a straightforward manner in just 4 steps (Fig. 2). The methyl acetal of D-arabinose (S1) was synthesized to lock the ring in the 5-membered conformation, followed by iodination of the primary alcohol to give compound 2. Subsequent azide substitution was followed by acetal hydrolysis to give Ara-5-N3 (3) in 40% yield over 4 steps. Next, compound 3 was subjected to the aldol reaction with oxaloacetate and decarboxylation to obtain Kdo-8-N3 (4) in 80% yield after purification by anion exchange chromatography.Investigation of growth of E. coli BW25113 in the presence of synthetic Kdo and Kdo-8-N3
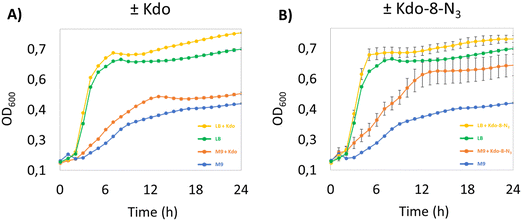
We started our investigation into the incorporation efficiency of Kdo-8-N3 into LPS by assessing the effect of Kdo or Kdo-8-N3 supplementation on bacterial growth rates in different media. We selected E. coli BW25113 as a benchmark E. coli strain, as it has been used to investigate the incorporation of Kdo-8-N3 into LPS.14 Because the strain is derived from the non-pathogenic K-12 strain, the LPS is severely truncated and lacks the O-antigen and part of the core oligosaccharide region.12,23 An overnight culture of E. coli BW25113 was used to inoculate rich lysogeny broth (LB) medium or minimal medium M9 (containing maltose as carbon source) with or without the supplementation of 5 mM Kdo or 5 mM Kdo-8-N3. M9 is a chemically defined medium with the minimal nutrients and salts that still allow the majority of bacteria to be viable and replicate.24 As seen from the growth curves in Fig. 3, the growth of E. coli BW25113 in the presence of Kdo or Kdo-8-N3 in LB is faster (OD600 of 0.669 after only 5 hours) and reaches a higher OD600 at stationary phase compared to when these substrates were absent from the media. On M9 medium growth was slower and cultures reached a lower OD600 at stationary phase (OD600 of 0.571 after 12 hours), but in this case the presence of Kdo and Kdo-8-N3 resulted in faster growth and again, a higher OD600. Interestingly, Kdo-8-N3 in M9 medium seemed to stimulate bacterial growth more than Kdo in M9 medium. To assess whether the increased growth in the presence of both Kdo and Kdo-8-N3 could be due to residual pyruvate, we determined the presence of pyruvate using quantitative NMR (qNMR). From the qNMR spectra, 11 mol% and 4 mol% residual pyruvate was determined for the Kdo and Kdo-8-N3 samples, respectively. As this does not explain the faster growth observed with Kdo-8-N3 especially, a possible catabolic mechanism for the exogenous Kdo and Kdo-8-N3 could be present in the cells.Kdo-8-N3 labeling and localization on the cell membrane of E. coli BW25113
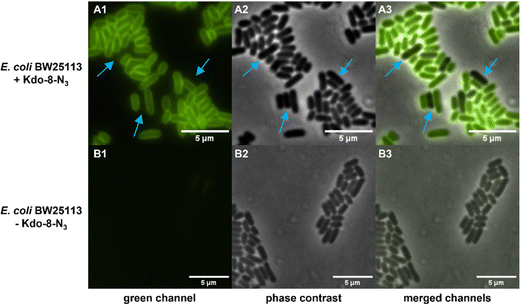
Having established that E. coli BW25113 grow well on media supplemented with synthetic Kdo-8-N3, the incorporation of Kdo-8-N3 into the cellular LPS was investigated. An overnight culture of E. coli BW25113 cells was used to inoculate fresh M9 medium supplemented with or without 5 mM Kdo-8-N3 and culturing was continued for 16 h. The cells were pelleted, washed and subsequently treated with fluorescein-dibenzocyclooctyne (FAM-DBCO), a strain-promoted fluorescent click reagent that is compatible with intact cells.25 In accordance with previous reports,9,14 fluorescence microscopy revealed a strong fluorescent signal localized to the cell membranes of E. coli BW25113 cells when grown with Kdo-8-N3 (Fig. 4). As a control, no fluorescence signals were observed when the bacteria were grown with 5 mM Kdo, or when the click reagent was omitted (Fig. S2, ESI†). Interestingly, a number of cells was observed to have no labeling at all (Fig. 4; panel A3: indicated by blue arrows), suggesting heterogeneity in the bacterial culture at the time of incubation with Kdo-8-N3. Bacterial culture heterogeneity has been described for E. coli cells as a result of the dilution of cells in stationary phase.26Confirmation by SDS-PAGE of Kdo-8-N3 incorporation into E. coli BW25113 LPS
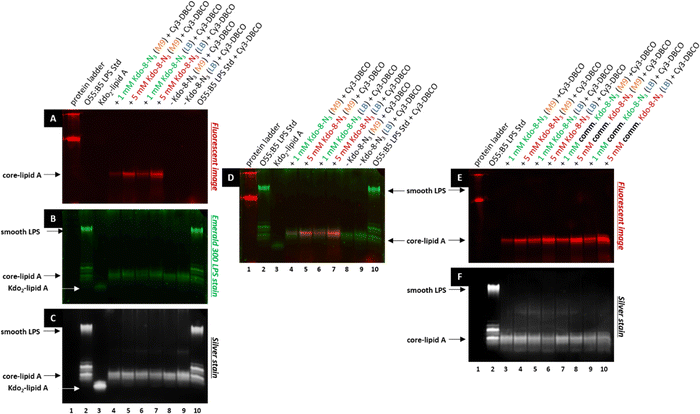
To verify that the fluorescent signal localized to the periphery of E. coli BW25113 cells upon incubation with Kdo-8-N3 actually originates from labeled LPS, 16% Tris-Tricine SDS polyacrylamide gel electrophoresis (PAGE) was used to separate and visualize LPS. The bands were visualized using fluorescence imaging (Fig. 5A), and total LPS was visualized both with the Pro Q Emerald 300 LPS gel staining kit (Fig. 5B: UV-B visible) and with silver staining (Fig. 5C). To confirm that the observed labeling on the LPS structures originated from incorporation of the chemically synthesized Kdo-8-N3 (compound 4), the experiment was repeated with commercial Kdo-8-N3 (>90% purity), and the resulting gels were visualized using fluorescence imaging (Fig. 5E) and with silver staining to reveal total LPS (Fig. 5F). Commercial LPS from E. coli O55:B5 and commercial Kdo2-lipid A were used as a reference. In addition, Coomassie staining was performed to exclude the presence of proteins on the SDS-PAGE images (Fig. S3, ESI†).Fluorescent LPS bands were observed in the cells grown with Kdo-8-N3 (Fig. 5A, lanes 4, 5, 6, 7). These fluorescent bands were absent from the cells grown without Kdo-8-N3 (lanes 8 and 9), indicating that the fluorescent labeling of LPS is Kdo-8-N3-dependent. The highest fluorescence intensity was observed with the samples containing cells grown in the presence of 5 mM Kdo-8-N3, and LB and M9 media both gave bands with reliable fluorescence intensity (lane 5 and 7). The fluorescent signal was slightly more intense with the growth in LB (lane 7). Interestingly, a similar pattern of fluorescence intensity was observed when the commercial Kdo-8-N3 was used (Fig. 5E and F), suggesting that both compound 4 and the commercial Kdo-8-N3 were equally efficient in LPS labeling. The two methods for total LPS staining showed identical LPS patterns (Fig. 5B and C), including two distinct bands with similar molecular weights, which had a lower mobility on SDS-PAGE than Kdo2-lipid A (Fig. 5, lane 3). This suggests that E. coli BW25113 produces at least two LPS structures that contain several monosaccharides additional to Kdo2-lipid A (core-lipid A or rough LPS). This observation is in agreement with reported results that showed a clear difference in molecular weight between the short chain LPS of E. coli BW25113 and the deep-rough LPS of a genetically engineered ΔwaaC E. coli strain that only produces Kdo2-lipid A.14 The superimposed image (Fig. 5D) revealed that the fluorescently labeled LPS structures (red bands) match the higher band of the LPS structures (green bands). This result shows that Kdo-8-N3 is incorporated into the LPS structures on the bacterial cell envelope, which was previously confirmed by MALDI-TOF MS studies.14 Comparison of the two LPS visualization methods showed that both revealed the same LPS pattern, but that the silver stain protocol showed a greater signal-to-background ratio than the commercial Pro Q Emerald 300 LPS gel staining kit.
Therefore, the LPS-specific silver stain protocol was used for the ensuing experiments.
Fluorescent labeling of E. coli BW25113 with Kdo-8-N3 and different click reagents
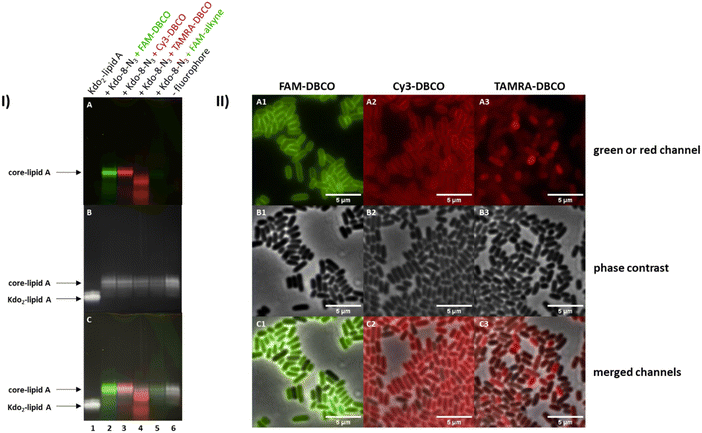
To optimize the fluorescence read-out and to understand if the LPS visualization is fluorophore-dependent, three strain-promoted click reactions (copper-free) and one copper-catalyzed click reaction with different fluorophores were investigated. E. coli BW25113 cells were grown in M9 medium with the supplementation of Kdo-8-N3 (5 mM) and treated with fluorescein (FAM)-DBCO, cyanine-3 (Cy3)-DBCO, carboxytetramethylrhodamine (TAMRA)-DBCO and FAM-alkyne. The 16% Tris-Tricine SDS-PAGE gel images in Fig. 6-I show that the highest amount of labeling was observed with FAM-DBCO and Cy3-DBCO. Labeling with TAMRA-DBCO seems to be restricted to non-LPS material (see superimposed image, panel I-C). The copper-catalyzed click reaction resulted in a very faint band on the gel image (Fig. 6-I: A, lane 5), which we hypothesize is due to loss of LPS as a result of cell lysis or membrane damage during the incubation with copper,27–29 as the amounts of LPS after copper-catalyzed click reactions were generally lower. To reduce potential toxicity, the copper-catalyzed click reaction may be improved by further optimizing the copper to ligand ratio, or by the use of alternative ligands such as BTTP and BTTAA.29,30 However, as the strain-promoted click reactions were successful, this was not pursued in this project.The differences in fluorescence intensity observed on the Tricine gels were consistent with observations made using fluorescence microscopy (Fig. 6-II). The strain-promoted reactions with FAM-DBCO and Cy3-DBCO resulted in clear peripheral labeling of E. coli BW25113 cells (A1 and A2 respectively), which was not observed with TAMRA-DBCO (A3). The cells labeled using the copper-catalyzed reaction with FAM-alkyne were not included in the microscopy experiments due to the low level of fluorescence intensity (Fig. 6-I: A, lane 5). As FAM-DBCO-labeled cells (Fig. 6-II: A1) show brighter labeling than Cy3-DBCO-labeled cells, we concluded that FAM-DBCO was the best fluorophore for future experiments.
Effect of growth media on the incorporation of Kdo-8-N3 into LPS of pathogenic E. coli strains
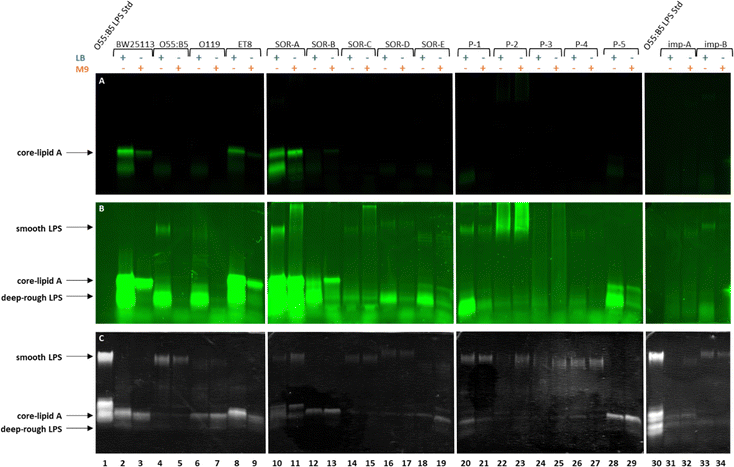
Having established that Kdo-8-N3 is successfully incorporated into the LPS of the non-pathogenic E. coli BW25113 strain, we set out to assess the generality of this approach to label different E. coli serotypes and clinical isolates. For this, a selection of pathogenic E. coli strains containing different LPS patterns was used (Table S1, ESI†): E. coli O55:B5 (commercial strain), E. coli O119 (commercial strain), E. coli ET8 (engineered strain), and clinical E. coli isolates from blood and implant infections. On E. coli BW25113 the largest extent of labeling was observed using 5 mM Kdo-8-N3, and LB and M9 media both gave reliable fluorescent signals, with the growth in LB resulting in slightly more intense bands.Each pathogenic E. coli strain was incubated with 5 mM Kdo-8-N3 in either LB or M9 media, followed by the FAM-DBCO click reaction, separation using 16% Tris-Tricine SDS-PAGE and visualization of the bands using fluorescence scanning and silver staining (Fig. 7). The cell density in each well was normalized to ensure comparability between lanes. As is apparent from Fig. 7A, only two out of fifteen pathogenic E. coli strains showed a similar extent of labeling at the core-lipid A region compared to E. coli BW25113. These strains were E. coli ET8 (lanes 8,9) and E. coli SOR-A (lanes 10,11). Using the imaging software, the fluorescence intensity was manually increased to view labeled LPS bands with lower intensity which revealed additional fluorescent bands in the low molecular weight region for almost all strains (Fig. 7B). For some of the strains (i.e. SOR strains, P-1 and P-5), these bands, which were most apparent when grown in LB, indicated a smaller LPS structure (deep-rough LPS). To better understand these structures, commercial Kdo2-lipid A was added as a reference on the next gel (Fig. S4, ESI†). Although these bands seem to be similar in size to Kdo2-lipid A, it is unclear why these bands do not stain well with silver. Using the silver stain (Fig. 7C), it was shown that several strains produce high molecular weight LPS structures (smooth LPS), and also low levels of fluorescent labeling were discernable by increasing the intensity (Fig. 7B). A striking observation was the variety of the labeled LPS patterns within the strains grown in different media. For example, both the labeling efficiency and the labeled LPS pattern of E. coli SOR-A differed when grown in LB or in M9 (Fig. 7A and B, lanes 10 and 11). Furthermore, E. coli ET8 and SOR-B seemed to label more efficiently when grown in M9 as compared to LB. Overall, the silver-stained gel images nicely illustrate the structural differences in LPS between the investigated E. coli strains.
Effect of Kdo substrate on the LPS structures
The labeling experiment revealed that different E. coli strains incorporated Kdo-8-N3, with varying efficiency, which was also impacted by the growth media. To investigate whether Kdo-8-N3 also impacted the size or the abundance of LPS structures, the LPS pattern of each E. coli strain grown in LB supplemented with 5 mM Kdo-8-N3, 5 mM Kdo, or no additional substrate (negative control) was determined. As visualized in Fig. 8, diverse effects on the LPS production in each individual strain were observed. When supplied with exogenous Kdo, some strains seemed to display reduced amounts of smooth LPS (i.e., O55:B5, SOR-A, SOR-B, SOR-C, SOR-D, P-1), whereas other strains seemed to produce even more smooth LPS (P-2, P-3). Interestingly, Kdo supplementation stimulated the production of short chain (rough) LPS in most of the strains. In contrast, in almost all strains Kdo-8-N3 supplementation resulted in a reduction in shorter chain LPS. The most striking differences in LPS production were observed between E. coli strains SOR-A and SOR-B. When supplied with Kdo-8-N3, LPS levels were low in SOR-A compared to when grown without any additional substrate, whereas short chain LPS levels were increased when supplied with Kdo. The LPS pattern of SOR-B grown in LB media revealed several bands corresponding to various short-chain LPS structures, however when supplied with Kdo or Kdo-8-N3, only a single short chain LPS structure was abundantly present. These observations suggest that the LPS biosynthesis in individual strains is impacted by the supplementation of exogenous Kdo and Kdo-8-N3, and that each strain responds differently to the presence of these substrates. | ||
| Fig. 8 Silver-stained 16% Tris-Tricine SDS-PAGE gels showing the variety of LPS structures between different E. coli strains when grown in LB with 5 mM Kdo-8-N3 (+N3), with 5 mM Kdo (−N3) or without the supplementation of either substrate (−). See Fig. S4 (ESI†) for fluorescence and merged images of these gels. | ||
Localization of labelled Kdo-8-N3 on pathogenic E. coli strains
The results obtained with the pathogenic E. coli strains indicated variable Kdo-8-N3 incorporation into both rough and smooth LPS. To determine whether the labeled LPS structures in these strains are indeed peripherally localized on the cells, a selection of the labeled strains was visualized with microscopy. The LPS of E. coli SOR-A had shown intense fluorescent labeling to a comparable extent as E. coli BW25113 (Fig. 7A and B), and indeed peripheral fluorescence was observed when the cells were grown in LB or M9 medium (Fig. 9). This suggests that the different patterns for LPS labeling (Fig. 7) both lead to efficient membrane labeling. In the E. coli SOR-B samples, only few cells revealed membrane labeling. The periphery of these cells was more apparent for the cells grown in M9, in agreement with the gel electrophoresis data that showed more pronounced labeling in M9 (Fig. 7A). Surprisingly, no labeling was observed in the samples containing E. coli O55:B5 cells. While E. coli O55:B5 had shown labeling of smooth LPS on the gel images (Fig. 7A), the extent of labeling was probably too low to detect by fluorescence microscopy.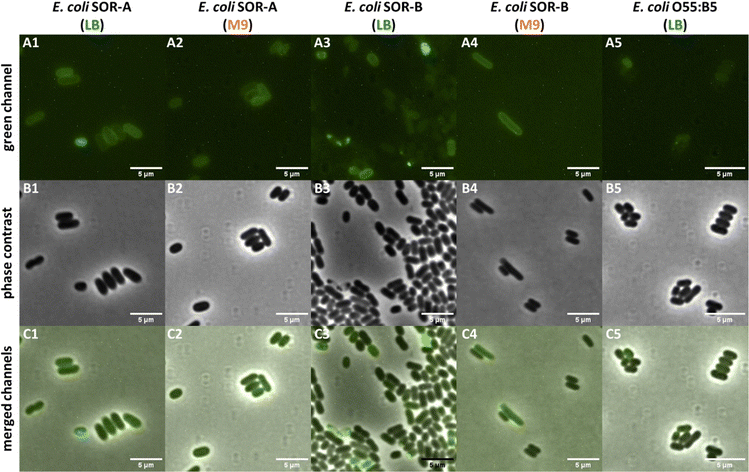 | ||
| Fig. 9 Selected pathogenic E. coli cells visualized on a Nikon Ti-E microscope using fluorescence optics (A1–A5: green channel), phase contrast (B1–B5), and co-localization of fluorescence and phase contrast images (C1–C5: merged channels). All fluorescent images were adjusted to the same settings (i.e. brightness, contrast) to allow visualization of different fluorescence intensities of the samples. See Fig. S5 (ESI†) for the control images for LPS labeling using SDS-PAGE. | ||
Discussion
In the last decade, Kdo-8-N3 attracted increasing attention due to several reports on its successful incorporation into the LPS of a variety of Gram-negative bacteria. It allowed selective labeling of living bacteria and was mainly used for imaging purposes.31 Triggered by the large potential for employing this Kdo derivative in understanding LPS biosynthesis and dynamics, in real time and under varying conditions, we set out to investigate the generality of the labeling approach across a diverse selection of commercial and clinical strains. Surprisingly, while all included strains belonged to the species E. coli, we observed strong variation in the incorporation of Kdo-8-N3.When E. coli BW25113 was supplied with either Kdo or Kdo-8-N3, an increase in growth rate was observed in both media, as compared to the controls where the only carbon source was either amino acids (LB) or maltose (M9). This effect was more pronounced when grown in minimal media (M9). A possible explanation of this positive effect on growth is that E. coli BW25113 is able to metabolize Kdo and its 8-azido derivative more readily than maltose. Indeed, several bacterial strains, including E. coli, are found to express an enzyme called Kdo-aldolase (EC 4.1.2.23), which catalyzes the retro-aldol reaction to form pyruvate and D-arabinose.32,33 The full genome of E. coli BW25113 has been sequenced, and although there is no Kdo aldolase annotated, various putative aldolases are indicated.34 Additionally, a catabolic mechanism for sialic acid, a monosaccharide that is closely related to Kdo in structure, has been reported in Gram-negative bacteria.35 This suggests that the enzymes involved in the sialic acid catabolism may also recognize and catabolize the excess Kdo and Kdo-8-N3 that is taken up by the bacteria. Alternatively, minor amounts of pyruvate that originate from the chemical synthesis of Kdo and Kdo-8-N3 may be used as a carbon source and increase growth rates.
In our experiments we found that the growth media used for the bacterial exposure to Kdo-8-N3 had an impact on the extent of incorporation. With E. coli BW25113, it was clear that the cells grew slower in M9 as compared to LB. The pathogenic E. coli strains used here exhibited a similar growth rate and pattern based on the OD600 measurements after incubation for several hours (data not shown). For the subsequent visualization of LPS production and Kdo-8-N3 incorporation the cell density was normalized, as this allowed a direct comparison of the effect of growth media (Fig. 7). Variations in LPS levels and Kdo-8-N3 incorporation were observed for some strains, whereas others seemed not to be affected, and a positive effect could be discerned for both LB and M9. We hypothesize that the expression levels of biosynthetic enzymes play a large role in the levels of LPS production and that the extent of azide incorporation may be dependent on the respective enzyme levels. In contrast to the hypothesis of ‘starving conditions’ to increase carbohydrate uptake, no clear effect of the minimal media on Kdo-8-N3 incorporation could be observed.
We were intrigued to see that different E. coli strains presented very different extents of LPS labeling with Kdo-8-N3. Almost all strains showed low-level labeling of an LPS structure that is similar in size to core-lipid A. In addition, a few strains (i.e. SOR-A, P-1, P-5) showed labeling of an LPS structure that in size resembles the deep-rough LPS structures, which have been successfully labeled before.9,14 And most notably, clinical isolates P-1 and P-2 seemed to incorporate Kdo-8-N3 in their smooth LPS structures to some extent. As also apparent from the differences in LPS structures and molecular weights observed across our collection of E. coli strains (Fig. 8), the chemical diversity of LPS is tremendous.12
Finally, we selected several strains that showed some extent of fluorescent labeling on SDS-PAGE for additional microscopy experiments, and were able to demonstrate LPS labeling on the peripheral membrane of the clinical isolates SOR-A and SOR-B. No labeling could be observed with the commercial strain O55:B5, which indeed already showed very faint labeling on SDS-PAGE, where mostly LPS structures of similar weight to Kdo2-lipid A were visible. This convincingly shows that the fluorescently labeled bands that are visible on SDS-PAGE are indeed LPS structures that are localized to the bacterial cell membrane.
Conclusions
Kdo-8-N3 holds great promise as a tool to selectively visualize the production and dynamics of the LPS of Gram-negative bacteria. We conclude that our understanding of LPS labeling may be improved by performing a screen of different growth media. In addition, we propose that it is crucial to prove the efficiency of Kdo-8-N3 incorporation into LPS using SDS-PAGE and fluorescence microscopy, if possible, for any bacterial strain of interest, and to optimize the method where necessary. As fluorescent labeling was found to vary greatly between different E. coli strains, a thorough validation of Kdo-8-N3 incorporation prior to embarking on functional studies will be instrumental for the applicability of this method for LPS labeling.Author contributions
Z. S. Z., M. T. C. W. and D.-J. S conceived and designed the study. Z. S. Z. performed the chemical synthesis, labeling experiments, and imaging. G.-J. P. contributed to the chemical synthesis. M. R. contributed to the labeling experiments. J. M. D. contributed the clinical isolates. Z. S. Z. and M. T. C. W. wrote the manuscript. All authors approved the final version.Conflicts of interest
There are no conflicts to declare.Acknowledgements
We thank F. M. Cavallo, L. M. Braams and G. B. Spoelstra at the University Medical Center Groningen for their help with the isolation and culturing of clinical E. coli isolates. This work was financially supported by the Faculty of Science and Engineering, University of Groningen.References
- T. J. Silhavy, D. Kahne and S. Walker, Cold Spring Harb. Perspect. Biol., 2010, 2, a000414 CrossRef PubMed.
- C. Erridge, E. Bennett-Guerrero and I. R. Poxton, Microbes Infect., 2002, 4, 837–851 CrossRef CAS PubMed.
- A. Basauri, C. González-Fernández, M. Fallanza, E. Bringas, R. Fernandez-Lopez, L. Giner, G. Moncalián, F. de la Cruz and I. Ortiz, Crit. Rev. Biotechnol., 2020, 40, 292–305 CrossRef CAS PubMed.
- A. Silipo and A. Molinaro, Subcell. Biochem., 2010, 53, 69–99 CAS.
- E. Frirdich and C. Whitfield, J. Endotoxin Res., 2005, 11, 133–144 CAS.
- K. A. White, I. A. Kaltashov, R. J. Cotter and C. R. H. Raetz, J. Biol. Chem., 1997, 272, 16555–16563 CrossRef CAS PubMed.
- K. A. White, S. Lin, R. J. Cotter and C. R. H. Raetz, J. Biol. Chem., 1999, 274, 31391–31400 CrossRef CAS PubMed.
- T. Isobe, K. A. White, A. G. Allen, M. Peacock, C. R. H. Raetz and D. J. Maskell, J. Bacteriol., 1999, 181, 2648–2651 CrossRef CAS PubMed.
- A. Dumont, A. Malleron, M. Awwad, S. Dukan and B. Vauzeilles, Angew. Chem., 2012, 124, 3197–3200 CrossRef.
- L. Cipolla, A. Polissi, C. Airoldi, L. Gabrielli, S. Merlo and F. Nicotra, Curr. Med. Chem., 2011, 18, 830–852 CrossRef CAS PubMed.
- C. R. H. Raetz, C. M. Reynolds, M. S. Trent and R. E. Bishop, Annu. Rev. Biochem., 2007, 76, 295–329 CrossRef CAS PubMed.
- C. R. H. Raetz and C. Whitfield, Annu. Rev. Biochem., 2002, 71, 635–700 CrossRef CAS PubMed.
- I. Nilsson, R. Prathapam, K. Grove, G. Lapointe and D. A. Six, Mol. Microbiol., 2018, 110, 204–218 CrossRef CAS PubMed.
- I. Nilsson, K. Grove, D. Dovala, T. Uehara, G. Lapointe and D. A. Six, J. Biol. Chem., 2017, 292, 19840–19848 CrossRef CAS PubMed.
- E. Fugier, A. Dumont, A. Malleron, E. Poquet, J. M. Pons, A. Baron, B. Vauzeilles and S. Dukan, PLoS One, 2015, 10, 1–15 CrossRef PubMed.
- V. Vassen, C. Valotteau, C. Feuillie, C. Formosa-Dague, Y. F. Dufrêne and X. De, Bolle, EMBO J., 2019, 38, 1–15 CrossRef PubMed.
- F. Saidi, O. J. Gamboa Marin, J. I. Veytia-Bucheli, E. Vinogradov, G. Ravicoularamin, N. Y. Jolivet, A. A. Kezzo, E. R. Esquivel, A. Panda, G. Sharma, S. P. Vincent, C. Gauthier and S. T. Islam, ACS Omega, 2022, 7, 34997–35013 CrossRef CAS PubMed.
- W. Wang, Y. Zhu and X. Chen, Biochemistry, 2017, 56, 3889–3893 CrossRef CAS PubMed.
- P. Rugbjerg, A. M. Feist and M. O. A. Sommer, Front. Bioeng. Biotechnol., 2018, 6, 1–6 Search PubMed.
- P. Luong, A. Ghosh, K. D. Moulton, S. S. Kulkarni and D. H. Dube, ACS Infect. Dis., 2022, 8, 889–900 CrossRef CAS PubMed.
- D. A. C. Heesterbeek, R. M. Muts, V. P. van Hensbergen, P. de Saint Aulaire, T. Wennekes, B. W. Bardoel, N. M. van Sorge and S. H. M. Rooijakkers, PLoS Pathog., 2021, 17, 1–22 Search PubMed.
- H. Mikula, M. Blaukopf, G. Sixta, C. Stanetty and P. Kosma, Carbohydr. Chem.: Proven Synth. Methods, 2015, 207–211 Search PubMed.
- V. Chang, L.-Y. Chen, A. Wang and X. Yuan, J. Exp. Microbiol. Immunol., 2010, 14, 101–107 Search PubMed.
- Cold Spring Harbor Protocols, 2010, pdb.rec12295.
- N. J. Agard, J. M. Baskin, J. A. Prescher, A. Lo and C. R. Bertozzi, ACS Chem. Biol., 2006, 1, 644–648 CrossRef CAS PubMed.
- J. Roostalu, A. Jõers, H. Luidalepp, N. Kaldalu and T. Tenson, BMC Microbiol., 2008, 8, 1–14 CrossRef.
- R. Hong, T. Y. Kang, C. A. Michels and N. Gadura, Appl. Environ. Microbiol., 2012, 78, 1776–1784 CrossRef CAS PubMed.
- P. M. M. Martins, T. Gong, A. A. de Souza and T. K. Wood, Antibiotics, 2020, 9, 1–13 Search PubMed.
- M. Yang, A. S. Jalloh, W. Wei, J. Zhao, P. Wu and P. R. Chen, Nat. Commun., 2014, 5, 1–10 Search PubMed.
- C. Besanceney-Webler, H. Jiang, T. Zheng, L. Feng, D. Soriano Del Amo, W. Wang, L. M. Klivansky, F. L. Marlow, Y. Liu and P. Wu, Angew. Chem., Int. Ed., 2011, 50, 8051–8056 CrossRef CAS PubMed.
- N. Banahene, H. W. Kavunja and B. M. Swarts, Chem. Rev., 2022, 122, 3336–3413 CrossRef CAS PubMed.
- M. A. Ghalambor and E. C. Heath, J. Biol. Chem., 1966, 241, 3222–3227 CrossRef CAS PubMed.
- B. R. Knappmann and M.-R. Kula, Appl. Microbiol. Biotechnol., 1990, 33, 324–329 CrossRef CAS.
- F. Grenier, D. Matteau, V. Baby and S. Rodrigue, Genome Announc., 2018, 2, e01038–14 Search PubMed.
- E. R. Vimr, K. A. Kalivoda, E. L. Deszo and S. M. Steenbergen, Microbiol. Mol. Biol. Rev., 2004, 68, 132–153 CrossRef CAS PubMed.
Footnote |
| † Electronic supplementary information (ESI) available. See DOI: https://doi.org/10.1039/d3cb00110e |
| This journal is © The Royal Society of Chemistry 2023 |

![[thin space (1/6-em)]](https://www.rsc.org/images/entities/char_2009.gif) :
: