 Open Access Article
Engineering GO@Zn–Hap@CA porous heterostructure for ultra-fast and ultra-high adsorption efficacy: investigation towards the remediation of chromium and lead†
Monika
Mahmud
 a,
Md. Sahadat
Hossain
 a,
Mashrafi Bin
Mobarak
 a,
Md. Saiful
Quddus
 a,
Muhammad Shahriar
Bashar
 b,
Umme Sarmeen
Akhtar
a,
Shirin Akter
Jahan
a,
Dipa
Islam
c and
Samina
Ahmed
 *ad
*ad
aInstitute of Glass and Ceramic Research and Testing (IGCRT), Bangladesh Council of Scientific and Industrial Research (BCSIR), Dr Qudrat-i-Khuda Road, Dhanmondi, Dhaka-1205, Bangladesh. E-mail: shanta_samina@yahoo.com; Fax: +88-02-8613022; Tel: +88-1817549816
bIFRD, Bangladesh Council of Scientific and Industrial Research (BCSIR), Dr Qudrat-i-Khuda Road, Dhanmondi, Dhaka-1205, Bangladesh
cBTRI, Bangladesh Council of Scientific and Industrial Research (BCSIR), Dr Qudrat-i-Khuda Road, Dhanmondi, Dhaka-1205, Bangladesh
dBCSIR Laboratories Dhaka, Bangladesh Council of Scientific and Industrial Research (BCSIR), Dr Qudrat -i-Khuda Road, Dhanmondi, Dhaka-1205, Bangladesh
First published on 19th October 2022
Abstract
In the contemporary era, research into the structures involving emerging 2D materials, inorganic components, and polymers has evolved at a tremendous pace for environmental protection and sustainability. Herein, this study reports the design and fabrication of a GO@Zn–Hap@CA porous heterostructured adsorbent using 2D graphene oxide (GO), inorganic zinc-doped hydroxyapatite (Zn–Hap) and cellulose acetate (CA) via a crosslinking approach for the removal of Cr(VI) and Pb(II) ions. The synthesized raw material and the developed heterostructured adsorbent were intensely characterized by X-ray diffraction (XRD), Fourier transform infrared (FT-IR) spectroscopy, X-ray photoelectron spectroscopy (XPS), atomic force microscopy (AFM), field emission scanning electron microscopy (FE-SEM), and N2 gas adsorption–desorption analysis. The fabricated GO@Zn–Hap@CA heterostructure exhibited high roughness, high surface area and mesoporous texture and thereby has shown an enhanced capture of Cr(VI) and Pb(II) ions. Importantly, it possessed an ultrahigh maximum adsorption capacity of 384 mg g−1 and 400 mg g−1 for Cr(VI) and Pb(II) at pH = 2 and pH = 5, respectively. Investigation of the adsorption isotherm and kinetics indicate that both Cr(VI) and Pb(II) adsorption fitted well with the Freundlich isotherm model and pseudo-second-order kinetic model. While probing the kinetics, the equilibrium was observed to reach at an ultrafast duration, for instance, 50 min for chromium and 60 min for lead. A study on the effect of the co-existing ions revealed that the cations and anions had a less significant effect on Cr(VI) and Pb(II) adsorption. Such results offer insights into the intriguing potential of GO@Zn–Hap@CA for the elimination of hazardous pollutants from the aquatic environment.
Environmental significanceToxic heavy metal pollution in the aqueous environment due to rapid industrialization has indicated a burning global concern. The continuous use and intake of such polluted water can cause fatal health issues to the living beings. Herein, the study focuses on designing a porous structure via crosslinking strategy by employing two-dimensional graphene oxide, Zn doped hydroxyapatite and cellulose acetate for the eradication of chromium and lead from aqueous media. The engineered porous structure with high roughness and surface area facilitates efficient trapping of chromium and lead at ultrafast duration. The developed composite membrane also discloses excellent reusable potency of up to three cycles thereby promoting environmental sustainability. |
1 Introduction
Designing structures with emerging materials for the decontamination of wastewater has been extensively intensified worldwide in the current industrial era. In industrial discharge, heavy metal ions (HMIs), Cr(VI), and Pb(II) are hazardous to aquatic life as well as human beings.1,2 Beyond doubt, both Cr(VI) and Pb(II) lead to various persistent diseases, such as anemia, cancer, renal failure, lung obstruction, and liver damage.3,4 Hence, the World Health Organization (WHO) set Cr(VI) as a class-I human carcinogen and announced the maximum allowable limit of total Cr (Cr(III) + (VI)) to 50.0 μg L−1 in drinking water.5,6 Moreover, the United States Environment Protection Agency (US-EPA) has specified the limit for Pb(II) as 15 μg L−1 and 100 μg L−1 in drinking water and water supporting aquatic life, respectively.7To date, numerous trending technologies such as reverse osmosis, electrochemical treatment, and advanced oxidation processes (AOPs) employed in water treatment8,9 are associated with the generation of secondary pollutants, high capital, and energy requirements.10,11 Nevertheless, adsorption is advantageous owing to its efficacy, simplicity, and cost-effectiveness.12–14 Intrinsically, the adsorption capacity of the adsorbent exceedingly depends on the specific surface area (SSA), polarity, porous structure, and surface functional groups attached to the adsorbent surface.14 Currently, various adsorbents, including inorganic materials,15 double-layered hydroxides,16 metal–organic frameworks,17 2D carbon-based materials,18 and polymers19 have drawn considerable attention.
Since 2004, the discovery of graphene20 has received priority over other adsorbents in water treatment and sustainability by using its functionalized derivative. Specifically, graphene oxide (GO), a perfect 2D substance, holds a honeycomb lattice produced from the oxidation of inexpensive graphite.21 The fundamental reason behind its priority is its two extraordinary features: (i) large surface area (theoretically 2630 m2 g−1),22 which aids it in offering a suitable specific area for adsorption; (ii) great extents of epoxy, hydroxyl, and carboxyl functional groups on the basal planes and edges can easily fit with metal ions through the chelation mechanism or electrostatic interaction.23,24 Therefore, in this research, graphene oxide is chosen for the adsorption of HMIs. Despite all of the unique properties of GO, there is a striking problem in that the solid GO sorbent tends to aggregate during adsorption due to π–π interactions and hence retard the adsorption phenomenon.19,25,26 To solve this problem, composites of GO with different synthetic polymers as the support have been studied to fabricate mixed matrix membranes (MMMs).25 Unfortunately, unbounded GO in the membrane creates electrostatic repulsion between negatively charged GO flakes, thereby causing instability in water.27 Hence, GO membranes can also be stabilized through electrostatic interaction using multivalent cationic metals, polymer and crosslinking agents.28 Therefore, to design a stable adsorbent, here GO is crosslinked with cellulose acetate (CA). The literature has also reported different works on GO composite membranes, for example, chitosan–GO,29 GO–cellulose,30 and GO–polyethyleneamine.31
Hydroxyapatite Ca10(PO4)6(OH)2, with abundant hydroxyl groups and minor water solubility, is recognized as a worthy material in wastewater treatment.32,33 However, metal-doped hydroxyapatite has been reported to have high efficiency in water purification because of its small crystallite size and bulky surface area.34,35 The structural flexibility of Hap allows for ion exchange in divergent crystallographic locations, but the core structure of HAP is left unchanged.36 Hence, in this study, Zn-doped Hap was selected for the adsorbent constituent and was successfully synthesized to remove HMIs from an aqueous solution. Several works, such as Sn–Hap35 for chromium and Mg–Hap34 for lead removal, have been published.
Notably, cellulose acetate (CA), a bio-based polymer, is regarded as a polymer matrix membrane due to its better film-forming ability, biocompatibility, and eco-friendliness.37 However, the CA film alone has poor mechanical and thermal properties. To overcome this weakness, CA is used with various materials like carbon nanotubes (CNTs)38 and graphene oxide (GO).39 As a consequence, CA is selected as a crosslinking polymer for the fabrication of the adsorbent.
In this research, we aim to engineer a new heterostructure containing these superior GO, Zn–Hap, and CA. Herein, the heterostructure is developed in a membrane form to overcome the aggregation of powder materials. A comprehensive study of the new heterostructure was employed by XPS to focus on the interaction and crosslinking within the materials. Importantly, the surface roughness has been measured by AFM and the surface area has been reported by performing N2 gas adoption desorption analysis. Exclusively, the adsorption isotherms and kinetic models were studied to understand the mechanism of HMIs adsorption. Aside from this analysis, the effects of coexisting ions and the reusability of the heterostructure in different cycles are profoundly taken into account. Concisely, the overall goal of the research is to: (1) design a promising porous heterostructure and elucidate the interaction between GO, Zn–Hap and CA; (2) determine the adsorption parameters; (3) underline the remediation mechanism of the Cr(VI) and Pb(II) ions from aqueous solution.
2 Experimental
2.1 Materials
All chemicals utilized in this research include graphite powder (C, 200 mesh, 99.9999%, Alfa Aesar), sulfuric acid (H2SO4, 95–97%, Sigma Aldrich), potassium permanganate (KMnO4, 99.0%, Sigma Aldrich), hydrogen peroxide (H2O2, 35%, Alfa Aesar), phosphoric acid, (H3PO4, Sigma Aldrich), hydrochloric acid (HCl, 38%, Sigma Aldrich), calcium hydroxide (Ca(OH)2, Sigma Aldrich), zinc nitrate (Zn(NO3)2·6H2O, Fluka, 98%), EDTA (Sigma Aldrich, 99.4%), ammonia (NH3) (Merck, Germany), and cellulose acetate (Sigma Aldrich; Mn 50![[thin space (1/6-em)]](https://www.rsc.org/images/entities/char_2009.gif) 000 GP). Each material holds high purity, and was hence used without any prior treatment.
000 GP). Each material holds high purity, and was hence used without any prior treatment.
2.2 Methods
![[thin space (1/6-em)]](https://www.rsc.org/images/entities/char_2009.gif) :
:![[thin space (1/6-em)]](https://www.rsc.org/images/entities/char_2009.gif) 1, and stirred for quite a few minutes. Next, 0.225 g of graphite powder was added gradually, followed by the addition of 1.32 g of potassium permanganate (KMnO4) into the solution mixture. After that, the solution was left for 6 h stirring until the solution turned into a dark greenish color. To remove excess KMnO4, hydrogen peroxide (H2O2), 0.675 mL was added dropwise with stirring. Since the reaction is exothermic, it was subjected to cooling with the support of an ice bath. The final solution was then washed with hydrochloric acid (HCl) and deionized water (DIW), and centrifuged at 5000 rpm. Lastly, the washed GO was oven-dried at 40 °C for 24 h to form the powder GO.
1, and stirred for quite a few minutes. Next, 0.225 g of graphite powder was added gradually, followed by the addition of 1.32 g of potassium permanganate (KMnO4) into the solution mixture. After that, the solution was left for 6 h stirring until the solution turned into a dark greenish color. To remove excess KMnO4, hydrogen peroxide (H2O2), 0.675 mL was added dropwise with stirring. Since the reaction is exothermic, it was subjected to cooling with the support of an ice bath. The final solution was then washed with hydrochloric acid (HCl) and deionized water (DIW), and centrifuged at 5000 rpm. Lastly, the washed GO was oven-dried at 40 °C for 24 h to form the powder GO.
![[thin space (1/6-em)]](https://www.rsc.org/images/entities/char_2009.gif) :
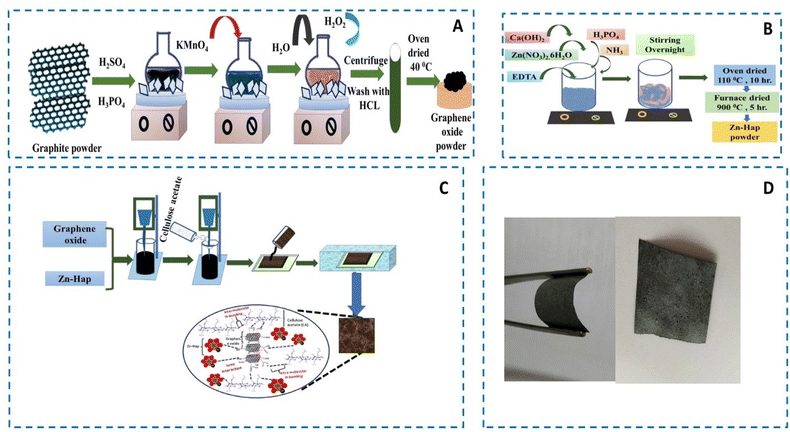
:![[thin space (1/6-em)]](https://www.rsc.org/images/entities/char_2009.gif) 50 ratios. Then, the mixture was extensively mixed at 5000 rpm for 2 h using a homogenizer (HG-15D). Afterward, 5% cellulose acetate was added and mixed at 5000 rpm for 1 h. Finally, the resultant solution was cast on a Petri glass of 60 mm in diameter. Then, the membranes were immerged in a water bath for the solvent inversion process to get the heterostructured GO@Zn–Hap@CA. Similarly, 5% cellulose acetate membrane was also prepared for comparison. Scheme 1 portrays the preparation of GO, Zn–HAP, and the fabrication of the GO@Zn–Hap@CA composite membranes.
50 ratios. Then, the mixture was extensively mixed at 5000 rpm for 2 h using a homogenizer (HG-15D). Afterward, 5% cellulose acetate was added and mixed at 5000 rpm for 1 h. Finally, the resultant solution was cast on a Petri glass of 60 mm in diameter. Then, the membranes were immerged in a water bath for the solvent inversion process to get the heterostructured GO@Zn–Hap@CA. Similarly, 5% cellulose acetate membrane was also prepared for comparison. Scheme 1 portrays the preparation of GO, Zn–HAP, and the fabrication of the GO@Zn–Hap@CA composite membranes.
2.3 Instrumental characterization
The topography and surface roughness of CA and GO@Zn–Hap@CA composite membrane were attained by atomic force microscopy (Flex AFM, C3000, Nanosurf, Switzerland) without any preparation of samples. The sample of the surface area (5 × 5 mm) was placed on a holder. The sample was subjected to an oscillating cantilever tip sinusoidally with 350 kHz resonating frequency. The mean surface roughness of the membrane was calculated by the following equation:45
 | (1) |
 | (2) |
 | (3) |
 | (4) |
Linear and non-linear Freundlich isotherms are addressed by the following eqn (5) and (6), respectively.47
 | (5) |
| qe = KfCe1/n | (6) |
The linear and non-linear D–R isotherms are represented by the following eqn (7) and (8) respectively.48
ln![[thin space (1/6-em)]](https://www.rsc.org/images/entities/char_2009.gif) Qe = ln Qe = ln![[thin space (1/6-em)]](https://www.rsc.org/images/entities/char_2009.gif) Qm − KDR∈2 Qm − KDR∈2 | (7) |
| Qe = Qm ekDRε2 | (8) |
∈ = RT![[thin space (1/6-em)]](https://www.rsc.org/images/entities/char_2009.gif) ln(1 + 1/Ce) ln(1 + 1/Ce) | (9) |
Linear and non-linear Temkin isotherms are represented by the following eqn (10) and (11) respectively.49
qe = A![[thin space (1/6-em)]](https://www.rsc.org/images/entities/char_2009.gif) ln ln![[thin space (1/6-em)]](https://www.rsc.org/images/entities/char_2009.gif) KT + A KT + A![[thin space (1/6-em)]](https://www.rsc.org/images/entities/char_2009.gif) ln ln![[thin space (1/6-em)]](https://www.rsc.org/images/entities/char_2009.gif) Ce Ce | (10) |
qe = A![[thin space (1/6-em)]](https://www.rsc.org/images/entities/char_2009.gif) ln(KTCe) ln(KTCe) | (11) |
 | (12) |
The kinetics of adsorption of Cr(VI) and Pb(II) on GO@Zn–Hap@CA were assessed with the pseudo-first order, pseudo-second order, and Elovich model by fitting the experimental data. The linear and non-linear pseudo-first-order Lagergren equations are given by the following eqn (13) and (14) respectively.50
 | (13) |
| qt = qe(1−e−k1t) | (14) |
The linear and non-linear pseudo-second-order models can be expressed as eqn (15) and (16) respectively:51
 | (15) |
 | (16) |
The linear and non-linear forms of the Elovich kinetics model are represented by the following eqn (17) and (18) respectively.52
 | (17) |
 | (18) |
3 Results and discussion
3.1 XRD and FTIR analysis
Fig. 1a displays the XRD patterns of Zn–Hap, GO, CA and GO@Zn–Hap@CA membranes. The XRD spectra of the Zn-doped Hap resemble the unique phase of hexagonal hydroxyapatite (Space group P63/standard card ICDD-PDF number 9-432).53 Here, the main apatite phase, 2θ = 31.87° (211 plane), confirmed the synthesis of Zn–Hap.54 The diffraction pattern of GO exhibits a peak at 2θ = 10.3° of plane (001) and interlayer distance, d = 0.86 nm, which arises mainly due to the oxidation of graphite.41 The characteristic peaks of CA at 2θ = 15.06° and 17.34° could be assigned to a semi-crystalline structure, while the peak at 2θ = 22.2° refers to the amorphous phase.55 In GO@Zn–Hap@CA, all of the dominating peaks of GO and Zn–Hap are observed. However, the spectra of amorphous CA were suppressed by the well-crystallized phase of Zn–Hap and GO.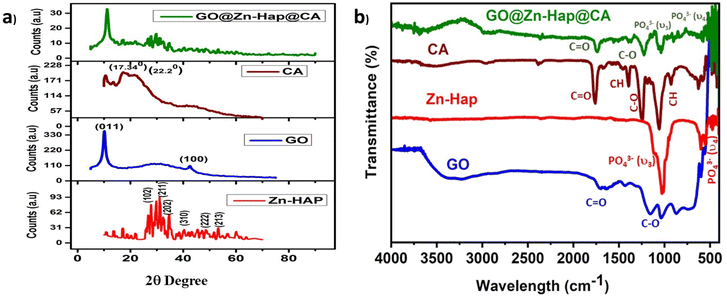 | ||
| Fig. 1 (a) XRD pattern of Zn–Hap, GO, CA, and GO@Zn–Hap@CA; (b) FTIR analysis of GO, Zn–Hap, CA, and GO@Zn–Hap@CA. | ||
FTIR spectroscopy was further employed to interpret the functionality of the as-prepared GO, Zn–Hap, CA and GO@Zn-Hao@CA. In the spectrum of GO in Fig. 1b, the appearance of a major peak at 3400 cm−1 confirms the symmetric stretching vibration of –OH of the surface carbocyclic ring.54 Other various oxygenated bond vibrational features at 1729 cm−1 and 1053 cm−1 could be attributed to the C![[double bond, length as m-dash]](https://www.rsc.org/images/entities/char_e001.gif) O and C–O (alkoxy) stretching vibrations, respectively,55 verifying the richness of the oxygenated group. In Zn–Hap, the spectrum bands at 562–564 cm−1 were ascribed to the O–P–O bending mode (ν4). Meanwhile, those within the 1036 and 1048 cm−1 regions are linked to the asymmetric stretching mode of PO43− (ν3).53,56 Normally, the adsorbed water molecules in Zn–Hap are defined by the vibrational bands from 3000–3800 cm−1. In the CA spectrum, the peaks at 1760 cm−1, 1242 cm −1, and 1400 cm−1 are ascribed to the –COO–, CO, and CH bonds, respectively. Moreover, the peak at 1053 cm−1 is assigned to the deformation vibrations of the CH and OH groups, and the features at 903 cm−1 are ascribed to the deformation vibrations of the –COC–, –CCO– and –CCH groups.1 In the spectrum of GO@Zn-Hao@CA, major peaks appeared at 1739 cm−1, 1221 cm−1, 1032 cm−1, and 573 cm−1, which correspond to the –COO–, C–O (epoxy), C–O (alkoxy), and O–P–O bonds, respectively. Here, a slight shifting in the peak position is observed compared to those of the characteristics peaks of Zn–Hap, GO, and CA. These might be because of the H-bonding interaction of CA, GO and Zn–Hap within the functional sites of GO@Zn-Hao@CA. Therefore, the FTIR results disclose the crosslinking interaction of CA with GO and Zn–Hap by peak shifting.
O and C–O (alkoxy) stretching vibrations, respectively,55 verifying the richness of the oxygenated group. In Zn–Hap, the spectrum bands at 562–564 cm−1 were ascribed to the O–P–O bending mode (ν4). Meanwhile, those within the 1036 and 1048 cm−1 regions are linked to the asymmetric stretching mode of PO43− (ν3).53,56 Normally, the adsorbed water molecules in Zn–Hap are defined by the vibrational bands from 3000–3800 cm−1. In the CA spectrum, the peaks at 1760 cm−1, 1242 cm −1, and 1400 cm−1 are ascribed to the –COO–, CO, and CH bonds, respectively. Moreover, the peak at 1053 cm−1 is assigned to the deformation vibrations of the CH and OH groups, and the features at 903 cm−1 are ascribed to the deformation vibrations of the –COC–, –CCO– and –CCH groups.1 In the spectrum of GO@Zn-Hao@CA, major peaks appeared at 1739 cm−1, 1221 cm−1, 1032 cm−1, and 573 cm−1, which correspond to the –COO–, C–O (epoxy), C–O (alkoxy), and O–P–O bonds, respectively. Here, a slight shifting in the peak position is observed compared to those of the characteristics peaks of Zn–Hap, GO, and CA. These might be because of the H-bonding interaction of CA, GO and Zn–Hap within the functional sites of GO@Zn-Hao@CA. Therefore, the FTIR results disclose the crosslinking interaction of CA with GO and Zn–Hap by peak shifting.
3.2 XPS analysis
XPS was performed to observe the elemental compositions and oxidation states of the as-prepared Zn–Hap, GO, CA and GO@Zn–Hap@CA membranes. As shown in Fig. 2, the C, O, Ca, P, and Zn elements were found on the survey XPS spectra of GO@Zn–Hap@CA, indicating that the composite was fully developed.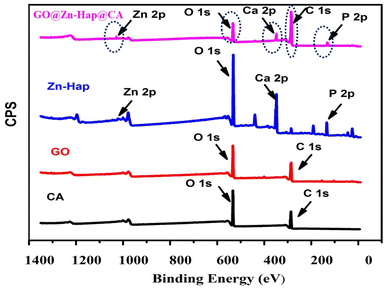 | ||
| Fig. 2 XPS survey spectrum of the cellulose acetate (CA) membrane, graphene oxide (GO), Zn–Hap and GO@Zn–Hap@CA. | ||
In the XPS survey spectra of the GO and CA, the percentage of C 1s was recorded at 61.8% and 62.3%, respectively. In sharp contrast, the carbon content in the GO@Zn–Hap@CA composite was significantly increased to 79.41%, verifying the addition of carbon-containing GO and CA.
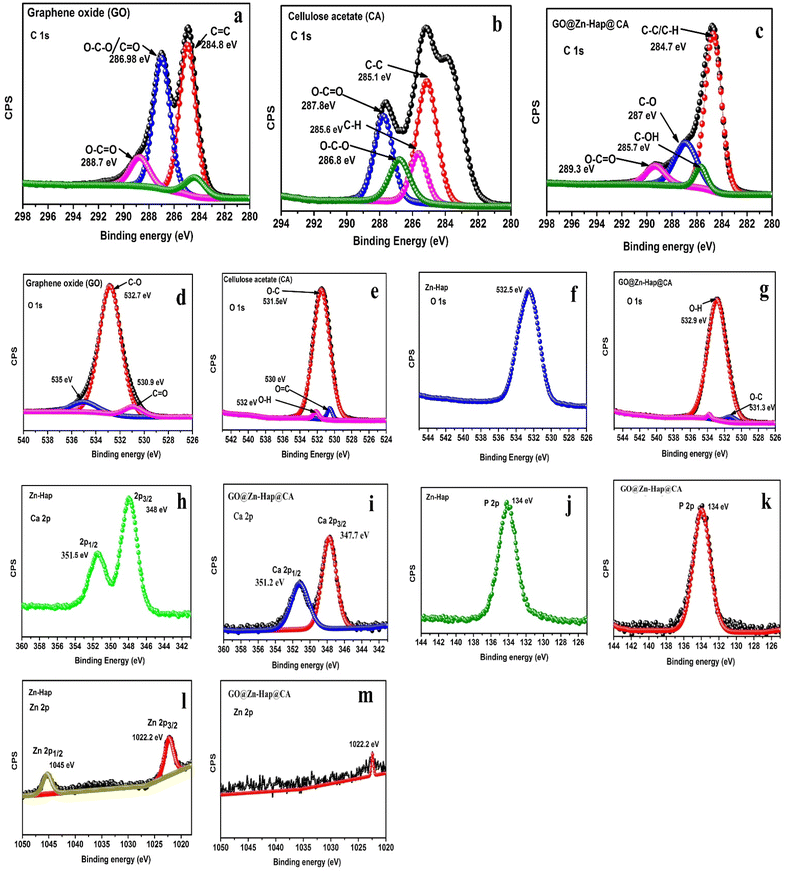
The core level C 1s spectra of GO (Fig. 3a) were fitted into peaks at 284.8 eV, 286.9 eV and 288.7 eV, which corresponded to the C–C/C![[double bond, length as m-dash]](https://www.rsc.org/images/entities/char_e001.gif) C, O–C–O and O–C
C, O–C–O and O–C![[double bond, length as m-dash]](https://www.rsc.org/images/entities/char_e001.gif) O bonds.57 Furthermore, The C 1s of CA (Fig. 3b) were deconvoluted into five peaks centered at 285.1 eV, 285.6 eV, 286.8 eV, and 287.8 eV assigned to C–C, C–H, O–C–O, and O–C
O bonds.57 Furthermore, The C 1s of CA (Fig. 3b) were deconvoluted into five peaks centered at 285.1 eV, 285.6 eV, 286.8 eV, and 287.8 eV assigned to C–C, C–H, O–C–O, and O–C![[double bond, length as m-dash]](https://www.rsc.org/images/entities/char_e001.gif) O, respectively.58 However, in GO@Zn–Hap@CA (Fig. 3c), the assigned positions of the C–C/C–H, C–OH, C–O, and O–C
O, respectively.58 However, in GO@Zn–Hap@CA (Fig. 3c), the assigned positions of the C–C/C–H, C–OH, C–O, and O–C![[double bond, length as m-dash]](https://www.rsc.org/images/entities/char_e001.gif) O functional groups were shifted and found at binding energies of 284.7 eV, 285.7 eV, 287 eV, and 289.3 eV, respectively.
O functional groups were shifted and found at binding energies of 284.7 eV, 285.7 eV, 287 eV, and 289.3 eV, respectively.
Additionally, the relative intensity of C–C was observed to increase, whereas the intensities of O–C![[double bond, length as m-dash]](https://www.rsc.org/images/entities/char_e001.gif) O and C–O decreased compared to GO and CA. This finding reveals the strong interaction of the carboxyl and carbonyl groups from GO and CA in the developed GO@Zn–Hap@CA.
O and C–O decreased compared to GO and CA. This finding reveals the strong interaction of the carboxyl and carbonyl groups from GO and CA in the developed GO@Zn–Hap@CA.
Fig. 3d exhibits the deconvoluted O 1s spectra at 532.7 eV, 530.9 eV and 535 eV of GO, which belong to the C–O, C![[double bond, length as m-dash]](https://www.rsc.org/images/entities/char_e001.gif) O, and O–H groups.44 For the O 1s spectra (Fig. 3e) of CA, the surface functional O–C, O
O, and O–H groups.44 For the O 1s spectra (Fig. 3e) of CA, the surface functional O–C, O![[double bond, length as m-dash]](https://www.rsc.org/images/entities/char_e001.gif) C, and O–H groups depict peaks at 531.5 eV, 530 eV, and 532 eV, while Zn–Hap shows a broad peak at 532.5 eV (Fig. 3f). Nevertheless, due to the interaction of the functional group in GO@Zn–Hap@CA, the C–O/O–H and O–C groups experienced peaks at 532.9 eV and 531.3 eV (Fig. 3g), respectively. The XPS peaks of Ca 2p in Zn–Hap appeared for the 2p3/2 and 2p1/2 electronic states of Ca(II) at 348.0 eV and 351.5 eV (Fig. 3h), respectively.47 However, the spin–orbit for 2p3/2 and 2p1/2 observed a decrease in intensity and a blue shift at the peak positions of 347.7 eV and 351.2 eV in GO@Zn–Hap@CA (Fig. 3i), respectively. The binding energy of P 2p was detected at 133 eV both in Zn–Hap and GO@Zn–Hap@CA (Fig. 3j and k).
C, and O–H groups depict peaks at 531.5 eV, 530 eV, and 532 eV, while Zn–Hap shows a broad peak at 532.5 eV (Fig. 3f). Nevertheless, due to the interaction of the functional group in GO@Zn–Hap@CA, the C–O/O–H and O–C groups experienced peaks at 532.9 eV and 531.3 eV (Fig. 3g), respectively. The XPS peaks of Ca 2p in Zn–Hap appeared for the 2p3/2 and 2p1/2 electronic states of Ca(II) at 348.0 eV and 351.5 eV (Fig. 3h), respectively.47 However, the spin–orbit for 2p3/2 and 2p1/2 observed a decrease in intensity and a blue shift at the peak positions of 347.7 eV and 351.2 eV in GO@Zn–Hap@CA (Fig. 3i), respectively. The binding energy of P 2p was detected at 133 eV both in Zn–Hap and GO@Zn–Hap@CA (Fig. 3j and k).
The XPS of Zn–HAp reveals that the Zn 2p spectrum (Fig. 3l) exhibits two peaks at 1022.2 eV and 1045 eV, confirming the Zn doping. Conferring to the research conducted by Zhang et al.,59 these two peaks can be attributed to the 2p3/2 and 2p1/2 electronic states of Zn(II). However, only a peak at 1022.4 eV was observed in GO@Zn–Hap@CA (Fig. 3m).
These overall shifting of the peak intensity of the functional groups verify the crosslinking interaction via intramolecular and intermolecular H-bond within the molecules of the GO@Zn–Hap@CA.
3.3 Morphological analysis
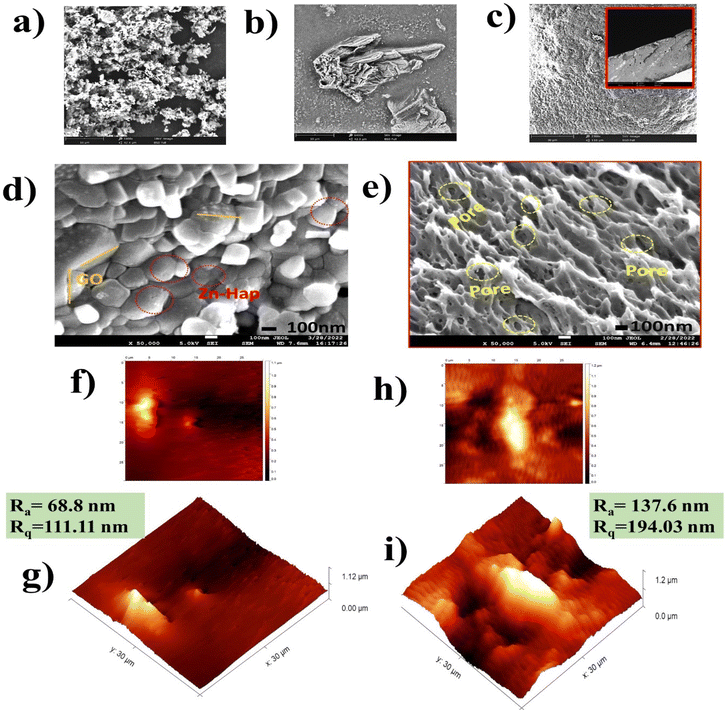
Fig. 4a–c illustrates the SEM micrograph of Zn–Hap (a), GO (b), and CA (c). Zn–Hap displays spherical shapes, but in agglomerated order.53 GO exhibits layered, crinkled and fairly wrinkled patterns.40 The top view of the CA film portrays a smooth texture, where the cross-section shows the porous structure.58The high-magnification FE-SEM image of GO@Zn–Hap@CA is shown in Fig. 4d. Spherical-sized Zn–Hap and GO layers are found on the top surface of the composite. Remarkably, the porous heterostructure is confirmed by the cross-section of the GO@Zn–Hap@CA (Fig. 4e), which clearly shows the pores within the heterostructure.
The surface topology and roughness of the CA membrane and GO@Zn–Hap@CA membranes were investigated by AFM. Fig. 4g demonstrates the 3D morphology of the CA membrane with high roughness and smooth areas owing to the spatial arrangement in the crystalline and amorphous zones. Here, the well-ordered crystalline alignment indicates high roughness areas with an average roughness (Ra) of about 68.8 nm and root mean square roughness (Rq) of about 111.11 nm. However, it was noticed that (Fig. 4i) the average roughness (Ra) was increased in GO@Zn–Hap@CA in comparison with the CA film from 68.8 to 137.6 nm. Additionally, a marked increment of the root mean square roughness (Rq) was observed from 111.11 nm in the CA film to 194.03 nm in the GO@Zn–Hap@CA composite. The increased Rq indicates the successful incorporation of Zn–Hap and GO. The peaks of roughness in GO@Zn–Hap@CA are considered as a hook to interlock guest molecules in aqueous environments.55,60
3.4 BET specific surface area measurements
The surface area and porosity play a significant role in determining the adsorbent performance.61,62 Nitrogen gas adsorption–desorption isotherms of the Zn–Hap, GO, CA and GO@Zn–Hap@CA composite membrane are shown in Fig. 5a. Table 1 summarizes the obtained BET surface area, pore-volume, and pore size diameter of the materials. The type of isotherms and pores were defined according to the IUPAC (International Union of Pure and Applied Chemistry) classification. According to IUPAC, the pore within the porous materials is signified as micropores (<2 nm in diameter), mesopores (2–50 nm), and macropores (>50 nm).18 The results indicated that the Zn–Hap and GO exhibit Type IV isotherm with a H4 type hysteresis loop, whereas CA and GO@Zn–Hap@CA show isotherms of Type III with a H3 type hysteresis loop (P/P0. range of 0.4 to 0.99).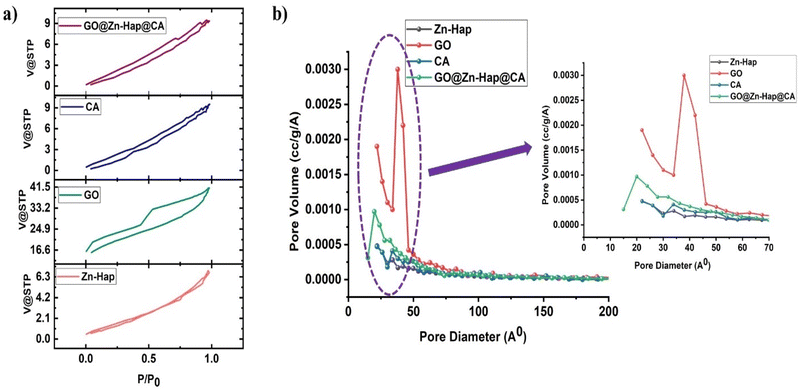 | ||
| Fig. 5 (a) N2 adsorption desorption isotherms, (b) BJH adsorption pore size distribution for GO, Zn–Hap, CA membrane and GO@Zn–Hap@CA. | ||
| Materials | Specific area, BET (m2 g−1) | Pore volume BJH (cm3 g−1) | Average pore size diameter (nm) |
|---|---|---|---|
| GO | 66 | 0.0634 | 3.8 |
| Zn–Hap | 5 | 0.0104 | 8.25 |
| Cellulose acetate | 10 | 0.0157 | 5.48 |
| GO@Zn–Hap@CA | 39 | 0.0144 | 4.52 |
The obtained BET surface area of the GO and Zn–Hap are 66 m2 g−1 and 5 m2 g−1, respectively. However, the BET surface area of the GO@Zn–Hap@CA composite was found to be 39 m2 g−1, which is lower than that of GO, but considerably higher than those of Zn–Hap and CA (10 m2 g−1). It is possible that CA was wrapped on GO, and resulted in the decrease in surface area of GO@Zn–Hap@CA compared to GO. Significantly, in the GO@Zn–Hap@CA composite membrane, the average pore diameter is reduced because the large pores of CA are filled with GO and Zn–Hap (Fig. 5b). Indeed, the obtained high surface area is exponentially beneficial for the adsorption of more heavy metals, and the mesoporous texture facilitates the diffusion of HMIs within the pores.
Notably, chromium is found in the chromic acid (H2CrO4), hydrogen chromate (HCrO4−), chromate (CrO42−), and dichromate (Cr2O72−) forms in aqueous solution. However, at pH < 1, H2CrO4 exists. Furthermore, at pH values between 1 to 6.5, HCrO4− exists, while at pH > 6.5, CrO42− forms.63
The following equations64 represent the speciation of chromium at different pH values:
| HCrO4− ↔ CrO42− + H+, pKa = 5.9 | (19) |
| H2CrO4 ↔ HCrO4− + H+, pKa = −0.26 | (20) |
| Cr2O72− + H2O ↔ 2HCrO4−, pKa = 2.2 | (21) |
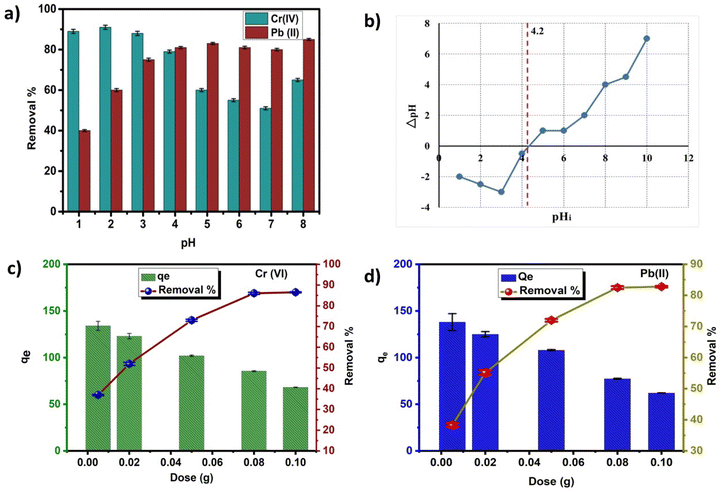
The as-prepared GO@Zn–Hap@CA holds alkoxyl, carboxyl, hydroxyl, and phosphate groups, which are easily protonated in an acidic environment. Therefore, adsorption of HCrO4− occurred via the electrostatic force of attraction between the positively charged GO@Zn–Hap@CA and the negatively charged HCrO4−. Nevertheless, with the gradual climb of solution pH, adsorption decreases owing to the infirm protonation, as well as electrostatic repulsion between the GO@Zn–Hap@CA composite surfaces and the negatively-charged pollutants. Meanwhile, precipitation of chromium metal occurs at pH > 6.0. Those results verify that the adsorption capacity of Cr(VI) by GO@Zn–Hap@CA is exceedingly reliant on the solution pH. Furthermore, the utmost adsorption capacity could be obtained at pH = 2.0. Thus, for the subsequent study, pH = 2.0 was selected as the optimum pH for Cr(VI) adsorption. Additionally, at pH = 2 (below pHpzc = 4.2), the adsorbent surface is positively charged and fosters the adsorption of anionic chromate ions.
In the case of Pb(II) ions, at acidic pH, hydrogen ions in solution compete with the Pb(II) ions for adsorption sites. This results in the trivial adsorption capacity for Pb(II) ions.65 With the increment of pH value, the carboxyl groups in the composite are converted to carboxylate anions.65 Hence, the electrostatic attraction between the Pb(II) ions and GO@Zn–Hap@CA is improved, which facilitates the adsorption of Pb(II) ions. Moreover, the rising pH value initiates a high concentration of OH− ions in solution, which tends to coordinate with Pb(II) ions to form a Pb(OH)2 precipitate. With increasing pH beyond pH = 6, PbOH+, Pb2OH3+, Pb(OH)2, Pb(OH)42− and Pb(OH)3− are found in the solution, while a white precipitate of Pb(OH)2 is formed at pH 8.0.66
Therefore, according to the investigated results, pH 5.0 was verified as the optimum pH value for the adsorption of Pb(II) ions to avoid precipitation. Moreover, at pH = 5 (above pHpzc = 4.2), the adsorbent surface possesses negative charges that increase the electrostatic attraction and strong adsorption of positive metal ions.
The effect of the adsorbent dosage for Cr(VI) and Pb(II) removal in a fixed pollutant concentration (100 mg L−1) was investigated, and the results are displayed in Fig. 6c and d. Here, it was found that for Cr(VI) and Pb(II), the percentage of removal increases from 37% to 73% and 40% to 72%, respectively, upon increasing the adsorbent dosage from 0.01 g to 0.1 g. For adsorbent dosages from 0.01 to 0.05 mg mL−1, the removal efficiency increases, which implies that more active sites become available for adsorption of HMIs with the increasing amount of adsorbent. However, upon extending the dosages beyond 0.05 g, the removal percentage remains the same, which indicates the existence of more adsorbent than the fixed concentration of HMIs.67,68
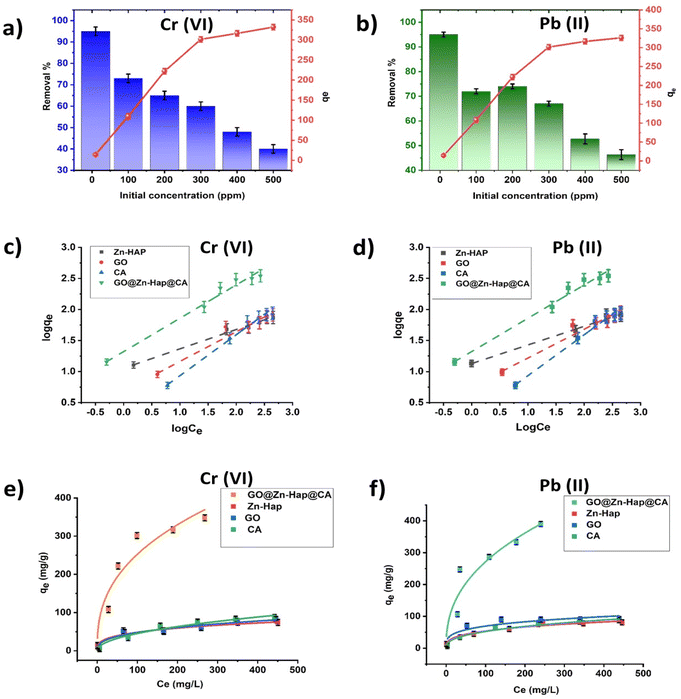
An adsorption isothermal investigation was performed by linear and non-linear isothermal models, where the best suited model was determined by the regression co-efficient (R2) value. Here, for the GO@Zn–Hap@CA composite, the regression coefficient (R2) in the linear Langmuir and linear Freundlich isotherm are well-fitted compared to other linear isotherms for both Cr(VI) and Pb(II). However, the R2 value in the linear Freundlich isotherm is close to ∼1 compared to the linear Langmuir isotherm, indicating that the linear Freundlich isotherm is better fitted for Cr(VI) and Pb(II) adsorption. Fig. 7c and d shows the liner fitting Freundlich isotherm of Zn–Hap, GO, CA and GO@Zn–Hap@CA for Cr(VI) and Pb(II) adsorption. The plots of all other linear isotherms, including Langmuir, Temkin and Dubinin–Radushkevich (Dub–Rad) models, are provided in Fig S7 and S8.† The value of the parameters of the linear isotherms are shown in Table 2. Notably, the linear Langmuir adsorption capacities of Cr(VI) onto Zn–Hap, GO, CA, and GO@Zn–Hap@CA were 78 mg g−1, 87 mg g−1, 113 mg g−1, and 384 mg g−1 at room temperature. For Pb(II), the linear Langmuir adsorption capacity onto Zn–Hap, GO, CA, and GO@Zn–Hap@CA were 86 mg g−1, 96 mg g−1, 120 mg g−1, and 400 mg g−1 at room temperature. Comparing with Zn–Hap, GO, and CA, the fabricated GO@Zn–Hap@CA showed significant increment in adsorption capacity for both Cr(VI) and Pb(II) due to the presence of abundant functional groups. Markedly, although GO had a higher surface area than GO@Zn–Hap@CA, GO behaved differently in aqueous solution.
| Isotherms | Parameter | Chromium | Lead | ||||||
|---|---|---|---|---|---|---|---|---|---|
| Zn–Hap | GO | CA membrane | GO@Zn–Hap@CA | Zn–Hap | GO | CA membrane | GO@Zn–Hap@CA | ||
| Langmuir | q max (mg g−1) | 78 | 87 | 113 | 384 | 86 | 96 | 120 | 400 |
| K L (L mg−1) | 97 | 119 | 140 | 3908 | 191 | 437 | 84 | 3358 | |
| R 2 | 0.9655 | 0.9513 | 0.9801 | 0.9683 | 0.9766 | 0.9982 | 0.9559 | 0.9572 | |
| Frendlich | K F (mg g−1) | 11.5 | 5.4 | 4.03 | 21.5 | 13.3 | 6.9 | 2.2 | 22.8 |
| n | 3.2 | 2.19 | 1.55 | 1.88 | 3.3 | 2.1 | 1.55 | 2 | |
| R 2 | 0.9864 | 0.9489 | 0.9848 | 0.9800 | 0.9889 | 0.8914 | 0.9848 | 0.9975 | |
| D–R | Q m (mg g−1) | 81 | 63 | 60 | 240 | 67 | 68 | 99 | 240 |
| K DR (mol2 Kj−2) | 1 × 10⁻⁶ | 6 × 10⁻⁶ | 1 × 10⁻⁶ | 4 × 10⁻⁷ | 5 × 10⁻⁷ | 5 × 10⁻⁶ | 4 × 10⁻⁶ | 4 × 10⁻⁷ | |
| R 2 | 0.9237 | 0.9491 | 0.9873 | 0.8829 | 0.8903 | 0.9525 | 0.9942 | 0.8849 | |
| Temkin | A (unitless) | 10 | 14 | 19 | 53 | 15 | 20 | 10 | 73 |
| K T (L mg−1) | 1.7 | 2.2 | 5.8 | 1.4 | 2.5 | 2.01 | 8.48 | 1.7 | |
| b (kJ mol−1) | 217 | 158 | 117 | 42 | 148 | 108 | 207 | 30 | |
| R 2 | 0.9386 | 0.937 | 0.941 | 0.8742 | 0.8954 | 0.9393 | 0.9957 | 0.8577 | |
GO sheets tend to restack, which may have reduced the abundancy of functional groups for adsorbing metal ions in comparison with the composite. The results have revealed that for Cr(VI) and Pb(II), the maximum adsorption capacity of GO@Zn–Hap@CA is 384 mg g−1 and 400 mg g−1 at room temperature, respectively. This indicates that GO@Zn–Hap@CA has enough adsorption sites, and consequently can reach saturation at a higher Cr(VI) and Pb(II) concentration.
Moreover, in the case of the non-linear isotherm, only the non-linear Freundlich isotherm is well fitted for the composite compared to the other studied isotherms. Fig. 7e and f show the non-linear Freundlich isotherms for Cr(VI) and Pb(II) adsorption on GO, Zn–Hap, CA and GO@Zn–HAP@CA, respectively. The values of the parameters of the non-linear isotherms are provided in Table S1.† Importantly, for both linear and non-linear Freundlich isotherms, the maximum adsorption capacity (Kf) of the GO@Zn–HAP@CA composite is higher than that for Zn–hap, GO and CA, which highlights the increment of adsorption sites in the designed GO@Zn–Hap@CA composite. Thus, the results support the multilayer coverage by the metal ions because of the porosity of the GO@Zn–Hap@CA. Moreover, the n value (1.88 for Cr(VI) and 2 for Pb(II)) in the linear Freundlich isotherm is greater than 1, demonstrating the favorable adsorption phenomenon.
| Adsorbent | Adsorbate | Equilibrium time | Adsorption condition | Ref. |
|---|---|---|---|---|
| CA–PCL/CS core–shell nanofibrous adsorbent | Chromium | 240 minutes | Metal ion concentration of 200 ppm, adsorbent dosage of 1 g L−1, and pH = 3 | 69 |
| rGO/PEI-KOH | Chromium | 24 hours | Metal ion concentration of100 ppm, adsorbent dosage 1 mg mL−1, pH = 2 | 70 |
| Fe3O4@n-HAp | Chromium | 70 minutes | Metal ion concentration of 100 ppm, adsorbent dosage of 0.1 g | 71 |
| HAP/Clin/NH2 | Chromium | 120 minutes | Metal ion concentration of 50 ppm, adsorbent dosage of 0.05 g, pH = 7 | 72 |
| GO@Zn–Hap@CA | Chromium | 50 minutes | Initial metal concentration = 100 ppm dosage = 0.05 g, pH = 2 | This study |
| 20 wt% HAp/Chitosan nanocomposite | Lead | 210 minutes | Metal ion concentration of 2000 ppm, adsorbent dosage of 0.1 g, pH = 4 | 73 |
| Modified CA | Lead | 90 minutes | Initial metal concentration = 10 mg L−1, pH ranged from 4.5 to 5.0, dosage = 0.5 g L−1 | 74 |
| MGO@TNs | Lead | 3 hours | Initial concentration = 100 ppm, pH = 5.0 | 75 |
| Glutathione-functionalizedNiFe2O4/graphene oxide | Lead | 90 minutes | Initial concentration = 10 ppm dosage = 10 mg, pH = 5 | 76 |
| GO@Zn–Hap@CA | Lead | 60 minutes | Initial metal concentration = 100 ppm dosage = 0.05 g, pH = 5 | This study |
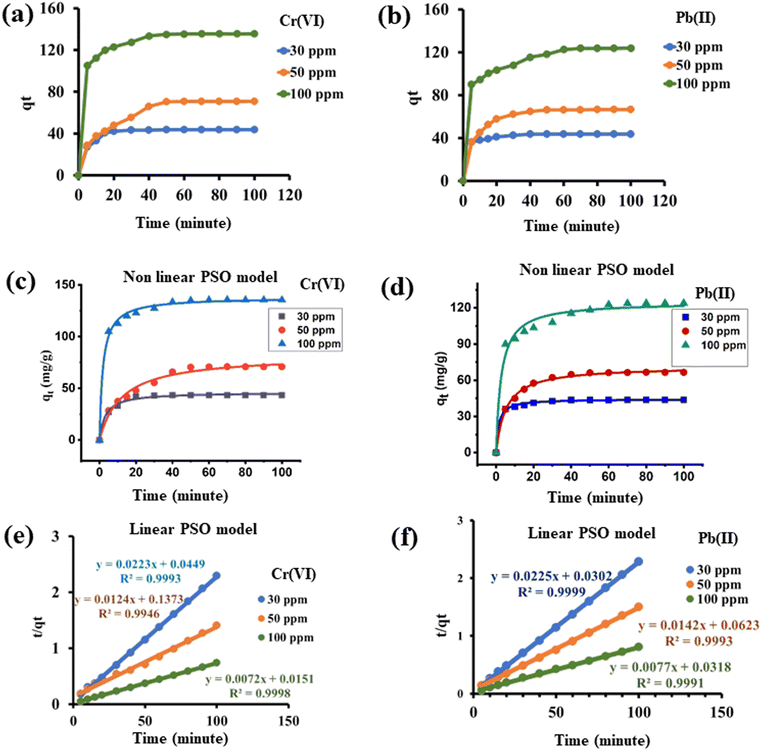
The kinetics of adsorption of Cr(VI) and Pb(II) onto GO@Zn–Hap@CA were evaluated with both linear and non-linear pseudo-first order, pseudo-second order, and Elovich models by fitting the batch adsorption data. By evaluating the regression coefficient (R2), it is suggested that the pseudo second order kinetic model of both linear and non-linear isotherms is best suited with the experimental data in comparison to the other kinetic models. The nonlinear and linear fittings of the pseudo second order kinetic model for Cr(VI) and Pb(II) are displayed in Fig. 8c–f. The other studied kinetics models are presented in Fig. S9–S12.† Furthermore, the calculated adsorption capacity (qm cal) for both Cr(VI) and Pb(II) in the linear and non-linear pseudo-second order kinetic models is closer to that obtained in the experimental data. Thus, the result indicated that the pseudo-second-order model is well-tuned with the experimental data for both Cr(VI) and Pb(II) adsorption. All of the linear kinetics parameters are recorded in Table 4, and the non-linear kinetics parameters are in Table S2.†
| Kinetic model and parameter | Chromium | Lead | ||||
|---|---|---|---|---|---|---|
| Concentration | 30 ppm | 50 ppm | 100 ppm | 30 ppm | 50 ppm | 100 ppm |
| Experimental qe (mg g−1) | 43.8 | 72 | 136.5 | 43.8 | 67.5 | 124.5 |
| Pseudo first order (PFO) | ||||||
| q ecal (mg g−1) | 2.06 | 5.19 | 4.09 | 2.05 | 3.76 | 5.59 |
| K 1 (min−1) | −0.00013 | 0.000141 | −1.27 × 10⁻⁴ | −0.00016 | −0.00012 | −1.56 × 10⁻⁴ |
| R 2 | 0.7053 | 0.867 | 0.8705 | 0.8096 | 0.8598 | 0.9565 |
![[thin space (1/6-em)]](https://www.rsc.org/images/entities/char_2009.gif) |
||||||
| Pseudo second order (PSO) | ||||||
| K 2 (g mg−1 min−1) | 0.011076 | 0.00112 | 0.003433 | 0.01676 | 0.003237 | 0.00186 |
| q e cal (mg g−1) | 44.84 | 80.6 | 138.8 | 44.4 | 70.4 | 129.8 |
| R 2 | 0.9993 | 0.9946 | 0.9998 | 0.9999 | 0.9993 | 0.9991 |
![[thin space (1/6-em)]](https://www.rsc.org/images/entities/char_2009.gif) |
||||||
| Elovich kinetic model | ||||||
| α (mg g−1 min−1) | 0.207 | 0.0623 | 0.093006 | 0.37669 | 0.0981 | 0.0769 |
| β (g mg−1) | 4.8544 × 10¹¹ | 1917.5 | 9.34255 × 1040 | 2.08606 × 10¹⁵ | 1.54274 × 10¹² | 1.06042 × 1031 |
| R 2 | 0.745 | 0.9541 | 0.9473 | 0.907 | 0.913 | 0.9742 |
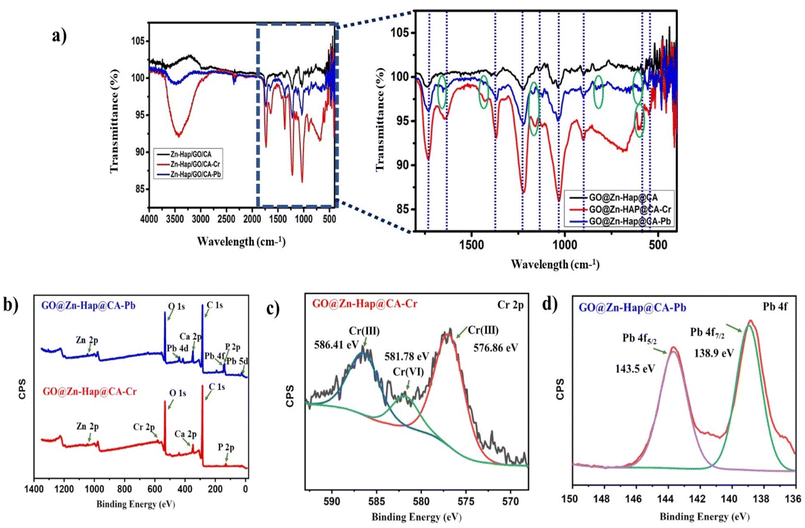
XPS analysis was used to further elucidate the adsorption mechanism of Cr(VI) and Pb(II) on GO@Zn–Hap@CA. Fig. 9b demonstrates the survey spectrum of the Cr(VI) and Pb(II) loaded GO@Zn–Hap@CA composite. After Cr(VI) adsorption, in contrast with the XPS spectrum of GO@Zn–Hap@CA (Fig. 2), a new peak of binding energy (B.E) 577 eV arises in the GO@Zn–Hap@CA-Cr(VI) spectrum (Fig. 9b), which verifies the presence of chromium. The Cr 2p spectrum (Fig. 9c) is deconvoluted into peaks at 576.86 eV and 586.41 eV, which resembles the Cr 2p3/2 and Cr 2p1/2 states of Cr(III), while the peaks at 581.78 eV correspond to the Cr 2p3/2 state of Cr(VI).79 In the composite, there exists abundant amounts of carboxyl groups from GO and CA, and hydroxyl groups from Zn–Hap, GO and CA. The excessive amount of –C![[double bond, length as m-dash]](https://www.rsc.org/images/entities/char_e001.gif) O, –OH groups can be readily protonated in the acidic environment that contributes to the reduction of Cr(VI) to Cr(III), which is less toxic than Cr(VI).70 The following mentioned redox reactions are suggested to have involvement in the reduction of Cr(VI) to Cr(III).80
O, –OH groups can be readily protonated in the acidic environment that contributes to the reduction of Cr(VI) to Cr(III), which is less toxic than Cr(VI).70 The following mentioned redox reactions are suggested to have involvement in the reduction of Cr(VI) to Cr(III).80
R-CH2-OH + Cr(VI) → R-(C![[double bond, length as m-dash]](https://www.rsc.org/images/entities/char_e001.gif) O) H + Cr(III) O) H + Cr(III) | (22) |
R-(C![[double bond, length as m-dash]](https://www.rsc.org/images/entities/char_e001.gif) O) H + Cr(VI) → R-COOH + Cr(III) O) H + Cr(VI) → R-COOH + Cr(III) | (23) |
Moreover, in the presence of a π-electron donor, the six-member aromatic ring of GO, more Cr(VI) was profoundly reduced to Cr(III) in the acidic media. Therefore, the intensity of signal for Cr(VI) was found to be lower than Cr(III). The successive reduction of Cr(VI) to Cr(III) occurred by the following reactions:79
| HCrO4− + 7H+ + 3e− → Cr3+ + 4H2O | (24) |
| Cr2O72− + 14H+ + 6e− → 2Cr3+ + 7H2O | (25) |
In similar context, after Pb(II) adsorption (Fig. 9b), the characteristic peaks are detected for Pb 4d, Pb 4f, Pb 5d, at binding energies of 434 eV, 140 eV and 18 eV, respectively which confirms the adsorption of Pb(II) onto the GO@Zn–Hap@CA surface. Moreover, the high-resolution deconvoluted spectra at 138.9 eV and 143.5 eV in Fig. 9d are linked to the Pb 4f7/2 and Pb 4f5/2 states of Pb(II) adsorbed on the composite surface.81,82 Noticeably, after adsorption of HMIs, all other deconvoluted spectra of C1s, O 1s, Ca 2p, P 2p, and Zn 2s (Fig. S13 and S14†) of the HMIs loaded-composite show a slight shifting in the binding energy compared to the composite before adsorption. Hence, the involvement of these groups in the adsorption phenomenon is verified.
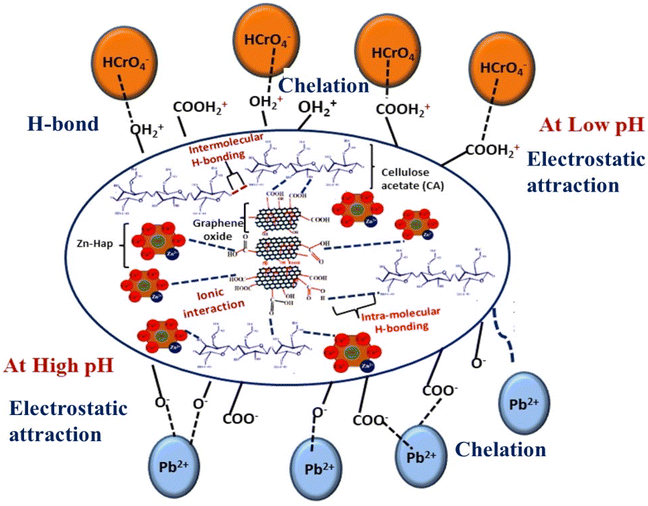
Moreover, FESEM-EDX analysis of chromium (Fig. S15a†) and lead (Fig. S15b†) adsorbed on GO@Zn–Hap@CA discloses the presence of chromium and lead elements in the heterostructure. Fig. 10 illustrates the mechanism of adsorption of metal ions on GO@Zn–Hap@CA. Briefly, it is suggested that three types of features (including electrostatic, H-bond, and chelate formation) between the metal ions and adsorbate govern the removal of Cr(VI) and Pb(II) from aqueous media.
From the experiment, it is evidently observed in Fig. 11a that cations (Cd2+, Cu2+, Mn2+, Pb2+) did not interfere with Cr(VI) adsorption on GO@Zn–Hap@CA at pH = 2. This is because of the fact that at lower pH, the adsorption surface is positively charged. This implies that there was repulsion between the positively charged cations on the adsorbent surface, thus facilitating the adsorption of the negatively charged chromate. Moreover, SO42−, Cl−, and NO3− are low affinity ligands,83 which implies less adsorption, and thus less competition with Cr(VI) ions at their lower concentration. Hence, adsorption of Cr(VI) by GO@Zn–Hap@CA is slightly decreased (from 73% to 71% for Cl−, from 73% to 71% for NO3−, and from 73% to 65% for SO42−) at 30 ppm co-existing ions. Thus, the results signify the promising potency of the adsorbent.
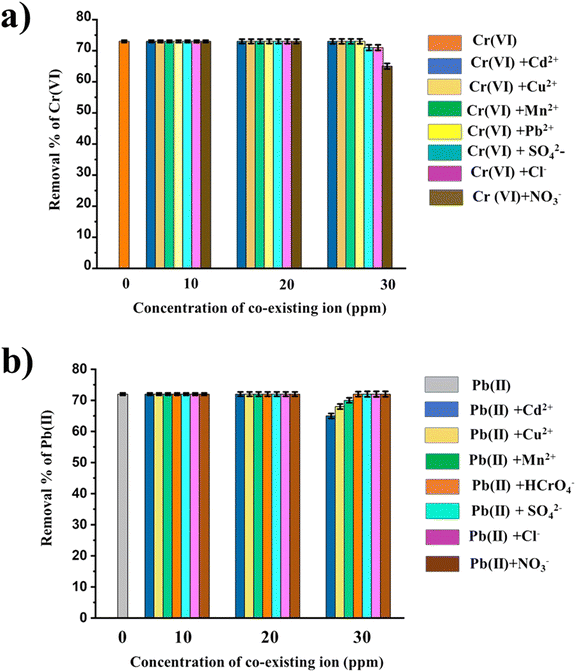 | ||
| Fig. 11 (a) Effect of co-existing ions on Cr(VI) removal by GO@Zn–Hap@CA. (b) Effect of co-existing ions on Pb(II) removal by GO@Zn–Hap@CA. | ||
In the case of Pb(II) (Fig. 11b), the percentage removal of Pb(II) was not changed when the concentration of the co-existing cations (Cd2+, Cu2+, Mn2+) was increased up to 20 ppm. However, the concentration was decreased slightly (from 72% to 65% for Cu2+, 72% to 68% for Cd2+, 72% 70% for Mn2+) when it increased to 30 ppm. This may be because of the competition for the active sites on the adsorbent. Mainly, the characteristic covalent index (X2mr, where Xm defines the electronegativity and r denotes the ionic radius) governs the selective adsorption of Pb(II) by GO@Zn–Hap@CA. The larger the value of X2mr, the more the metal ions favorably interact with the active functional sites.84 Notably, the covalent index is decreased in the following order: Pb (6.41) > Cu (2.98) > Cd (2.71) > Mn(II) (1.97),85 indicating that Pb(II) has an intense attraction to the functional sites of the adsorbent when compared to Cu, Cd, and Mn. In the case of the coexisting anionic species (SO42, Cl−, NO3− HCrO4−) at pH = 5, the adsorbent surface is negatively charged, which generates repulsion between the negatively charged surface and anions. This situation promotes the easy adsorption of positive Pb(II) metal ions. These results recommended that Pb(II) could be successfully removed using GO@Zn–Hap@CA, despite the existence of inferring ions.
Fig. 12 illustrates that the removal% of HMIs is more when a high concentration solvent is used for desorption. It is plausible that the amount of hydrogen ions and hydroxyl ions is responsible for the desorption effectiveness via ion exchange process with positively charged and negatively charged metal ions. Herein, the Cr(VI) removal (%) was decreased from 73% to 69% from the first cycle to the third cycle when 0.5 M NaOH was used. Pb(II) removal (%) was decreased from 72% to 70% from the first cycle to the third cycle when 0.5 M HCl was used. This decrease in adsorption efficiency is possibly because of the partial desorption, as well as irreversible chelate formation, of Cr(VI) and Pb(II) onto the GO@Zn–Hap@CA surface. Therefore, it is evident that the GO@Zn–Hap@CA could be reused for the removal of Cr(VI) and Pb(II) from polluted water for up to three consecutive cycles. Table 5 shows the comparison of different GO, doped hap-based adsorbents for chromium and lead removal with the new developed adsorbent. It is clearly evident from Table 5 that the GO@Zn–Hap@CA exhibits high adsorption capacity (qmax), and therefore endows extreme potentials for the removal of the Cr(VI) and Pb(II) ions from aqueous media.
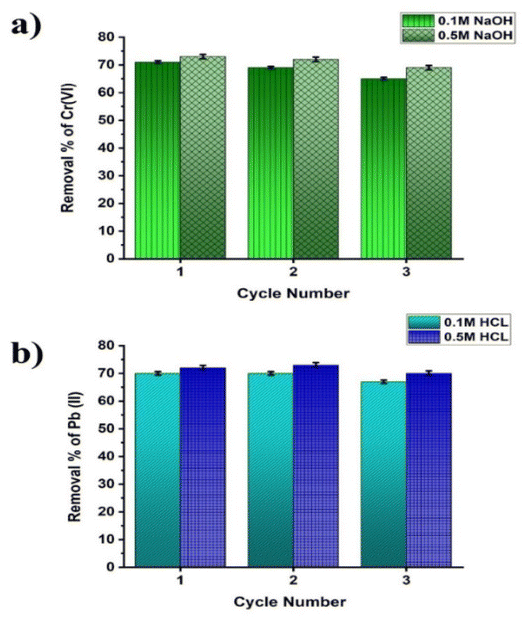 | ||
| Fig. 12 (a) Removal efficiency of Cr(VI) ions of each cycle after desorption with NaOH. (b) Removal efficiency of Pb(II) ions of each cycle after desorption with HCl. | ||
| Adsorbate | Adsorbent | Q max | Ref. |
|---|---|---|---|
| Chromium | RGO/Hat hybrid composite | 45.2 | 86 |
| Chitosan grafted GO nanocomposite | 292.8 | 87 | |
| Chitosan/GO | 310.4 | 88 | |
| Sr-Hap | 443 | 89 | |
| RGO-PEI-KOH | 398.9 | 31 | |
| GO@Zn–Hap@CA | 384 | This study | |
| Lead | GO from waste dry cell battery | 55.8 | 90 |
| GO/alginate hydrogel | 118.6 | 4 | |
| Nanohydroxyapatite | 192.3 | 91 | |
| Mg–Hap | 218 | 34 | |
| EDTA functionalized magnetic GO | 268.4 | 92 | |
| GO@Zn–Hap@CA | 400 | This study |
4 Conclusions
In summary, GO@Zn–Hap@CA was successfully fabricated in the form of a well-built structure. The crosslinking interaction via intramolecular and intermolecular H-bonds within the molecules of the GO@Zn–Hap@CA heterostructure was confirmed by FT-IR and XPS. A remarkable average roughness (Ra) of about 137 nm and root mean square roughness (Rq) of about 194 nm are credited for the favorable decrease of Cr(VI) and Pb(II) ions from aqueous solution. Notably, the high surface area and mesoporous texture of about 4.52 nm also enhanced the removal of Cr(VI) and Pb(II) ions. Batch adsorption experiments confirmed that GO@Zn–Hap@CA possesses a high linear Langmuir adsorption capacity, 384 mg g−1 for Cr(VI) at pH = 2 and 400 mg g−1 for Pb(II) at pH = 5. Moreover, rapid removal of Cr(VI) and Pb(II) was observed within 50 minutes and 60 minutes, respectively. The adsorption process was fitted well to the linear and non-linear pseudo-second-order models and linear Freundlich model. Significantly, the mechanism of adsorption by XPS indicates the adsorption of lead and chromium to the functional sites, and affirms the reduction of toxic chromium(VI) to the less toxic Cr(III). Effects of the co-existing ions reveal that up to 20 ppm concentration of co-existing ions had no impact on the adsorption potency. In addition, after three adsorption–desorption cycles, the GO@Zn–Hap@CA exhibits 69% and 70% removal efficiency of Cr(VI) and Pb(II), respectively, signifying its excellent recyclability. This work offers a new heterostructured adsorbent to eliminate the potentially hazardous heavy metals from wastewater.Author contributions
Monika Mahmud designed the research plan, conducted the experiments, and wrote the manuscript. Md. Sahadat Hossain conducted the batch experiments. Mashrafi Bin Mobarak conducted the batch experiments. Md. Saiful Quddus conducted the experiment for surface area and porosity analysis. Muhammad Shahriar Bashar conducted the experiment for roughness analysis. Umme Sarmeen Akhtar conducted the experiment for XPS analysis. Shirin Akter Jahan contributed to all of the experiments and analysis. Dipa Islam conducted the experiment for the morphological investigation. Samina Ahmed supervised the entire research work and contributed to the entire experimental analysis.Conflicts of interest
There is no conflict of interest to report.Acknowledgements
We gratefully acknowledge the Bangladesh Council of Scientific and Industrial Research (BCSIR) authority for approving the R&D project (R&D ref. No. 39.02.0000.011.14.128.2020.636, Date 29.12.2020).References
- R. Al-Wafi, M. K. Ahmed and S. F. Mansour, Tuning the synthetic conditions of graphene oxide/magnetite/hydroxyapatite/cellulose acetate nanofibrous membranes for removing Cr (VI), Se (IV) and methylene blue from aqueous solutions, J. Water Process Eng., 2020, 38, 101543 CrossRef.
- M. Feng, P. Zhang, H. C. Zhou and V. K. Sharma, Water-stable metal-organic frameworks for aqueous removal of heavy metals and radionuclides: A review, Chemosphere, 2018, 209, 783–800 CrossRef CAS PubMed.
- P. C. Bandara, J. Peña-Bahamonde and D. F. Rodrigues, Redox mechanisms of conversion of Cr (VI) to Cr (III) by graphene oxide-polymer composite, Sci. Rep., 2020, 10(1), 1–8 CrossRef PubMed.
- C. Bai, L. Wang and Z. Zhu, Adsorption of Cr (III) and Pb (II) by graphene oxide/alginate hydrogel membrane: Characterization, adsorption kinetics, isotherm and thermodynamics studies, Int. J. Biol. Macromol., 2020, 147, 898–910 CrossRef CAS PubMed.
- S. M. Anush and B. Vishalakshi, Modified chitosan gel incorporated with magnetic nanoparticle for removal of Cu (II) and Cr (VI) from aqueous solution, Int. J. Biol. Macromol., 2019, 133, 1051–1062 CrossRef CAS PubMed.
- A. Vengosh, R. Coyte, J. Karr, J. S. Harkness, A. J. Kondash and L. S. Ruhl, et al., Origin of hexavalent chromium in drinking water wells from the piedmont aquifers of North Carolina, Environ. Sci. Technol. Lett., 2016, 3(12), 409–414 CrossRef CAS.
- M. Mahmud, M. Sahadat Hossain, M. Bin Mobarak, S. Sultana, S. Sharmin and S. Ahmed, Co-precipitation synthesis of non-cytotoxic and magnetic cobalt ferrite nanoparticles for purging heavy metal from the aqueous medium: Pb (II) adsorption isotherms and kinetics study, Chem. Ecol., 2022, 38(6), 544–563 CrossRef CAS.
- K. A. Kumar, B. Lakshminarayana, D. Suryakala and C. Subrahmanyam, Reduced graphene oxide supported ZnO quantum dots for visible light-induced simultaneous removal of tetracycline and hexavalent chromium, RSC Adv., 2020, 10(35), 20494–20503 RSC.
- S. Habibi, A. Nematollahzadeh and S. A. Mousavi, Nano-scale modification of polysulfone membrane matrix and the surface for the separation of chromium ions from water, Chem. Eng. J., 2015, 267, 306–316 CrossRef CAS.
- Z. Wu, W. Huang, X. Shan and Z. Li, Preparation of a porous graphene oxide/alkali lignin aerogel composite and its adsorption properties for methylene blue, Int. J. Biol. Macromol., 2020, 143, 325–333 CrossRef CAS PubMed.
- W. Wei, X. Han, M. Zhang, Y. Zhang and C. Zheng, Macromolecular humic acid modified nano-hydroxyapatite for simultaneous removal of Cu (II) and methylene blue from aqueous solution: experimental design and adsorption study, Int. J. Biol. Macromol., 2020, 150, 849–860 CrossRef CAS PubMed.
- M. S. Moorthy, D. J. Seo, H. J. Song, S. S. Park and C. S. Ha, Magnetic mesoporous silica hybrid nanoparticles for highly selective boron adsorption, J. Mater. Chem. A, 2013, 1(40), 12485–12496 RSC.
- F. Fu and Q. Wang, Removal of heavy metal ions from wastewaters: a review, J. Environ. Manage., 2011, 92(3), 407–418 CrossRef CAS PubMed.
- N. K. Mondal and S. Chakraborty, Adsorption of Cr (VI) from aqueous solution on graphene oxide (GO) prepared from graphite: equilibrium, kinetic and thermodynamic studies, Appl. Water Sci., 2020, 10(2), 1–10 Search PubMed.
- P. Yuan, M. Fan, D. Yang, H. He, D. Liu and A. Yuan, et al., Montmorillonite-supported magnetite nanoparticles for the removal of hexavalent chromium [Cr (VI)] from aqueous solutions, J. Hazard. Mater., 2009, 166(2–3), 821–829 CrossRef CAS PubMed.
- P. K. Mishra, R. Kumar and P. K. Rai, Surfactant-free one-pot synthesis of CeO 2, TiO 2 and Ti@ Ce oxide nanoparticles for the ultrafast removal of Cr (vi) from aqueous media, Nanoscale, 2018, 10(15), 7257–7269 RSC.
- F. Latifeh, Y. Yamini and S. Seidi, Ionic liquid-modified silica-coated magnetic nanoparticles: promising adsorbents for ultra-fast extraction of paraquat from aqueous solution, Environ. Sci. Pollut. Res. Int., 2016, 23(5), 4411–4421 CrossRef CAS PubMed.
- B. Zheng, X. Lin, X. Zhang, D. Wu and K. Matyjaszewski, Emerging functional porous polymeric and carbonaceous materials for environmental treatment and energy storage, Adv. Funct. Mater., 2020, 30(41), 1907006 CrossRef CAS.
- J. Mei, H. Zhang, S. Mo, Y. Zhang, Z. Li and H. Ou, Prominent adsorption of Cr (VI) with graphene oxide aerogel twined with creeper-like polymer based on chitosan oligosaccharide, Carbohydr. Polym., 2020, 247, 116733 CrossRef CAS PubMed.
- K. S. Novoselov, A. K. Geim, S. V. Morozov, D. Jiang eng, Y. Zhang and S. V. Dubonos, et al., Electric field effect in atomically thin carbon films, Science, 2004, 306(5696), 666–669 CrossRef CAS PubMed.
- H. Wu, L. Li, K. Chang, K. Du, C. Shen and S. Zhou, et al., Graphene oxide decorated nanoscale iron sulfide for highly efficient scavenging of hexavalent chromium from aqueous solutions, J. Environ. Chem. Eng., 2020, 8(4), 103882 CrossRef CAS.
- S. M. Anush, H. R. Chandan, B. H. Gayathri, N. Manju, B. Vishalakshi and B. Kalluraya, Graphene oxide functionalized chitosan-magnetite nanocomposite for removal of Cu (II) and Cr (VI) from waste water, Int. J. Biol. Macromol., 2020, 164, 4391–4402 CrossRef CAS PubMed.
- Y. Yoon, M. Zheng, Y. T. Ahn, W. K. Park, W. S. Yang and J. W. Kang, Synthesis of magnetite/non-oxidative graphene composites and their application for arsenic removal, Sep. Purif. Technol., 2017, 178, 40–48 CrossRef CAS.
- L. Yang, F. Jia and S. Song, Recovery of [Au (CN) 2]- from gold cyanidation with graphene oxide as adsorbent, Sep. Purif. Technol., 2017, 186, 63–69 CrossRef CAS.
- S. Bao, W. Yang, Y. Wang, Y. Yu, Y. Sun and K. Li, PEI grafted amino-functionalized graphene oxide nanosheets for ultrafast and high selectivity removal of Cr (VI) from aqueous solutions by adsorption combined with reduction: Behaviors and mechanisms, Chem. Eng. J., 2020, 399, 125762 CrossRef CAS.
- M. Shaban, M. R. Abukhadra, M. Rabia, Y. A. Elkader and M. R. Abd El-Halim, Investigation the adsorption properties of graphene oxide and polyaniline nano/micro structures for efficient removal of toxic Cr(VI) contaminants from aqueous solutions; kinetic and equilibrium studies, Atti Accad. Naz. Lincei, Cl. Sci. Fis., Mat. Nat., Rend., 2018, 29(1), 141–154 CrossRef.
- J. Geng, Y. Yin, Q. Liang, Z. Zhu and H. Luo, Polyethyleneimine cross-linked graphene oxide for removing hazardous hexavalent chromium: Adsorption performance and mechanism, Chem. Eng. J., 2019, 361, 1497–1510 CrossRef CAS.
- M. Yan, W. Huang and Z. Li, Chitosan cross-linked graphene oxide/lignosulfonate composite aerogel for enhanced adsorption of methylene blue in water, Int. J. Biol. Macromol., 2019, 136, 927–935 CrossRef CAS PubMed.
- L. Liu, C. Li, C. Bao, Q. Jia, P. Xiao and X. Liu, et al., Preparation and characterization of chitosan/graphene oxide composites for the adsorption of Au (III) and Pd (II), Talanta, 2012, 93, 350–357 CrossRef CAS PubMed.
- A. A. Yakout, R. H. El-Sokkary, M. A. Shreadah and O. G. A. Hamid, Cross-linked graphene oxide sheets via modified extracted cellulose with high metal adsorption, Carbohydr. Polym., 2017, 172, 20–27 CrossRef CAS PubMed.
- Y. Tadjenant, N. Dokhan, A. Barras, A. Addad, R. Jijie and S. Szunerits, et al., Graphene oxide chemically reduced and functionalized with KOH-PEI for efficient Cr (VI) adsorption and reduction in acidic medium, Chemosphere, 2020, 258, 127316 CrossRef CAS PubMed.
- S. Pai, S. M. Kini, R. Selvaraj and A. Pugazhendhi, A review on the synthesis of hydroxyapatite, its composites and adsorptive removal of pollutants from wastewater, J. Water Process Eng., 2020, 38, 101574 CrossRef.
- J. K. Rajak, N. Khandelwal, M. P. Behera, E. Tiwari, N. Singh and Z. A. Ganie, et al., Removal of chromate ions from leachate-contaminated groundwater samples of Khan Chandpur, India, using chitin modified iron-enriched hydroxyapatite nanocomposite, Environ. Sci. Pollut. Res., 2021, 28(31), 41760–41771 CrossRef CAS PubMed.
- M. Zhou, X. Yan, H. Zou, Y. Zhao, N. Yin and C. Zhang, et al., Enhanced adsorption of Pb (II) from aqueous solution by magnesium-incorporated hydroxyapatite with poor crystalline structure, Desalin. Water Treat., 2019, 171, 183–195 CrossRef CAS.
- S. Campisi, C. Evangelisti, G. Postole and A. Gervasini, Combination of interfacial reduction of hexavalent chromium and trivalent chromium immobilization on tin-functionalized hydroxyapatite materials, Appl. Surf. Sci., 2021, 539, 148227 CrossRef CAS.
- A. Fakharzadeh, R. Ebrahimi-Kahrizsangi, B. Nasiri-Tabrizi and W. J. Basirun, Effect of dopant loading on the structural features of silver-doped hydroxyapatite obtained by mechanochemical method, Ceram. Int., 2017, 43(15), 12588–12598 CrossRef CAS.
- V. K. Gupta, P. J. M. Carrott, R. Singh, M. Chaudhary and S. Kushwaha, Cellulose: a review as natural, modified and activated carbon adsorbent, Bioresour. Technol., 2016, 216, 1066–1076 CrossRef PubMed.
- A. ZabihiSahebi, S. Koushkbaghi, M. Pishnamazi, A. Askari, R. Khosravi and M. Irani, Synthesis of cellulose acetate/chitosan/SWCNT/Fe3O4/TiO2 composite nanofibers for the removal of Cr(VI), As(V), Methylene blue and Congo red from aqueous solutions, Int. J. Biol. Macromol., 2019, 140, 1296–1304 CrossRef CAS PubMed.
- S. F. Mansour, R. Al-Wafi, M. K. Ahmed and S. Wageh, Microstructural, morphological behavior and removal of Cr (VI) and Se (IV) from aqueous solutions by magnetite nanoparticles/PVA and cellulose acetate nanofibers, Appl. Phys. A, 2020, 126(3), 1–14 Search PubMed.
- N. I. Zaaba, K. L. Foo, U. Hashim, S. J. Tan, W. W. Liu and C. H. Voon, Synthesis of Graphene Oxide using Modified Hummers Method: Solvent Influence, Procedia Eng., 2017, 184, 469–477 CrossRef CAS.
- H. Yu, B. Zhang, C. Bulin, R. Li and R. Xing, High-efficient synthesis of graphene oxide based on improved hummers method, Sci. Rep., 2016, 6(1), 1–7 CrossRef CAS PubMed.
- C. A. Guerrero-Fajardo, L. Giraldo and J. C. Moreno-Piraján, Graphene Oxide: Study of Pore Size Distribution and Surface Chemistry Using Immersion Calorimetry, Nanomaterials, 2020, 10(8), 1492 CrossRef CAS PubMed.
- V. B. Mohan, K. Jayaraman and D. Bhattacharyya, Brunauer–Emmett–Teller (BET) specific surface area analysis of different graphene materials: a comparison to their structural regularity and electrical properties, Solid State Commun., 2020, 320, 114004 CrossRef CAS.
- B. Gurzęda, T. Buchwald, M. Nocuń, A. Bąkowicz and P. Krawczyk, Graphene material preparation through thermal treatment of graphite oxide electrochemically synthesized in aqueous sulfuric acid, RSC Adv., 2017, 7(32), 19904–19911 RSC.
- A. M. Pandele, A. Constantinescu, I. C. Radu, F. Miculescu, S. Ioan Voicu and L. T. Ciocan, Synthesis and characterization of pla-micro-structured hydroxyapatite composite films, Materials, 2020, 13(2), 274 CrossRef CAS PubMed.
- I. Langmuir, The adsorption of gases on plane surfaces of glass, mica and platinum, J. Am. Chem. Soc., 1918, 40(9), 1361–1403 CrossRef CAS.
- H. Freundlich, Über die adsorption in lösungen, Z. Phys. Chem., 1907, 57(1), 385–470 CrossRef CAS.
- Y. S. Ho, J. F. Porter and G. McKay, Equilibrium isotherm studies for the sorption of divalent metal ions onto peat: copper, nickel and lead single component systems, Water Air Soil Pollut., 2002, 141(1), 1–33 CrossRef CAS.
- M. I. Temkin, Kinetics of ammonia synthesis on promoted iron catalysts, Acta physiochim URSS, 1940, 12, 327–356 CAS.
- S. K. Lagergren, About the theory of so-called adsorption of soluble substances, Sven Vetenskapsakad Handingarl, 1898, 24, 1–39 Search PubMed.
- Y. S. Ho and G. McKay, Sorption of dye from aqueous solution by peat, Chem. Eng. J., 1998, 70(2), 115–124 CrossRef CAS.
- C. Aharoni and F. C. Tompkins, Kinetics of Adsorption and Desorption and the Elovich Equation, in Advances in Catalysis [Internet], ed. D. D. Eley, H. Pines and P. B. Weisz, Academic Press, 1970pp. 1–49. Available from: https://www.sciencedirect.com/science/article/pii/S0360056408605635 Search PubMed.
- C. L. Popa, A. Deniaud, I. Michaud-Soret, R. Guégan, M. Motelica-Heino and D. Predoi, Structural and Biological Assessment of Zinc Doped Hydroxyapatite Nanoparticles, J. Nanomater., 2016, 2016, e1062878 Search PubMed.
- S. F. Kabir, S. Ahmed, M. Ahsan and A. I. Mustafa, Investigation of sintering temperature and concentration effects on Zn substituted HA, Trends Biomater. Artif. Organs, 2011, 25(4), 154–160 Search PubMed.
- M. K. Ahmed, M. Afifi, N. S. Awwad and H. A. Ibrahium, Pb (II) and Cd (II) removal, mechanical and morphological features of nanofibrous membranes of cellulose acetate containing fillers of hydroxyapatite, graphene oxide, and magnetite, Appl. Phys. A, 2020, 126(10), 1–12 CrossRef.
- Y. Mu, K. Zhu, J. Luan, S. Zhang, C. Zhang and R. Na, et al., Fabrication of hybrid ultrafiltration membranes with improved water separation properties by incorporating environmentally friendly taurine modified hydroxyapatite nanotubes, J. Membr. Sci., 2019, 577, 274–284 CrossRef CAS.
- M. Abolhassani, C. S. Griggs, L. A. Gurtowski, J. A. Mattei-Sosa, M. Nevins and V. F. Medina, et al., Scalable chitosan-graphene oxide membranes: The effect of GO size on properties and cross-flow filtration performance, ACS Omega, 2017, 2(12), 8751–8759 CrossRef CAS PubMed.
- H. Song ming, L. Zhu jing, Z. Zeng xiang and Q. Xue ji, High performance forward osmosis cellulose acetate (CA) membrane modified by polyvinyl alcohol and polydopamine, J. Polym. Res., 2018, 25(7), 1–8 Search PubMed.
- H. Zhang, Y. Liang, X. Wu and H. Zheng, Enhanced photocatalytic activity of (Zn, N)-codoped TiO2 nanoparticles, Mater. Res. Bull., 2012, 47(9), 2188–2192 CrossRef CAS.
- A. A. Menazea and M. K. Ahmed, Silver and copper oxide nanoparticles-decorated graphene oxide via pulsed laser ablation technique: Preparation, characterization, and photoactivated antibacterial activity, Nano-Struct. Nano-Objects, 2020, 22, 100464 CrossRef CAS.
- R. K. S. Rathour, J. Bhattacharya and A. Mukherjee, Selective and multicycle removal of Cr (VI) by graphene oxide–EDTA composite: insight into the removal mechanism and ionic interference in binary and ternary associations, Environ. Technol. Innovation, 2020, 19, 100851 CrossRef.
- S. Luanwuthi, A. Krittayavathananon, P. Srimuk and M. Sawangphruk, In situ synthesis of permselective zeolitic imidazolate framework-8/graphene oxide composites: rotating disk electrode and Langmuir adsorption isotherm, RSC Adv., 2015, 5(58), 46617–46623 RSC.
- L. Fan, C. Luo, M. Sun and H. Qiu, Synthesis of graphene oxide decorated with magnetic cyclodextrin for fast chromium removal, J. Mater. Chem., 2012, 22(47), 24577–24583 RSC.
- S. I. Shupack, The chemistry of chromium and some resulting analytical problems, Environ. Health Perspect., 1991, 92, 7–11 CrossRef CAS PubMed.
- K. C. Lai, L. Y. Lee, B. Y. Z. Hiew, S. Thangalazhy-Gopakumar and S. Gan, Facile synthesis of xanthan biopolymer integrated 3D hierarchical graphene oxide/titanium dioxide composite for adsorptive lead removal in wastewater, Bioresour. Technol., 2020, 309, 123296 CrossRef CAS PubMed.
- J. H. Roque-Ruiz, J. A. Garibay-Alvarado, N. A. Medellín-Castillo and S. Y. Reyes-López, Preparation of Electrospun Hydroxyapatite-Glass Fibers for Removal of Cadmium (Cd+ 2) and Lead (Pb+ 2) from Aqueous Media, Water Air Soil Pollut., 2020, 231(10), 1–13 CrossRef.
- R. Gong, K. Zhong, Y. Hu, J. Chen and G. Zhu, Thermochemical esterifying citric acid onto lignocellulose for enhancing methylene blue sorption capacity of rice straw, J. Environ. Manage., 2008, 88(4), 875–880 CrossRef CAS PubMed.
- M. Kılıc, C. Kırbıyık, Ö. Çepelioğullar and A. E. Pütün, Adsorption of heavy metal ions from aqueous solutions by bio-char, a by-product of pyrolysis, Appl. Surf. Sci., 2013, 283, 856–862 CrossRef.
- L. Ma, X. Shi, X. Zhang, S. Dong and L. Li, Electrospun cellulose acetate–polycaprolactone/chitosan core–shell nanofibers for the removal of Cr (VI), Phys. Status Solidi A, 2019, 216(22), 1900379 CrossRef CAS.
- Y. Tadjenant, N. Dokhan, A. Barras, A. Addad, R. Jijie and S. Szunerits, et al., Graphene oxide chemically reduced and functionalized with KOH-PEI for efficient Cr (VI) adsorption and reduction in acidic medium, Chemosphere, 2020, 258, 127316 CrossRef CAS PubMed.
- V. Gopalakannan, S. Periyasamy and N. Viswanathan, Fabrication of magnetic particles reinforced nano-hydroxyapatite/gelatin composite for selective Cr (VI) removal from water, Environ. Sci.: Water Res. Technol., 2018, 4(6), 783–794 RSC.
- M. Zendehdel, K. Rezaeian, A. Rezaei and S. Jalalvandi, Synthesis and Characterization of a Low-Cost and Eco-friendly Hydroxyapatite/Clinoptilolite/NH2 Adsorbent for Simultaneous Removal of Cr (VI) and F, Silicon, 2022, 1–17, 8643–8659 CrossRef.
- A. Sadeghizadeh, F. Ebrahimi, M. Heydari, M. Tahmasebikohyani, F. Ebrahimi and A. Sadeghizadeh, Adsorptive removal of Pb (II) by means of hydroxyapatite/chitosan nanocomposite hybrid nanoadsorbent: ANFIS modeling and experimental study, J. Environ. Manage., 2019, 232, 342–353 CrossRef CAS PubMed.
- N. A. Abdelwahab, N. S. Ammar and H. S. Ibrahim, Graft copolymerization of cellulose acetate for removal and recovery of lead ions from wastewater, Int. J. Biol. Macromol., 2015, 79, 913–922 CrossRef CAS PubMed.
- X. Yang, N. Guo, Y. Yu, H. Li, H. Xia and H. Yu, Synthesis of magnetic graphene oxide-titanate composites for efficient removal of Pb (II) from wastewater: performance and mechanism, J. Environ. Manage., 2020, 256, 109943 CrossRef CAS PubMed.
- P. Khorshidi, R. H. S. M. Shirazi, M. Miralinaghi, E. Moniri and S. Saadi, Adsorptive removal of mercury (II), copper (II), and lead (II) ions from aqueous solutions using glutathione-functionalized NiFe2O4/graphene oxide composite, Res. Chem. Intermed., 2020, 46(7), 3607–3627 CrossRef CAS.
- K. Vijayalakshmi, B. M. Devi, S. Latha, T. Gomathi, P. N. Sudha and J. Venkatesan, et al., Batch adsorption and desorption studies on the removal of lead (II) from aqueous solution using nanochitosan/sodium alginate/microcrystalline cellulose beads, Int. J. Biol. Macromol., 2017, 104, 1483–1494 CrossRef CAS PubMed.
- R. G. Huamani-Palomino, C. R. Jacinto, H. Alarcón, I. M. Mejía, R. C. López and D. de Oliveira Silva, et al., Chemical modification of alginate with cysteine and its application for the removal of Pb (II) from aqueous solutions, Int. J. Biol. Macromol., 2019, 129, 1056–1068 CrossRef CAS PubMed.
- J. Shang, Y. Guo, D. He, W. Qu, Y. Tang and L. Zhou, et al., A novel graphene oxide-dicationic ionic liquid composite for Cr (VI) adsorption from aqueous solutions, J. Hazard. Mater., 2021, 416, 125706 CrossRef CAS PubMed.
- P. C. Bandara, J. Peña-Bahamonde and D. F. Rodrigues, Redox mechanisms of conversion of Cr (VI) to Cr (III) by graphene oxide-polymer composite, Sci. Rep., 2020, 10(1), 1–8 CrossRef PubMed.
- Y. X. Ma, W. J. Shao, W. Sun, Y. L. Kou, X. Li and H. P. Yang, One-step fabrication of β-cyclodextrin modified magnetic graphene oxide nanohybrids for adsorption of Pb (II), Cu (II) and methylene blue in aqueous solutions, Appl. Surf. Sci., 2018, 459, 544–553 CrossRef CAS.
- Q. Lian, Z. U. Ahmad, D. D. Gang, M. E. Zappi, D. L. B. Fortela and R. Hernandez, The effects of carbon disulfide driven functionalization on graphene oxide for enhanced Pb (II) adsorption: Investigation of adsorption mechanism, Chemosphere, 2020, 248, 126078 CrossRef CAS PubMed.
- V. P. Chauke, A. Maity and A. Chetty, High-performance towards removal of toxic hexavalent chromium from aqueous solution using graphene oxide-alpha cyclodextrin-polypyrrole nanocomposites, J. Mol. Liq., 2015, 211, 71–77 CrossRef CAS.
- Z. Wang, W. Xu, F. Jie, Z. Zhao, K. Zhou and H. Liu, The selective adsorption performance and mechanism of multiwall magnetic carbon nanotubes for heavy metals in wastewater, Sci. Rep., 2021, 11(1), 16878 CrossRef CAS PubMed.
- J. M. Brady and J. M. Tobin, Binding of hard and soft metal ions to Rhizopus arrhizus biomass, Enzyme Microb. Technol., 1995 Sep 1, 17(9), 791–796 Search PubMed.
- P. Karthikeyan, S. S. D. Elanchezhiyan, H. A. T. Banu, M. H. Farzana and C. M. Park, Hydrothermal synthesis of hydroxyapatite-reduced graphene oxide (1D–2D) hybrids with enhanced selective adsorption properties for methyl orange and hexavalent chromium from aqueous solutions, Chemosphere, 2021, 276, 130200 CrossRef CAS PubMed.
- M. S. Samuel, J. Bhattacharya, S. Raj, N. Santhanam, H. Singh and N. P. Singh, Efficient removal of Chromium (VI) from aqueous solution using chitosan grafted graphene oxide (CS-GO) nanocomposite, Int. J. Biol. Macromol., 2019, 121, 285–292 CrossRef CAS PubMed.
- H. H. Najafabadi, M. Irani, L. R. Rad, A. H. Haratameh and I. Haririan, Removal of Cu 2+ , Pb 2+ and Cr 6+ from aqueous solutions using a chitosan/graphene oxide composite nanofibrous adsorbent, RSC Adv., 2015, 5(21), 16532–16539 RSC.
- Y. Zhou, W. Li, X. Jiang, Y. Sun, H. Yang and Q. Liu, et al., Synthesis of strontium (Sr) doped hydroxyapatite (HAp) nanorods for enhanced adsorption of Cr (VI) ions from wastewater, Ceram. Int., 2021, 47(12), 16730–16736 CrossRef CAS.
- M. G. Azam, M. H. Kabir, M. A. A. Shaikh, S. Ahmed, M. Mahmud and S. Yasmin, A rapid and efficient adsorptive removal of lead from water using graphene oxide prepared from waste dry cell battery, J. Water Proc. Eng., 2022, 46, 102597 CrossRef.
- A. M. Mohammad, T. A. S. Eldin, M. A. Hassan and B. E. El-Anadouli, Efficient treatment of lead-containing wastewater by hydroxyapatite/chitosan nanostructures, Arabian J. Chem., 2017, 10(5), 683–690 CrossRef CAS.
- L. Cui, Y. Wang, L. Gao, L. Hu, L. Yan and Q. Wei, et al., EDTA functionalized magnetic graphene oxide for removal of Pb (II), Hg (II) and Cu (II) in water treatment: adsorption mechanism and separation property, Chem. Eng. J., 2015, 281, 1–10 CrossRef CAS.
Footnote |
| † Electronic supplementary information (ESI) available. See DOI: https://doi.org/10.1039/d2va00142j |
| This journal is © The Royal Society of Chemistry 2022 |

