Investigating the sequestration potential of a novel biopolymer-modified ceria/montmorillonite nanocomposite for chromium and coomassie brilliant blue from the aqueous phase: equilibrium and kinetic studies
Received
11th June 2022
, Accepted 6th August 2022
First published on 26th August 2022
Abstract
This study involves the fabrication of a novel, sustainable, and economically viable adsorbent ceria/rice flour/montmorillonite nanocomposite (Ce-R-MMT) for the decontamination of Cr(VI) and coomassie brilliant blue (CBB) from the aquatic phase. The structural characteristics and sorption interaction was elucidated via X-ray diffraction (XRD), Fourier transform infrared (FTIR) spectroscopy, scanning electron microscopy (SEM), energy dispersive X-ray analysis (EDX), and transmission electron microscopy (TEM). The sorption behavior was strategized systematically via batch experiments, which include adsorbent dosage, contact time, initial CBB concentration and initial solution pH, equilibrium, and kinetic curves. The Freundlich model best illustrated the equilibrium data implying the multilayer adsorption of CBB and Cr(VI) onto the heterogeneous surface of the prepared nanocomposite. Pseudo-second order appropriated the kinetics of the process. Diffusion modelling suggested that intraparticle and liquid film diffusion models cooperatively governed the diffusion of probed pollutants. Thermodynamic parameters implied the adsorption process to be feasible and exothermic. The binary study showed an antagonistic effect as R value was <1. Electrostatic interaction was responsible for the uptake of both pollutants by the nanocomposite. The sequestration potentiality assured by sorption capacity for CBB (713.513 mg g−1) and Cr(VI) (182.037 mg g−1) and regeneration ability up to 3 consecutive adsorption–desorption cycles conferred Ce-R-MMT to be a promising sorbent for the sequestration of CBB and Cr(VI).
Environmental significance
For the first-time, we reported the fabrication of a biopolymer-modified ceria/montmorillonite nanocomposite and subsequently used as an adsorbent for chromium and coomassie brilliant blue from the aqueous phase. The potentiality assured by sorption capacity for CBB (713.513 mg g−1) and Cr(VI) (182.037 mg g−1) and regeneration ability up to 3 consecutive adsorption–desorption cycles confer that Ce-R-MMT is a promising sorbent for the sequestration of CBB and Cr(VI).
|
1. Introduction
By 2021, the Indian textile industry is expected to grow to a size of US$223 billion and is currently the second-largest producer of garments and textiles in the world. Textile industries use most synthetic dyes such as azo dyes, cationic dyes, anionic dyes, and sulfur dyes. Further, these dyes find usage in coloring ink, cosmetics, plastics, etc. Dyes are used for fabric dyeing, out of which about 70% are unabsorbed and are discharged as effluents into the aquatic sources.1 The main environmental threat is the bulk industrial effluent discharged from the dyeing process.2 Dyes, when present even in low concentrations, reduce light penetration through the surface of the water hindering the photosynthesis of aquatic plants. Many of them are carcinogenic, teratogenic, mutagenic as well as toxic to humans, microorganisms, and aquatic species.3 If not duly investigated and treated, the discarded dyes will consequently cause the pollution of the water bodies. Therefore, it is of utmost importance to develop novel materials for the confiscation of colored wastewater.4 On the other hand, heavy metals too tend to cause water pollution by posing a risk to both human health and the environment.5 Heavy metals tend to accumulate in the environment due to their non-biodegradable nature.6 Coomassie brilliant blue R 250 (CBB) and Cr(VI) were probed as pollutants as both have a detrimental impact on biotic life. The CBB is a tenacious dye that has detrimental effects on the gastrointestinal and respiratory tract, along with eye irritations and dizziness. Cr(VI) is a carcinogenetic pollutant that is a top priority contaminant. In view of the toxicities related to both CBB and Cr(VI), it is essential to decontaminate them from wastewater before their discharge into the ecosystem.
Numerous decontamination technologies such as coagulation–flocculation, filtration, chemical precipitation, solvent extraction, oxidation, ion-exchange, electrochemical treatments, advanced oxidation, nanofiltration, and adsorption have been arduously utilized.7 Among these, adsorption is an outstanding method for the treatment of effluents because of its economic feasibility, high removal efficiency, simple nature as well as low environmental impact.8 Different adsorbents exploited for decontamination purposes include activated carbon,9 clays,10 and nanomaterials,11 but high production cost, regeneration inefficiency, and low adsorption capacity limit their potential use in wastewater treatment. Lignocellulosic materials contain ample functional groups, which can serve as functional sites for adsorption of diverse pollutants. Rice flour is an agricultural product that contains starch in abundance, which has surplus functional groups. Starch is bounteous and renewable carbohydrate polymer, which is biodegradable and has exhibited a greater potential in adsorption.12 Being low cost and environmentally friendly, montmorillonite is a layered silicate material that is employed in industrial fields and many other applications.13 The combination of more than one reinforcing agent leads to the preparation of a hybrid composite that showed improved properties compared to a single reinforcing agent.14,15 The basis for fixing the interactions between the filler and the polymer matrix is the better dispersion of the inorganic additives in the polymer matrix, which increases the scope of the nanocomposite.16 Ceria (CeO2), a rare-earth metal oxide that is abundantly available and non-toxic, seeks attention through its physical properties such as surface area, size, shape, and mechanical strength.17 In water treatment, ceria can be used as a potential material for the elimination of organic dyes and metal ions, as suggested by various reported works. Shrikanth et al. studied the removal of malachite green from an aqueous solution by a ceria-based nanocomposite synthesized by a hydrothermal method.18 Nakarmi et al. synthesized a cerium/manganese oxide nanocomposite embedded on the surface of modified cellulose pine wood shaving for the effective removal of phosphate from an aqueous solution.19
This study detailed the fabrication of a low-cost adsorbent based on rice flour, montmorillonite (MMT), and ceria (Ce-R-MMT), which was exploited as a sustainable adsorbent for both dyes and heavy metals. To the best of our knowledge, such adsorbent has not been fabricated and not been used for the sequestration of pollutants from aquatic sources. The addition of rice flour and MMT into the ceria solution provides mechanical strength and removes both Cr(VI) and coomassie brilliant blue (CBB) more effectively with a synergistic effect. The properties of this composite were determined by the XRD, FTIR spectroscopy, SEM-EDX, and TEM techniques. The effect of various process parameters, such as adsorbent amount, initial solution pH, contact time, and initial concentration of adsorbates were studied employing batch studies. Non-linear isotherm and kinetic modeling were used to understand the adorption capacity, uptake rate, and adsorption mechanism. The reusability study of the as-synthesized adsorbent was also assessed to find out its use in decontamination on an industrial scale.
2. Experimental framework
2.1 Materials and instrumentation
Montmorillonite (Himedia, India) (MMT), rice flour, cerium(III) nitrate hexahydrate Ce(NO3)3·6H2O (99% Sigma Aldrich), coomassie brilliant blue R 250 (CBB) (Loba, Chemie), glutaraldehyde (Sigma Aldrich), sodium hydroxide (98%, SRL, India), hydrochloric acid (Fischer Scientific), and potassium dichromate (99%, Sigma Aldrich). X-Ray diffraction (XRD) patterns were obtained on a Phillips Analytica PW 1830 instrument (Philips, Netherlands) with monochromatic CuKα1 radiation. SEM micrographs were recorded on a Carl-Zeiss EVO 40 microscope (Germany) conjugated with Bruker X flask 3010. FTIR analysis was conducted on a Perkin Elmer, BX FTIR spectrophotometer. SEM-EDX was recorded on a Leo Supra 50 V P. TEM micrographs were obtained on FEI TEM operated at 200 kV (Tecnai).
2.2 Preparation of Ce-R-MMT
Two (2 g) of Ce(NO3)·6H2O was dispersed in 250 mL distilled water containing 5% NH3. To this mixture, 1 g of MMT dispersed in 20 mL distilled water was added. The formed suspension was mixed vigorously via stirring for 1.5 h and then 1 g of rice flour prepared in distilled water was added, and stirring was continued for another 2 h. Later, NaOH (2 M) solution was added dropwise into the solution with continuous stirring. For cross-linking between the cerium-starch component of rice flour, glutaraldehyde (0.5 mL) was added to the stirred solution and again shaken vigorously for 2 h. The resulting suspension was refrigerated at 4 °C for the next 24 h for complete cross-linking.20
2.3 Adsorption framework
The adsorption of CBB and Cr(VI) on the prepared nanocomposite was investigated via batch mode. A fixed mass of the nanocomposite (0.2–1.2 g) was transferred to a conical flask having 25 mL of Cr(VI) solution (30–80 mg L−1) and CBB (10–60 mg L−1) and shaken for 40 min on a water bath shaker at 298, 303, and 313 K. The influence of the initial solution pH was considered by altering the pH from 2 to 10 by adding (0.1 M) NaOH or HCl. Further, after attainment of equilibrium, the solution was subjected to centrifugation at 1500 rpm for 5 min, and the residual sorbate concentration was determined spectrophotometrically at λmax 540 nm and 590 nm for Cr(VI) and CBB, respectively.
The sorption capacity, qe and removal efficiency (%) were determined by eqn (1) and (2), respectively.
| |
 | (1) |
| |
 | (2) |
where
Ci and
Ce are the initial and equilibrium sorbate concentrations (mg L
−1), respectively, and
Wm is the mass of sorbent (g). Investigation of isotherm parameters was undertaken by shaking (20–70 mg L
−1) of the sorbate solution with the nanocomposite (1 g) for 40 min at 298, 303, and 313 K. The kinetic studies were performed by shaking the sorbate solution (25 mL) of concentration (50–70 mg L
−1) with nanocomposite (1 g) for 40 min at 313 K.
3. Results and discussion
3.1 Characterization of Ce-R-MMT nanocomposite
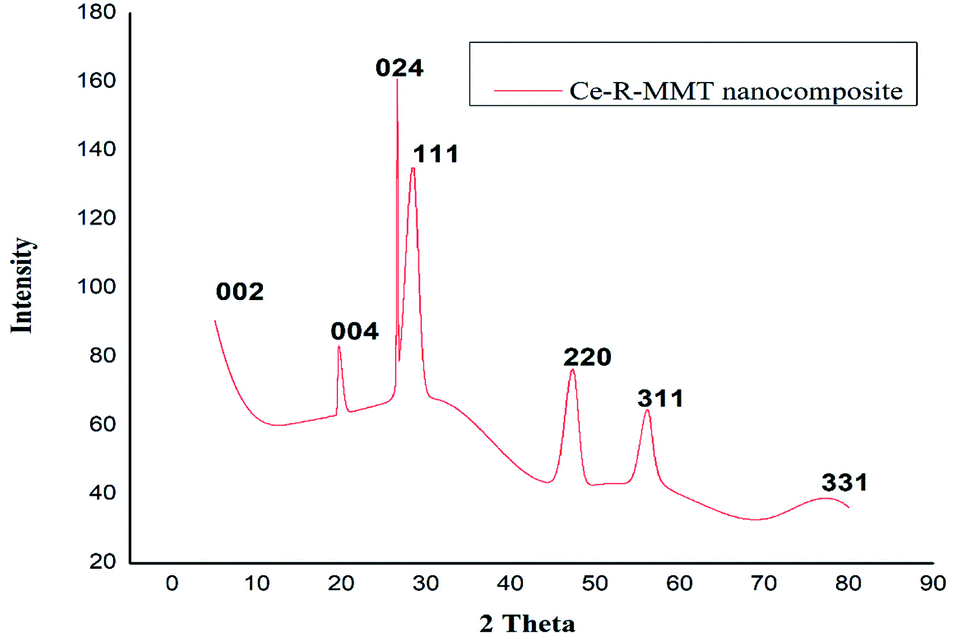
In the nanocomposite XRD pattern (Fig. 1), the basal peak for MMT that is normally observed at 2θ = 6.7° was reflected at 2θ = 5.6°. Suggesting the fabrication of intercalated material with the incorporation of a few starch chains in the interlayer spacing of MMT. This might be due to the strong polar interaction between the hydroxyl groups present in both silicate layers and the biopolymer chain.21,22 The prominent peaks (002, 004, 024, 111, 220, 311, and 331) were observed for ceria, which matches with JCPDS no. 034 0394. All these observed diffractions corroborated the successful fabrication of the Ce-R-MMT nanocomposite.
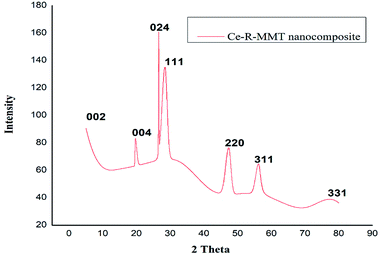 |
| | Fig. 1 XRD spectrum of the Ce-R-MMT nanocomposite. | |
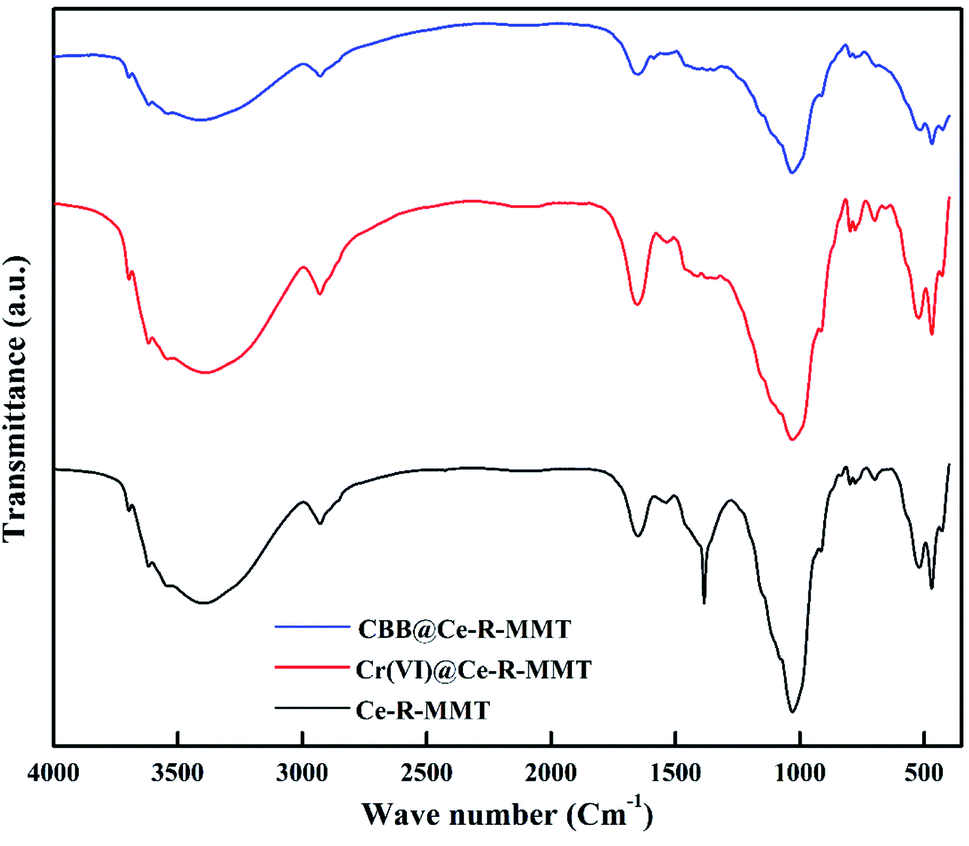
Fourier transform infrared spectroscopy of the nanocomposite was recorded from 400–4000 cm−1 (Fig. 2). The broad band in 3000–3500 cm−1 region was accredited to Ce–OH stretching.23 For MMT, the sharp peaks at 465, 517, 687, 767 and 1025 cm−1 were attributed to the Al–O–Si and Si–O stretching vibrations24 Also, the peak at 1650 cm−1 could be attributed to the C–O groups of starch. The presence of all these peaks validated the formation of the Ce-R-MMT nanocomposite. After the adsorption of CBB and Cr(VI), the adsorbent exhibited a shift in peaks to a lower wave numbers and a decrease in the intensity of a few peaks validating the interaction of the pollutants and Ce-R-MMT.
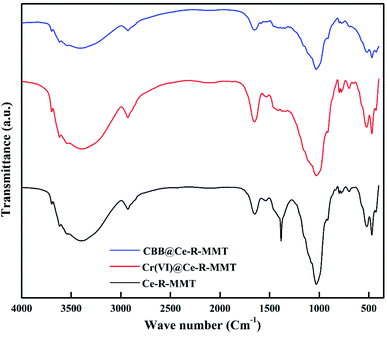 |
| | Fig. 2 FTIR spectrum of the Ce-R-MMT nanocomposite before and after the adsorption of the Cr(VI) and CBB. | |
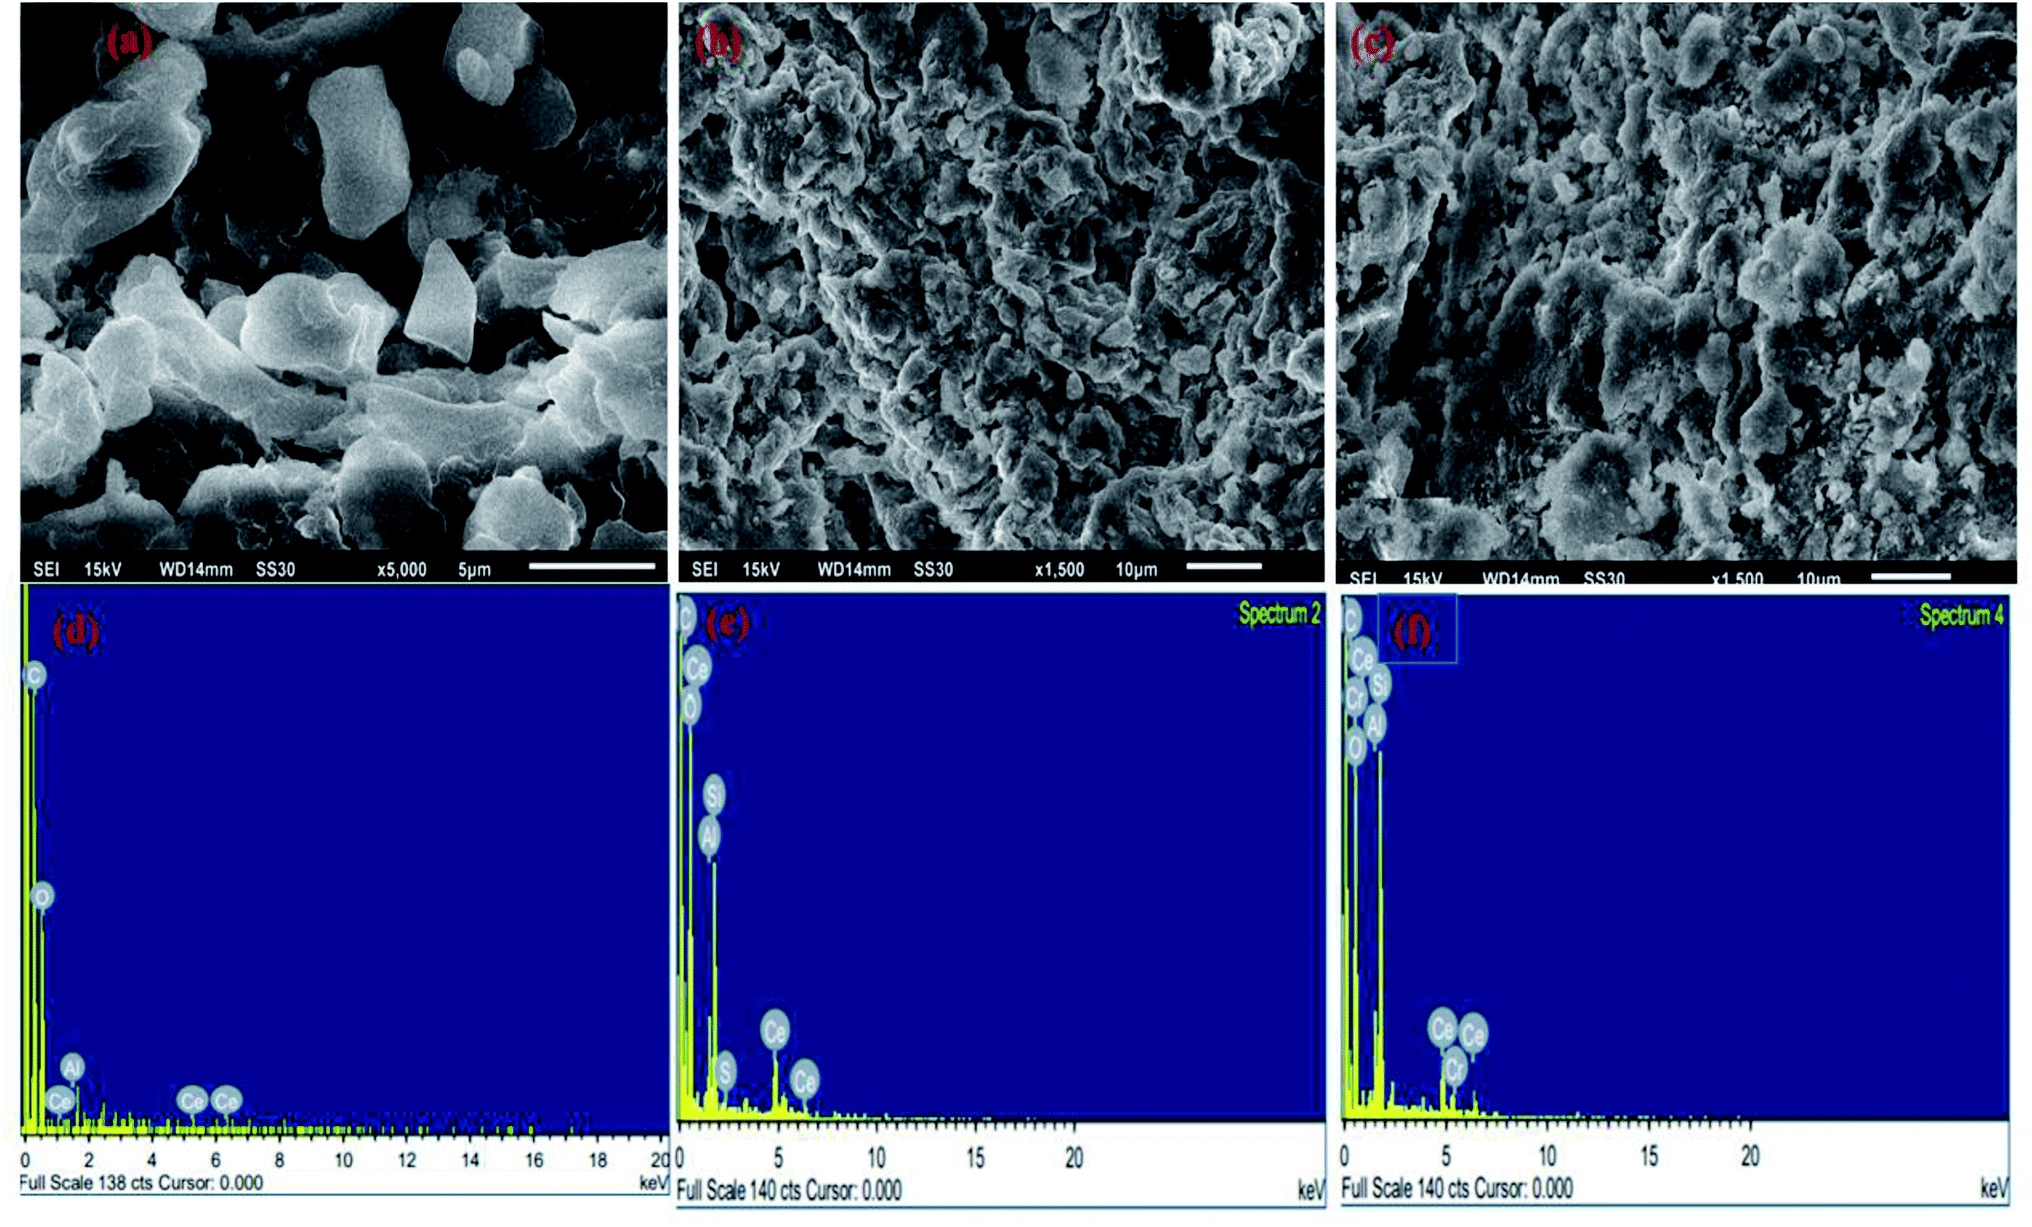
SEM and EDX images of the nanocomposite are shown in Fig. 3. The external morphology exhibited grains that are spherical, loosely bound having cavities that prove to be effective in adsorption of organic and inorganic pollutants. After the adsorption of pollutants (Fig. 3band c), SEM images exhibited a rugged morphology with filled pores and cavities due to the adsorption of Cr(VI) and CBB. The EDX analysis showed the related elements, such as the peak of Cr and S in the EDX spectra after the adsorption of Cr(VI) and CBB implying the adsorption of both pollutants onto Ce-R-MMT.
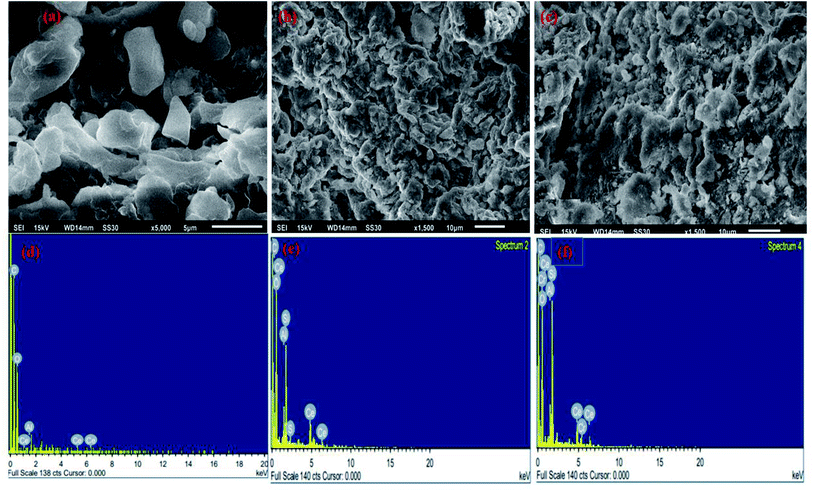 |
| | Fig. 3 SEM-EDX images of the nanocomposite before and after adsorption is shown in (a) nanocomposite, (b and c) after the adsorption of Cr(VI) and CBB, and (d–f) their corresponding EDX micrographs. | |
Transmission electron microscopy in Fig. 4 shows the morphology of particles as a mixture of spheres and rods. The micrographs revealed that nanospheres and nanorods are formed, with agglomerated morphology.
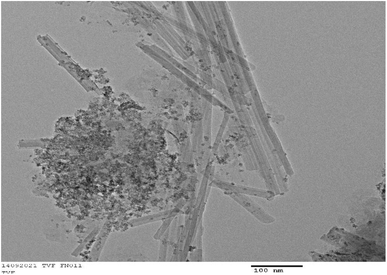 |
| | Fig. 4 TEM micrograph of Ce-R-MMT nanocomposite. | |
3.2 Influence of operational parameters
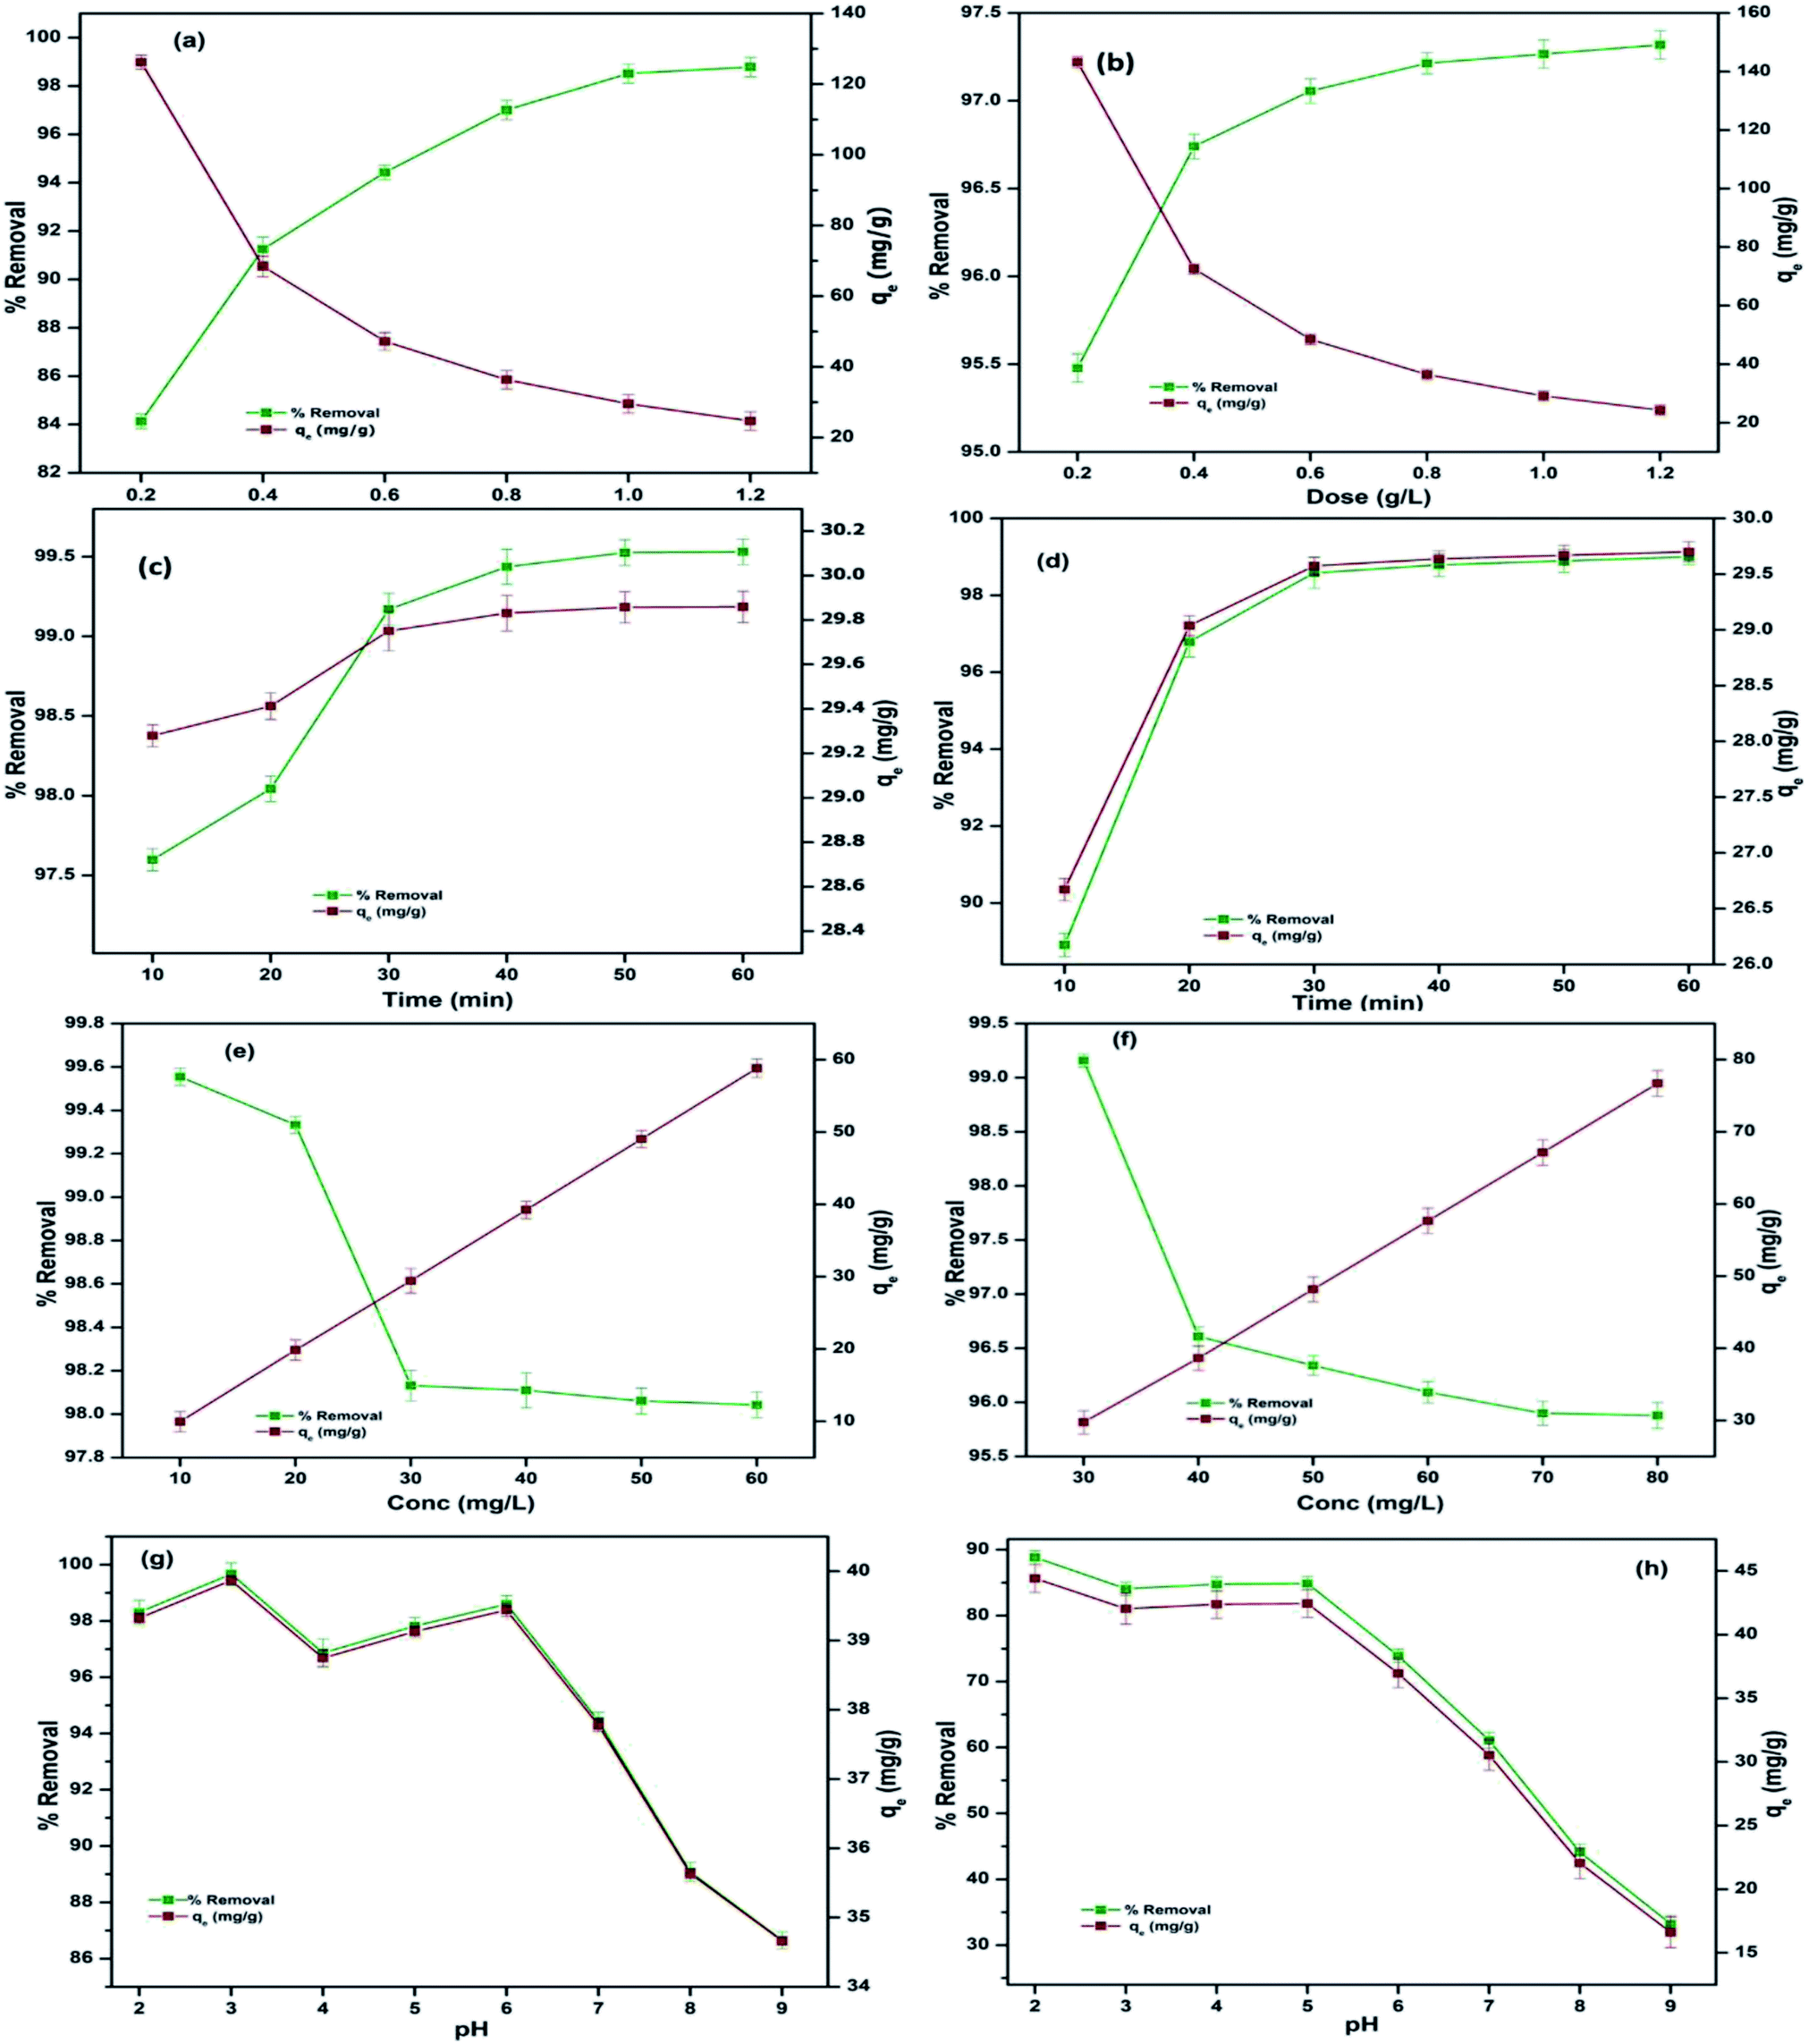
To acknowledge the influence of sorbent dosage on the removal efficiency, nanocomposites of varying amounts (0.2–1.2 g L−1) were utilized. It was observed that the removal efficiency escalated sharply on increasing the dose of CBB (84.13–98.78%) and Cr(VI) (95.47–97.31%), as shown in Fig. 5a and b, which was attributed to the overall increase in the surface area. Despite this, the adsorption capacity dropped for CBB from 126.20–24.69 mg g−1 and Cr(VI) from 143.21–24.32 mg g−1. The reason for this combative effect is linked to the sorbent aggregation at higher doses that led to an enlarged diffusion pathway for CBB and Cr(VI) to reach the binding sites.25 Therefore, the dose optimized for both the sorbates is 1 g L−1 at which maximum removal was attained at the pollutant concentration of 30 mg L−1 and was subsequently taken for further experiments. Also, after the adsorption of Cr(VI) onto Ce-R-MMT, the adsorbent was immersed in water to check the leaching. The metal was strongly bound, and no leaching was observed.
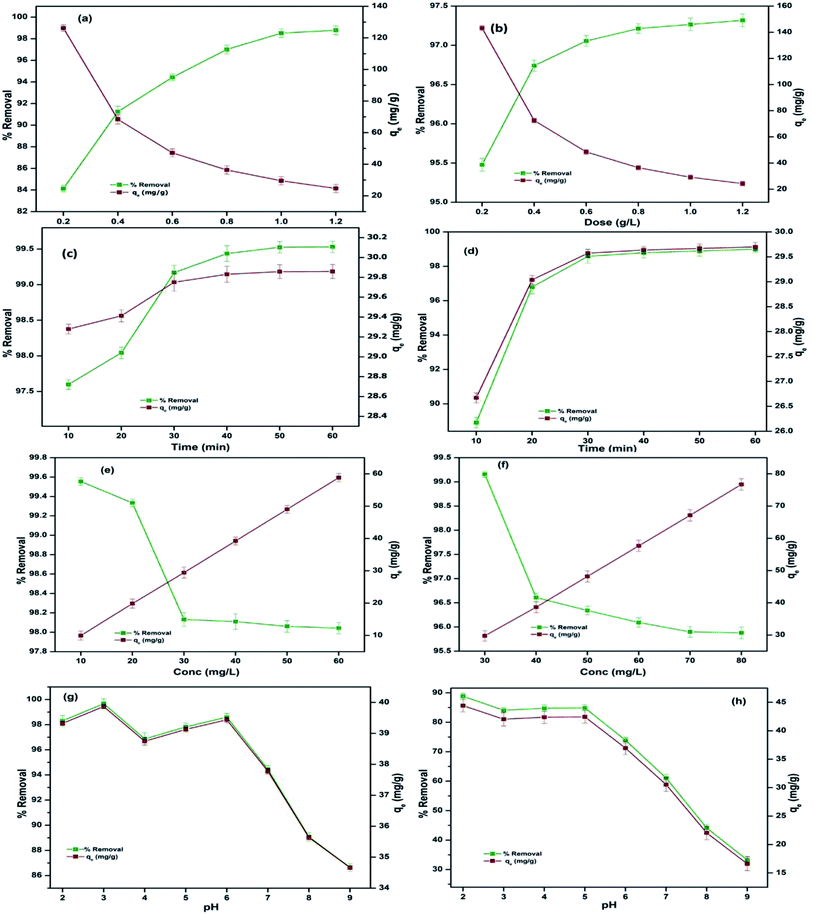 |
| | Fig. 5 Influence of various parameters, dosage, contact time, initial concentration, and initia solution pH on the adsorption of CBB (a, c, e and g) and Cr(VI) (b, d, f and h). | |
Contact time is an important factor that affects the process of adsorption. The impact of contact time was illustrated by conducting experiments for 10–60 min with 10 min intervals for the adsorption of CBB and Cr(VI) onto the nanocomposite, keeping the concentration (30 mg L−1) and dose (1 g L−1) constant for both the pollutants, as shown in Fig. 5c and d. There was a rapid rise in the uptake efficiency in the initial 40 min but became steady with an increase in time that can be concluded based on the availability of sorption sites on the sorbent during the early stage of the sorption process and increase in the collision frequency of CBB or Cr(VI) onto the surface of the nanocomposite. The potentiality of nanocomposite (99.43% for CBB and 98.79% for Cr(VI)) within 40 min qualified it as a potential sorbent.
The initial concentration of pollutants for CBB was varied from (10–60 mg L−1) and Cr(VI) (30–80 mg L−1), keeping all other parameters constant. The removal efficiency of the nanocomposite for CBB at a low concentration of 10 mg L−1 was 99.55% and Cr(VI) (30 mg L−1) was 99.15%, as shown in Fig. 5e and f and declined at a high concentration of 60 mg L−1 for CBB, which is 98.04% and at 80 mg L−1 for Cr(VI) is 95.87% due to the low ratio of pollutant on the surface. At higher concentrations, the decrease was accredited to the lesser availability of sorption sites.26
The influence of initial solution pH on the adsorption of the CBB is revealed in Fig. 5g as the surface of the nanocomposite was positively charged, and low pH further enhanced the positivity of the surface, thus making the process of adsorption pH-sensitive. At lower pH, accommodated functional groups on the surface of the Ce-R-MMT nanocomposite acquired a positive charge due to protonation. Therefore, considerable electrostatic interactions occurred between the anionic CBB and the positively charged Ce-R-MMT surface due to the ionization of functional groups of negatively charged anionic dye molecules and the adsorbent.27 On the other hand, at higher pH, H+ ion concentration decreases, which negates the competition between the anionic CBB and H+ ion. Thus, minimum sorption occurred due to the reduced interaction between the nanocomposite and CBB.28
The pH of Cr(VI) solution is a crucial factor in determining the adsorption of Cr(VI) onto the Ce-R-MMT nanocomposite surface, From Fig. 5h it is observed that at lower pH, %removal esclated, and as the pH increases, there was a decrease in removal efficiency. This trend is due to the existence of Cr(VI) as HCrO4− and Cr2O27− in lower pH range29 resulting in a stronger electrostatic attraction with the positively charged surface of the adsorbent. At higher pH, the surface became negative, which limited the percent uptake from the aqueous phase.
3.3 Isotherm modelling
Adsorption isotherm is a significant means of highlighting the interaction between the sorbent and sorbate and in turn elucidating maximum adsorption capacity. Various isotherm models were coordinated with equilibrium data at 298, 303, and 313 K to find out the best-fitted model. In addition, to check out the applicability of isotherm models, the correlation coefficient (R2) and standard error of estimate (SEE) were calculated, and the corresponding values are presented in Table 1.
Table 1 Isotherm parameters
| Isotherm |
Isotherm constant |
CBB |
Cr(VI) |
| 298 K |
303 K |
313 K |
298 K |
303 K |
313 K |
| Langmuir |
Qm (mg g−1) |
713.513 |
418.191 |
394.053 |
182.037 |
165.535 |
109.853 |
| b (L mg−1) |
0.071 |
0.133 |
0.149 |
0.181 |
0.247 |
0.574 |
| RL |
0.219 |
0.130 |
0.118 |
0.076 |
0.054 |
0.024 |
| R2 |
0.977 |
0.971 |
0.970 |
0.967 |
0.957 |
0.955 |
| SEE |
3.069 |
3.427 |
3.511 |
3.564 |
3.773 |
4.356 |
| Freundlich |
Kf (mg g−1)(L mg−1)1/nf |
51.163 |
49.077 |
47.370 |
38.567 |
33.374 |
28.750 |
| 1/nf |
0.862 |
0.869 |
0.909 |
0.591 |
0.699 |
0.738 |
| R2 |
0.979 |
0.978 |
0.975 |
0.987 |
0.975 |
0.973 |
| SEE |
2.862 |
3.021 |
3.032 |
2.222 |
2.650 |
3.157 |
| Temkin |
Kt (L mg−1) |
30.992 |
29.041 |
28.713 |
24.551 |
22.152 |
21.260 |
| bt (kJ mol−1) |
5.021 |
5.860 |
6.213 |
3.810 |
5.661 |
7.330 |
| R2 |
0.913 |
0.909 |
0.900 |
0.904 |
0.891 |
0.889 |
| SEE |
6.156 |
6.374 |
6.454 |
6.046 |
6.923 |
7.011 |
| D–R |
qD (mg g−1) |
152.504 |
145.108 |
144.083 |
104.002 |
103.048 |
94.575 |
| E (kJ mol−1) |
0.062 |
0.069 |
0.073 |
0.085 |
0.093 |
0.098 |
| R2 |
0.955 |
0.950 |
0.949 |
0.938 |
0.916 |
0.906 |
| SEE |
4.336 |
4.561 |
4.950 |
5.108 |
5.762 |
5.883 |
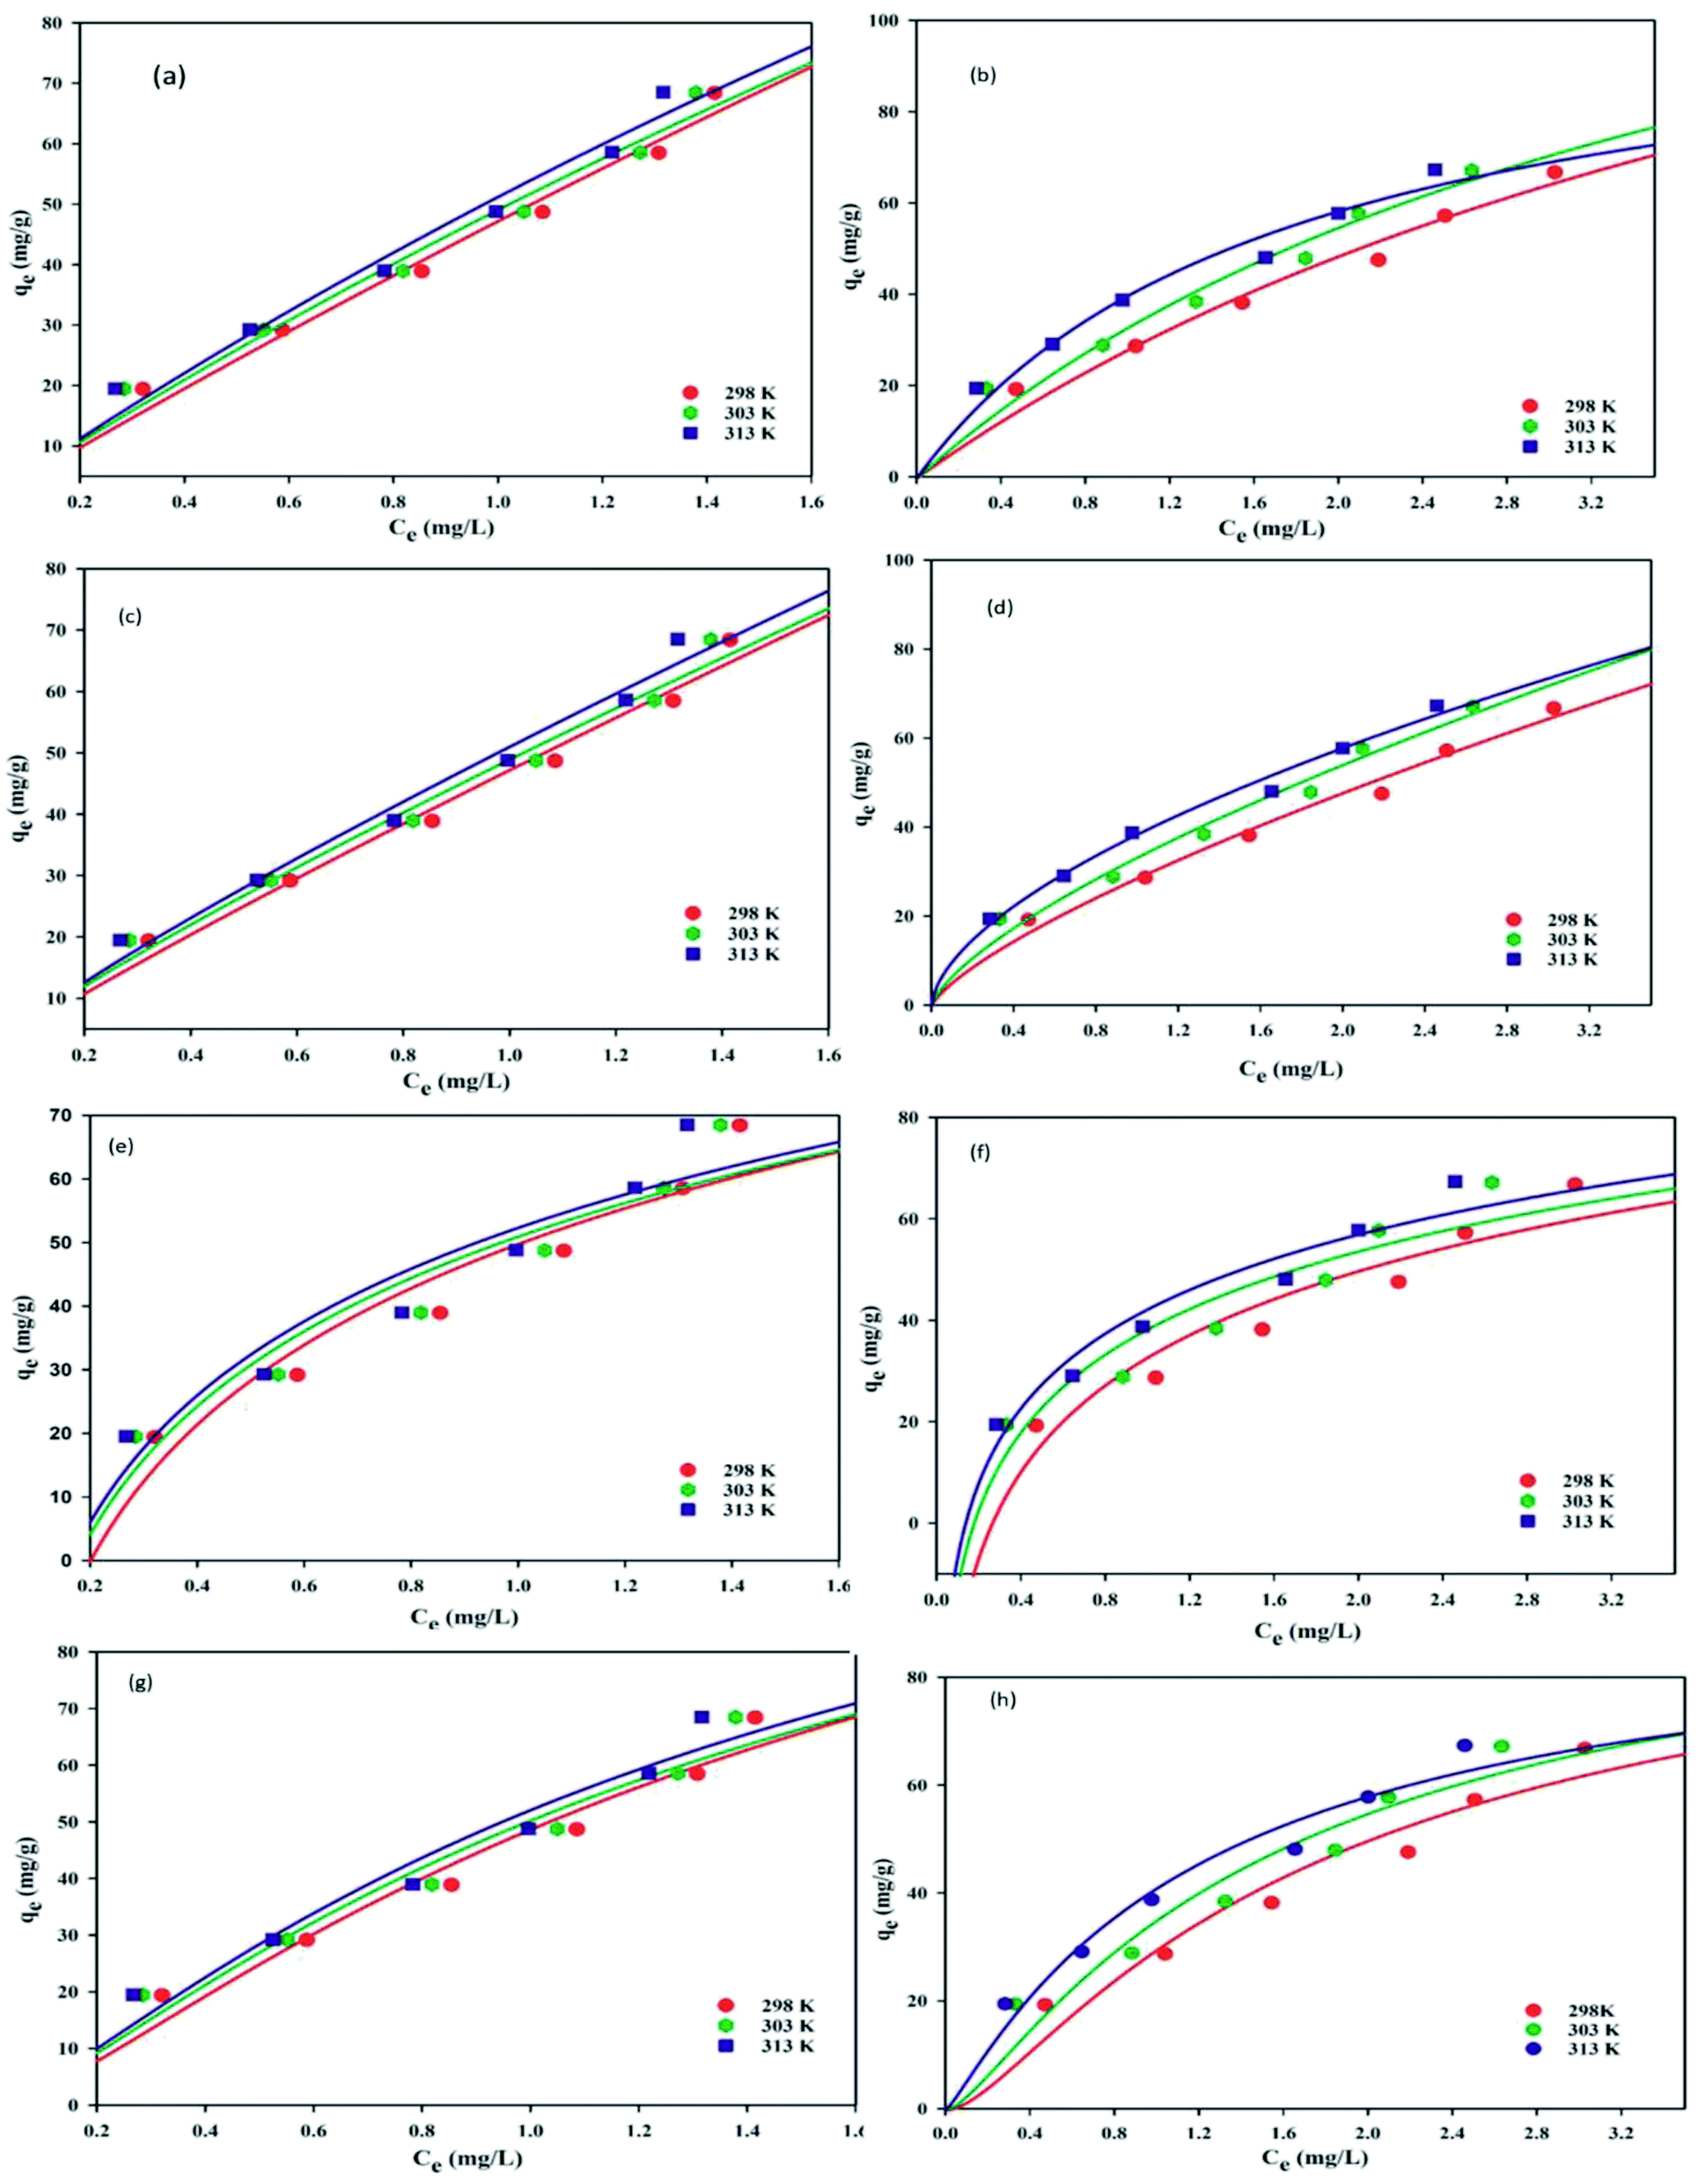
The Langmuir model infers that adsorption occurs homogeneously at the surface via monolayer formation.30 Also, it assumes that active sorption sites are finite, and no interaction is marked between the absorbed molecules on adjacent sorption sites. The non-linear regression expression is stated as:
| |
 | (3) |
where
Qm and
qe (mg g
−1) are the maximum sorption capacity and amount of sorbate adsorbed at equilibrium,
Ce (mg L
−1) is the concentration at equilibrium, and
b (L mg
−1) is the Langmuir binding constant, respectively. The plot of
qevs. Ce at 298–313 K provides the values of
Qm,
b, and
R2 (
Fig. 6a and b (CBB and Cr(
VI)). The
Qm values respectively for CBB and Cr(
VI) were found to be significantly higher at 713.51 and 182 mg g
−1. It was noticed that with the temperature rise, there is an increment in
b values suggesting a strong interaction between the sorbent and sorbate (
Table 1).
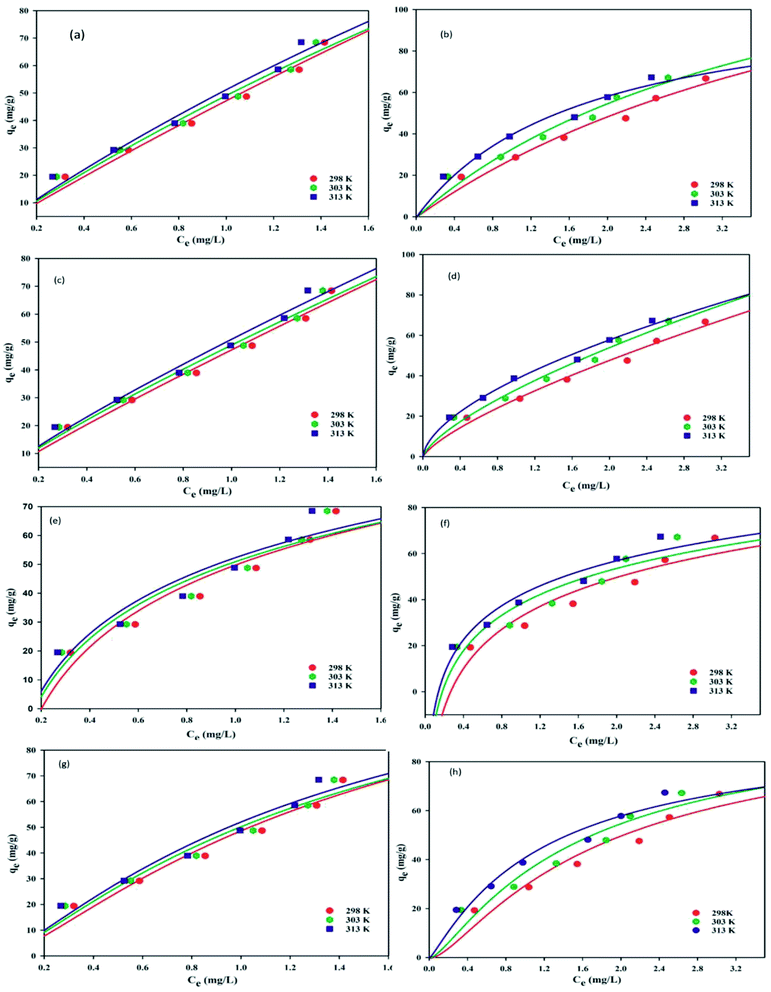 |
| | Fig. 6 Isotherm for CBB and Cr(VI) Langmuir (a and b), Freundlich (c and d), Temkin (e and f), and D–R adsorption (g and h). | |
The values of the separation factor,  obtained for CBB and Cr(VI) were 0.219 and 0.076, respectively.
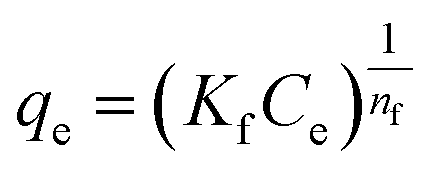
The Freundlich isotherm infers multilayer adsorption onto a heterogeneous surface.31 Its non-linear form of expression is stated as:
| |
 | (4) |
where
Kf (mg g
−1)(L mg
−1)
1/nf is the Freundlich constant linked to sorption capacity and 1/
nf is the factor of heterogeneity that predicts whether the adsorption is favorable (1/
nf < 1) or unfavorable (1/
nf > 1). Further, the values of
Kf and 1/
nf were obtained from the plot of
qevs. Ce (
Fig. 6c and d), suggesting the isotherm to be favorable (0.591–0.738 for Cr(
VI)) and (0.862–0.909 for CBB) (
Table 1).
Temkin isotherm contemplates that with increased interaction between sorbate–sorbent,32 a reduction in the heat of adsorption of layer molecules is observed, which determines the uniform distribution of binding energies. The nonlinear expression is stated as:
where
Kt (L g
−1) is the binding constant linked to maximum binding energy and
bt (=
RT/
βt) is a constant related to the heat of adsorption (kJ mol
−1). From the plot of
qevs. Ce (
Fig. 6e and f) the values of
Kt and
bt were calculated that interpreted a convincing sorbate–sorbent interaction and a slight change in the heat of adsorption with temperature change, respectively. The values of
bt affirmed physisorption to dominate the adsorption process.
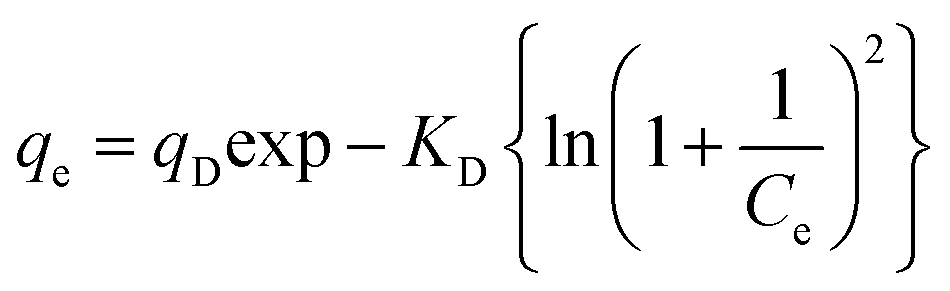
Dubinin–Radushkevish isotherm model is not confined to constant adsorption potential or homogenous surface.33 It apprehends whether the process is physical or chemical from the mean free energy of adsorption. The non-linear form of the D–R model is illustrated as:
| |
 | (6) |
where
qD (mg g
−1) and
KD are the D–R constant and activity coefficient, respectively, in which
KD = (
βDR2T2)). The plot of
qevs. Ce determined the involved isotherm parameters (
Fig. 6g and h). The value of mean free energy of adsorption (
E) was estimated by using
eqn (7):
| |
 | (7) |
If the value of E (kJ mol−1) is reported34 to be between 1 and 8 kJ mol−1, then physical adsorption will prevail in the adsorption process, between 8–16 kJ mol−1 ion-exchange phenomena is encountered, and chemical interaction dominates above 16 kJ mol−1. The values of energy of adsorption (E) for CBB (0.062–0.073 kJ mol−1) and Cr(VI) (0.085–0.098 kJ mol−1) affirmed physisorption. To predict the best-fitted model, correlation coefficient (R2) and standard error of estimate (SEE) were employed (Table 1). Higher values of R2 (0.979 for CBB and 0.987 for Cr(VI)) and lower SEE values (2.862 for CBB and 2.222 for Cr(VI)) confirmed that the Freundlich model best illustrated the equilibrium data implying the multilayer adsorption of CBB and Cr(VI) onto the heterogeneous surface of the Ce-R-MMT nanocomposite.
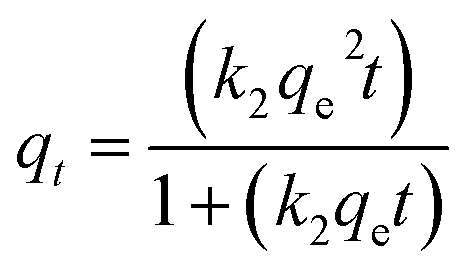
3.4 Kinetic modelling
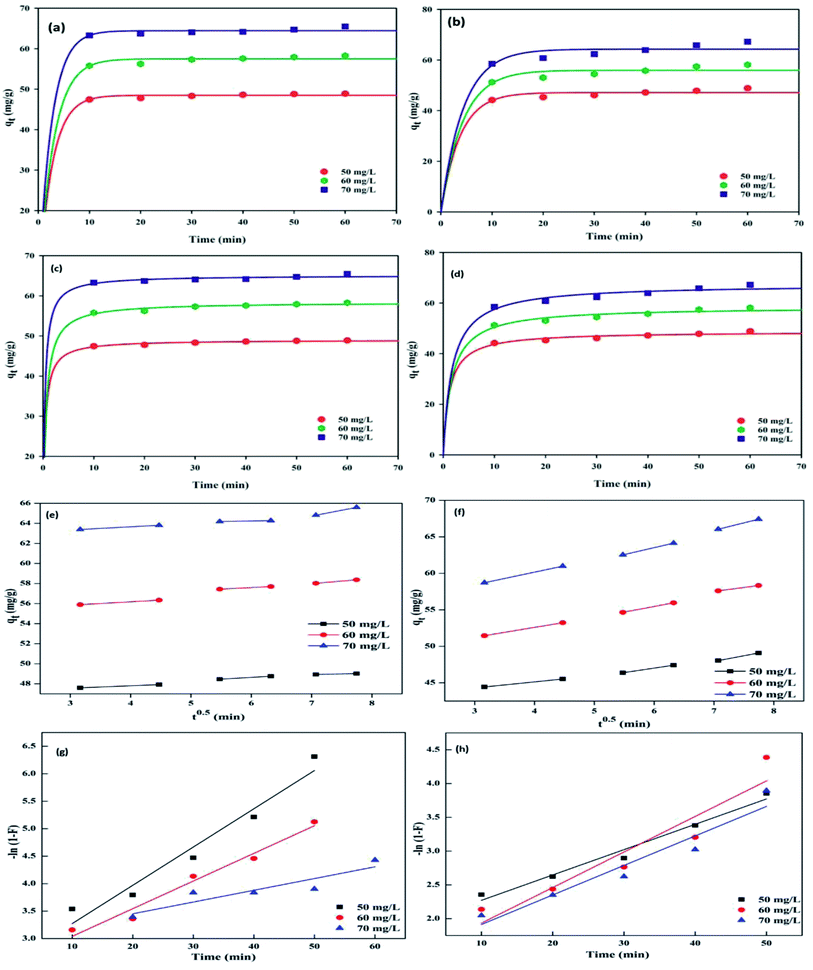
The mechanisms of the sorption of solutes onto the surface of sorbents are illustrated by several kinetic models. The rate of adsorption is the factor that determines the adsorbent's efficiency.35 To layout an effective and fast model, the adsorption rate needs to be investigated. The kinetics of CBB and Cr(VI) adsorption onto the nanocomposite was evaluated by pseudo-first order and pseudo-second order model, which are expressed in non-linear form as:| |
 | (9) |
where k1(min−1) and k2 (g (mg min)−1) are the rate constants of pseudo-first and pseudo-second-order kinetic models, respectively. The plot between qtvs. t determined the values of qe, k1 and k2 (Table 2) of pseudo-first order and the pseudo-second order as shown for CBB (Fig. 7a and b) and Cr(VI) (Fig. 7c and d). It implied that the pseudo-second-order model contributed the best sorption kinetics based on higher R2 (CBB: 0.920; Cr(VI): 0.926) and lower SEE values (CBB: 1.142–1.422; Cr(VI): 1.134–1.725), implying that the sorption rate of the nanocomposite was affected not by the concentration of CBB and Cr(VI) in solution but by several binding sites. Also, higher values of the k parameter confirmed the nanocomposite as an active scavenger of CBB and Cr(VI) from the aqueous phase.
Table 2 Kinetic parameters
| Metal |
Conc. (mg L−1) |
Pseudo-first order |
Pseudo-second order |
| k1 (min−1) |
R2 |
SEE |
qe (cal), mg g−1 |
Qqe (exp), mg g−1 |
K2 × 10−2 (g mg−1 min−1) |
R2 |
SEE |
Qe (cal), (mg g−1) |
| CBB |
50 |
0.347 |
0.635 |
2.342 |
48.628 |
49.030 |
0.055 |
0.914 |
1.422 |
49.165 |
| 60 |
0.380 |
0.694 |
2.174 |
57.600 |
58.781 |
0.032 |
0.917 |
1.388 |
58.508 |
| 70 |
0.400 |
0.706 |
2.089 |
64.543 |
68.621 |
0.047 |
0.920 |
1.142 |
65.188 |
| Cr(VI) |
50 |
0.270 |
0.716 |
1.332 |
47.379 |
48.170 |
0.017 |
0.904 |
1.725 |
48.980 |
| 60 |
0.238 |
0.747 |
1.948 |
56.156 |
57.565 |
0.010 |
0.921 |
1.140 |
58.679 |
| 70 |
0.231 |
0.749 |
2.416 |
64.478 |
67.129 |
0.008 |
0.926 |
1.134 |
67.586 |
 |
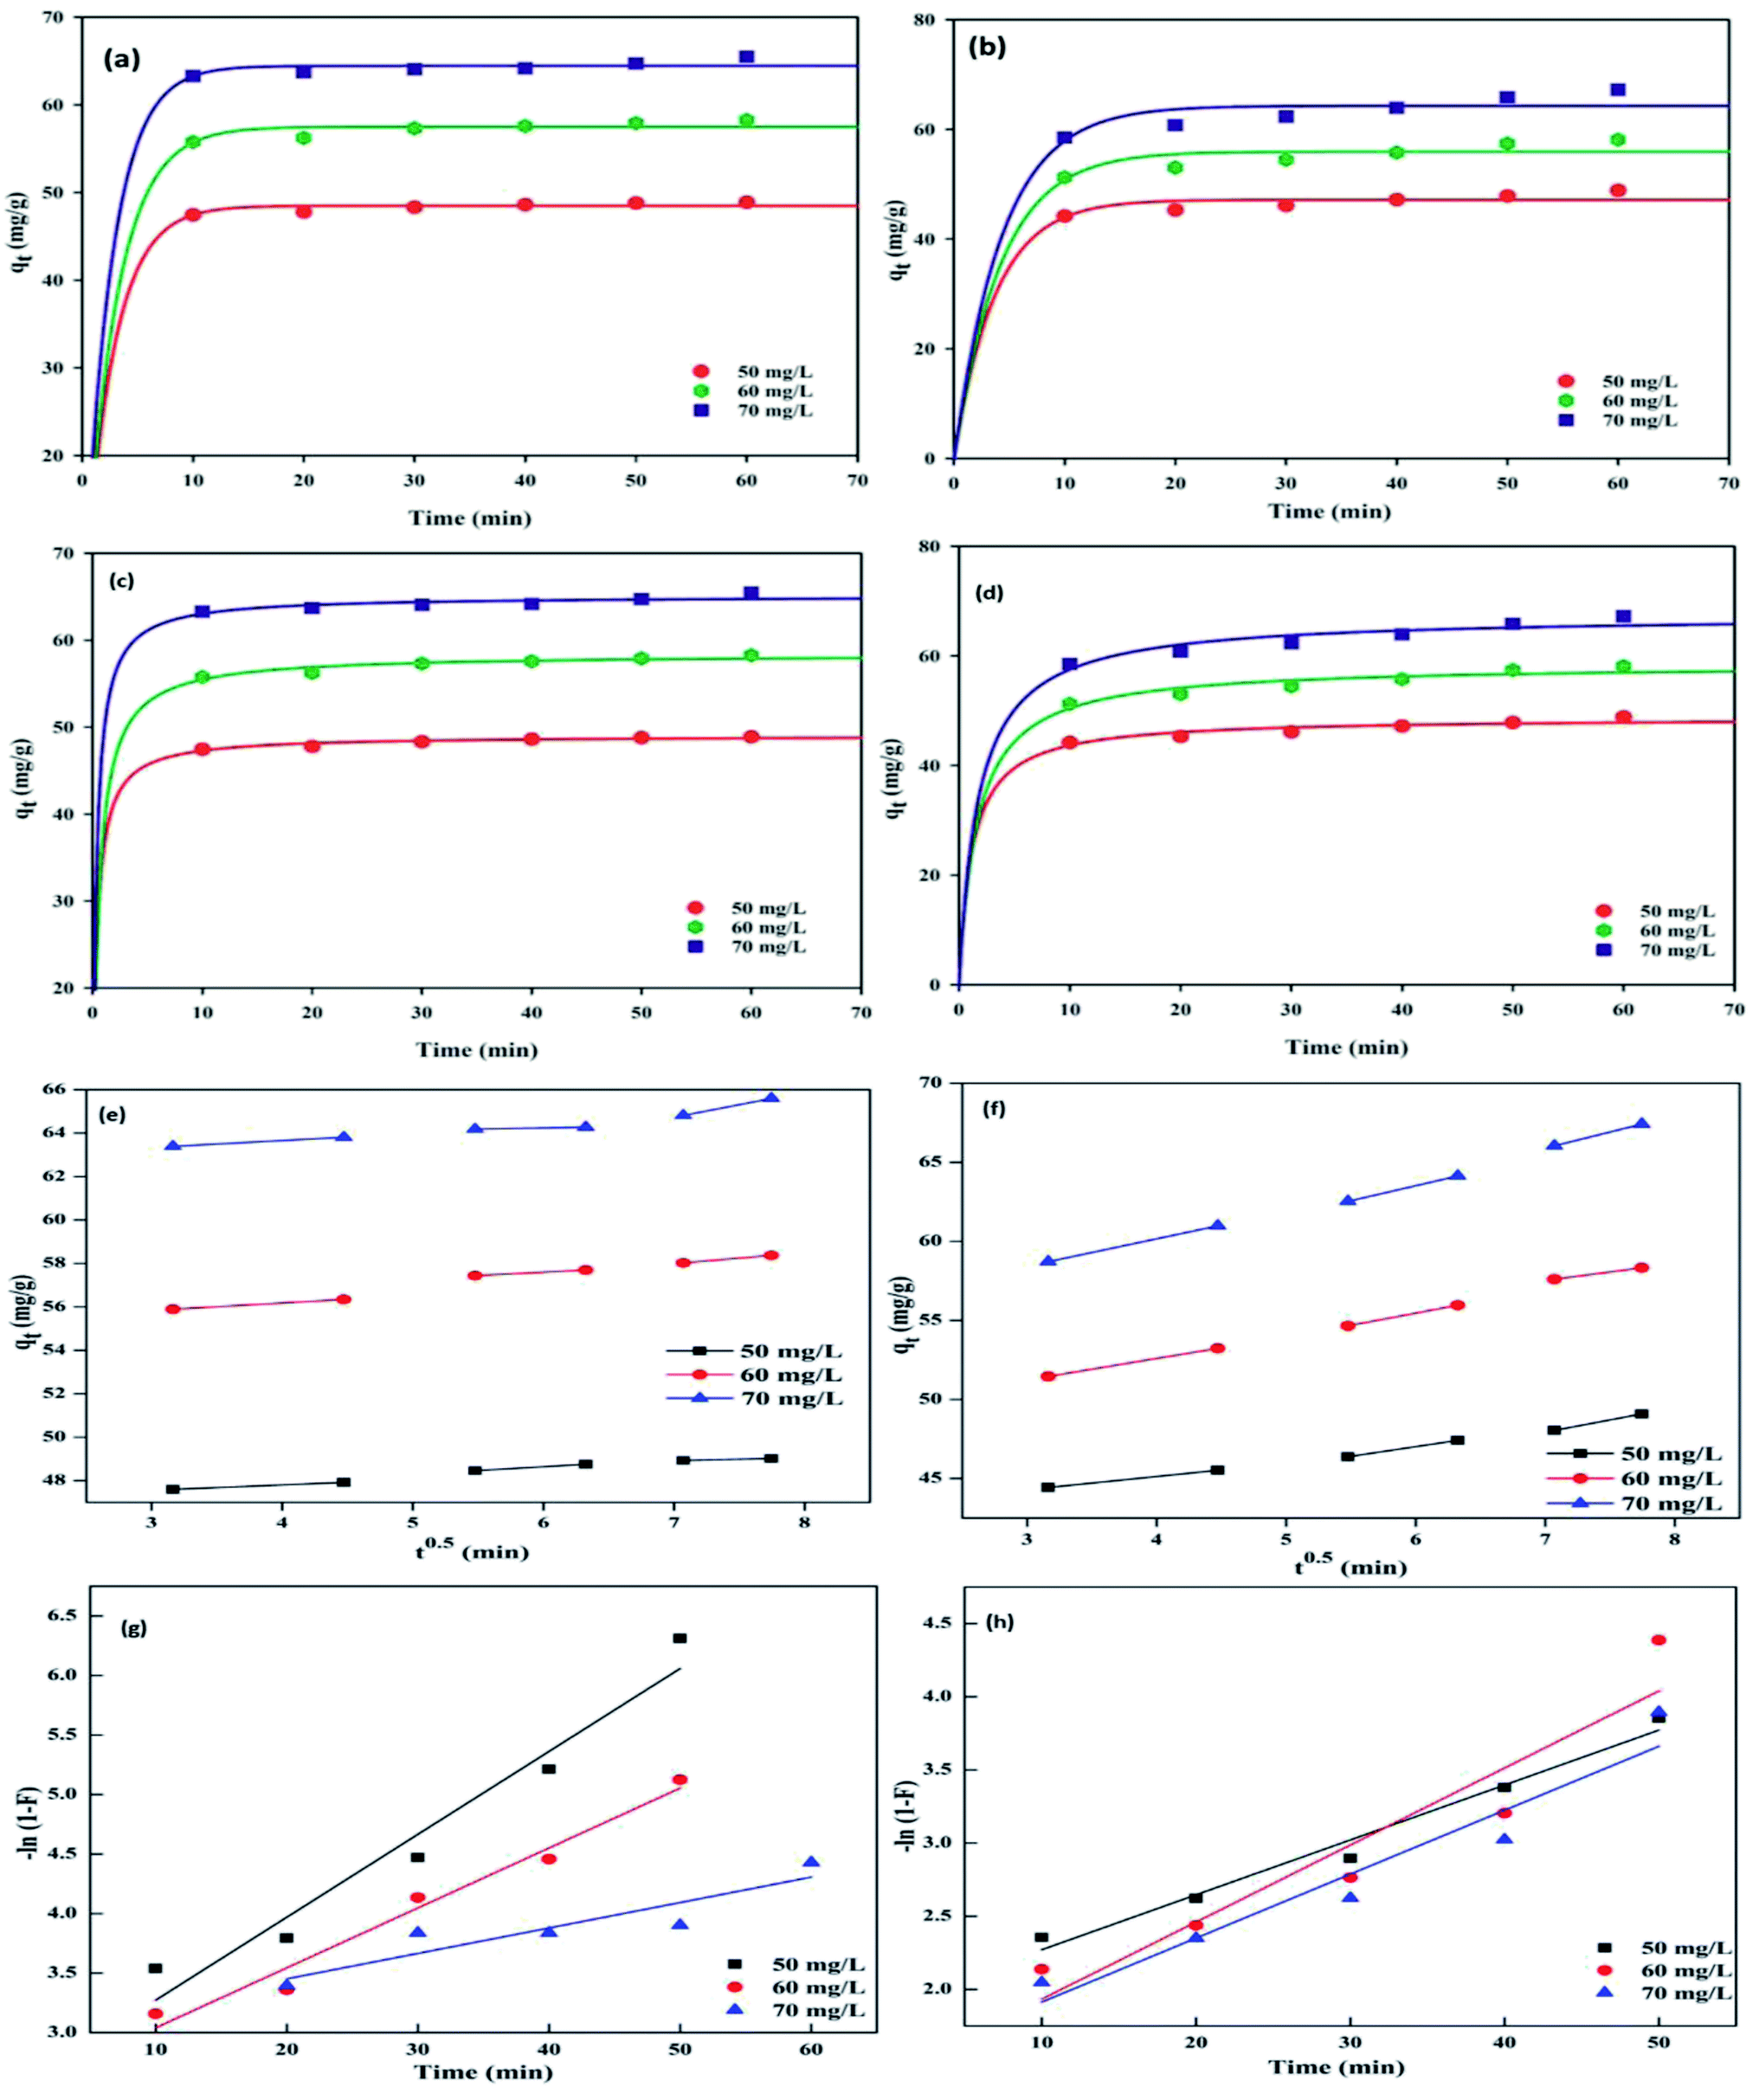
| | Fig. 7 Adsorption kinetics of pseudo-first order and pseudo-second order for CBB (a and b), and for Cr(VI) (c and d), intra-particle and film diffusion plots for CBB (e and g) and for Cr(VI) (f and h) | |
The diffusion mechanism and the rate-controlling step were elucidated by the diffusion models when related to equilibrium data. The kinetics of adsorption is associated with four steps: (a) sorbate mass transfer from the bulk solution to the sorbate external surface (film diffusion) (b) diffusion via boundary layer (c) sorbate mass movement from the external layer into the interior pores of the sorbent (intra-particle diffusion), and (d) binding site coverage by adsorbate.36 The intra-particle diffusion and film diffusion affect the kinetics markedly, while diffusion via the boundary layer and binding site coverage by sorbate has a mere effect. Intra-particle diffusion model,37 assigned to surface and pore diffusion, was applied to acknowledge the rate-controlling step. It is mathematically expressed as:
where
Ki (mg (g min
0.5)) is the intra-particle rate constant and
Ci is a constant related to the thickness of the boundary layer. Determination of the value of
Ki and
Ci was accomplished through the slope and intercept respectively of plot
qtvs. t0.5, and are presented in
Table 3. It is noticeable from the plots that three steps were involved in the sorption of CBB (
Fig. 7e) and Cr(
VI) (
Fig. 7f) onto the nanocomposite. The very first step exhibited sorption at once on the external surface. The second stage was represented by gradual coverage of active sites because of intra-particle diffusion of CBB and Cr(
VI. The intraparticle rate declined due to exceptionally low sorbate concentration and reduced availability of active sites was explained by the final step.
38
Table 3 Diffusion parameters
| Adsorbate |
Conc. (mg L−1) |
Intra-particle |
Diffusion model |
Liquid |
Film |
Diffusion model |
| Ki (mg gmin0.5) |
Ci |
R2 |
SEE |
KA (min−1) |
R2 |
SEE |
| CBB |
50 |
0.334 |
46.538 |
0.966 |
0.163 |
0.069 |
0.940 |
0.227 |
| 60 |
0.564 |
54.051 |
0.960 |
0.301 |
0.050 |
0.964 |
0.159 |
| 70 |
0.434 |
61.684 |
0.876 |
0.422 |
0.021 |
0.883 |
0.287 |
| Cr(VI) |
50 |
0.999 |
41.109 |
0.987 |
0.479 |
0.037 |
0.971 |
0.105 |
| 60 |
1.537 |
46.429 |
0.991 |
0.345 |
0.043 |
0.952 |
0.226 |
| 70 |
1.694 |
52.487 |
0.998 |
0.422 |
0.052 |
0.945 |
0.335 |
The plot of qtvs. t0.5 showed deviation from the origin and multilinearity (Fig. 7e) for CBB and Fig. 7f for Cr(VI), which suggested that intra-particle diffusion was not the sole rate-limiting step. Also, larger values of intercepts for CBB (0.334–0.434) and Cr (0.999–1.894) affirmed a greater boundary layer.39 To evaluate the kinetic data further, Boyds' kinetic model40 was employed, which is expressed as:
where
KA (min
−1) is the liquid film diffusion constant, and
F =
qt/
qe denotes fractional equilibrium. The plot −ln(1 −
F)
vs. t exhibited linearity (
Fig. 7g and h) for CBB and Cr(
VI) but did not pass through the origin, suggesting that liquid film diffusion did not have a rate-controlling effect,
41 which dictated that both intra-particle and liquid film diffusion controlled the diffusive mechanism.
3.5 Thermodynamic investigations
Thermodynamic parameters offer important details about the feasibility and spontaneity of the process. The parameters, including the change in enthalpy (ΔH°), entropy (ΔS°), and free energy (ΔG°) were calculated using eqn (12) and (13), respectively.| |
 | (12) |
The values of ΔH° for CBB (−54.73 kJ mol−1) and Cr(VI) (−40.32 kJ mol−1) specified that the adsorption of these pollutants onto Ce-R-MMT was exothermic. The negative ΔS° values for CBB (−0.16 kJ mol−1) and Cr(VI) (−0.13 kJ mol−1) indicated a decrease in the randomness at the adsorbent-solution interface. The negative values of ΔG° at 298, 303, and 313 K for CBB (−7.05, 6.25, and 4.65 kJ mol−1) and for Cr(V) (7.56, 6.99, and 5.89) revealed the spontaneity of the adsorption process, which decreased with the increase in temperature.
3.6 Adsorption of CBB and Cr(VI) from binary solution
To appraise the adsorption of one pollutant in the presence of another, the concurrent adsorption of CBB and Cr(VI) from their binary solution was investigated. The adsorption was judged based on the R value, which was computed from R = qa/qm, where qa and qm are the removal efficiencies of CBB and Cr(VI) in a binary system and monocomponent system, respectively. If R > 1, a synergistic effect is noted, implying the association of both CBB and Cr(VI) that results in an increase in % removal. If R < 1, an antagonistic effect is prevalent that indicates the inhibition of one pollutant in the presence of other with a decrease in % removal. If R = 1, there are no interactions between adsorbates on the functional site. In the current study, the antagonistic effect was reflected as R value was less than unity, which advocated competitive adsorption between CBB and Cr(VI).
3.7 Desorption and reusability
For the evaluation of the performance of the adsorbent's potential utility in water treatment, reusability is an important factor. In general, the adsorbent that is preferred for reusability should have a high adsorption–desorption rate because it reduces the treatment cost. The prepared nanocomposite was utilized for three adsorption–desorption cycles. For the sorption site regeneration, the prepared nanocomposite (1 g L−1) was saturated with 50 mg L−1 of Cr(VI) and 40 mg L−1 CBB solutions for 2 h and then washed to get rid of excess metal ions and dye and, dried. The adsorbent was regenerated by H2SO4 solution (2 M), HCl (0.1 M), and ethanol. However, H2SO4 and ethanol did not show promising results, and thus the reusability was carried out in HCl. The prepared nanocomposite showed good regeneration potential for Cr(VI) and CBB up to 92.45% and 99.38% in the first cycle, which is lowered in the second cycle to 91.06% and 93.56% and in the third further reduced to 82.12% and 61.44%, respectively (Table 4). The complete adsorption–desorption cycle depicted Ce-R-MMT to be a promising adsorbent with good feasibility.
Table 4 Sorption–desorption cycle
| Number of cycles |
Sorption CBB (%) |
Desorption CBB (%) |
Sorption Cr(VI) (%) |
Desorption Cr(VI) (%) |
| 1 |
99.85 |
99.38 |
98.54 |
92.45 |
| 2 |
98.66 |
93.56 |
98.20 |
91.06 |
| 3 |
95.95 |
61.44 |
96.78 |
82.12 |
3.8 Mechanism of pollutant adsorption
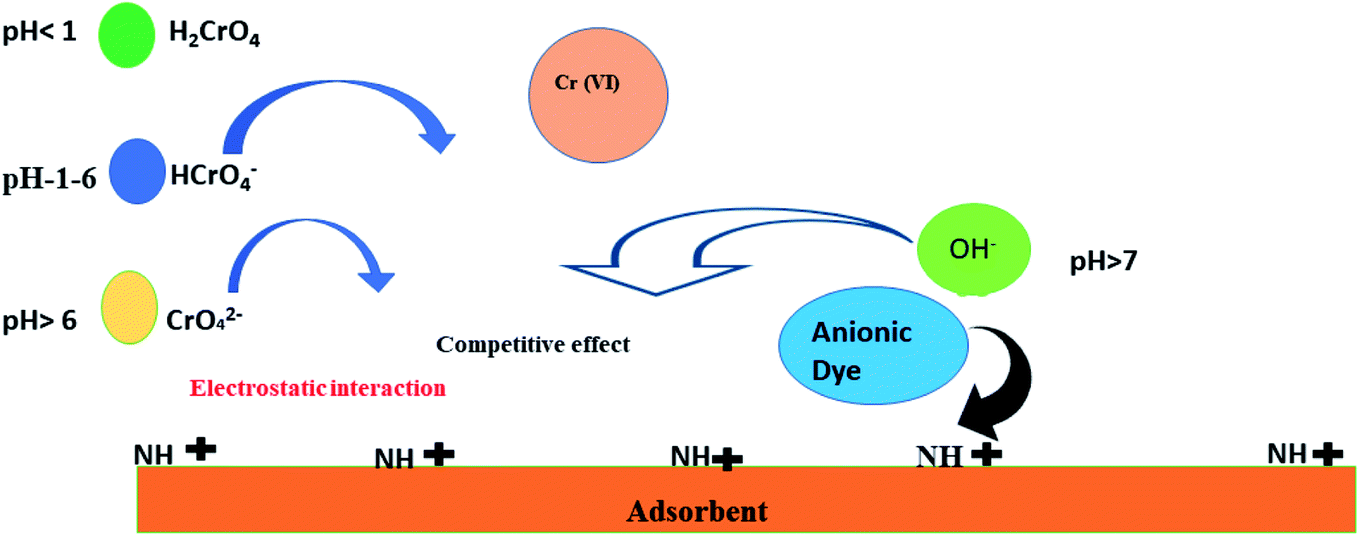
The biopolymeric functionalized montmorillonite nanocomposite bears cationic quaternary ammonium groups, which interact with anionic pollutants and other compounds that are negatively charged.42 Depending on the pH, the hexavalent chromium species may be generally presented as (CrO42−), (H2CrO4), and hydrogen chromate HCrO4− form.43 The positive surface charge attracts these anionic species. Also, CBB is anionic in nature and due to electrostatic interactions binds with the Ce-R-MMT surface.44 The possible interaction of both CBB and Cr(VI) is shown in Fig. 8. Further, the functional groups in Ce-R-MMT seemed to coordinate with Cr(VI), where the metal ion act as a Lewis acid receiving electrons from the hydroxyl and amino groups of nanocomposite (Lewis base). Some of the Cr(VI) also take over MMT interlayer cations and significantly improved the performance of the Ce-R-MMT sorbent.45 This reflected an appreciable interaction between Cr(VI) and CBB with the functional groups of the Ce-R-MMT nanocomposite.
 |
| | Fig. 8 Possible adsorption mechanism of CBB and Cr(VI) onto Ce-R-MMT. | |
4. Conclusion
A nanocomposite, Ce-R-MMT, was synthesized, and its adsorption capacities towards an anionic dye coomassie Brilliant blue and Cr(VI) were testified. The adsorption parameters such as adsorbent dosage (1 g L−1), contact time (40 min), initial concentration (CBB: 40 mg L−1; Cr(VI): 50 mg L−1), and pH (6) were assessed. The experimental data was modeled by incorporating isotherm models such as Langmuir, Freundlich, Temkin, and D–R isotherms. The Qm values for CBB and Cr(VI) were found to be significantly higher at 713.51 and 182.04 mg g−1. The pseudo-second order model governed the kinetics of adsorption. Thermodynamic studies demonstrated the process to be exothermic, spontaneous, and feasible. Binary studies unveiled the suppression of the adsorption of one pollutant in the presence of the other. The mechanism governing the removal was electrostatic interaction. The regenerated adsorbent, without much loss in efficacy, exhibited good performance up to three cycles. The Ce-R-MMT proved to be an efficient and capable adsorbent for CBB and Cr(VI) in an aquatic medium.
Conflicts of interest
There are no conflicts to declare.
References
- M. Oveisi, M. A. Asli and N. M. Mahmoodi, Inorg. Chim. Acta, 2019, 487, 169–176 CrossRef CAS.
- S. Sondhi, Sustainable Technologies for Fashion and Textiles, Elsevier, 2020, pp. 327–341 Search PubMed.
- M. A. Islam, I. Ali, S. A. Karim, M. S. H. Firoz, A. N. Chowdhury, D. W. Morton and M. J. Angove, J. Water Process. Eng., 2019, 32, 100911 CrossRef.
- N. M Mahmoodi and M. H. Saffar-Dastgerdi, Appl. Catal., B, 2020, 268, 118443 CrossRef.
- P. U Igwe, C. C Chukwudi, F. C Ifenatuorah, I. F. Fagbeja and C. A. Okeke, Int. J. Adv. Eng. Res. Sci., 2017, 4, 237340 Search PubMed.
- M. Kapahi and S. Sachdeva, J. Health Pollut., 2019, 9, 191203 CrossRef PubMed.
- G. Crini and E. Lichtfouse, Environ. Chem. Lett., 2019, 17, 145–155 CrossRef CAS.
- M. E Ali, M. E. Hoque, S. K. Safdar Hossain and M. C. Biswas, Int. J. Environ. Sci. Technol., 2020, 17, 4095–4132 CrossRef.
- A. Othmani, J. John, H. Rajendran, A. Mansouri, M. Sillanpää and P. V. Chellam, Sep. Purif. Technol., 2021, 274, 119062 CrossRef CAS.
- A. Awwad, N. Salem, M. Amer and M. Shammout, Chem. Int., 2021, 7, 139–144 CAS.
- J. Luo, D. Yu, K. D. Hristovski, K. Fu, Y. Shen, P. Westerhoff and J. C Crittenden, Environ. Sci. Technol., 2021, 55, 4287–4304 CrossRef CAS PubMed.
- C. Zinge and B. Kandasubramanian, Eur. Polym. J., 2020, 133, 109758 CrossRef CAS.
- S. A. Khan, N. Abbasi, D. Hussain and T. A. Khan, Langmuir, 2022, 38(27), 8280–8295 CrossRef CAS PubMed.
- A. Edhirej, S. M. Sapuan, M. Jawaid and N. I Zahari, Int. J. Biol. Macromol., 2017, 101, 75–83 CrossRef CAS PubMed.
- S. M. Sapuan, H. S. Aulia, R. A. Ilyas, A. Atiqah, T. T. Dele-Afolabi, M. N. Nurazzi and M. S. N. Atikah, Polymers, 2020, 12, 2211 CrossRef CAS PubMed.
- N. Nasrollahi, S. Abe, V. Vatanpour and N. M. Mahmoodi, Composites, Part B, 2018, 154, 388–409 CrossRef CAS.
- M. Oveisi, N. M. Mahmoodi and M. A. Asli, J. Cleaner Prod., 2019, 222, 669–684 CrossRef CAS.
- T. V. M. Sreekanth, P. C. Nagajyothi, G. R. Reddy, J. Shim and k. Yoo, Sci. Rep., 2019, 9, 1–9 CrossRef CAS PubMed.
- A. Nakarmi, K. Chandrasekhar, S. E. Bourdo, F. Watanabe, G. Guisbiers and T. Viswanathan, Environ. Sci. Pollut. Res., 2020, 27, 36688–36703 CrossRef CAS PubMed.
- L. Zhang, T. Zhu, X. Liu and W. Zhang, J. Hazard. Mater., 2016, 308, 1–10 CrossRef CAS PubMed.
- S. J Park, D. I. Seo and J. R. Lee, Surface modification of montmorillonite on surface acid–base characteristics of clay and thermal stability of epoxy/clay nanocomposites, J. Colloid Interface Sci., 2002, 251, 160–165 CrossRef PubMed.
- F. Chivrac, E. Pollet, P. Dole and L. Avérous, Carbohydr. Polym., 2010, 79, 941–947 CrossRef CAS.
- M. Jobbágy, F. Mariño, B. Schönbrod, G. Baronetti and M. Laborde, Chem. Mater., 2006, 18, 1945–1950 CrossRef.
- F. G. Mendonça, E. J. S. Filho, A. C. Bertoli, M. A. Fernández, R. M. Torres Sánchez and R. M. Lago, Sep. Purif. Technol., 2019, 229, 115751 CrossRef.
- A. Afkhami, M. Saber-Tehrani and H. Bagheri, Desalination, 2010, 3, 240–248 CrossRef.
- M. Naushad, S. Vasudevan, G. Sharma, A. Kumar and Z. A. Alothman, Desalin. Water Treat., 2016, 57, 18551–18559 CrossRef CAS.
- N. M. Mahmoodi, B. Hayati and M. Arami, J. Chem. Eng. Data, 2010, 55(11), 4638–4649 CrossRef CAS.
- G. Crini and P. M. Badot, Prog. Polym. Sci., 2008, 33, 399–447 CrossRef CAS.
- D. Mohan and C. U. Pittman Jr, J. Hazard. Mater., 2006, 137, 762–811 CrossRef CAS PubMed.
- S. A Khan, D. Hussain, N. Abbasi and T. A. Khan, Chemosphere, 2022, 289, 133232 CrossRef PubMed.
- H. M. F. Freundlich, J. Phys. Chem. A, 1906, 57, 385–470 CAS.
- R. D. Johnson and F. H. Arnold, Biochim. Biophys. Acta, Protein Struct. Mol. Enzymol., 1940, 12, 217–222 Search PubMed.
- M. M. Dubinin and L. V. Radushkevich, Proc. Acad. Sci. Phys.Chem. Sect., 1947, 1, 875 Search PubMed.
- T. A. Khan, M. Nouman, D. Dua, S. A Khan and S. S Alharthi, J. Saudi Chem. Soc., 2022, 26, 101417 CrossRef CAS.
- B. Hayati and N. M. Mahmoodi, Desalin. Water Treat., 2016, 47(1–3), 322–333 Search PubMed.
- X. S. Hu, R. Liang and G. Sun, J. Mater. Chem. A, 2018, 36, 17612–17624 RSC.
- W. J. Weber and J. C. Morris, J. Sanit. Eng. Div., 1963, 2, 31–60 CrossRef.
- Y. Zhao, W. Li, Z. Liu, . Liu, L. Zhu, X. Liu and K. Huang, ACS Sustainable Chem. Eng., 2018, 6, 15264–15272 CrossRef CAS.
- Q. Zhao and S. E. Burns, Environ. Sci. Technol., 2013, 6, 2769–2776 CrossRef PubMed.
- G. E. Boyd, J. Schubert and A. W. Adamson, J. Am. Chem. Soc., 1947, 11, 2836–2848 CrossRef PubMed.
- A. Chowdhury, A. A. Khan, S. Kumari and S. Hussain, ACS Sustainable Chem. Eng., 2019, 7, 4165–4176 CrossRef CAS.
- Y. Koriche, M. Darder, P. Aranda, S. Semsari and E. Ruiz-Hitzky, Dalton Trans., 2014, 43(27), 10512–10520 RSC.
- D. Mohan and C. U. Pittman Jr, J. Hazard. Mater., 2006, 137, 762 CrossRef CAS PubMed.
- M. Tanzifi, M. T. Yaraki, M. Karami, S. Karimi, A. D. Kiadehi, K. Karimipour and S. Wang, J. Colloid Interface Sci., 2018, 519, 154–173 CrossRef CAS PubMed.
- E. M. Azzam, G. H. Eshaq, A. M. Rabie, A. A. Bakr, A. A. Abd-Elaal, A. E. El Metwally and S. M. Tawfik, Int. J. Biol. Macromol., 2016, 89, 507–517 CrossRef CAS PubMed.
|
| This journal is © The Royal Society of Chemistry 2022 |
Click here to see how this site uses Cookies. View our privacy policy here. 
 Open Access Article
 This Open Access Article is licensed under a Creative Commons Attribution-Non Commercial 3.0 Unported Licence
 *a,
Suhail Ayoub Khanb,
Weqar Ahmad Siddiqi
*a,
Suhail Ayoub Khanb,
Weqar Ahmad Siddiqi


 obtained for CBB and Cr(VI) were 0.219 and 0.076, respectively.