
Linking cavitation and fracture to molecular scale structural damage of model networks†
Christopher W.
Barney‡
 ,
Ipek
Sacligil
,
Gregory N.
Tew
and
Alfred J.
Crosby
*
,
Ipek
Sacligil
,
Gregory N.
Tew
and
Alfred J.
Crosby
*
Polymer Science & Engineering Department, University of Massachusetts, Amherst, MA 01003, USA. E-mail: acrosby@umass.edu
First published on 17th May 2022
Abstract
Rapid expansion of soft solids subjected to a negative hydrostatic stress can occur through cavitation or fracture. Understanding how these two mechanisms relate to a material's molecular structure is important to applications in materials characterization, adhesive design, and tissue damage. Here, a recently improved needle-induced cavitation (NIC) protocol is applied to a set of model end-linked PEG gels with quantitatively linked elastic and fracture properties. This quantitative link between molecular scale structure and macroscopic properties is exploited to experimentally probe the relationship between cavitation, fracture, and molecular scale damage. This work indicates that rational tuning of the elastofracture length relative to the crack geometry can be used to alter the expansion mechanism from cavitation to fracture during NIC.
1 Introduction
Cavitation rheology encompasses a developing suite of techniques that exploit the phenomenon of cavitation to characterize the mechanical properties of soft gels and biological tissues.1 Here cavitation is defined as the sudden, unstable expansion of a void or bubble in a fluid or solid subjected to negative hydrostatic stress. Needle-induced cavitation (NIC) is an important cavitation rheology technique due to its simple experimental setup, straightforward experimental protocol, and ability to characterize samples both in and ex vivo.2–5 NIC is performed by inserting a needle into a sample beyond the puncture point and then injecting a fluid into the sample. Upon reaching a critical pressure, rapid expansion of a void at the needle tip is observed.6 This expansion can occur through an elastic cavitation process or an inelastic fracture process, and the critical pressure at which this expansion occurs relates to both the material properties of the sample and the needle geometry.7 Fracture is defined as the process of creating a new surface within a material through the accumulation of molecular scale structural damage. Distinguishing these two expansion mechanisms is critical when exploiting cavitation to characterize the elastic and fracture properties of a material.7–9Despite the promise of NIC, distinguishing cavitation and fracture mechanisms has remained challenging, both in terms of the experimental protocols employed and understanding the structure of the materials tested. Traditional NIC protocols have largely focused on the pressurization process while leaving the needle insertion process vague, saying only that it must be embedded in the sample beyond the point of puncture. Recent work has found that this ambiguity can lead to a 10× increase in the critical injection pressure due to the presence of residual strain below the indenter tip.6,10 It was further found that including a retraction step to pull the needle back after insertion, which leaves an open crack below the needle tip, reduced the critical injection pressure to the point where it agreed well with theoretical predictions of the critical cavitation pressure PCav.6PCav is connected to both the materials properties and cavity geometry and takes the form,
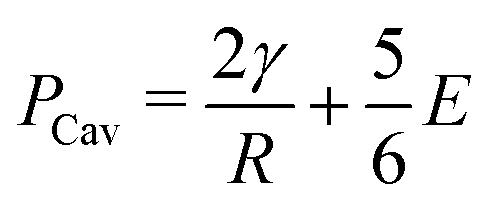 | (1) |
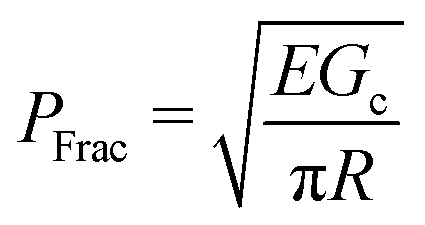 | (2) |
The transition between cavitation and fracture in NIC can be found by equating PCav and PFrac to get,
 | (3) |
G c/E is a physical size scale related to the breakdown of linear elastic fracture mechanics (LEFM) and the onset of nonlinear failure mechanisms, such as crack blunting.17Gc/E is determined by two properties which relate to the molecular scale structure of crosslinked networks. This connection to molecular scale structure presents a challenge as most crosslinking strategies form heterogeneous networks with poorly defined structure.18 This poor understanding of network structure has limited the experimental design of literature studies aimed at probing this transition with NIC to focus solely on tuning E instead of Gc/E as a primary variable, even though eqn (3) indicates that Gc/E is the important parameter.7–9
Recently, the elastic and fracture properties of model end-linked tetrafunctional poly(ethylene glycol) gels (PEG gels) were characterized.16,19,20 Material properties of these well-defined networks were found to quantitatively agree with molecular models of elasticity and fracture, demonstrating that chain scission provided the only significant energy dissipation observed during fracture.16 This understanding of the observed energy dissipation mechanism enables the connection between macroscopically observed deformation and molecular scale network structure. Independent characterization of both E and Gc in these model PEG gels also enables the rational design of experiments that tune Gc/E. Here, we use NIC measurements on model PEG gels, which systematically vary Gc/E, to provide new insight into the transition between cavitation and fracture mechanisms.
This work experimentally links cavitation and fracture to molecular scale structural damage by performing NIC on model PEG gels. Experimental details on the methods and materials used in this study, including a discussion of strategies for tuning the elastofracture length, are first presented. NIC measurements on the model PEG gels are then presented. Morphology of the cavities during and after expansion as well as quantitative comparison between cavitation and fracture pressure predictions are used to connect the observed expansion mechanism to molecular scale structural damage. This connection is used to rationally tune between the cavitation and fracture driven expansion mechanisms. These findings have broad implications for applications in materials characterization,7–9 design of pressure sensitive adhesives,21–23 and damage of biological tissues.1,24
2 Experimental
2.1 Methods
Full details on the experimental equipment and methods used in NIC have been recently published.6 Here, only the details necessary for recreating these measurements are reported. NIC was performed using a needle displacement rate of 1 mm s−1, maximum displacement of 15 mm, retraction distance of 7.5 mm, and volumetric compression rate of 500 microliter per minute with air as the injection fluid. Approximately 2 mL of compressible volume was contained in the system. Needle size was varied with values of the inner and outer radius (Rin, Rout) = {(80,156),(130,232),(534,737)} μm. Here, the outer radius sets the relevant size scale and is simply referred to as R in the rest of this work. Critical pressures were typically observed 30–60 s after pressurization occurred. Estimating the onset of the instability-like expansion to occur at a strain of approximately 50% gives an average strain rate of approximately 0.01 s−1.8 A summary of all experimental conditions for each set of data is available in the ESI.† Compressional dynamic mechanical analysis (DMA) was performed in this work and is reported in the ESI.† The experimental notch test data presented in this work is taken from a previous publication.162.2 Materials
Tetrafunctional poly(ethylene glycol) (PEG) gels were formed in dimethylformamide (DMF) through reaction of linear telechelic PEG macromonomers with a tetrafunctional crosslinking agent (Fig. 1). Samples were tested as made without further swelling or solvent exchange. Here, only the details necessary for recreating these gels are reported. Full details on the experimental materials used in this study have been recently published.16 Gels were synthesized using 4 kg mol−1 (degree of polymerization N = 91) and 12 kg mol−1 (N = 273) linear PEG chains at a concentration of 50 mg mL−1 and 77 mg mL−1 in DMF respectively. The end-linking strategy used to create these networks is more controlled than other strategies such as free radical polymerization or typical rubber vulcanization processes.25–27 The structure of these gels, including the fraction of loop defects, has been characterized and reported separately.16,20,28–31 Since the network structure of these end-linked gels is well-defined, N can be calculated from the input length of the PEG chains16,31 and not inferred from measurements of E as is typically done for networks that have ill-defined structure.26,32,33 | ||
| Fig. 1 Sketch showing the experimental geometry and network chemistry used in this work. This is the same synthetic approach employed recently to demonstrate a strong connection between molecular structure and both E and Gc.16 | ||
3 Tuning the elastofracture length
Probing the cavitation to fracture transition in NIC requires the ability to rationally tune Gc/E relative to the needle radius R. This presents a particular challenge as Gc and E are materials properties that lack a deterministic link at the continuum level. This means that any theoretical link between Gc and E must necessarily relate both properties to material structure. Recently, it has been shown that E in these gels is well-modeled with the real elastic network theory (RENT) model, | (4) |
 | (5) |
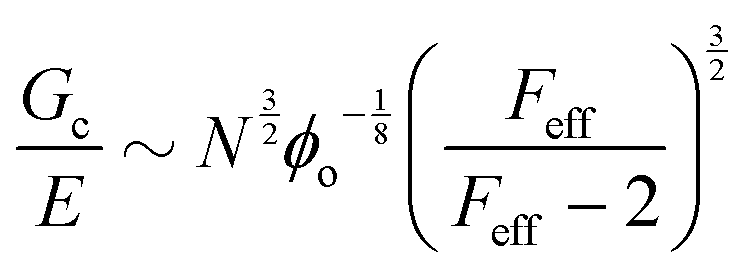 | (6) |
Data showing Gc/E measured via pure shear notch tests performed on PEG gels at various N and ϕo are shown in Fig. 2.16 Good agreement is observed between the scalings from these plots and those predicted by eqn (6). Note that while the range of ϕo values accessed here is not wide enough to distinguish between a ϕoo and 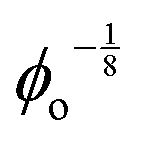 scaling, it is clear from the data that
  does not vary significantly over the ϕo range used in the NIC experiments. This agreement confirms that altering N is an effective means of tuning Gc/E while altering ϕo is not. This means that while both ϕo and N are altered between samples used in this study, tuning N is the underlying change which drives a shift in Gc/E. These results highlight the importance of understanding the coupled nature of Gc and E when designing experiments around tuning the elastofracture length.
 | ||
| Fig. 2 Plots of the elastofracture length against (a) N and (b) ϕo showing strong agreement with the scaling predictions of eqn (6). Data is taken from pure shear notch tests.16 Agreement between the data and theoretical scalings shows that altering N is a more effective means of tuning Gc/E. | ||
4 Needle-induced cavitation of model gels
The transition between cavitation and fracture mechanisms is related to the needle size R and both γ/E and Gc/E, as laid out in eqn (3). Assuming that γ ≈ 40 mN m−1 and E ≈ 10 kPa gives an estimate of γ/E on the order of 10−6 m. Taking the ratio of γ/E relative to the smallest needle size R ≈ 10−4 m, gives a value of approximately 0.01 which is negligible compared to the 5/6 value in eqn (3). Since the contribution from interfacial tension is negligible, the crossover point between PCav and PFrac is predicted at a value of RE/Gc = 0.46. Images of the cavity at the needle tip starting at the onset of expansion and increasing with time as a function of R normalized by Gc/E are shown in Fig. 3. Videos SV1–4 (ESI†) show the full runs for RE/Gc = {0.84,0.37,0.27,0.02}, respectively. Note that the optical contrast of the roughness at the cavity surface is influenced by the orientation of the crack. Since this is randomly determined by the needle insertion process and does not become apparent until expansion occurs, all discussion of roughness in this work is qualitative. RE/Gc is adjusted from 0.84 to 0.27 by altering the size of the needle employed. RE/Gc is shifted from 0.27 to 0.02 by tuning Gc/E.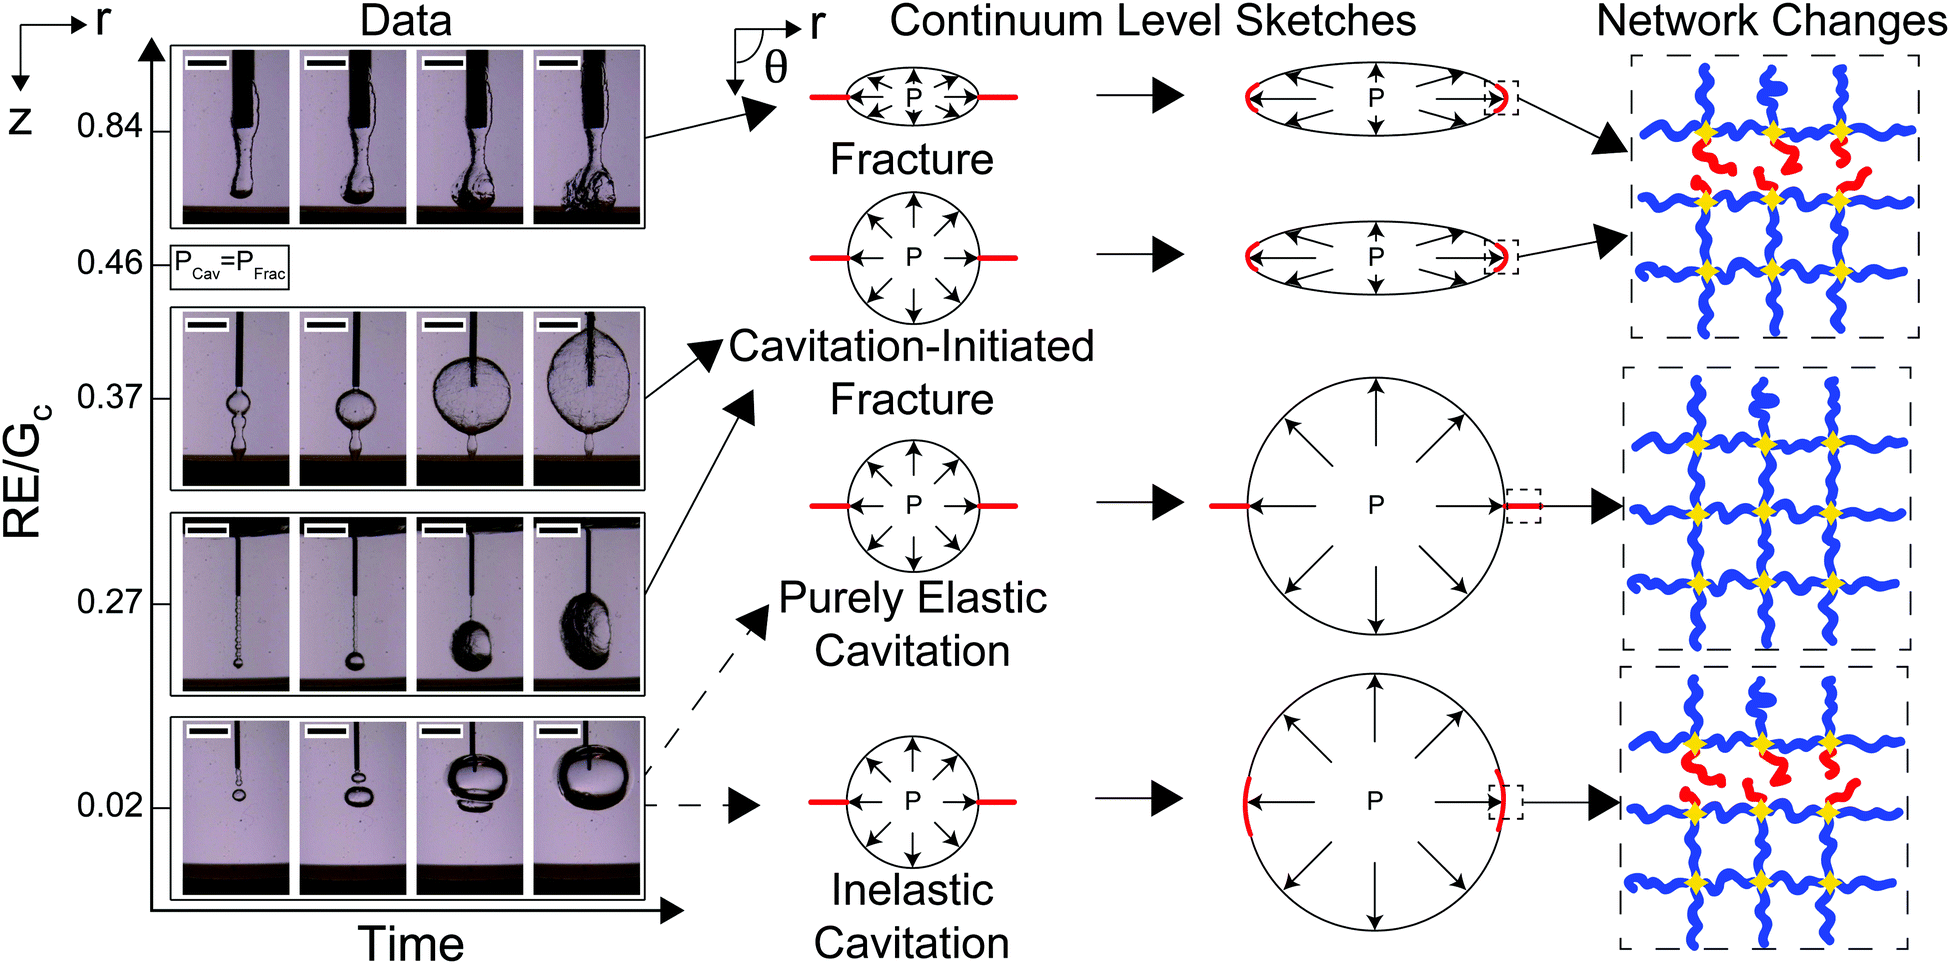 | ||
| Fig. 3 Images of the cavity starting at the critical pressure and increasing with time as a function of RE/Gc. Sketches of the process from a continuum perspective and molecular perspective are also shown. Note that the sketches shown are in a different viewing plane than the one shown in the experimental images. The red lines in the continuum level sketches represent the potential crack path that would open up if crack propagation were to occur. When RE/Gc = 0.02 two potential expansion mechanisms are observed. Scale bars are 2.5 mm in length. | ||
The morphologies observed in these images display four potential expansion mechanisms. When RE/Gc = 0.84, the cavity at the start and finish of expansion is rough and lacks axisymmetry indicating a fracture process driving expansion. This leads to the rupture of network chains at the crack tip. When RE/Gc = 0.37 and RE/Gc = 0.27, the cavity at the start of expansion is smooth, and then transitions to being rough indicating a cavitation-initiated expansion that transitions to a fracture process. This also leads to the rupture of network chains at the crack tip. When RE/Gc = 0.02, the cavity at the start and finish of expansion is smooth which suggests either an elastic cavitation process or an inelastic cavitation process where damage occurs in the material through a nonlinear failure mechanism. These results indicate that visualization of the cavity at the start and finish of the expansion can be used to distinguish between all expansion mechanisms except for those where expansion of the cavity stabilizes before the ultimate failure stretch is achieved.
While the expansion when RE/Gc = 0.02 appears similar to a purely elastic cavitation process, visual measurements alone cannot determine that irreversible changes, or damage, do not occur to the network. This potential damage is sketched in Fig. 3 as being localized around the crack tip as one might expect during blunted crack propagation;17 however, recent experimental work suggests that the damage may be more distributed in this case.35 The images in Fig. 3 can be used to distinguish whether or not damage must occur by calculating the volumetric stretch at the cavity surface after expansion.
Taking the square root of the ratio between the final and initial surface area A between the surfaces at the start and finish of expansion can then be use to estimate the maximum stretch λmax,
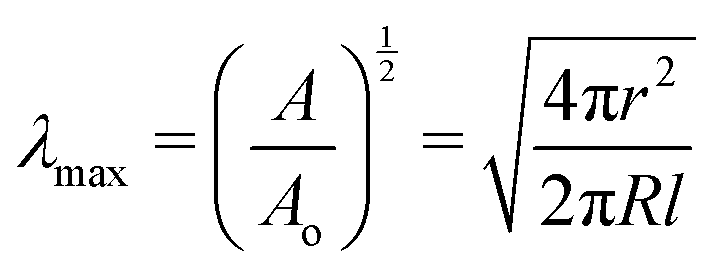 | (7) |
 | (8) |
While the cavity morphology can be used to distinguish between the expansion mechanisms, these phenomena are also distinguishable through quantitative predictions of the cavitation and fracture pressures. Experimentally observed critical pressure Pc normalized by PCav plotted against RE/Gc is shown in Fig. 4a. The solid black line represents PFrac/PCav with negligible interfacial tension and the arrows show the crossover point where RE/Gc = 0.46. At low values of RE/Gc, Pc/PCav ≪ PFrac/PCav indicating that the threshold cavitation pressure is realized well below the criterion for fracture in support of the inelastic cavitation mechanism proposed above. The divergence of PFrac/PCav as RE/Gc → 0 shows that the inelastic cavitation mechanism is made possible by a breakdown of LEFM, which is often assumed to hold when modeling the transition between cavitation and fracture.8 At intermediate values of RE/Gc, Pc/PCav<PFrac/PCav indicating that the cavitation pressure is near but less than the fracture pressure. This finding indicates that initiation of expansion will occur through an elastic cavitation mechanism; however, the fracture criterion will be satisfied during expansion resulting in a cavitation-initiated fracture mechanism. At large values of RE/Gc, Pc/PCav > PFrac/PCav indicating that the fracture pressure will be realized before the cavitation pressure leading to a straightforward fracture expansion mechanism. Also note that the measurements at RE/Gc ≈ 0.84 provide the first experimental verification that Gc measured with NIC agrees with an independent estimate from notch tests as shown in Fig. 4b.16
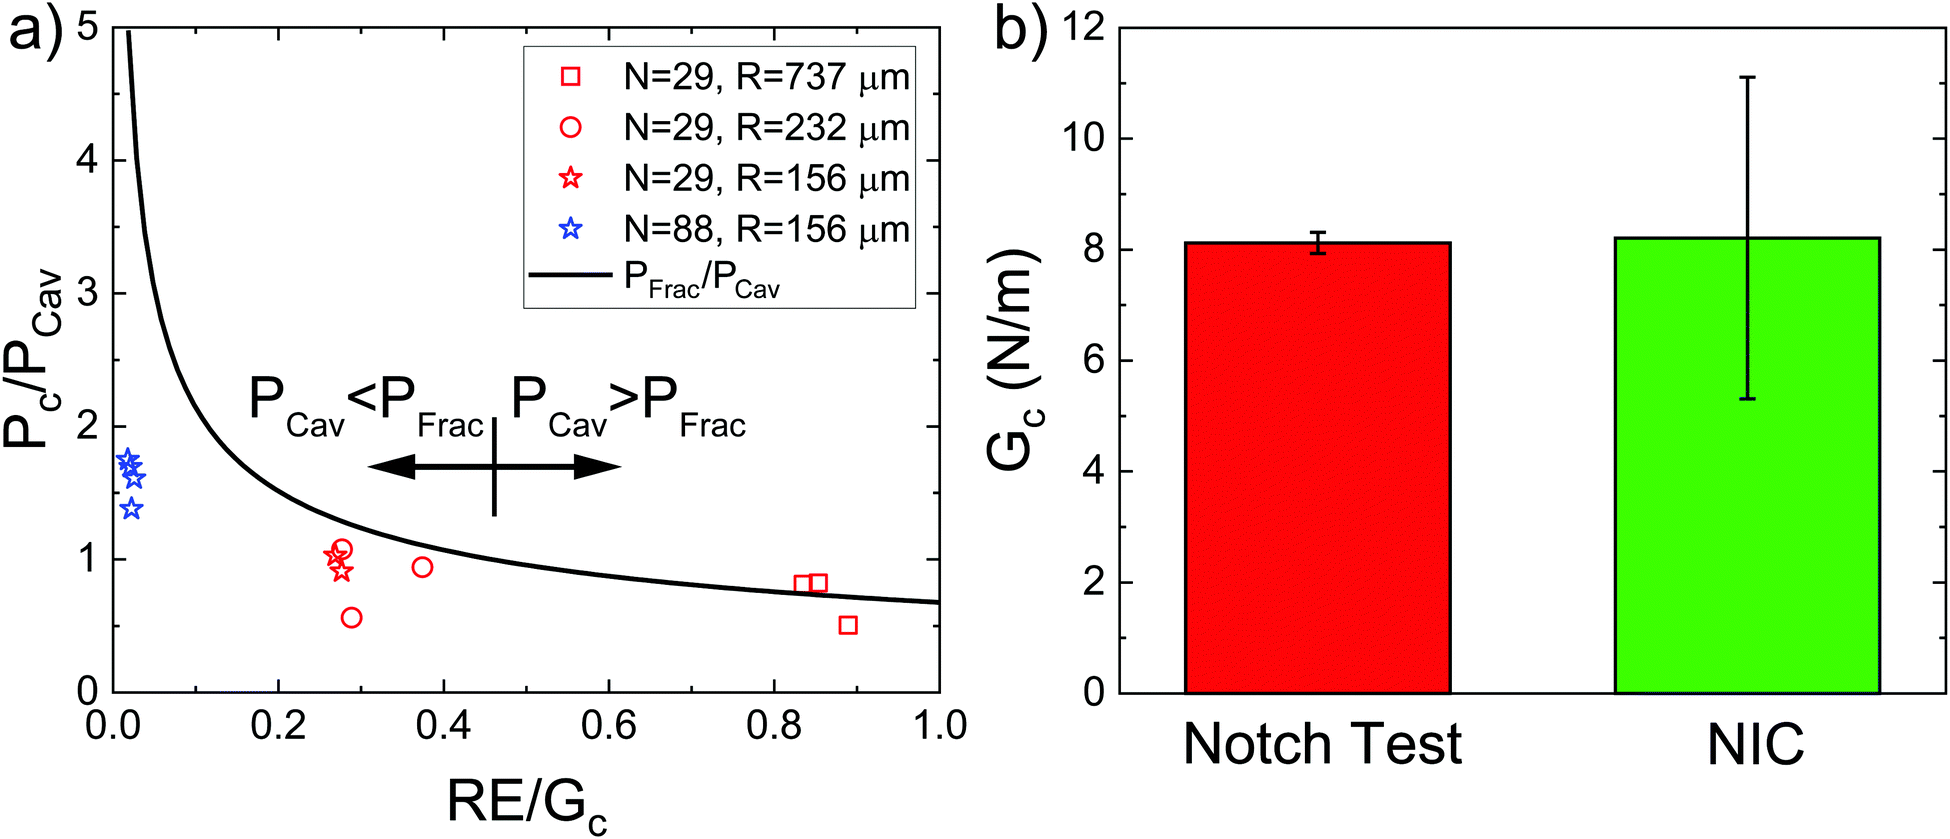 | ||
| Fig. 4 (a) Plot of the experimentally observed critical expansion pressure Pc normalized by PCav against RE/Gc. The black line represents the point at which fracture is predicted to occur. (b) Plot showing the comparison between Gc measured with notch tests by Barney et al.16 and measured with NIC in this work when RE/Gc ≈ 0.84. | ||
The results presented above indicate that previously developed theory8 was able to predict the expansion mechanism in all cases except for when RE/Gc = 0.02. Expansion under these conditions (RE/Gc = 0.02) was predicted to be a purely elastic cavitation mechanism; however an inelastic cavitation mechanism resulting in damage was observed. This difference is most likely due to the assumption that crack propagation in these cases can be modeled using LEFM; however, cavitation of the void coincides with the onset of extreme blunting at the crack tip.8,37 Kang et al. have provided some modeling of blunted systems and found that distinguishing between purely elastic cavitation and inelastic cavitation where damage occurs at the blunted crack tip is non-trivial.38 In this study, it was only possible through the use of materials with well-defined network structure. This shows that cavitation processes that may appear to be elastic at a macroscopic level can still damage the underlying material structure.
While the results presented above demonstrate that the cavitation to fraction transition can be readily tuned by altering Gc/E relative to the cavity geometry, it is important to discuss the limitations of our findings. First, NIC relies on the needle insertion process to define the initial crack geometry. This process damages the material and can often lead to crack morphologies more complex than those reported here.39 Further investigation into what causes more complex crack morphologies during puncture and how that impacts the NIC response is of interest in the future. Second, NIC is a technique where the expansion mechanism relates to both Gc/E and γ/E; however, this work only operates in the limit where γ/E is negligible. The quantitative impact of interfacial energies on the transition from cavitation to fracture remains an open question where further experimental data would provide clarity. Third, while there is a clearly defined theoretical and experimental boundary between fracture and cavitation-initiated fracture mechanisms, no boundaries are drawn between cavitation-initiated fracture, purely elastic cavitation, and inelastic cavitation. Probing these boundaries is of interest in the future and will likely require consideration of further experimental variables, such as the amount of compressible air contained in the pressure system.8,40 Finally, while it was shown that some structural damage must occur to accommodate the deformations observed when RE/Gc = 0.02, the way in which this nonlinear damage proceeds is not addressed by this work.
5 Conclusions
Recent improvements in needle-induced cavitation and a quantitative link between network structure and the elastic and fracture properties of a set of model end-linked PEG gels were exploited to experimentally connect cavitation and fracture to molecular scale damage. These results indicated that damage may still occur when a macroscopically smooth cavitation event is observed. It was also experimentally confirmed that measurements of fracture energy from NIC measurements agreed with those from notch tests.Conflicts of interest
The authors declare no conflicts of interest.Acknowledgements
The authors acknowledge funding support from the Office of Naval Research (ONR grant number N00014-17-1-2056). The authors would also like to thank Professor Robert A. Riggleman for helpful discussions about estimating the maximum attainable stretch in our networks.References
- C. W. Barney, C. E. Dougan, K. R. Mcleod, A. Kazemi-moridani, Y. Zheng, Z. Ye, S. Tiwari, I. Sacligil, R. A. Riggleman, S. Cai, J.-H. Lee, S. R. Peyton, G. N. Tew and A. J. Crosby, Proc. Natl. Acad. Sci. U. S. A., 2020, 117, 9157–9165 CrossRef CAS PubMed.
- J. A. Zimberlin, N. Sanabria-DeLong, G. N. Tew and A. J. Crosby, Soft Matter, 2007, 3, 763 RSC.
- J. A. Zimberlin, J. J. McManus and A. J. Crosby, Soft Matter, 2010, 6, 3632 RSC.
- J. Cui, C. H. Lee, A. Delbos, J. J. McManus and A. J. Crosby, Soft Matter, 2011, 7, 7827 RSC.
- L. E. Jansen, N. P. Birch, J. D. Schiffman, A. J. Crosby and S. R. Peyton, J. Mech. Behav. Biomed. Mater., 2015, 50, 299–307 CrossRef PubMed.
- C. W. Barney, Y. Zheng, S. Wu, S. Cai and A. J. Crosby, Soft Matter, 2019, 15, 7390–7397 RSC.
- S. Kundu and A. J. Crosby, Soft Matter, 2009, 5, 3963 RSC.
- S. B. Hutchens, S. Fakhouri and A. J. Crosby, Soft Matter, 2016, 12, 2557–2566 RSC.
- S. Raayai-Ardakani, D. R. Earl and T. Cohen, Soft Matter, 2019, 4999–5005 RSC.
- C. W. Barney, C. Chen and A. J. Crosby, Soft Matter, 2021, 17, 5574–5580 RSC.
- A. N. Gent and P. B. Lindley, Proc. R. Soc. London, Ser. A, 1959, 249, 195–205 Search PubMed.
- A. N. Gent and D.-a Tompkins, Rubber Chem. Technol., 1970, 43, 873–877 CrossRef.
- S. B. Hutchens and A. J. Crosby, Soft Matter, 2014, 10, 3679–3684 RSC.
- S. Raayai-Ardakani, Z. Chen, D. R. Earl and T. Cohen, Soft Matter, 2018, 15, 381–392 RSC.
- A. A. Griffith, Philos. Trans. R. Soc., A, 1921, 221, 163–198 Search PubMed.
- C. W. Barney, Z. Ye, I. Sacligil, K. R. Mcleod, H. Zhang, G. N. Tew, R. A. Riggleman and A. J. Crosby, Proc. Natl. Acad. Sci. U. S. A., 2022, 119, 1–6 CrossRef PubMed.
- C.-Y. Hui, A. Jagota, S. J. Bennison and J. D. Londono, Proc. R. Soc. London, Ser. A, 2003, 459, 1489–1516 CrossRef.
- S. Seiffert, Polym. Chem., 2017, 3, 4472–4487 RSC.
- J. Cui, M. A. Lackey, G. N. Tew and A. J. Crosby, Macromolecules, 2012, 45, 6104–6110 CrossRef CAS.
- E. M. Saffer, M. A. Lackey, D. M. Griffin, S. Kishore, G. N. Tew and S. R. Bhatia, Soft Matter, 2014, 10, 1905 RSC.
- C. Creton and M. Ciccotti, Rep. Prog. Phys., 2016, 79, 046601 CrossRef PubMed.
- A. J. Crosby, K. R. Shull, H. Lakrout and C. Creton, J. Appl. Phys., 2000, 88, 2956–2966 CrossRef CAS.
- H. Lakrout, P. Sergot and C. Creton, J. Adhes., 1999, 69, 307–359 CrossRef CAS.
- Y. Kurosawa, K. Kato, S. Saito, M. Kubo, T. Uzuka, Y. Fujii and H. Takahashi, Conf. Proc. IEEE Eng. Med. Biol. Soc., 2009, 7224–7227 CAS.
- M. Malkoch, R. Vestberg, N. Gupta, L. Mespouille, P. Dubois, A. F. Mason, J. L. Hedrick, Q. Liao, C. W. Frank, K. Kingsbury and C. J. Hawker, Chem. Commun., 2006, 2774–2776 RSC.
- P. J. Flory, Chem. Rev., 1944, 35, 51–75 CrossRef CAS.
- S. Lin-Gibson, R. L. Jones, N. R. Washburn and F. Horkay, Macromolecules, 2005, 38, 2897–2902 CrossRef CAS.
- T. Sakai, T. Matsunaga, Y. Yamamoto, C. Ito, R. Yoshida, S. Suzuki, N. Sasaki, M. Shibayama and U.-I. Chung, Macromolecules, 2008, 41, 5379–5384 CrossRef CAS.
- K. Kawamoto, M. Zhong, R. Wang, B. D. Olsen and J. A. Johnson, Macromolecules, 2015, 48, 8980–8988 CrossRef CAS.
- R. Wang, A. Alexander-Katz, J. A. Johnson and B. D. Olsen, Phys. Rev. Lett., 2016, 116, 1–5 Search PubMed.
- M. Zhong, R. Wang, K. Kawamoto, B. D. Olsen and J. A. Johnson, Science, 2016, 353, 1264–1268 CrossRef CAS PubMed.
- C. Yang, T. Yin and Z. Suo, J. Mech. Phys. Solids, 2019, 131, 43–55 CrossRef CAS.
- S. P. Obukhov, M. Rubinstein and R. H. Colby, Macromolecules, 1994, 27, 3191–3198 CrossRef CAS.
- G. J. Lake and A. G. Thomas, Proc. R. Soc. London, Ser. A, 1967, 300, 108–119 CAS.
- J. Y. Kim, Z. Liu, B. M. Weon, T. Cohen, C.-Y. Hui, E. R. Dufresne and R. W. Style, Sci. Adv., 2020, 6, 1–7 Search PubMed.
- Y. Akagi, T. Katashima, H. Sakurai, U. I. Chung and T. Sakai, RSC Adv., 2013, 3, 13251–13258 RSC.
- Z. Song and S. Cai, Extreme Mech. Lett., 2022, 101673 CrossRef.
- J. Kang, C. Wang and S. Cai, Soft Matter, 2017, 13, 6372–6376 RSC.
- W.-c Lin, K. J. Otim, J. L. Lenhart, P. J. Cole and K. R. Shull, J. Mater. Res., 2009, 24, 957–965 CrossRef CAS.
- A. Delbos, J. Cui, S. Fakhouri and A. J. Crosby, Soft Matter, 2012, 8, 8204 RSC.
Footnotes |
| † Electronic supplementary information (ESI) available. See DOI: https://doi.org/10.1039/d2sm00400c |
| ‡ Present Address: Department of Mechanical Engineering and Department of Chemical Engineering, University of California, Santa Barbara, CA 93106. |
| This journal is © The Royal Society of Chemistry 2022 |