 Open Access Article
Photo-chemically induced polycondensation of a pure phenolic resin for additive manufacturing†
Raffael
Wolff
 a,
Katharina
Ehrmann
 a,
Patrick
Knaack
 a,
Konstanze
Seidler
 b,
Christian
Gorsche
 b,
Thomas
Koch
c,
Jürgen
Stampfl
 c and
Robert
Liska
 *a
*a
aInstitute of Applied Synthetic Chemistry, Technische Universität Wien, Getreidemarkt 9/163 MC, 1060 Vienna, Austria. E-mail: robert.liska@tuwien.ac.at
bCubicure GmbH, Gutheil-Schodergasse 17, Tech Park Vienna, 1230 Vienna, Austria
cInstitute of Materials Science and Technology, Technische Universität Wien, Getreidemarkt 9/308, 1060 Vienna, Austria
First published on 5th January 2022
Abstract
Bakelite© or phenoplasts are considered the first synthetic polymers in the world. These resins, produced by polycondensation, have always been known for their chemical resistance, excellent flame resistance and thermal stability. Originally, pressure and temperature are required for processing and limited the production of phenoplasts to compression and injection molding. However, with the invention of lithography and 3D printing, new desirable processing possibilities have emerged. Previous work in the area of additive manufacturing of phenoplasts has focused on thin-layer photoresists or parts that can only be printed using other polymers as a matrix. Here we report direct 3D printing of phenoplasts, without binders or matrix polymers, using Hot Lithography, a stereolithography-based 3D printing technology at elevated temperatures. In simultaneous thermal analysis and photo-DSC experiments we investigated suitable conditions for the UV-induced polycondensation of the phenolic resins. Based on these experiments, formulations are presented, which are stable under the selected printing conditions and yet reactive enough for the printing process. Direct 3D printing with Hot Lithography and post-curing gave bubble-free specimens, thus a simple production of complicated structures could be achieved without the conventional complex injection molding and more importantly the first bulk polycondensation process using this technique.
Introduction
Phenolic resins are considered the oldest industrially produced polymer in the world. Baekeland's invention in 1907 marked the beginning of the success story of industrial plastics, which have been indispensable to date and have shaped an entire age.1 Therefore, Baekeland's polymer was designated a National Historic Chemical Landmark by the American Chemical Society in 1993 in recognition of its importance as the world's first synthetic plastic.2 Phenolic resins are compelling thermosets with promising mechanical and excellent flame-retardant properties. This set of characteristics in combination with the weight reduction compared to metal enables a wide range of applications in electronics, automotive, building, and other industries.3Phenolic resins are produced through polycondensation of phenol and formaldehyde. When working under basic conditions and a phenol![[thin space (1/6-em)]](https://www.rsc.org/images/entities/char_2009.gif) :
:![[thin space (1/6-em)]](https://www.rsc.org/images/entities/char_2009.gif) formaldehyde molar ratio smaller than one, resoles are formed. These resins, which self-condense at elevated temperatures, are characterized by low viscosity at room temperature. The corresponding counterpart, novolaks, are produced under acidic conditions with a phenol
formaldehyde molar ratio smaller than one, resoles are formed. These resins, which self-condense at elevated temperatures, are characterized by low viscosity at room temperature. The corresponding counterpart, novolaks, are produced under acidic conditions with a phenol![[thin space (1/6-em)]](https://www.rsc.org/images/entities/char_2009.gif) :
:![[thin space (1/6-em)]](https://www.rsc.org/images/entities/char_2009.gif) formaldehyde molar ratio greater than one. Novolaks are solids at room temperature and melt between 50 and 120 °C. Hence, they are stable at elevated temperatures and can only be cured through the addition of curing agents (CA).4 Common curing agents include hexamethylenetetramine or paraformaldehyde (PF), which release formaldehyde under heat and thus complete the polycondensation into a fully cured thermoset.5,6 This reaction can be catalyzed with an acid analogously to the production of the novolak (Scheme 1).
formaldehyde molar ratio greater than one. Novolaks are solids at room temperature and melt between 50 and 120 °C. Hence, they are stable at elevated temperatures and can only be cured through the addition of curing agents (CA).4 Common curing agents include hexamethylenetetramine or paraformaldehyde (PF), which release formaldehyde under heat and thus complete the polycondensation into a fully cured thermoset.5,6 This reaction can be catalyzed with an acid analogously to the production of the novolak (Scheme 1).
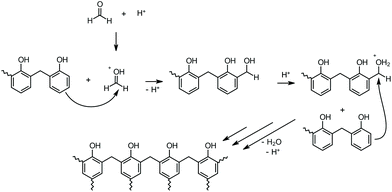 | ||
| Scheme 1 Acid-catalyzed curing of a novolak (adapted from ref. 4). | ||
In summary, to cure a novolak you need a CA, temperature, and preferably an acid. This acid catalyzed curing pathway of phenolic resins has been exploited for the photopolymerization of these systems through photoacidgenerators (PAGs).7,8 PAGs are onium-based salts, which decompose under UV light, releasing a super-acid, which in turn catalyzes the curing reaction as described in Scheme 1.9
As pressure and temperature are required for processing, this limits the processibility of phenoplasts to melt pressing and injection molding techniques. However, the invention of lithography and 3D printing opened up new processing possibilities.10 Previous work in the field of additive manufacturing of phenoplasts focused on thin-layer photoresists or components that can only be printed with other polymers as a matrix.11–15 With Hot Lithography an advanced shaping method was created.16 This technique utilizes a heatable, transparent vat and a heatable printing platform, which allow lithographic processing of resins, which would be highly viscous or even a solid at room temperature. This unique method enables the additive manufacturing of previously unprintable materials at exceptional resolution (<20 μm).17–21
Herein we report the tailored photo-chemically induced polycondensation of a phenolic resin (novolak) for additive manufacturing. The use of PAG-curable novolak resin for Hot Lithography offers the necessary preconditions to print structures from novolaks without an additional polymer serving as matrix. The dependence of the reaction on temperature using different acid labile CAs has been investigated, as well as the stability of the formulations at elevated temperatures. Furthermore, various test specimens were prepared to characterize the thermomechanical and mechanical properties of cured specimens containing different CAs and utilizing different processing methods. This type of processing of novolaks is the first polycondensation for Hot Lithography and is intended to serve as a proof-of-concept for other possible applications of this additive manufacturing method.
Experimental section
Materials
Supraplast 3616 (Novo) was kindly gifted from Süd-West-Chemie GmbH. (p-Octyloxyphenyl)phenyliodonium hexafluoroantimonate (I-Sb; abcr GmbH), acetic anhydride, acetonitrile, diethyl ether, Na2CO3, NaHCO3, n-trioxane, paraformaldehyde, and zinc chloride (all Merck KGaA) were purchased from the respective companies. All reagents and monomers were used without further purification.Synthesis of trioxymethylene-diacetate (TOMDA)
The synthesis of TOMDA was performed according to literature.22n-Trioxane (22.50 g, 250 mmol, 1 eq.) was mixed with freshly distilled acetic anhydride (25.55 g, 250 mmol, 1 eq.) and stirred with ZnCl2 (1.02 g, 7.5 mmol) at 25 °C for 5 h. The crude product was dissolved in diethyl ether and the organic phase was washed with NaHCO3. Subsequent distillation yielded the pure product. Further details can be found in the ESI.†Formulations and specimens preparation
Resin formulations with Novo (preheated at 80 °C for processability) and 15 or 20 wt% of CA as specified were prepared. All formulations were mixed with 5 wt% I-Sb as PAG. The formulations were placed in a vacuum oven for at least 0.5 h at 80 °C. For photo-DSC and STA studies the formulations were used directly after mixing. For (thermo)mechanical tests, all formulations were poured into silicone molds (5 × 2 × 40 mm3 for DMTA, ISO527 test specimens 5b dumbbell-shaped with a total length of 35 mm, and a parallel constriction region with dimensions of 2 × 2 × 12 mm3 for tensile tests). The resins were cured with a Intelli-Ray 600 UV-oven with a broadband Hg lamp (600 W; UV-A: 125 mW cm−2; Vis: 125 mW cm−2; ∼280–550 nm). The samples were irradiated at 80 °C for 15 min on each side and afterward polished with sandpaper to ensure uniform geometries.NMR
1H NMR spectra were recorded on a Bruker Avance at 400 MHz; chemical shifts are given in ppm and were referenced to the solvent residual peak (CDCl3).Photo-DSC
Photo-DSC measurements were conducted on a Netzsch DSC 204 F1 with autosampler. I-Sb (5 wt%) was used as a PAG in all polymerizations. All measurements were performed isothermally between 60 and 120 °C under N2 atmosphere. The formulations (11 ± 1 mg) were irradiated twice with filtered UV-light (320–500 nm) via an Exfo OmniCureTM series 2000 broadband Hg lamp under constant N2 flow (20 mL min−1). The light intensity was set to 1.5 W cm−2 at the tip of the light guide corresponding to ∼60 mW cm−2 on the surface of the sample. The heat flow of the polymerization reaction was recorded as a function of time. The times when the maximum of heat evolution was reached (tmax) was used as indicator for the reactivity of a formulation. All measurements were performed in triplicates.Thermal gravimetric and volatility study
A Netzsch Jupiter STA 449 F1 thermal analysis instrument with autosampler was used to conduct combined TGA and DSC experiments, which were used to assess the volatility and thermal stability of the investigated formulations. One set of measurements was performed with a temperature ramp from 25 to 300 °C under N2 atmosphere (10 K min−1), and the second set was conducted isothermally under N2 atmosphere at 90 °C (2 h). All samples were accurately weighed into aluminum DSC pans (10 ± 2 mg) and measured at a constant gas flow rate (40 mL min−1). The mass loss and DSC signal were recorded.Viscosity study
Rheology tests of the mixtures were conducted on a modular compact rheometer (MCR 300, Physica Anton Paar). The viscosity of the formulations was measured at the printing temperature of 80 °C (5 min acclimatization time before measurement) with a PP-25 measuring system (diameter 25 mm). A distance of 100 μm between Peltier plate and stamp plate was set. Measurements were conducted in rotation mode with a constant shear rate of 100 s−1.Hot lithography
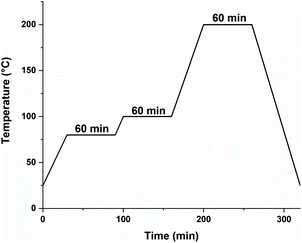
3D-structuring via Hot Lithography was performed on a Caligma 200 UV printer. The Hot Lithography printer setup uses a 375 nm diode laser source. This beam is scanned over a 2-dimensional plane using a galvanometer scanning system. All parts that had direct contact with the formulation were heated to 80 °C; this includes the material vat, the building platform, and the recoating unit. All specimens were printed with a scan speed of 1 m s−1, a energy intensity of 2320 mJ cm−1, and a layer thickness of 50 μm. The laser spot on the surface of the material vat has a diameter of 18 μm. The preparation of the specimens was completed with a post-processing program in an oven (Fig. 1).Void content
The overview to observe macroscopic voids was recorded by a Keyence VHX 6000 optical microscope in panorama mode, the detailed views of the morphology to observe microscopic voids were imaged with a Phillips XL-30 scanning electron microscope or Zeiss AxioImager light microscope.Dynamic mechanical thermal analysis
An Anton Paar MCR 302 device with a CTD 450 oven and an SRF 12 measuring system was used to perform the DMTA measurements. The prepared DMTA samples were tested in torsion mode with a frequency of 1 Hz and a strain of 0.1%. The temperature was increased from −50 to 300 °C with a heating rate of 2 K min−1. The glass transition temperature (Tg) was defined as the temperature at the maximum loss factor (tan![[thin space (1/6-em)]](https://www.rsc.org/images/entities/char_2009.gif) δ).
δ).
Tensile tests
A Zwick Z050 equipped with a 1 kN load cell was used to conduct tensile tests. Five specimens per sample were measured. The specimens were fixed between two clamps and strained with a traverse speed of 5 mm min−1. A stress–strain plot was recorded simultaneously.Results and discussion
Paraformaldehyde-formulations (PF)
The pure resin (Novo) has a melting point of ∼50 °C (according to the supplier) and was first tested for thermal reactivity with and without I-Sb as photoacidgenerator (PAG, Fig. 2). Novo itself is stable up to temperatures around 280 °C before it undergoes thermal degradation. However, PAGs can also thermally dissociate to super-acids. Therefore, an earlier degradation of around 200 °C is observed in the presence of I-Sb. Nevertheless, the starting materials without curing agent (CA) offer sufficient stability for photochemical experiments around 100 °C.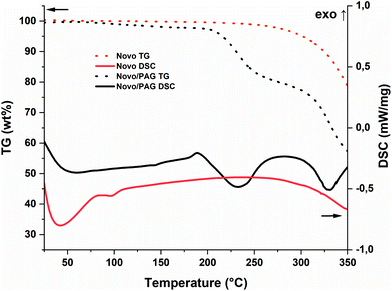 | ||
| Fig. 2 STA of the pure Novo (red; TG: dot; DSC: solid) and Novo/PAG (95/5, w/w, black; TG: dot; DSC: solid). | ||
Paraformaldehyde (PF) is a well-known heterogeneous CA for novolaks. Based on the work of Adabbo et al. a weight content of 15% was chosen.6 5 wt% I-Sb was used as PAG in all formulations. PF usually degrades to formaldehyde when exposed to heat. This happens slowly at room temperature and is fast at temperatures above 120 °C. However, the process can be accelerated by the action of acid and can also be carried out at temperatures below 120 °C (Scheme 2).23 Here, the PAG takes on a dual function in which, on the one hand, it decomposes the CA to formaldehyde after irradiation and, on the other hand, catalyzes the curing of the novolak to the phenoplast.
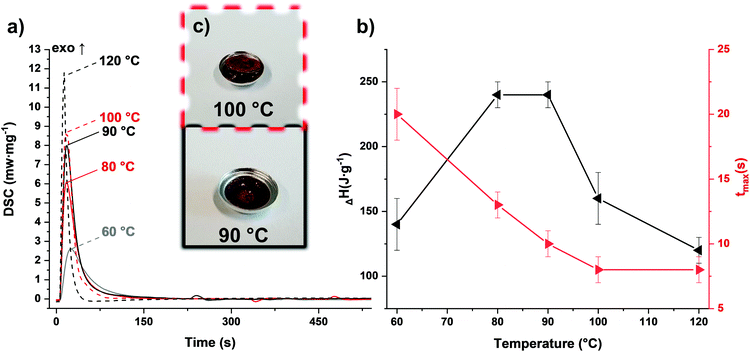
The photopolymerization behavior of the PF formulation was compared at various elevated temperatures via photo-DSC (Fig. 3a and Table S1†). While the reaction was still incomplete at 60 °C, a maximum enthalpy in the range of 80–90 °C could be determined (Fig. 3b). Reduced exothermic behavior was observed in measurements above these temperatures. This can be explained by the reaction mechanism: polycondensation produces one water molecule per polycondensation step. Therefore, stoichiometric amounts of water vapor build up if the reaction temperature exceeds 100 °C. As this is an endothermic process, the measured enthalpy is reduced. This evaporation process leads to bubble formation in the cured samples as the material solidifies (Fig. 3c). However, this could not be observed in the temperature range below the boiling point of water. The speed of the reaction, which was assessed based on the maximum of the curve, is accelerated by higher temperatures, as expected. A significant difference between 100 and 120 °C could not be found with regard to the speed of the reaction. Nevertheless, the speeds obtained are considered fast enough to achieve an applicable system in Hot Lithography, in particular by using a laser instead of a broadband light source. Furthermore, the irradiated samples were investigated for stability and complete reaction by means of simultaneous thermal analysis (STA) utilizing the non-irradiated formulation as a reference (Fig. 4). The selected photoacid can also be thermally cleaved24 and consequently, the reaction can also be started purely by heating. This can be shown by the DSC curve with simultaneous weight loss in the thermogravimetric analysis (TG). In contrast to the pure formulation, the cured sample (90 °C curing temperature) shows no exothermic behavior. Only the further evaporation of water leads to a slightly endothermic peak and weight loss in the range above 100 °C. In summary, sufficient curing and bubble-free samples could be obtained between 80 and 90 °C, while improved reactivity from 100 °C on cannot be utilized due to bubble formation during curing. Furthermore the insolubility of the PF results in a heterogeneous mixture which could lead to errors in the course of 3D printing. Therefore, another homogeneous CA was envisaged.
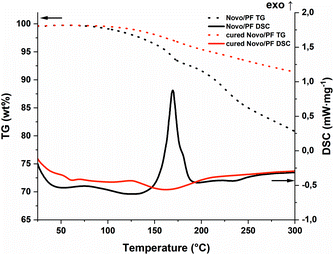 | ||
| Fig. 4 STA of the PF-formulation (black; TG: dot; DSC: solid) and the photo-DSC cured (red; TG: dot; DSC: solid) sample (90 °C). | ||
Trioxymethylene diacetate-formulations (TOMDA)
Poly-(oxymethylene) (POM) derivatives are known to degrade mainly to formaldehyde under certain conditions, especially under acidic conditions.25–27 In the oligomeric range (2–6 formaldehyde units), depending on the chain length, these compounds are liquid, yet non-volatile.28 Therefore, one of these low molecular POMs, trioxymethylene diacetate (TOMDA) was investigated as potential homogeneous CA. It is known to be formed as an intermediate in the cationic polymerization of n-trioxane during the initiation step under cryogenic conditions.29 In addition, Tomiška et al. found that the use of zinc chloride as a catalyst under the equimolar use of n-trioxane and acetic anhydride results in TOMDA as the main product in high yield (Scheme 3a).22The synthesis of TOMDA was performed, in accordance with the literature, successfully in a high yield (>80%, see ESI† for detailed synthetic protocol). The colorless liquid has a boiling point of 135 °C at 3 mbar. The decomposition of TOMDA under the influence of the photoacid should lead to the formation of three parts formaldehyde and two parts acetic acid, the second of which should further catalyze the acid-induced polymerization (Scheme 3b).
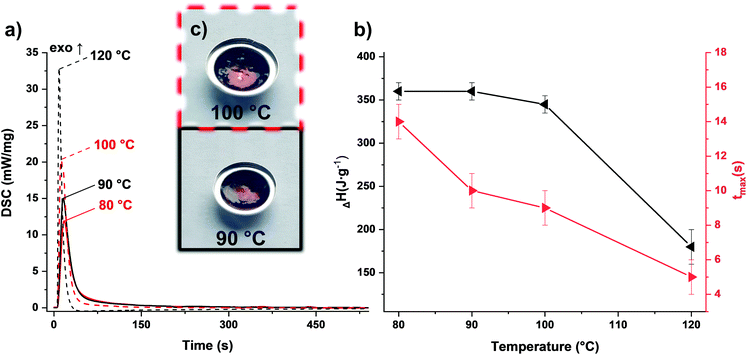
To match the formaldehyde equivalents in the previous formulation, 20 wt% TOMDA was used as CA. In contrast to the PF formulation, significantly higher energy values were obtained in the photo-DSC (Fig. 5a and b and Table S1†). This is an indicator for higher conversion of the reaction and therefore higher cross-linking density. In addition to the homogeneity of the formulation now achieved, the higher enthalpy values could also result from the acetic acid additionally introduced as a catalyst. Furthermore, the drop in energy values due to the evaporation of water was only observed significantly at higher temperatures. Also, considerably less bubble formation was observed in the samples obtained at 100 °C compared to the PF formulation (Fig. 5c). However, this can also be attributed to the acetic acid produced in the system, which together with water, forms an zeotropic mixture that starts to boil at higher temperatures than the boiling point of water, depending on the mixing ratio.30 Interestingly, the reaction speed indicated by the tmax, does not differ from the previous formulation. Comparing the cured sample at 90 °C with the pure formulation in the STA, the previous trend is valid here as well (Fig. 6). The pure formulation has an exothermic peak around 190 °C, whereas the cured sample exhibit a significant weight loss and an endothermic peak around 125 °C due to the evaporation of water and acetic acid. In contrast, the PF formulation had an exothermic peak at about 170 °C. This early maximum can be explained by the lower stability of the PF. Depending on the molecular weight, PF melts in the range of 120–170 °C.23 As soon as it changes from the solid to the liquid state, the pure novolak can already initiate the decomposition of the PF by acting as an acid. The capping of the hydroxyl end groups through the esterification of the short oxymethylene chain results in greater stability.31 Therefore, the mixture with TOMDA reacts at a higher temperature.
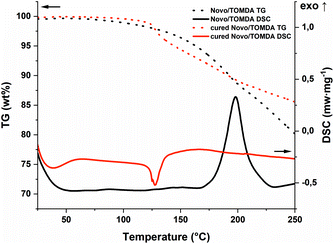 | ||
| Fig. 6 STA of the TOMDA-formulation (black; TG: dot; DSC: solid) and the photo-DSC cured (red; TG: dot; DSC: solid) sample (90 °C). | ||
Overall both formulations showed sufficient reactivity in the photoinduced polycondensation and bubble-free sample formation at a temperature of 80–90 °C. Hence, they were both tested further in 3D printing experiments via Hot Lithography.
3D printing of the formulations via hot lithography
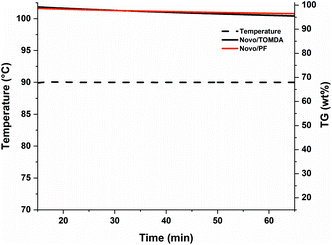
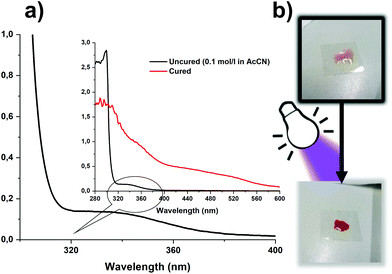
In contrast to conventional stereolithographic 3D printers, which are limited to low viscous formulations, Hot Lithography can process highly viscous resins with up to 20 Pa s. The formulations discussed in this work exhibit viscosities between 2 Pa s (PF) and 150 mPa s (TOMDA) at the selected printing temperature of 80 °C. Another aspect that should be considered during the printing process is the thermal stability of the CAs. Polymerization would be more difficult or partially incomplete if formulation components evaporated due to exposure to elevated temperatures over extended time periods. Therefore, the formulations were exposed to 90 °C and constant nitrogen flow (no lid on the crucibles) for 1 h and the weight loss was monitored by thermal gravimetric analysis (TGA, Fig. 7). The temperature was set to 90 °C, as the reactivity was the highest at this level without bubble formations during curing.While some weight loss in the low wt% range could be observed for both formulations, it is negligible for the time periods relevant for the 3D printing process. The weight loss is slightly higher for the TOMDA formulation due to the higher CA content (20 wt% TOMDA vs. 15 wt% PF, to obtain equivalent formaldehyde content). After the experiment the treated formulations were still curable. In this respect, both formulations were sufficiently thermally stable for use in Hot Lithography. The I-Sb has an absorption maximum at 227 nm and a tail-out range up to 360 nm wavelength.32 This spectrum is not in the range of the laser used in the 3D printer (375 nm). However, initial exposure tests have already yielded positive results. Due to the coloring of the material used, a self-sensitizing effect was assumed. Therefore, a UV-Vis spectrum was taken of the pure resin as well as a cured thin film sample (Fig. 8a).
The spectrum for the pure novolak shows an absorption up to 400 nm. As a result of the hardening of the thermoset, a bathochromic shift of the material occurs. Due to the formation of a distinct conjugated π-system, the obtained samples appear bright red (Fig. 8b). This leads to a strengthening of the presumption of a self-sensitizing system, in which the I-Sb is decomposed into a super-acid by the absorption of the resin, is strengthened. In the course of further work, both formulations were used to produce successfully tensile and DMTA test specimens using molds together with a UV oven as well as Hot Lithography. Here it must be mentioned that the irradiation conditions of the utilized curing oven provided higher intensities than the conditions for photo-DSC and Hot Lithography, as the light sources for photo-DSC had to be coupled into light guides and Hot Lithography is based on a Laser. Furthermore, to illustrate 3D printing, an object was digitally designed (Fig. 9a) and printed in the size 2.5 cm × 1.5 cm with the TOMDA formulation (Fig. 9b). Already without highly specific process optimization the results are very promising. The overall shape of the brick is already satisfactory and the details of the edge region (see ESI Fig. S2†) as well as the flat regions of the mechanical specimen show a dense, well-connected surface in SEM images respectively microscopic images. For the sake of comparability and achieving the most complete curing possible, all samples were subjected to a thermal post-treatment program (Fig. 1). Post-curing did not result in any significant deformation of the geometry, which was demonstrated by microscopy (see ESI Fig. S2†). No thermally induced delamination could be found.
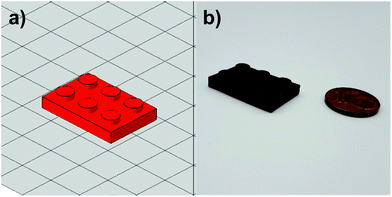 | ||
| Fig. 9 (a) Designed object as CAD model. (b) 3D printed object of TOMDA formulation via Hot Lithography. | ||
Mechanical testing
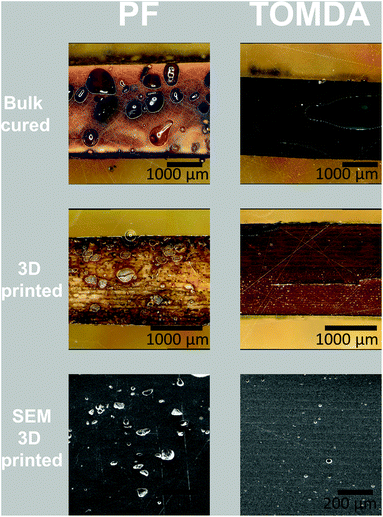
The thermally post-cured samples (3D printed and bulk cured) were characterized by means of tensile tests as well as DMTA measurements and compared with each other based on their processing method. The tensile tests surprisingly show an increase in both elongation at break (Fig. 11a and Fig. S3†) and tensile strength (Fig. 11b) for 3D printed specimens. The higher tensile strength generally indicates a higher cross-linking density in the thermoset and thus also a higher conversion during polymerization. However, this normally reduces the elongation at break. A plausible explanation for this effect is that the bulk-produced samples have no possibility of releasing water into the environment during polymerization, as the light source illuminates the material from above and the water is trapped in the sample due to the mold. Therefore, voids are created in the bulk material through water confinement even when produced below 100 °C. In contrast to this, due to the layer-by-layer approach in Hot Lithography allows the release of water into the remaining resin in the vat, which evaporates over the time of printing. Consequently, additive manufacturing of the samples enables a nearly void-free processing of the materials. This is clearly visible in the microscopy images (Fig. 10). The PF bulk cured samples have more voids than the TOMDA samples. The 3D printed samples exhibit few to no voids. Ultimately, this results in higher tensile strength and elongation at break for the 3D printed parts. Comparing the two formulations with each other it is evident that the TOMDA-prepared specimens show significantly better values in tensile strength and elongation at break. Together with the increased enthalpy values from the photo-DSC, this indicates a better cross-linking density and a higher conversion, as noted above. A possible explanation, besides the increased acidity due to the decomposition of the CA, is the homogeneity of the formulation. Additionally, the slightly lower viscosity and the resulting mobility of the chains could ensure a higher reaction conversion.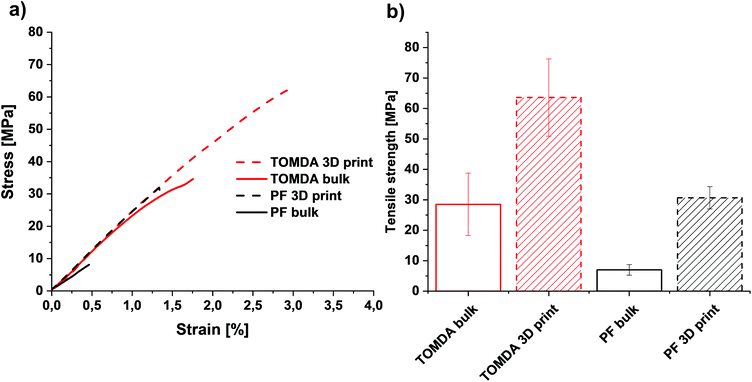 | ||
| Fig. 11 (a) Stress–strain diagram of bulk cured and 3D printed parts. (b) Tensile strength of bulk cured and 3D printed parts. | ||
The thermomechanical properties were determined using DMTA. No difference was found between the 3D printed and the bulk-cured samples. However, a significant difference was found between the two different CAs. While the sample of the homogeneous mixture of TOMDA has a glass transition temperature (Tg) of about 95 °C, that of the PF sample has one of about 140 °C (Fig. 12a). Furthermore, an increased rubber plateau was found for the PF sample (Fig. 12b). According to the literature, this indicates a higher network density.33,34 This would also explain the higher Tg, as it is significantly influenced by the network density.35 Moreover, alcohols and acetates are known to act as plasticizers for thermosets in the production process. Their presence interrupts the hydrogen bonding interactions, which, in addition to the covalent network, contribute to the stability of phenoplasts, so that the Tg decreases further.36–39 This could be due to the remaining acetate residues resulting from the decomposition of the CA to acetic acid and formaldehyde. The increased network density of the PF samples contradicts the previous results regarding tensile strength, but this can be explained by the more homogeneous network in the TOMDA samples. Due to the better regularity, the low network density can be compensated in comparison to the heterogeneous PF sample. The heterogeneous mixture of the PF formulation can lead to a very high cross-linking density in some parts of the samples, but a very low cross-linking density in other areas. This inhomogeneity is also reflected in the broad peaks in the loss modulus and would explain the high Tg and the higher rubber plateau, with simultaneously reduced mechanical values.
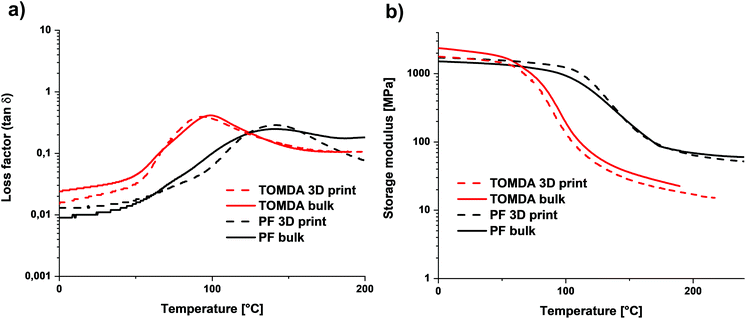 | ||
| Fig. 12 (a) Loss factor of bulk cured and 3D printed parts. (b) Storage modulus G′ curves of bulk cured and 3D printed parts. | ||
Conclusion
For the first time, pure Bakelite© could be 3D printed via a novolak using light-induced polycondensation with a photoacidgenerator. The custom-made curing agent TOMDA shows better homogeneity and reactivity compared to PF, which is often used in conventional applications. Additionally, it could be shown that the relevant formulation parameters viscosity, stability and reactivity are adequate for Hot Lithography. The light-induced curing at elevated temperatures leads to sufficient conversion for form stability so that 3D printed mechanical test specimens could be printed successfully, which were then post-cured. Surprisingly, the 3D printed objects exhibit improved mechanical properties compared to the bulk-produced ones in this particular case, which could be explained by the lack of void-formation during layer-by-layer additive manufacturing as opposed to bulk curing. Furthermore, formulation homogeneity of TOMDA is believed to not only boost the reactivity, but also leads to better values in the mechanics compared to the PF. In summary, the tailored system presented here, in combination with Hot Lithography, unlocks the possibility to process one of the oldest synthetic polymers in the world with one of the most recent processing technologies and thus the possibility of using this type of polycondensation for the production of 3D printable flame retardant materials in the future.Conflicts of interest
There are no conflicts to declare.Acknowledgements
We would like to thank Süd-West-Chemie GmbH for the materials provided.Funding from the Austrian Research Agency (FFG) within the project “3D HiPerPolymers” (number 874202) is gratefully acknowledged.
References
- A. Knop and W. Scheib, Chemistry and Application of Phenolic Resins, Springer-Verlag, Berlin, 1979 Search PubMed.
- American Chemical Society National Historic Chemical Landmarks, “Bakelite: First Synthetic Plastic”, can be found under https://www.acs.org/content/acs/en/education/whatischemistry/landmarks/bakelite.html, 1993.
- L. Pilato, Phenolic Resins: A Century of Progress, Springer-Verlag, 2010 Search PubMed.
- W. Hesse and J. Lang, in Ullmann's Encycl. Ind. Chem, Wiley-VCH Verlag GmbH & Co. KGaA, Weinheim, Germany, 2011 Search PubMed.
- M. I. Aranguren, J. Borrajo and R. J. J. Williams, J. Polym. Sci., Polym. Chem. Ed., 1982, 20, 311–318, DOI:10.1002/POL.1982.170200205.
- H. E. Adabbo and R. J. J. Williams, J. Appl. Polym. Sci., 1982, 27, 893–901, DOI:10.1002/app.1982.070270309.
- Y. Saito, K. Mizoguchi and M. Ueda, J. Photopolym. Sci. Technol., 2008, 21, 161–164, DOI:10.2494/PHOTOPOLYMER.21.161.
- E. Reichmanis, Polym. Mater.: Sci. Eng., 1992, 66, 36–37, DOI:10.1021/BK-1994-0537.CH001.
- W. A. Green, Industrial Photoinitiators: A Technical Guide, CRC Press, 2011 Search PubMed.
- S. C. Ligon, R. Liska, J. Stampfl, M. Gurr and R. Mülhaupt, Chem. Rev., 2017, 117, 10212–10290, DOI:10.1021/ACS.CHEMREV.7B00074.
- A. Ovsianikov, A. Ostendorf and B. N. Chichkov, Appl. Surf. Sci., 2007, 253, 6599–6602, DOI:10.1016/J.APSUSC.2007.01.058.
- S. Gaidukovs, A. Medvids, P. Onufrijevs and L. Grase, eXPRESS Polym. Lett., 2018, 12, 918–929, DOI:10.3144/EXPRESSPOLYMLETT.2018.78.
- A. del Campo and C. Greiner, J. Micromech. Microeng., 2007, 17, R81, DOI:10.1088/0960-1317/17/6/R01.
- S. S. Nechausov, M. Y. Yablokova, V. V. Avdeev, B. A. Bulgakov and D. I. Kalugin, Photocurable Polymer Composition for UV Photopolymerization and Method of Making a Hardened Product Therefrom, 2019, p. RU2699556 Search PubMed.
- D. R. McKean, S. A. MacDonald, N. J. Clecak and C. G. Willson, Adv. Resist Technol. Process. V, 1988, 0920, 60, DOI:10.1117/12.968302.
- M. Pfaffinger, Laser Tech. J., 2018, 15, 45–47, DOI:10.1002/LATJ.201800024.
- G. Peer, P. Dorfinger, T. Koch, J. Stampfl, C. Gorsche and R. Liska, Macromolecules, 2018, 51, 9344–9353, DOI:10.1021/ACS.MACROMOL.8B01991.
- N. Klikovits, L. Sinawehl, P. Knaack, T. Koch, J. Stampfl, C. Gorsche and R. Liska, ACS Macro Lett., 2020, 9, 546–551, DOI:10.1021/ACSMACROLETT.0C00055.
- C. Dall'Argine, A. Hochwallner, N. Klikovits, R. Liska, J. Stampf and M. Sangermano, Macromol. Mater. Eng., 2020, 305, 2000325, DOI:10.1002/MAME.202000325.
- B. Steyrer, B. Busetti, G. Harakály, R. Liska and J. Stampfl, Addit. Manuf., 2018, 21, 209–214, DOI:10.1016/J.ADDMA.2018.03.013.
- Y. Mete, P. Knaack and R. Liska, Polym. Int., 2021 DOI:10.1002/PI.6326.
- J. Tomiška and E. Spousta, Angew. Chem., Int. Ed. Engl., 1962, 1, 211–211, DOI:10.1002/anie.196202112.
- A. W. Franz, H. Kronemayer, D. Pfeiffer, R. D. Pilz, G. Reuss, W. Disteldorf, A. O. Gamer and A. Hilt, Ullmann's Encycl. Ind. Chem., 2016, 1–34, DOI:10.1002/14356007.a11_619.pub2.
- J. V. Crivello, in Initiat. — Poly-Reactions — Opt. Act., Springer, Berlin, Heidelberg, 2005, pp. 1–48 Search PubMed.
- S. Lüftl, V. M. Archodoulaki and S. Seidler, Polym. Degrad. Stab., 2006, 91, 464–471, DOI:10.1016/J.POLYMDEGRADSTAB.2005.01.029.
- V. M. Archodoulaki, S. Lüftl and S. Seidler, Polym. Degrad. Stab., 2004, 86, 75–83, DOI:10.1016/j.polymdegradstab.2004.03.011.
- W. Kern, H. Cherdron and V. Jaacks, Angew. Chem., 1961, 73, 177–186, DOI:10.1002/ANGE.19610730602.
- H. Staudinger, R. Singer, H. Johner, M. Lüthy, W. K. D. Russidis and O. Schweitzer, Justus Liebigs Ann. Chem., 1929, 474, 145–275, DOI:10.1002/JLAC.19294740105.
- M. Hoffmann, C. Bizzarri, W. Leitner and T. E. Müller, Catal. Sci. Technol., 2018, 8, 5594–5603, 10.1039/C8CY01691G.
- T. Ito and F. Yoshida, J. Chem. Eng. Data, 1963, 8, 315–320, DOI:10.1021/je60018a012.
- J. Masamoto and K. Matsuzaki, Polym.-Plast. Technol. Eng., 2006, 33, 221–232, DOI:10.1080/03602559408015297.
- N. Klikovits, P. Knaack, D. Bomze, I. Krossing and R. Liska, Polym. Chem., 2017, 8, 4414–4421, 10.1039/C7PY00855D.
- I. M. Ward and J. Sweeney, Mechanical Properties of Solid Polymers, John Wiley And Sons, Chichester, 3rd edn, 2012 Search PubMed.
- K. S. Santhosh Kumar, C. P. Reghunadhan Nair, T. S. Radhakrishnan and K. N. Ninan, Eur. Polym. J., 2007, 43, 2504–2514, DOI:10.1016/j.eurpolymj.2007.03.028.
- J. D. Monk, J. B. Haskins, C. W. Bauschlicher and J. W. Lawson, Polymer, 2015, 62, 39–49, DOI:10.1016/j.polymer.2015.02.003.
- J. P. Patel, S. Deshmukh, C. Zhao, O. Wamuo, S. L. Hsu, A. B. Schoch, S. A. Carleen and D. Matsumoto, J. Polym. Sci., Part B: Polym. Phys., 2017, 55, 206–213, DOI:10.1002/POLB.24261.
- J. P. Patel, C. X. Zhao, S. Deshmukh, G. X. Zou, O. Wamuo, S. L. Hsu, A. B. Schoch, S. A. Carleen and D. Matsumoto, Polymer, 2016, 107, 12–18, DOI:10.1016/J.POLYMER.2016.11.005.
- J. K. Sears and J. R. Darby, The Technology of Plasticizers, John Wiley And Sons, New York, 1982 Search PubMed.
- T. Cairns and G. Eglinton, Nature, 1962, 196, 535–537, DOI:10.1038/196535a0.
Footnote |
| † Electronic supplementary information (ESI) available. See DOI: 10.1039/d1py01665b |
| This journal is © The Royal Society of Chemistry 2022 |

