
An integrated microfluidic electrochemical assay for cervical cancer detection at point-of-care testing†
Fatemeh
Keyvani‡
a,
Nandini
Debnath‡
a,
Mahmoud
Ayman Saleh
 ab and
Mahla
Poudineh
*a
ab and
Mahla
Poudineh
*a
aDepartment of Electrical and Computer Engineering, Faculty of Engineering, University of Waterloo, Waterloo, ON N2L 3G1, Canada. E-mail: mahla.poudineh@uwaterloo.ca
bEnergy Materials Laboratory, School of Sciences and Engineering, The American University in Cairo, New Cairo 11835, Egypt
First published on 4th May 2022
Abstract
Cervical cancer (CC) is a major health care problem in low- and middle-income countries, necessitating the development of low-cost and easy-to-use assays for CC detection at point-of-care (POC) settings. An integrated microfluidic electrochemical assay for CC detection, named IMEAC, is presented that has the potential for identifying CC circulating DNA in whole blood samples. The IMEAC consists of two main modules: a plasma separator device that isolates plasma from whole blood with high purity and without the need for any external forces connected to a graphene oxide-based electrochemical biosensor that uses specific probe molecules for the detection of CC circulating DNA molecules. We fully characterize the performance of the individual modules and show that the integrated assay can be utilized for target DNA detection in whole blood samples, thus potentially transforming CC detection and screening at remote locations.
 Mahla Poudineh | Mahla Poudineh is an Assistant Professor and Director of the IDEATION Lab in the Department of Electrical and Computer Engineering at the University of Waterloo. She received her Ph.D. degree in Electrical Engineering from the University of Toronto in 2016. Prior to joining Waterloo, Mahla completed postdoctoral training at the University of Toronto, Department of Pharmaceutical Science and Stanford University, School of Medicine in 2018 and 2019, respectively. She received her B.Sc. and M.Sc. in Electrical Engineering, both from the University of Tehran, Iran in 2010 and 2012, respectively. Her research interests include developing bio-sensing approaches for therapeutic and diagnostic purposes and translating biomedical devices to the clinic. |
Introduction
Cervical cancer (CC) is a global problem, standing as the fourth most common cancer among women worldwide.1Over half a million women developed CC and over a quarter of million women died from CC globally in 2018.1 The CC burden is substantially higher in low- and middle-income countries (LMIC), with nine in ten CC-associated deaths occurring in LMIC.2 CC, if detected early, is highly treatable. CC screening and treatment at early stages cost less than $500 USD with 90% survivability, whereas treating invasive CC costs about $5000 USD with only 15% survivability.3,4 Limited access to complex laboratory equipment and professionals for sample processing and analysis in LMIC considerably contributes to the higher CC burden in these regions.2,5,6The etiological cause of CC is persistent infection with high-risk strains of human papilloma virus (hr-HPV) where long-lasting infection with hr-HPV16 and 18 contributes to most CC.7 The cancerous nature of hr-HPV16 and 18 is attributed to two of its genes, E6 and E7 genes, encoding E6 and E7 oncoproteins. Lasting infection with hr-HPV16 and 18 leads to the integration of E6 and E7 genes into the host genome, leading to the progression of the cervical cells to cancerous lesions.8 Current common practices in developed countries are Pap smear, histological test performed by gynecologists to check cell abnormalities, and polymerase chain reaction (PCR) test, looking at the presence of hr-HPV in the cervical samples.9,10 Pap smear tests are not easily accessible in LMIC, and hr-HPV PCR tests cannot predict the likelihood of developing CC.9,10
Recent studies suggest that hr-HPV circulating DNA (cDNA) is found in blood plasma and can act as a marker for CC prognosis.9–12 In addition, hr-HPV cDNA levels in blood posttreatment might indicate cancer recurrence.13 The hr-HPV cDNA dissemination mechanism is not yet completely understood14 and it is suggested that dying cancer cells might shed the hr-HPV cDNA into the bloodstream.15
The detection and analysis of cDNA in whole blood is an appealing approach for non-invasive cancer diagnosis and monitoring. Electrochemical-based assays for DNA detection have already been demonstrated to be promising alternatives for the conventional PCR test and clinical sample analysis.16–18 These chip-based assays offer several advantages, including rapid response, easy automation, high sensitivity, amenability to multiplexed detection, capability of integration with sample processing, and most importantly not-relying on costly laboratory instrumentation, enabling their usage in LMIC. Electrochemical techniques have been employed for hr-HPV DNA detection in cervical samples. A gold-coated carbon-based screen printed genosensor was developed for the detection of hr-HPV18 in spiked cervical samples.19 To recognize hr-HPV18 DNA, a complementary single stranded DNA (cssDNA) was used as the probe. In another work, modified screen-printed carbon electrodes (SPCEs) with a peptide nucleic acid capture probe were employed to detect amplified hr-HPV16 DNA in HPV16-positive cell culture samples.20 The previously reported electrochemical biosensors measured the hr-HPV DNA in cervical samples, and to the best of our knowledge, no electrochemical assay has been yet developed to detect hr-HPV cDNA in extracted plasma samples.
The existence of a large number of red blood cells (RBCs) and white blood cells (WBCs) in whole blood samples significantly interferes with the biosensor performance and limits its use in potential clinical applications.21 For the successful detection of biomolecules from whole blood, it is very crucial to separate plasma. On-chip sample preparation methods have taken advantage of microfluidic devices containing networks of tiny channels and chambers through which minute amounts of reagents move. The unique advantages of microfluidic systems which make them a superior candidate for portable POC diagnostic devices are the capability of measuring from small volumes of fluidics and integrating with downstream analysis. Ideally, sample processing and target biomarker detection steps should be carried out using a single miniaturized platform for the POC setting.
The recent advancement in microfluidics allows the performance of plasma separation from whole blood without the need for any external active forces.22 Passive plasma separation devices have been already employed for various POC applications, such as blood glucose,21 nucleic acid,23 and different biomarker detection.24,25 Several studies used the concept of capillary self-driven flow in a microchannel for the separation of plasma from the main blood stream.22,26–29 Parallel micro-capillaries were integrated with plasma collection microchannels and a filter membrane at the inlet to fabricate a plasma separation device that can collect 12 μL of plasma from 100 μL of whole blood in less than 10 min.30 A few studies employed the concept of combining capillary flow with sedimentation for passive plasma filtration22 while others used anti-RBC coating or vacuum pressure to withdraw plasma.23 An integration of a capillary flow driven microfluidic device for plasma isolation and depletion of background blood cells with downstream analysis, such as the electrochemical detection of cDNA, has the potential to transform the current CC diagnosis in LMIC locations into a POC setting.
Here we present an integrated microfluidic electrochemical assay for CC diagnosis, named IMEAC, that can be automated to detect hr-HPV16 cDNA from extracted plasma samples. Our IMEAC combines two main modules to achieve hr-HPV cDNA detection (Fig. 1): a novel passive plasma separator (PPS) microfluidic device that isolates plasma without the need for applying an external force, and a graphene oxide (GO) based-electrochemical biosensor that employs a cssDNA probe for specific hr-HPV16 cDNA recognition. The PPS device can collect approximately 22 μL of plasma from 160 μL of whole blood without any dilution in 10 minutes. The main advantage of our PPS device is that the separation is automatic, and the plasma reaches the outlet without the application of any pressure force due to the capillary action.27,31 The electrochemical biosensor integrates low-cost SPCEs where drop-casting of GO is employed for cssDNA probe immobilization. For the first time, we demonstrate the detection of hr-HPV16 cDNA directly from an extracted plasma sample that can be used for POC screening of CC at remote locations.
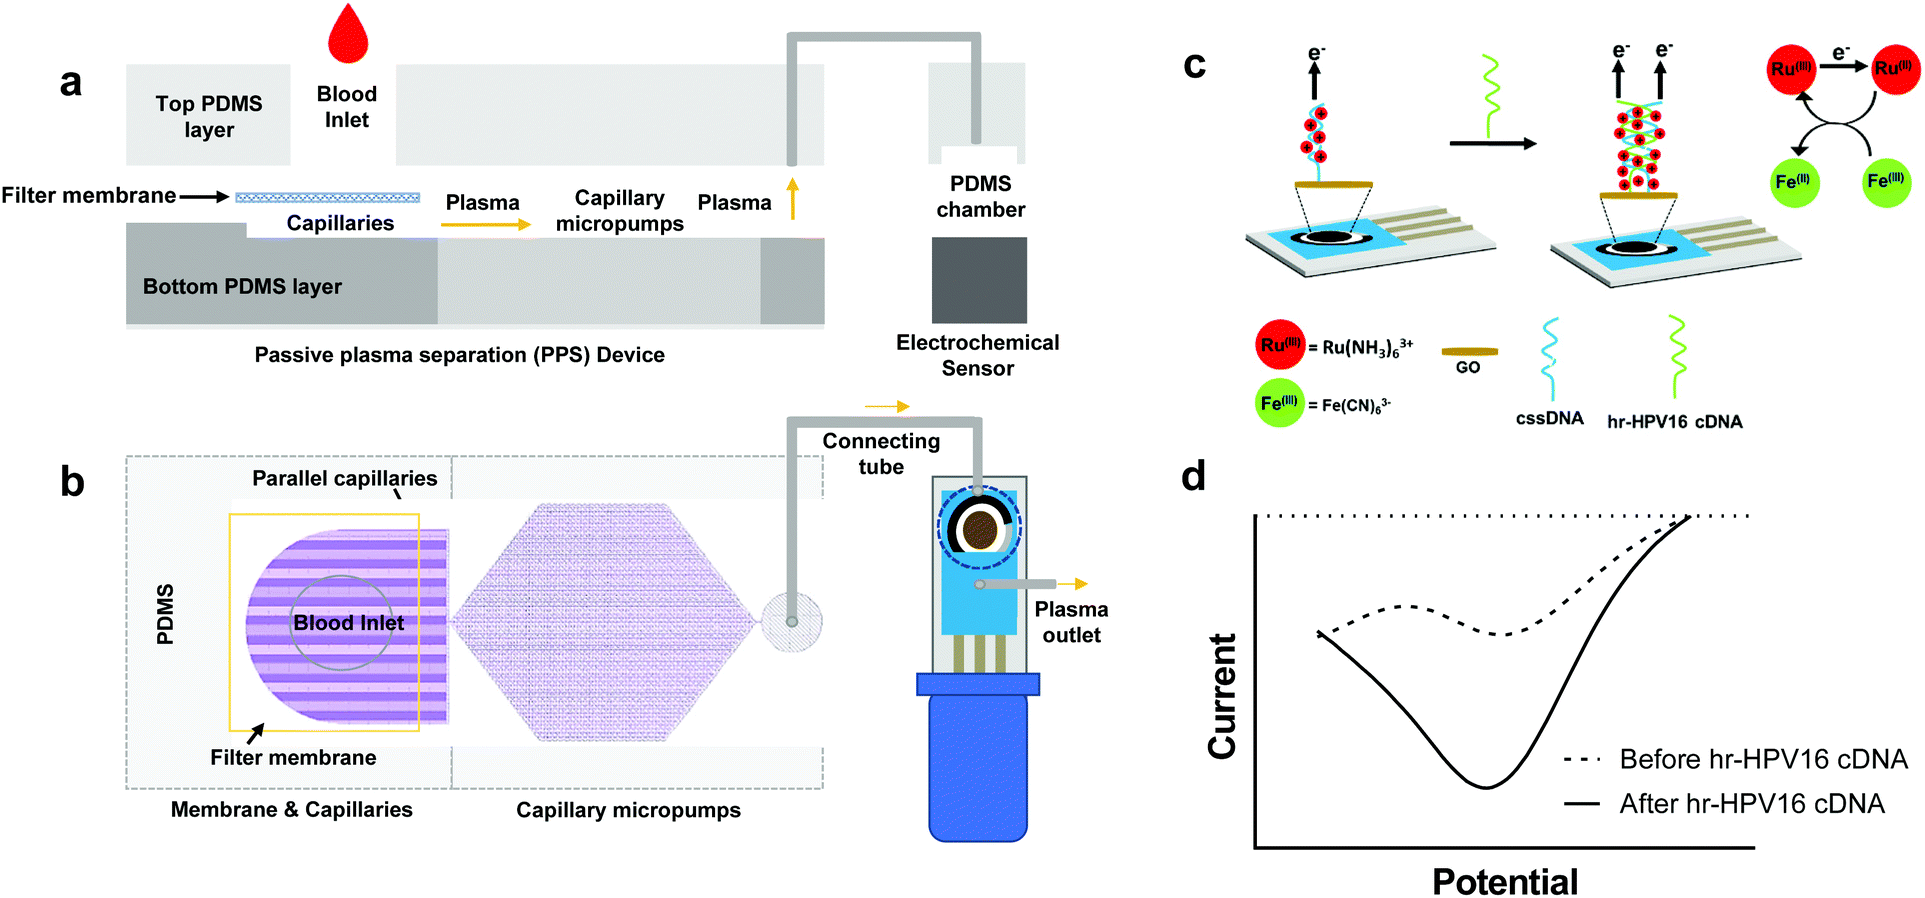 | ||
| Fig. 1 Overview and working mechanisms of IMEAC. Side view (a) and top view (b) of the IMEAC device that integrates two main modules: PPS for plasma isolation and an electrochemical biosensor. (c) Working principle of the electrochemical sensor for hr-HPV16 cDNA detection. (d) A sample graph extracted from IMEAC showing the presence of hr-HPV cDNA in the extracted plasma sample. | ||
Results and discussion
IMEAC device principle
The schematic of IMEAC which integrates the PPS and the GO-SPCE for hr-HPV16 cDNA detection is shown in Fig. 1. To enable passive plasma separation for POC testing, we designed a microfluidic device with parallel capillaries and capillary micropump with a filter membrane at the inlet (Fig. 1a and b). The PPS design was optimized to achieve the optimal plasma collection volume (yield) with high purity (∼99%) from whole blood. The integration of the filter membrane with parallel capillaries and the capillary micropump allows for autonomous withdrawing of plasma from the membrane surface when a few drops of whole blood was placed at the inlet.28 Since no external force was applied, the lysis of RBCs was minimal using our PPS, which is one of the major challenges for active plasma separation.32 Upon collection, plasma containing circulating viral DNA is directed for electrochemical detection. The electrochemical biosensor is based on a conventional three electrode system consisting of a silver/silver chloride (Ag/AgCl) reference electrode, carbon counter electrode, and carbon working electrode (WE) integrated in commercially available SPCEs. To immobilize the cssDNA probe, we drop cast GO on the surface of carbon WE, where the amine-modified probe forms covalent amide binding with carboxyl groups presented on the GO surface.33,34 The well-established and sensitive Ru(NH3)63+ + Fe(CN)63− electrochemical system was employed for cDNA detection in which Ru(NH3)63+ is reduced to Ru(NH3)62+ and Fe(CN)63− catalyzes the regeneration of Ru(NH3)63+(Fig. 1c). Ru(NH3)63+ is electrostatically attracted to the nucleic acid on the surface of WE in amounts proportional to the number of negative charges presented on the electrode's surface.16,35 Upon incubation of plasma samples containing hr-HPV16 cDNA, the capture probe hybridizes with the target DNA leading to an increase in the number of negative charges on the WE surface, thus resulting in the accumulation of more Ru(NH3)63+ and a higher electrochemical signal (Fig. 1d).Design and fabrication of the microfluidic PPS device
The PPS device was fabricated using a standard microfluidic fabrication protocol with polydimethylsiloxane (PDMS). The PPS device consists of three main components: a filter membrane at the inlet, parallel capillaries, and a capillary micropump which are sandwiched between two PDMS layers (Fig. 2a). The parallel capillaries and the capillary micropump were included in the bottom PDMS layer while a top PDMS layer was used to seal the micro-channels. A 9 μm thick filter membrane with an average pore size of 0.6 μm was employed for the filtration of RBCs and WBCs. The thickness of the membrane was suitable for bonding between two PDMS layers using oxygen plasma treatment.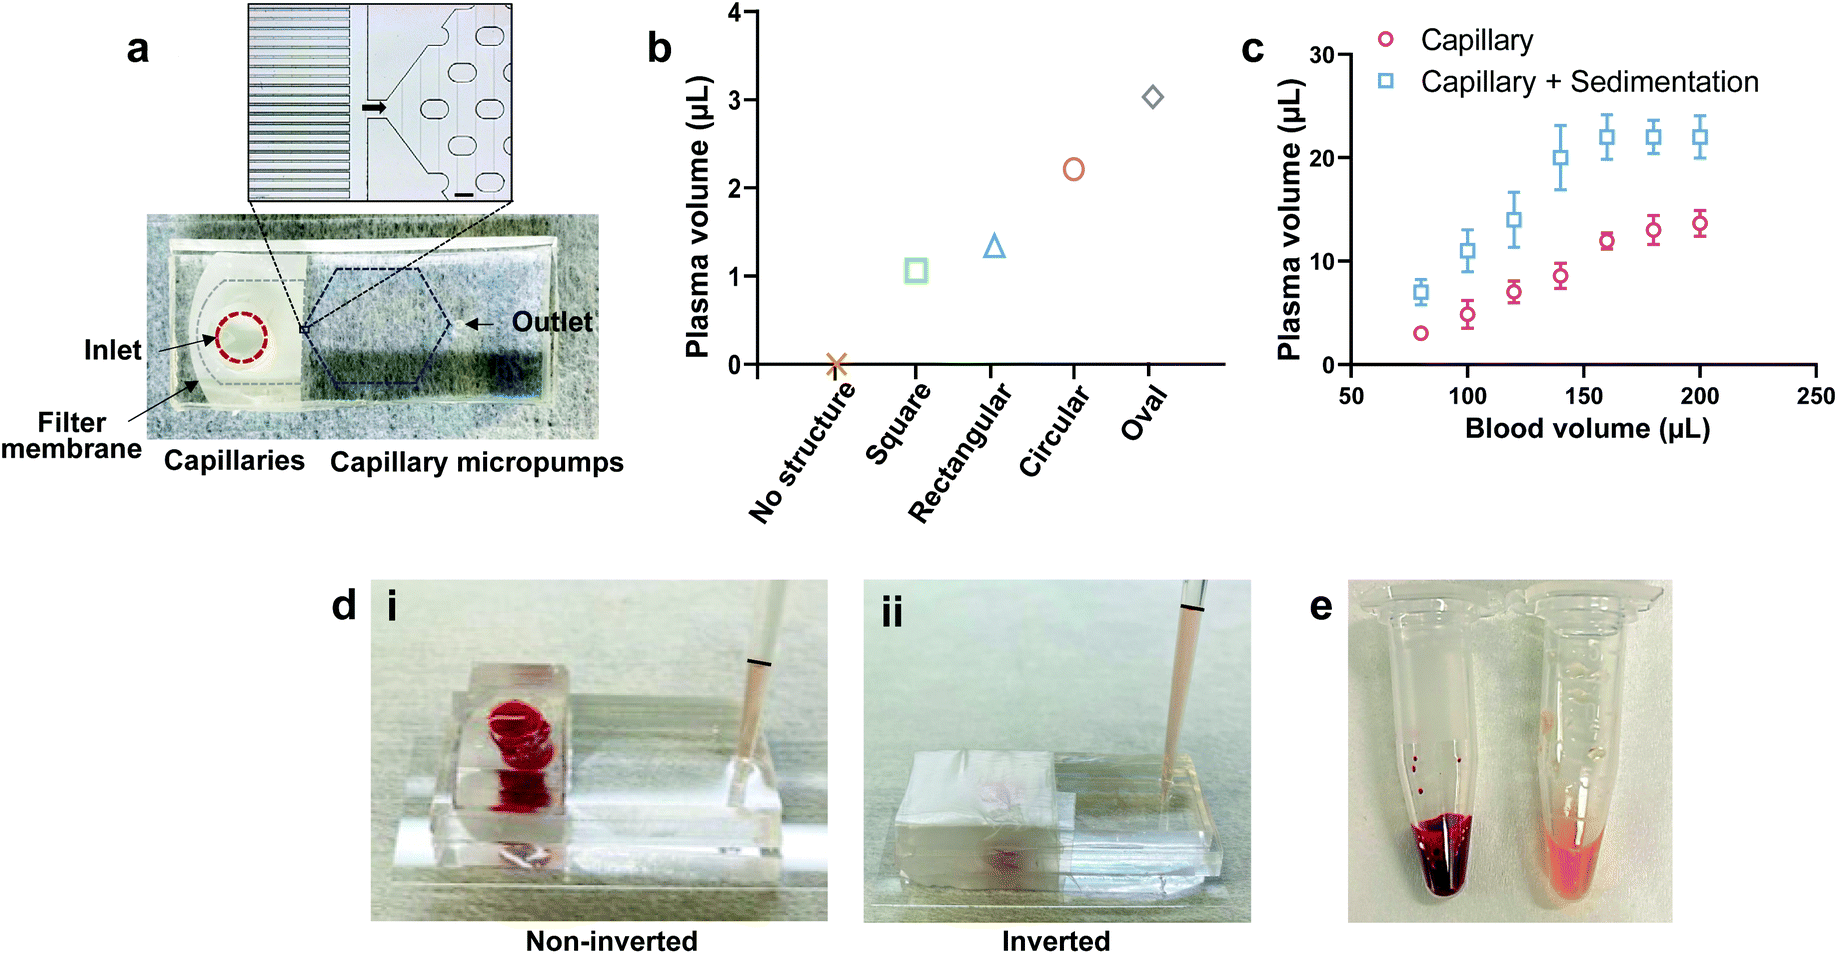 | ||
| Fig. 2 PPS device design overview and characterization. (a) PPS device consists of three main modules: membrane filter, parallel capillaries, and capillary micropump. A commercial plasma filter membrane with a 0.6 μm average pore size is sandwiched between two PDMS layers at the inlet of the PPS device. The parallel capillaries comprise of micro-channels which are 12 μm width and 40 μm apart from each other. Capillary micropumps consist of a staggered oval microarray with 150 μm length and 100 μm width and they have a uniform centre to centre distance of 300 μm in the horizontal direction and 200 μm in the vertical direction. Scale bar, 100 μm. (b) Comparison of the collected plasma volume for different micropump designs (square, rectangular, circular, and oval) for the same inlet blood volume. (c) Comparison of collected plasma volume for no sedimentation (noninverted) vs. sedimentation (inverted) for different inlet blood volume showing sedimentation improved plasma collection. (d) Comparison of collected plasma volume for no sedimentation (noninverted) (i) vs. sedimentation (inverted) (ii) inside micropipette tips. (e) Inlet whole blood vs. combined collected plasma from 8 PPS devices. Each experiment was repeated three times and error bars show SD. | ||
The parallel capillaries and the capillary micropump facilitated withdrawing the plasma from the filtrate side of the membrane due to the capillary force. We have tested different designs of microcapillaries to reduce the dead-end volume. Capillary channels with a width of 12 μm and 40 μm apart from each other were found to be optimum for plasma collection with a dead volume of approximately ∼9 μL (Fig. 2a). Capillary micropumps with different designs (square, rectangular, circular, and oval structures) were also tested. It has been previously shown that interconnected microstructures improve the channel filling.31 We have placed an array of microstructures in such a manner that the micropump has a comparatively lower flow resistance due to the large number of parallel flow paths, thus facilitating the plasma collection. We compared the micropump performance based on the collected plasma volume in 10 min using the same inlet volume of whole blood (80 μL) (Fig. 2b and Fig. S1†) and found that the plasma collection volume at the outlet was maximum using an oval shaped micropump. We conducted all the filtration experiments with this micropump design. We compared the collected plasma from inverted and non-inverted devices and observed a significance difference in the collected plasma volume for the same blood volume at the inlet (Fig. 2c). In the case of the non-inverted device, blood cells started settling down on top of the membrane surface due to gravity, resulting in the clogging of membrane pores and complete cessation of filtration (Fig. 2d-i). While for the inverted device, the sedimentation of blood cells assisted the settling of plasma on top and the capillary force transferred a higher volume of plasma (Fig. 2d-ii). The inverted technique increases the membrane lifetime and plasma volume at the outlet compared to the non-inverted technique. To increase the plasma collection volume by sedimentation, we inverted the device upon wrapping the inlet hole with a parafilm (Fig. 2d-ii). This experiment also shows that the PPS device has the capacity to collect 22 μL of plasma from 160 μL of whole blood and further increase in the inlet blood volume (200 μL) does not increase the collected plasma volume (Fig. 2c). Fig. 2e shows the collected plasma (∼200 μL) using our PPS device compared to the same volume of whole blood.
We also calculated purity and yield and benchmarked the microfluidic PPS device performance with that of previously reported works (Table 1). Purity of the filtered plasma was estimated by counting the number of blood cells in the inlet blood and outlet plasma using flow cytometry (Fig. S2†) and the yield was calculated based on dividing the collected plasma volume by the blood volume. The purity of our PPS device is comparable to other studies where some of these works used diluted blood (DB), prepared a blood sample with the desired haematocrit level as compared to whole blood (WB), and used active force to extract plasma.23,28,30,36
| Recent reported works on plasma separation | Plasma volume (μL) | Blood volume (μL) | Purity (%) | Yield (%) | Filtration time (min) | Remark |
|---|---|---|---|---|---|---|
| Centrifuge, control | 137 | 400 | 99 | 34 | 10 | WB-45% haematocrit |
| Ref. 28 | 0.45 | 5 | 99 | 9 | 15 | DB-capillary, passive |
| Ref. 30 | 12 | 100 | — | 12 | <10 | WB (45%)-capillary, pump |
| Ref. 23 | 132 | 400 | — | 33 | 5 | WB (45%)-pipetting, large dead volume |
| Ref. 36 | 43 | 243 | 100 | 18 | 10 | DB (15%)-vacuum PUMP |
| PPS device | 22 | 160 | 99 | 25 | 10 | WB (45%)-capillary, passive |
Design and characterization of the electrochemical biosensor
Prior to testing with the extracted plasma sample, we examined the capability of the electrochemical biosensor for hr-HPV16 cDNA detection when spiked into a buffer solution. To immobilize the cssDNA probes on the GO surface, we used the amine-coupling technique through which the amine-modified probe molecules form covalent amide bonding with carboxyl groups presented on the GO surface.Fourier transform infrared (FTIR) was performed to study probe immobilization on the GO surface (Fig. 3a). The peaks at 1720 cm−1 and 1610 cm−1 of the FTIR spectrum of GO display the C![[double bond, length as m-dash]](https://www.rsc.org/images/entities/char_e001.gif) O and CC stretching vibrations, respectively. The spectrum of GO before probe immobilization (blue line) showed a strong CO peak, which significantly decreased in intensity after probe immobilization (red line), indicating that the CO bonds of GO were broken to form the covalent linkage with amine-modified probes. To quantify the decrease in the CO bond after probe immobilization, the ratio of the CO peak intensity to the CC peak intensity (a constant value) was measured. As is evident from Fig. 3a, the ratio of CO/CC for GO has been reduced to more than half of its initial value after probe immobilization. The probe immobilization was further studied by performing cyclic voltammetry (CV) measurement of GO samples grafted with the cssDNA probe in Fe(CN)63−/2− solution. Since both the nucleic acid probe and Fe(CN)63−/2− contain negative charges, a repletion occurs between them leading to a decrease in the redox current. Thus, a lower CV peak is expected in the presence of probe molecules. As shown in Fig. 3b, the redox peak current was significantly lower for the GO sample after probe immobilization, confirming that the probe functionalization was successful. To measure the amount of probe molecules, we functionalized GO with the cssDNA probe and used methylene blue (MB) to measure the probe density. This approach employs the interaction between MB and guanine bases of a DNA strand to quantify the number of immobilized oligonucleotides.3,5 The quantified average density of the probe on GO was 6.8 pmol cm−2. Having successfully functionalized GO with cssDNA probe molecules, we studied the capability of the electrochemical biosensor for the detection of hr-HPV16 cDNA spiked in buffer solution. GO-SPCE grafted with cssDNA probes were incubated with different concentrations of target DNA (1 μM–10 μM). The change in the current upon hybridization with target DNA was assessed by analyzing differential pulse voltammograms (DPV) and quantitating peak currents before (dotted line) and after (solid line) hybridization (Fig. 3c and Fig. S3†). In this approach, Ru(NH3)63+ was electrostatically attracted to the negatively charged probe molecules or hybridized probe–target nucleic acid strands on the electrode surface. Ru(NH3)63+ was then reduced to Ru(NH3)62+ when triggered at its reduction potential (−0.3 to −0.2 V). The difference between the obtained peak currents before and after target hybridization was used as the measure to correlate with the target concentration. Adding a non-specific target did not generate a significant change in DPV current after incubation (Fig. 3c-inset), demonstrating the specificity of our sensor for hr-HPV16 cDNA detection. Fig. 3d shows the sensor's electrochemical response to different concentrations of spiked hr-HPV16 cDNA in buffer solution which is fitted into a linear curve with R2 = 0.97. As displayed in Fig. 3d, in the presence of higher concentrations of hr-HPV16 cDNA, more Ru(NH3)63+ is electrostatically bound to WE, leading to increased changes in the DPV measurement. To make the operating time shorter, experiments were conducted at different temperatures. We found that the incubation time can be shortened from 1 h at 37 °C to 10 minutes at 55 °C for hr-HPV16 cDNA (Fig. 3e). A miniaturized, low-cost heating element can be integrated within our assay to increase the temperature for effective and rapid detection. We have studied the stability of our assay and the electrochemical biosensors immobilized with the cssDNA probes were stored for 3 or 7 days. No significant change in the signal measurement was observed (Fig. 3f), demonstrating that the sensor can be stable at least for 7 days.
O and CC stretching vibrations, respectively. The spectrum of GO before probe immobilization (blue line) showed a strong CO peak, which significantly decreased in intensity after probe immobilization (red line), indicating that the CO bonds of GO were broken to form the covalent linkage with amine-modified probes. To quantify the decrease in the CO bond after probe immobilization, the ratio of the CO peak intensity to the CC peak intensity (a constant value) was measured. As is evident from Fig. 3a, the ratio of CO/CC for GO has been reduced to more than half of its initial value after probe immobilization. The probe immobilization was further studied by performing cyclic voltammetry (CV) measurement of GO samples grafted with the cssDNA probe in Fe(CN)63−/2− solution. Since both the nucleic acid probe and Fe(CN)63−/2− contain negative charges, a repletion occurs between them leading to a decrease in the redox current. Thus, a lower CV peak is expected in the presence of probe molecules. As shown in Fig. 3b, the redox peak current was significantly lower for the GO sample after probe immobilization, confirming that the probe functionalization was successful. To measure the amount of probe molecules, we functionalized GO with the cssDNA probe and used methylene blue (MB) to measure the probe density. This approach employs the interaction between MB and guanine bases of a DNA strand to quantify the number of immobilized oligonucleotides.3,5 The quantified average density of the probe on GO was 6.8 pmol cm−2. Having successfully functionalized GO with cssDNA probe molecules, we studied the capability of the electrochemical biosensor for the detection of hr-HPV16 cDNA spiked in buffer solution. GO-SPCE grafted with cssDNA probes were incubated with different concentrations of target DNA (1 μM–10 μM). The change in the current upon hybridization with target DNA was assessed by analyzing differential pulse voltammograms (DPV) and quantitating peak currents before (dotted line) and after (solid line) hybridization (Fig. 3c and Fig. S3†). In this approach, Ru(NH3)63+ was electrostatically attracted to the negatively charged probe molecules or hybridized probe–target nucleic acid strands on the electrode surface. Ru(NH3)63+ was then reduced to Ru(NH3)62+ when triggered at its reduction potential (−0.3 to −0.2 V). The difference between the obtained peak currents before and after target hybridization was used as the measure to correlate with the target concentration. Adding a non-specific target did not generate a significant change in DPV current after incubation (Fig. 3c-inset), demonstrating the specificity of our sensor for hr-HPV16 cDNA detection. Fig. 3d shows the sensor's electrochemical response to different concentrations of spiked hr-HPV16 cDNA in buffer solution which is fitted into a linear curve with R2 = 0.97. As displayed in Fig. 3d, in the presence of higher concentrations of hr-HPV16 cDNA, more Ru(NH3)63+ is electrostatically bound to WE, leading to increased changes in the DPV measurement. To make the operating time shorter, experiments were conducted at different temperatures. We found that the incubation time can be shortened from 1 h at 37 °C to 10 minutes at 55 °C for hr-HPV16 cDNA (Fig. 3e). A miniaturized, low-cost heating element can be integrated within our assay to increase the temperature for effective and rapid detection. We have studied the stability of our assay and the electrochemical biosensors immobilized with the cssDNA probes were stored for 3 or 7 days. No significant change in the signal measurement was observed (Fig. 3f), demonstrating that the sensor can be stable at least for 7 days.
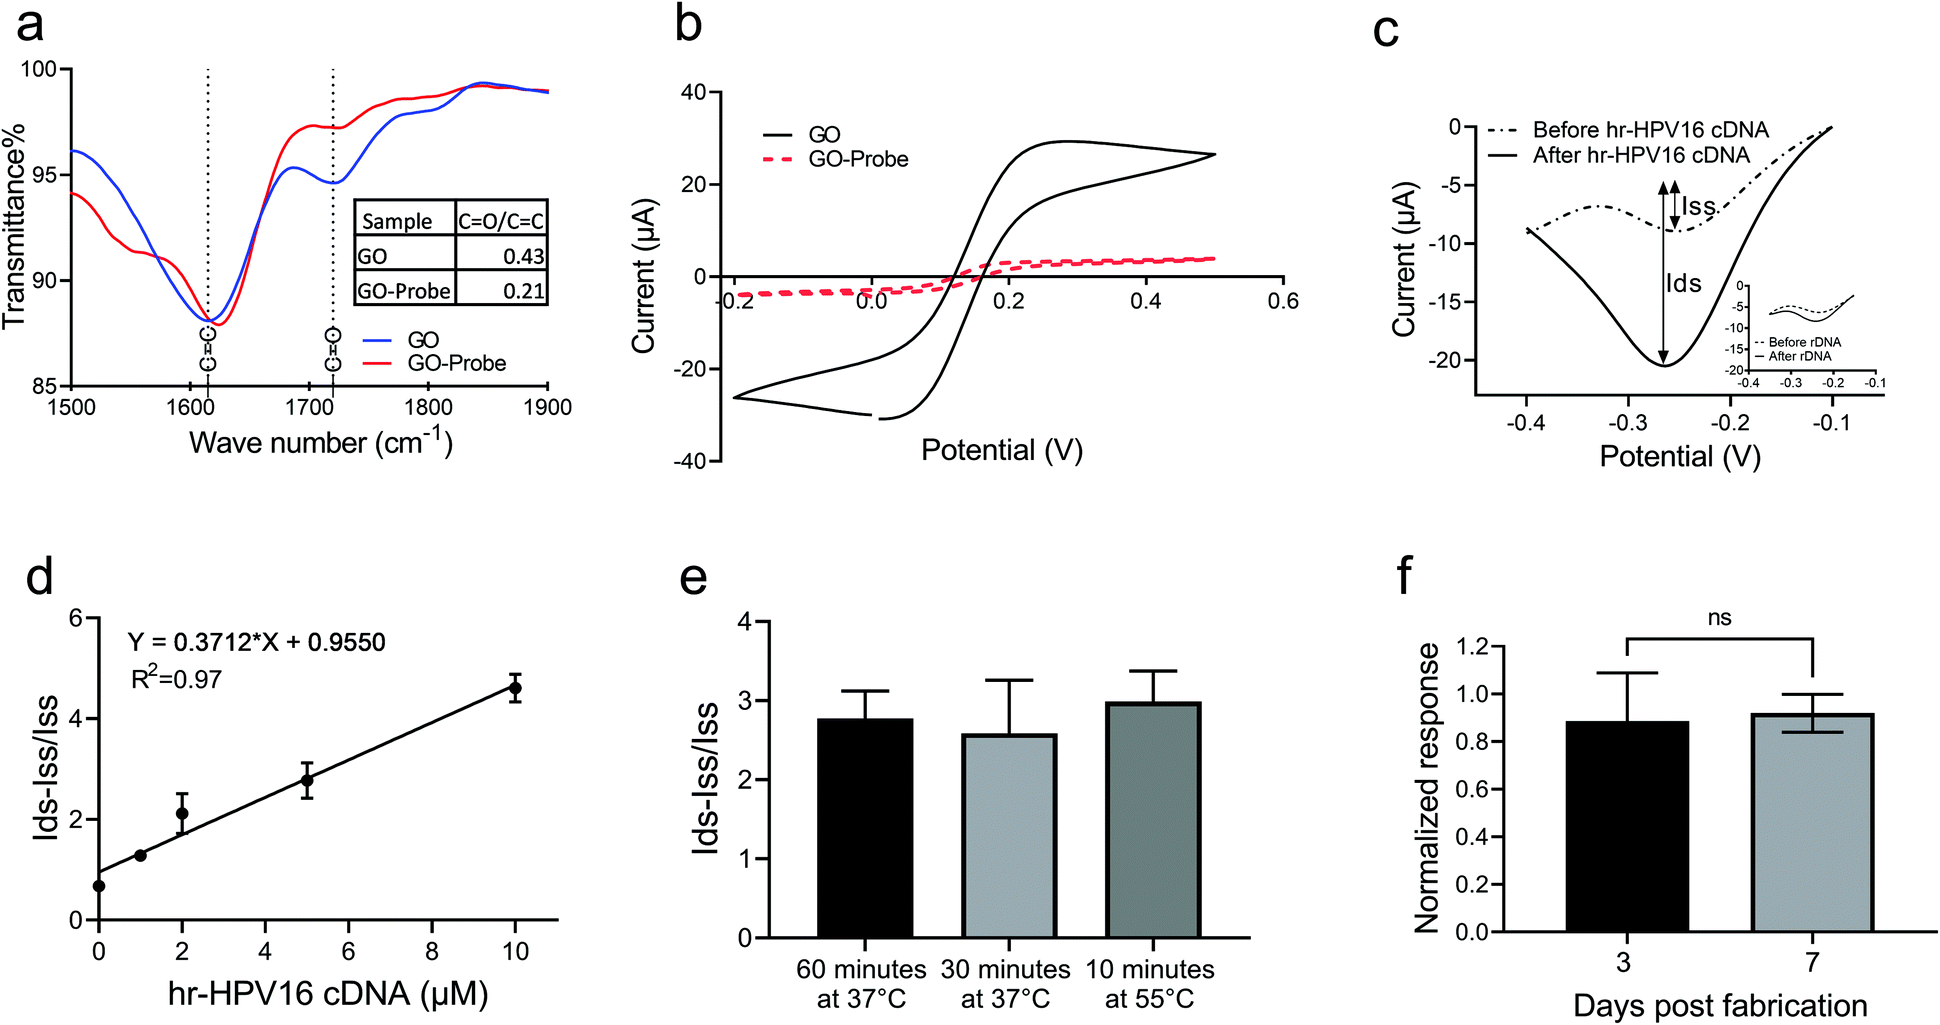 | ||
| Fig. 3 Design and characterization of the electrochemical biosensor for hr-HPV16 cDNA detection. (a) The FTIR measurement of GO samples before and after probe immobilization. (b) The CV measurement of GO functionalized with the probe in 10 mM Fe(CN)63−/2− solution showed a lower oxidation peak compared with GO prior to the probe immobilization. (c) Sample DPV measurement before (dotted line) and after (solid line) specific target hybridization at a concentration of 10 μM. The inset shows the DVP measurement of the non-specific target (rDNA) at 5 μM concentration. Iss and Ids represent the DPV peak current before and after target hybridization, respectively. (d) Change in the DPV current at different target DNA concentrations can be fitted with a linear regression line (R2 = 0.97). (e) The performance of the electrochemical biosensor was studied under different conditions using 5 μM hr-HPV16 cDNA. (f) The performance of the electrochemical biosensor was studied 3 or 7-day post-fabrication using 5 μM hr-HPV16 cDNA. The obtained biosensor responses were normalized to the response of biosensors fabricated and tested in the same day, ns = non-significant. At least 3 replicates were analysed per experiment and error bars show SEM. | ||
Detection of cervical cancer's biomarker in the extracted plasma sample
Having demonstrated and optimized the PPS performance for plasma separation and the electrochemical biosensor for hr-HPV16 cDNA detection, we moved forward and fabricated the IMEAC (Fig. 4). The PPS outlet was connected to a PDMS chamber covering the electrodes of modified GO-SPCE via a tube. Fig. 4a shows the side view of the integrated platform and Fig. 4b shows a demonstration of the assay with food dye. Upon blood loading, the plasma containing the target DNA is isolated and directed towards the electrochemical biosensor modified with cssDNA probe molecules via withdrawing using a syringe. We first studied the efficiency of the PPS device to recover the target DNA. The whole blood sample was spiked with different concentrations of a random DNA molecule (rDNA, with an approximately similar size to that of hr-HPV16 cDNA) labeled with the Cy3 fluorophore and loaded into the PPS device. The fluorescence intensity measurement of the collected plasma from the PPS device which interrogates Cy3 was very close to the control plasma samples spiked with the rDNA molecule, demonstrating that on average 130% of DNA was recovered (Fig. 4c). Subsequently, whole blood samples were spiked with two concentrations of the hr-HPV16 cDNA (5 μM and 10 μM) and loaded into the IMEAC device for plasma separation and DNA detection. Before and after target hybridization, DPV measurement was performed (Fig. 4d). As shown in Fig. 4e, the change in the peak current of DPV measurement was higher for the 10 μM spiked sample compared to the 5 μM one. Control experiments where the centrifuged collected plasma was spiked with 5 μM and 10 μM target DNA were also performed. IMEAC measurements matched well with the ones obtained from the control experiment. The lower measurements obtained from plasma compared to the buffer experiments could be attributed to the background molecules present in plasma that block electron transfer. We should mention that in real samples, the hr-HPV cDNA is present in the double strand (ds) form and should be denatured before sensing. This can be achieved by mixing the isolated plasma with 1 molar NaOH.37 A chamber can be integrated into our IMEAC that contains dried NaOH for this purpose. Incubating dsDNA with 1 molar NaOH can denature dsDNA in 5 minutes without affecting its hybridization capability.37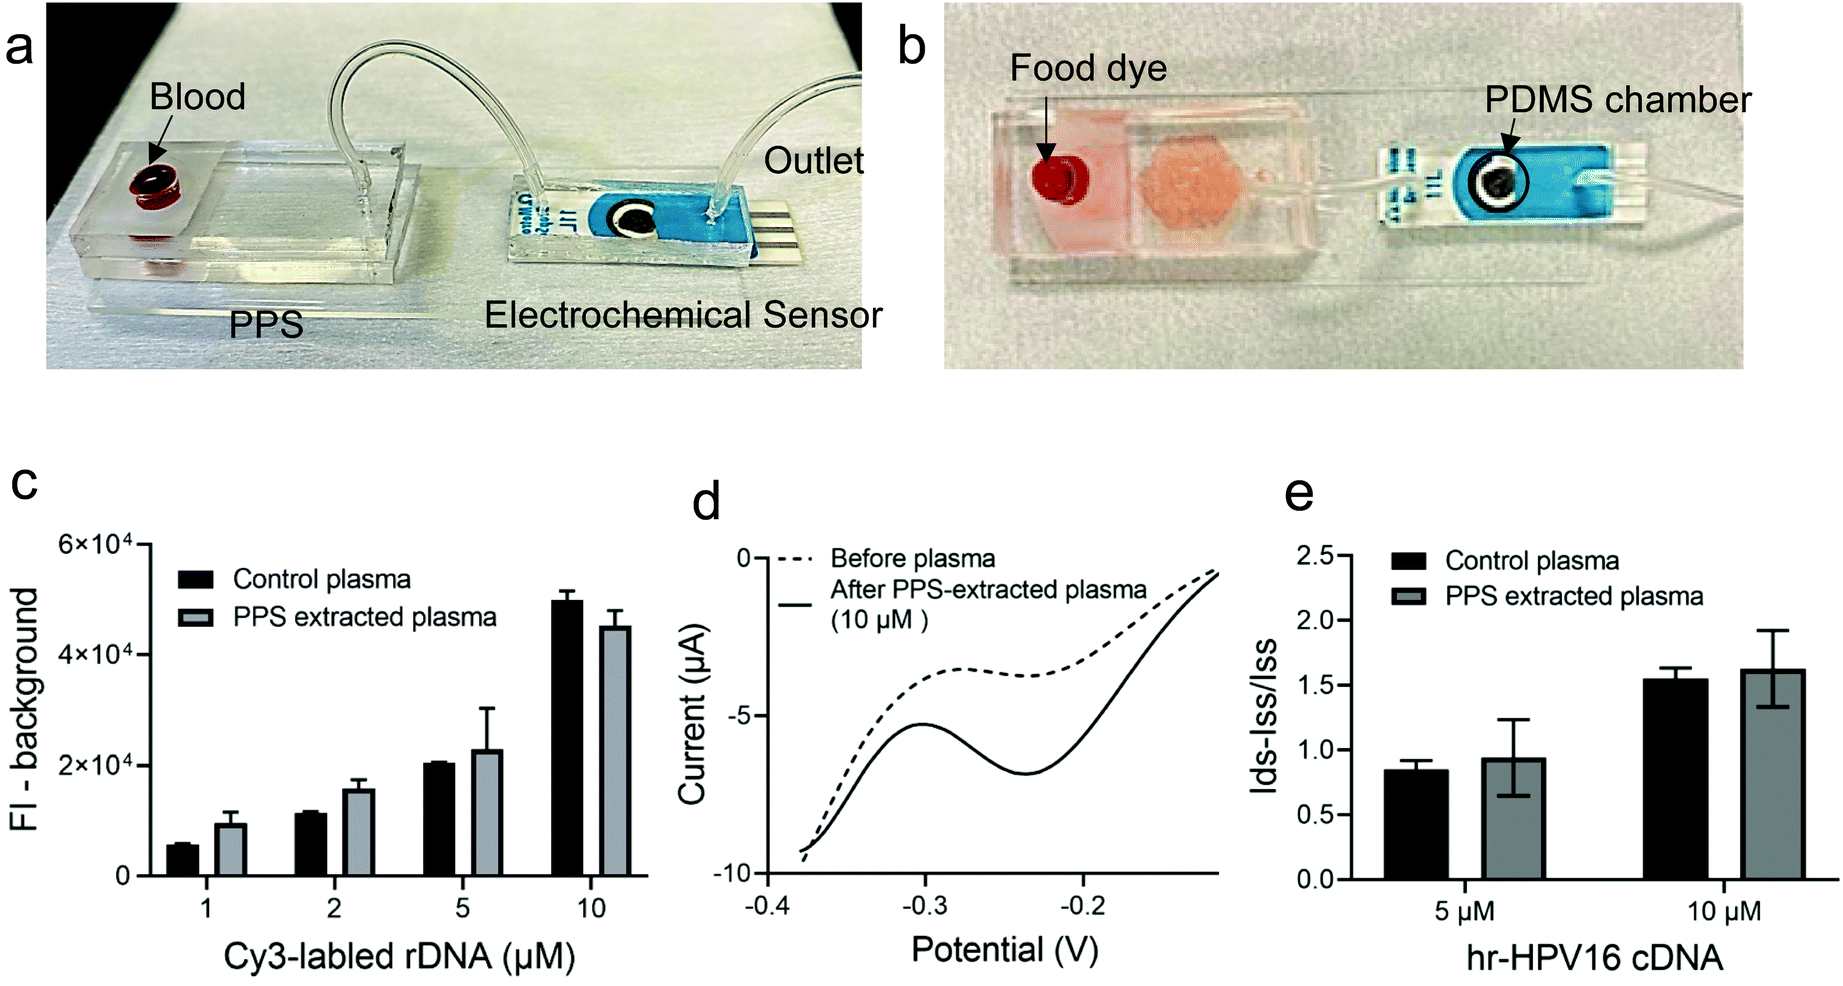 | ||
| Fig. 4 IMEAC fabrication and validation. (a) IMEAC was fabricated via connecting the outlet of the PPS device to the inlet of a chamber that covers the electrodes of the electrochemical biosensor using tubing. (b) A demonstration of the assay with food dye. (c) The efficiency of the PPS device to recover DNA molecules was tested by loading a whole blood sample spiked with different concentrations of rDNA labeled with Cy3 dye into the device. Background is 0 μM concentration. The fluorescence intensity of the collected plasma was measured and compared with the control plasma spiked with rDNA. (d) DPV measurement before and after incubating with 10 μM hr-HPV16 cDNA spiked plasma extracted from PPS. (e) Bar graph extracted from IMEAC or control plasma demonstrating the change in DPV current for 5 μM and 10 μM of target DNA spiked into whole blood. Each experiment was repeated at least three times and error bars show SEM. | ||
Materials and methods
Materials
The PDMS elastomer (Sylgard 184) was obtained from Dow Corning, and SU8-3050 and SU8-developer from Kayaku Advanced Material. Whole blood sample was purchased from BioIVT (US). The filter membrane (average pore size, 0.6 μm) was obtained from Sterlitech. N-(3-Dimethylaminopropyl)-N′-ethylcarbodiimide hydrochloride (EDC, Sigma Aldrich, 98%), N-hydroxysuccinimide (NHS, Sigma Aldrich, 98%), 4-morpholineethanesulfonic acid, 2-(N-morpholino)ethanesulfonic acid (MES, Sigma Aldrich, >99%), potassium hexacyanoferrate(III) (Fe(CN)63−, Sigma Aldrich, 99%), potassium hexacyanoferrate(II) (Fe(CN)62−, Sigma Aldrich, 99%), hexaammineruythenium(III) chloride (Ru(NH3)63+, Sigma Aldrich, 98%), magnesium chloride hexahydrate (MgCl2, Fisher scientific), sodium phosphate (Sigma Aldrich, 96%, NaPO4), phosphate buffer solution (PBS, Sigma Aldrich), sodium chloride (Millipore Sigma), methylene blue (MB, Sigma Aldrich), screen printed carbon electrodes (SPCE, DRP-11L-U75, Metrohm, Canada), and all synthetic nucleic acids (sequences provided in Table S1†) were purchased from Integrated DNA Technologies (IDT). Graphene oxide (GO) was kindly provided by KPA (https://graphenika.com/).Methods
PPS device fabrication
The conventional photolithography technique was used to fabricate the microfluidic PPS device using PDMS. At first, a 4′′ Si wafer was cleaned with piranha to remove any organic impurities. Then the wafer was HF treated to remove any native oxide layer. A negative photoresist SU 8 3025 was spin coated at 4000 rpm to deposit a layer of 25 μm following the datasheet.37 After that the photoresist was baked (95 °C for 10 min) and exposed to the designed pattern and developed in the developer solution.38 When the mold was ready, PDMS (10![[thin space (1/6-em)]](https://www.rsc.org/images/entities/char_2009.gif) :1) was poured into the master mold and cured at 80 °C for 2 hours. To make the PPS device, at first, a commercial filter was bonded at the inlet using oxygen plasma treatment. Then the PPS device was bonded to another PDMS layer by oxygen plasma to create a micro-channel after drilling the inlet and outlet. A 6.3 mm diameter inlet hole and 1.2 mm diameter outlet hole were punched on the top PDMS layer before bonding the two PDMS layers. More layers of PDMS were introduced to increase blood volume at the inlet.
:1) was poured into the master mold and cured at 80 °C for 2 hours. To make the PPS device, at first, a commercial filter was bonded at the inlet using oxygen plasma treatment. Then the PPS device was bonded to another PDMS layer by oxygen plasma to create a micro-channel after drilling the inlet and outlet. A 6.3 mm diameter inlet hole and 1.2 mm diameter outlet hole were punched on the top PDMS layer before bonding the two PDMS layers. More layers of PDMS were introduced to increase blood volume at the inlet.
Plasma collection using the PPS device
Human whole blood was used for all the experiments. To examine the efficacy of the PPS device, undiluted whole blood was directly injected into the inlet hole. We kept the inlet whole size constant for all our experiments and varied the height of the PDMS layers to add more volume of blood. Plasma was collected from the outlet by pipetting for characterization.GO-SPCE fabrication and probe modification
Before use, the SPCE chips were rinsed with acetone, isopropanol, and deionized water followed by a pre-treatment protocol. The pre-treatment step included five CV cycles from +0.5 to −1.5 V in 0.1 M HCl followed by two CV cycles from 0 to +2 V in phosphate buffer solution (0.1 M PBS, pH 7) at a scan rate of 50 mV s−1. The SPCEs were subsequently washed with ultrapure water (Milli-Q) and dried. 10 μL of GO (from 1 mg mL−1 stock) was then drop-cast on the SPCE working electrode (WE) surface and dried overnight. To immobilize the probe on GO-SPCE, the surface was first activated by incubating the WE with 50 μL of an equimolar solution of EDC-NHS (100 mM) in MES buffer (100 mM, PH 6.8) overnight. The EDC-NHS was washed quickly, and the chips were incubated with 20 μl of 15 μM amine-modified probe (hr-HPV16 cssDNA) in probe buffer (20 mM magnesium chloride, 25 mM sodium chloride, 25 mM PBS) in a humid chamber for 2 hours. After the probe incubation time, the chips were extensively washed with 1× PBS to remove any unattached probes.FTIR characterization
The chemical composition and functional groups of blank GO-SPEC and GO-SPCE functionalized with the probe molecules were characterized using FTIR characterization (Tensor 27 FTIR, Bruker).Probe density measurement
The probe density was measured using the MB reporter.39 Briefly, the modified chips were incubated with 20 μM MB (in B-R buffer +20 mM sodium chloride, PH = 6) in a beaker for 5 minutes, while stirring (for better accumulation of MB). The electrodes were then washed with 1× PBS and subjected to CV scanning from 0.12 to −0.4 with a scan rate of 50 mV s−1 in B-R buffer +20 mM sodium chloride. Before MB accumulation, a similar CV scan was performed on chips in B-R buffer that was taken as the background and subtracted from the final scan. To obtain the charge quantity of accumulated MB, the difference in the area under the curve for MB reduction was measured. The probe density was subsequently calculated using this formula;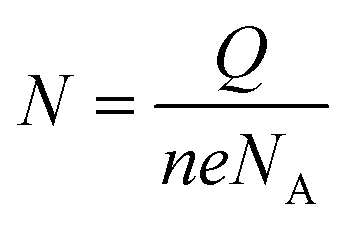 , where N represents the mol quantity of MB, Q is the electrical charge quantity of MB reduction, n is the number of electrons participating in the reaction (2 in this process), e the electric charge quantity of one electron (1.6 × 10⁻¹⁹ C), and NA is Avogadro constant (6.02 × 10²³ mol−1). Since our hr-HPV16 cssDNA probe contains 8 guanine bases, the calculated N was then normalized by 8. To measure the surface area of WE, we used the diameter = 4 mm (provided by company).
Target hybridization
For buffer experiments, the desired concentration of hr-HPV16 cDNA (target) was diluted in target buffer (25 mM sodium chloride and 1.6 mM sodium phosphate) and incubated with the GO-SPCE chip functionalized with probe molecules for 1 hour at 37 °C in a humid chamber. The GO-SPCE chips were washed with 1× PBS after the target hybridization. For plasma experiments, the collected plasma was directly incubated with the chips with no dilution and the surface of modified GO-SPCE was blocked using 0.05% BSA (20 minutes incubation followed by PBS wash) prior to target hybridization.Electrochemical measurement
The electrochemical measurements were performed using either a CHI (CH Instruments) or Palmsens4 potentiostat. CV scans were obtained in 10 mM Fe(CN)62−/Fe(CN)63− solution using 50 mV s−1 scan rate. Differential pulse voltammetry (DPV) scans were obtained in 100 μM Ru(NH3)63+ +25 mM sodium phosphate (pH 7), 25 mM sodium chloride, and 4 mM Fe(CN)63−. DPV signals before and after hybridization were measured using an increment potential of 4 mV, pulse amplitude of 50 mV, pulse width of 50 ms, and a pulse period of 50 ms (translating to 8 mV s−1 scan rate). The GO-SPCE chips were rinsed with 1× PBS after the DPV scans.Stability experiment
For stability tests the GO-SPCE chips immobilized with the cssDNA were refrigerated in the probe buffer for 3 and 7 days. The sensor was then incubated with 5 μM of the target DNA and the electrochemical measurements were then performed as explained above. The sensor response was normalized to the measurement obtained from a freshly made device.Study different incubation conditions
The prepared GO-SPCE-probe chips were subjected to DPV using the mentioned set-up. The chips were then incubated with 5 μM of target at three different conditions: (i) 37 °C and 1 hour incubation time, (ii) 37 °C and 30 minutes incubation time, and (iii) 55 °C and 10 minutes incubation time. The chips were washed with 1× PBS and again subjected to DPV. The biosensor response (Ids − Iss/Iss) was calculated and reported in Fig. 3d.IMEAC fabrication
The electrochemical sensor was integrated to the PPS device to generate the IMEAC. At first, a thin layer of PDMS (1–2 mm thickness) was deposited on top of the unmodified SPCE sensor to facilitate PDMS–PDMS bonding using oxygen plasma. Next, a circular PDMS chamber covering the electrode was cut and PDMS was removed from that area. The electrochemical sensor was then modified with GO and the cssDNA probe molecule was immobilized as described above. Next, the modified SPCE was bonded to a PDMS chamber with a straight microfluidic channel. The chamber was aligned with the electrodes. The PDMS chamber inlet was then connected to the outlet of the PPS device via tubing and the PDMS chamber outlet was connected to a tube to enable withdrawing of the solution out of the IMEAC in one single step (Fig. 4b).hr-HPV16 DNA detection using the IMEAC device
200 μL of the whole blood sample spiked with 5 μM and 10 μM concentrations of hr-HPV16 cDNA was loaded at the inlet chamber of the PPS device. Once the outlet of the PPS device was filled with plasma, using a syringe at the outlet of the PDMS chamber of the electrochemical sensor, the collected plasma was directed to the sensor. The plasma containing the hr-HPV16 DNA was incubated with the electrochemical biosensor immobilized with the capture DNA probes for 1 hour at 37 °C and the detection was conducted as explained in the Electrochemical measurement section.Plasma collection using a centrifuge
The control plasma was collected by centrifuging blood at 2000 rcf for 10 minutes. The collected plasma was then spiked with the target to make the final concentrations of 5 μM and 10 μM and tested using the GO-SPCE-probe chips.Efficiency of the PPS device for DNA recovery
To examine the presence of spiked nucleic acid in the collected plasma from the PPS device, 200 μL of blood was spiked with different concentrations of a Cy3-labled 30 bp random DNA (rDNA). The blood was then injected into the PPS device and the isolated plasma was collected. The collected plasma was diluted 1:20 in 1× PBS and the fluorescence intensity was measured using a BioTek Synergy H1 plate reader (excitation: 530 nm, peak emission: 570 nm). As a control, different concentrations of rDNA were spiked into isolated plasma and the fluorescence signal was measured. The fluorescence intensity of PPS-extracted plasma was then normalized to the fluorescence intensity of control plasma spiked with the same concentrations of Cy3-labled rDNA and reported as the recovery percentage (130%).
Conclusions
Early diagnosis of CC biomarkers is crucial for successful cancer treatment. In this study, we presented a low-cost and integrated microfluidic electrochemical assay, named IMEAC, that enables the detection of hr-HPV16 cDNA in an extracted plasma sample with no sample processing or need for external costly equipment. Capillary force along with sedimentation is used to isolate plasma while the detection is achieved via GO modified SPCE immobilized with cssDNA probe molecules that detect the hr-HPV16 cDNA target. The IMEAC can be potentially employed in identifying other biomarkers of CC, such as hr-HPV18 cDNA from plasma by using suitable probe molecules, thus enabling multiplexed measurement. The primary advantage of our assay is that it is non-invasive and uses blood for CC detection. The passive filtration strategy avoids the use of the conventional “gold standard” centrifugation method which requires access to external equipment and materials. Thus, our IMEAC device can be used as a complete assay that generates plasma from whole blood for the multiplexed detection of CC biomarkers at the POC testing setting. The concentration range of hr-HPV cDNA in the plasma of cervical cancer patients is 1099 copies per ml. Our limit of detection (LOD) is 0.48 μM which is translated to ∼109 copies per ml. Therefore, to be able to detect the physiological range of hr-HPV cDNA in plasma, either a DNA amplification step should be integrated, or the sensitivity of our electrochemical biosensor should be improved to enable rare target DNA detection. DNA amplification can be integrated similar to the previously reported microfluidic devices which enables the polymerase chain reaction (PCR) to be performed on-chip.40–42 The incorporation of carboxylated GO,33 and reduced GO,43,44 or fabricating GO nanocomposites45 can increase the probe density, thus improving the sensitivity. Although our LOD currently does not cover the clinically relevant ranges, to the best of our knowledge, no previous work has detected hr-HPV DNA in plasma (Table S2†). In our assay, vials of washing buffer and the detection reagent (Ru(NH3)63+ + Fe(CN)63−) along with disposable pipettes can be supplemented for performing washing steps as well as the detection step. We envision that our assay will be similar to the Visby test46 as a point-of-care diagnostic device for screening cervical cancer in remote areas.Author contributions
F. K. and N. D. contributed equally to this work. F. K., N. D., and M. P. initiated this study and further designed the experiments; N. D. carried out the PPS module design, fabrication, and characterization. F. K. designed and characterized the electrochemical biosensor and analysed the data; M. A. S. helped with troubleshooting the electrochemical biosensor; F. K., N. D., and M. P. wrote the manuscript. All authors edited, discussed, and approved the whole paper.Conflicts of interest
There is no conflict of interest.Acknowledgements
This research was funded by the Mathematics of Information Technology and Complex (Mitacs) and Natural Sciences and Engineering Research Council of Canada (NSERC)-Alliance grant. We are thankful to KPA for donating GO. We acknowledge the Quantum-Nano Fabrication and Characterization facility for their cleanroom facilities and Waterloo Advanced Technology Laboratory for FTIR measurement. We thank Hamid Aghamohammadi for his help in PPS device fabrication.Notes and references
- M. Arbyn, E. Weiderpass, L. Bruni, S. de Sanjosé, M. Saraiya, J. Ferlay and F. Bray, Lancet Glob. Health, 2020, 8, e191–e203 CrossRef PubMed
.
- M. Brisson and M. Drolet, Lancet Oncol., 2019, 20, 319–321 CrossRef PubMed
- G. M. Ginsberg, J. A. Lauer, S. Zelle, S. Baeten and R. Baltussen, Br. Med. J., 2012, 344, 1–18 CrossRef PubMed
- S. J. Goldie, L. Gaffikin, J. D. Goldhaber-Fiebert, A. Gordillo-Tobar, C. Levin, C. Mahé and T. C. Wright, N. Engl. J. Med., 2005, 353, 2158–2168 CrossRef CAS PubMed
- N. G. Campos, M. Sharma, A. Clark, J. J. Kim and S. C. Resch, PLoS One, 2016, 11 Search PubMed
- S. Patra and D. Panda, Indian J. Cancer, 2010, 47, 344–345 CrossRef CAS PubMed
- K. S. Okunade, J. Obstet. Gynaecol., 2020, 40, 602–608 CrossRef CAS PubMed
- S. S. Shah, S. Senapati, F. Klacsmann, D. L. Miller, J. J. Johnson, H. C. Chang and M. S. Stack, Cancers, 2016, 8, 85 CrossRef PubMed
- Y. Gu, C. Wan, J. Qiu, Y. Cui, T. Jiang and Z. Zhuang, PLoS One, 2020, 15, 1–14 Search PubMed
- M. Gnanamony, A. Peedicayil, J. Subhashini, T. S. Ram, A. Rajasekar, P. Gravitt and P. Abraham, Gynecol. Oncol., 2010, 116, 447–451 CrossRef CAS PubMed
- P. Kay, B. Allan, L. Denny, M. Hoffman and A. L. Williamson, J. Med. Virol., 2005, 75, 435–439 CrossRef CAS PubMed
- S. M. Dong, S. I. Pai, S. H. Rha, D. Sidransky, R. J. Kurman, A. Hildesheim, P. E. Schwartz, R. Mortel, L. McGowan, M. D. Greenberg and W. A. Barnes, Cancer Epidemiol. Biomarkers Prev., 2002, 11, 3–6 CAS
- B. S. Chera, S. Kumar, B. T. Beaty, D. Marron, S. Jefferys, R. Green, E. C. Goldman, R. Amdur, N. Sheets, R. Dagan, D. N. Hayes, J. Weiss, J. E. Grilley-Olson, A. Zanation, T. Hackman, J. M. Blumberg, S. Patel, M. Weissler, X. M. Tan, J. S. Parker, W. Mendenhall and G. P. Gupta, Clin. Cancer Res., 2019, 25, 4682–4690 CrossRef CAS PubMed
- S. Bodaghi, L. V. Wood, G. Roby, C. Ryder, S. M. Steinberg and Z. M. Zheng, J. Clin. Microbiol., 2005, 43, 5428–5434 CrossRef PubMed
- H. L. Chiou, M. F. Wu, Y. C. Liaw, Y. W. Cheng, R. H. Wong, C. Y. Chen and H. Lee, Cancer, 2003, 97, 1558–1563 CrossRef PubMed
- J. Das, I. Ivanov, E. H. Sargent and S. O. Kelley, J. Am. Chem. Soc., 2016, 138, 11009–11016 CrossRef CAS PubMed
- Z. Fang, L. Soleymani, G. Pampalakis, M. Yoshimoto, J. A. Squire, E. H. Sargent and S. O. Kelley, ACS Nano, 2009, 3, 3207–3213 CrossRef CAS PubMed
- J. Das, I. Ivanov, L. Montermini, J. Rak, E. H. Sargent and S. O. Kelley, Nat. Chem., 2015, 7, 569–575 CrossRef CAS PubMed
- P. Mahmoodi, M. Rezayi, E. Rasouli, A. Avan, M. Gholami, M. Ghayour Mobarhan, E. Karimi and Y. Alias, J. Nanobiotechnol., 2020, 18, 1–12 CrossRef PubMed
- S. Jampasa, W. Wonsawat, N. Rodthongkum, W. Siangproh, P. Yanatatsaneejit, T. Vilaivan and O. Chailapakul, Biosens. Bioelectron., 2014, 54, 428–434 CrossRef CAS PubMed
- E. H. Yoo and S. Y. Lee, Sensors, 2010, 10, 4558–4576 CrossRef PubMed
- S. O. Catarino, R. O. Rodrigues, D. Pinho, J. M. Miranda, G. Minas and R. Lima, Micromachines, 2019, 10, 593 CrossRef PubMed
- X. Su, J. Zhang, D. Zhang, Y. Wang, M. Chen, Z. Weng, J. Wang, J. Zeng, Y. Zhang, S. Zhang, S. Ge, J. Zhang and N. Xia., Micromachines, 2020, 11, 352 CrossRef PubMed
- S. Tripathi and A. Agrawal, Trans. Indian Natl. Acad. Eng., 2020, 5, 217–220 CrossRef
- V. F. Annese, S. B. Patil, C. Hu, C. Giagkoulovits, M. A. Al-Rawhani, J. Grant, M. Macleod, D. J. Clayton, L. M. Heaney, R. Daly, C. Accarino, Y. D. Shah, B. C. Cheah, J. Beeley, T. R. J. Evans, R. Jones, M. P. Barrett and D. R. S. Cumming, Microsyst. Nanoeng., 2021, 7 Search PubMed
- M. S. Maria, P. E. Rakesh, T. S. Chandra and A. K. Sen, Sci. Rep., 2017, 7, 1–12 CrossRef PubMed
- M. S. Maria, T. S. Chandra and A. K. Sen, Microfluid. Nanofluid., 2017, 21, 1–21 CrossRef CAS
- M. S. Maria, P. E. Rakesh, T. S. Chandra and A. K. Sen, Biomicrofluidics, 2016, 10, 1–15 CrossRef PubMed
- Q. Gao, Y. Chang, Q. Deng and H. You, Anal. Methods, 2020, 12, 2560–2570 RSC
- A. Homsy, P. D. van der Wal, W. Doll, R. Schaller, S. Korsatko, M. Ratzer, M. Ellmerer, T. R. Pieber, A. Nicol and N. F. de Rooij, Biomicrofluidics, 2012, 6, 1–9 CrossRef PubMed
- M. Zimmermann, H. Schmid, P. Hunziker and E. Delamarche, Lab Chip, 2007, 7, 119–125 RSC
- Q. Pan, L. Ye, Z. Deng, L. Li and H. Liu, J. Immunoassay Immunochem., 2014, 35, 368–377 CrossRef CAS PubMed
- S. Yang, F. Zhang, Z. Wang and Q. Liang, Biosens. Bioelectron., 2018, 112, 186–192 CrossRef CAS PubMed
- K. Y. Goud, A. Hayat, G. Catanante, S. M. Satyanarayana, K. V. Gobi and J. L. Marty, Electrochim. Acta, 2017, 244, 96–103 CrossRef CAS
- J. Das, I. Ivanov, T. S. Safaei, E. H. Sargent and S. O. Kelley, Angew. Chem., Int. Ed., 2018, 57, 3711–3716 CrossRef CAS PubMed
- Y. Lee, D. M. Kim, Z. Li, D. E. Kim and S. J. Kim, Lab Chip, 2018, 18, 915–922 RSC
- V. Tuan and V. T. T. Houng, Ukr. Math. J., 2005, 57, 296–306 CrossRef
- MicroChem, 2014.
- Y. Hu, S. Hua, F. Li, Y. Jiang, X. Bai, D. Li and L. Niu, Biosens. Bioelectron., 2011, 26, 4355–4361 CrossRef CAS PubMed
- J. Khandurina, T. E. McKnight, S. C. Jacobson, L. C. Waters, R. S. Foote and J. M. Ramsey, Anal. Chem., 2000, 72, 2995–3000 CrossRef CAS PubMed
- T. H. Fang, N. Ramalingam, D. Xian-Dui, T. S. Ngin, Z. Xianting, A. T. Lai Kuan, E. Y. Peng Huat and G. Hai-Qing, Biosens. Bioelectron., 2009, 24, 2131–2136 CrossRef CAS PubMed
- Z. Li, Y. Bai, M. You, J. Hu, C. Yao, L. Cao and F. Xu, Biosens. Bioelectron., 2021, 177, 112952 CrossRef CAS PubMed
- B. Li, G. Pan, N. D. Avent, R. B. Lowry, T. E. Madgett and P. L. Waines, Biosens. Bioelectron., 2015, 72, 313–319 CrossRef CAS PubMed
- C. Chan, J. Shi, Y. Fan and M. Yang, Sens. Actuators, B, 2017, 251, 927–933 CrossRef CAS
- A. Singh, G. Sinsinbar, M. Choudhary, V. Kumar, R. Pasricha, H. N. Verma, S. P. Singh and K. Arora, Sens. Actuators, B, 2013, 185, 675–684 CrossRef CAS
- Visby Point of Care Test, https://www.visbymedical.com/sexual-health-test/.
Footnotes |
| † Electronic supplementary information (ESI) available. See DOI: https://doi.org/10.1039/d1nr08252c |
| ‡ These authors contributed equally. |
| This journal is © The Royal Society of Chemistry 2022 |