 Open Access Article
Creative Commons Attribution 3.0 Unported Licence
The kesterite–stannite structural transition as a way to avoid Cu/Zn disorder in kesterites: the exemplary case of the Cu2(Zn,Mn)SnSe4
Galina
Gurieva
*a,
Sara
Niedenzu
ab,
Nikita
Siminel
c,
Alexandra
Franz
a and
Susan
Schorr
ab
aHelmholtz-Zentrum Berlin für Materialien und Energie, 14109 Berlin, Germany. E-mail: galina.gurieva@helmholtz-berlin.de
bFreie Universität Berlin, Institute of Geological Sciences, 12249 Berlin, Germany
cInstitute of Applied Physics, Academy of Sciences of Moldova, MD-2028 Chisinau, Moldova
First published on 14th July 2022
Abstract
The solid solution series between Cu2ZnSnSe4, crystallizing in the kesterite type structure, and Cu2MnSnSe4, adopting the stannite type structure, i.e. Cu2(Zn1−xMnx)SnSe4, was studied by a combination of neutron and X-ray powder diffraction. Powder samples with 0 ≤ x ≤ 1 were synthesized by the solid state reaction of the pure elements and it was confirmed by wavelength-dispersive X-ray spectroscopy that each contained a homogeneous, off-stoichiometric quaternary phase. The lattice parameters and cation site occupancy factors were determined simultaneously by the Rietveld analysis of the neutron and X-ray powder diffraction data. The refined site occupancy factors were used to determine the average neutron scattering length of the cation sites in the crystal structure of the Cu2(Zn1−xMnx)SnSe4 mixed crystals, from which a cation distribution model was derived. For the end member Cu2ZnSnSe4, the disordered kesterite structure was confirmed and for Cu2MnSnSe4, the stannite structure was confirmed. The cross-over from the kesterite to stannite type structure by Zn2+ ↔ Mn2+ substitution in the Cu2Zn1−xMnxSnSe4 solid solution can be seen as a cation re-distribution process among the positions (0, 0, 0), (0, ½, ¼) and (0, ¼, ¾), including Cu+, Zn2+ and Mn2+. The Sn4+ cation does not take part in this process and remains on the 2b site. Moreover, the cross-over is also visible in the ratio of the lattice parameters c/(2a), showing a characteristic dependence on the chemical composition. The order parameter Q, the quantitative measure of Cu/BII disorder (BII = Zn and Mn), shows a distinct dependence on the Mn/(Mn + Zn) ratio. In Zn-rich Cu2(Zn1−xMnx)SnSe4 mixed crystals, the order parameter Q ∼ 0.7 and drops to Q ∼ 0 (complete Cu/BII disorder) in the compositional region 0.3 ≥ x ≥ 0.7. In Mn-rich Cu2(Zn1−xMnx)SnSe4 mixed crystals, adopting the stannite type structure, the order parameter reaches almost Q ∼ 1 (order). Thus, it can be concluded that only Mn-rich Cu2(Zn1−xMnx)SnSe4 mixed crystals do not show Cu/BII disorder. A similar trend of the dependence on the chemical composition of both Cu/BII-disorder and the band gap energy Eg in Cu2(Zn1−xMnx)SnSe4 mixed crystals was observed.
Introduction
In the last decade, quaternary chalcogenides, especially kesterite type semiconductors like Cu2ZnSn(S,Se)4 (CZTSSe), have gained a lot of attention as they can be used as absorbers in thin film solar cells. In contrast to the widely studied absorber material Cu(In,Ga)Se2 (CIGS), kesterites consist of earth abundant and non-toxic elements. CZTSSe is applied as absorber layer in the only critical raw material free photovoltaic technology promising also low costs.Recently, a power conversion efficiency record of 13.2%1 was reported for a CZTSSe-based thin film device in which, as usual, the polycrystalline CZTSSe absorber layer shows an off-stoichiometric composition.
Kesterite type compounds tolerate strong deviations from the stoichiometric composition, keeping the kesterite type structure but showing cation ratios Cu/(Zn + Sn) and Zn/Sn of lower or higher than one. This structural flexibility originates from the propensity of the kesterite type structure to stabilize copper vacancies, anti-sites, and interstitials. The charge balance is ensured by appropriate substitutions on the cation sites. Thus, the off-stoichiometric composition corresponds to certain point defects. This correlation is the basis for the off-stoichiometry type model,2 realized in off-stoichiometry types named A to L.3 These intrinsic point defects (vacancies, anti-sites and interstitials) determine the electronic properties of the semiconductor significantly.4 It is agreed in the literature that the large band tailing observed in kesterite type semiconductors causes voltage losses, limiting the device efficiency.5
Additionally, a special kind of structural disorder, Cu/Zn disorder6 (CuZn and ZnCu anti-sites in lattice planes perpendicular to the crystallographic ![[c with combining right harpoon above (vector)]](https://www.rsc.org/images/entities/i_char_0063_20d1.gif) -axis at z = ¼ and ¾, {004} lattice planes), is always present in kesterite type compounds3,7–12 and has been discussed as a possible reason for band tailing as well.5 But to separate the CuZn and ZnCu anti-site point defects which cause the Cu/Zn disorder from point defects correlated with the off-stoichiometric composition of the kesterite type semiconductor according to the off-stoichiometry type is a very complex problem.
-axis at z = ¼ and ¾, {004} lattice planes), is always present in kesterite type compounds3,7–12 and has been discussed as a possible reason for band tailing as well.5 But to separate the CuZn and ZnCu anti-site point defects which cause the Cu/Zn disorder from point defects correlated with the off-stoichiometric composition of the kesterite type semiconductor according to the off-stoichiometry type is a very complex problem.
Only a few experimental methods allow the determination of the Cu/Zn disorder directly. Conventional X-ray diffraction methods fail, because Cu1+ and Zn2+ are isoelectronic cations and thus have essentially the same scattering factor for X-rays. But anomalous X-ray diffraction and neutron diffraction overcome this problem, and especially neutron diffraction has been proven to be an extremely efficient experimental method to determine the distribution of isoelectronic cations in a crystal structure. Neutron diffraction has been applied to study the crystal structure, structural disorder and point defects in a number of kesterite type materials3,7–12
In order to minimize or avoid Cu/Zn disorder, cation mutation strategies can be applied. Alloying the crystal structure of the material can change it from the kesterite to stannite type to completely avoid this disorder. Both crystal structures are based on tetrahedra in which each anion is surrounded by two Cu+, one divalent and one Sn4+ cation (Cu2BIISnX cation tetrahedron), but these tetrahedra are differently arranged. In doing so, the stacking sequence of the lattice planes perpendicular to the crystallographic ![[c with combining right harpoon above (vector)]](https://www.rsc.org/images/entities/i_char_0063_20d1.gif) -axis changes from Cu–Sn/Cu–Zn/Sn–Cu/Zn–Cu/Cu–Sn (with disorder in the Cu–Zn planes) in the kesterite type structure to BII–Sn/Cu–Cu/Sn–BII/Cu–Cu/BII–Sn (with BII = alloyed divalent cation) in the stannite type structure. Moreover, the crystal symmetry changes from I
-axis changes from Cu–Sn/Cu–Zn/Sn–Cu/Zn–Cu/Cu–Sn (with disorder in the Cu–Zn planes) in the kesterite type structure to BII–Sn/Cu–Cu/Sn–BII/Cu–Cu/BII–Sn (with BII = alloyed divalent cation) in the stannite type structure. Moreover, the crystal symmetry changes from I![[4 with combining macron]](https://www.rsc.org/images/entities/char_0034_0304.gif) (kesterite type structure) to I
(kesterite type structure) to I![[4 with combining macron]](https://www.rsc.org/images/entities/char_0034_0304.gif) 2m (stannite type structure). Details of the two crystal structures are summarized in Table 1.
2m (stannite type structure). Details of the two crystal structures are summarized in Table 1.
Such a cross-over from the kesterite to the stannite type structure was previously described for the Cu2(Zn1−xFex)SnS4 solid solution series.6 Whereas kesterite type Cu2ZnSnS4 shows Cu/Zn disorder, stannite type Cu2FeSnS4 does not show this type of cation disorder. Due to the presence of Cu/Zn disorder in Cu2ZnSnS4, the crystal structure of the material was named the disordered kesterite type structure.13
The quaternary compound semiconductor Cu2MnSnSe4 adopts the stannite type structure.14 By substituting Zn2+ by Mn2+ (Zn2+ ↔ Mn2+) in kesterite type Cu2ZnSnSe43, the Cu/Zn disorder should be suppressed. Thus, within the Cu2(Zn1−xMnx)SnSe4 solid solution series, a cross-over between these two crystal structures is expected and stannite type mixed crystals should not show Cu/Mn disorder.
In this work, we correlate the crystal structure, Cu/Zn disorder and intrinsic point defect scenario in Cu2(Zn1−xMnx)SnSe4 mixed crystals with the band gap energy of the quaternary semiconductors. Neutron diffraction enables us to differentiate the isoelectronic cations Cu+ and Zn2+, as well as the electronically similar Mn2+, in the crystal structure analysis.15 The neutron diffraction data have been refined by Rietveld analysis using the kesterite as well the stannite type crystal structures as starting models. The average neutron scattering length analysis method15 was applied to determine the cation distribution within the crystal structure, resulting in a cation distribution model for the Cu2(Zn1−xMnx)SnSe4 solid mixed crystals. These investigations enabled us to deduce the complex cation re-distribution process within the crystal structure which transforms the kesterite to the stannite type structure.
Experimental
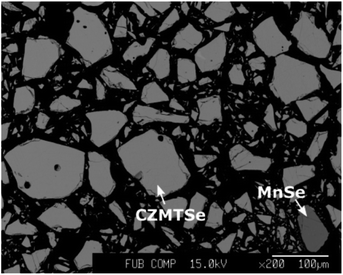
Because neutron diffraction experiments require large sample volumes, powder samples covering the complete Cu2(ZnxMn1−x)SnSe4 solid solution series were synthesized by solid state reactions of the pure elements, which is a proven reliable method for a systematic approach.3,6–11 Weighted stoichiometric mixtures of elemental zinc (5N), copper (5N), tin (5N), manganese (5N) and selenium (6N) were placed in a pyrolytic graphite boat and sealed in evacuated quartz ampoules. Each tube was placed in a one-zone furnace and heated at a rate of 10 K h−1, with intermediate temperature steps of 250 °C and 450 °C held for 48 h each, up to a final temperature of 750 °C. After keeping the final temperature for 300 h, the silica tubes with the samples were cooled to room temperature dynamically by switching off the furnace. An annealing procedure of the samples followed to reach a uniform chemical composition of the quaternary phase. In doing so, the powder was homogenized (by grinding in an agate mortar and pressing pellets) and the sample pellets were annealed for 300 h in evacuated silica tubes in a one-zone furnace at the same final temperature as before. The silica tubes underwent dynamic cooling. The last annealing step was performed at 600 °C (300 h), again followed by dynamic cooling.Backscattered electron (BSE) micrographs (Fig. 1) revealed the presence of different phases in the Mn-rich samples.
Wavelength dispersive X-ray spectroscopy (WDX) was applied to determine the composition of the phases present using an electron microprobe analysis system. In order to obtain reliable results from the WDX measurements, the microprobe system was calibrated using NIST elemental standards. A high accuracy of the compositional parameters was achieved by averaging over 10 local measured points within one grain and averaging over more than 30 grains of the quaternary phase showing the same compositional values. In cases of secondary phases being present, additional grains containing this phase were measured in the same way. Using the measured atomic percentages of the elements, the cation ratios Cu/(BII + Sn) and BII/Sn (BII = Zn and Mn) were calculated. Based on these cation ratios, the chemical compositions of the Cu2(ZnxMn1−x)SnSe4 mixed crystals were deduced by a procedure described elsewhere.8 An overview of the compositions of the quaternary mixed crystals, as well as the occurring secondary phases (when present), is given in Table 2.
| Sample | Cu/(Zn + Mn + Sn) | (Zn + Mn)/Sn | Mn/(Zn + Mn) | Chemical formula | Secondary phase | Off-stoichiometry type |
|---|---|---|---|---|---|---|
| Mn0 | 0.997 | 1.045 | 0.000 | Cu2.01Zn1.03Sn0.98Se4 | G–F | |
| Mn10 | 1.005 | 1.066 | 0.104 | Cu2.02Zn0.93Mn0.11Sn0.98Se4 | G–F | |
| Mn20 | 0.994 | 1.060 | 0.205 | Cu2.01Zn0.83Mn0.21Sn0.98Se4 | G–F | |
| Mn30 | 0.994 | 1.063 | 0.307 | Cu2.01Zn0.72Mn0.32Sn0.98Se4 | G–F | |
| Mn40 | 0.997 | 1.059 | 0.403 | Cu2.01Zn0.62Mn0.42Sn0.98Se4 | G–F | |
| Mn50 | 0.992 | 1.053 | 0.507 | Cu2.00Zn0.51Mn0.53Sn0.98Se4 | G–F | |
| Mn60 | 0.995 | 1.066 | 0.599 | Cu2.01Zn0.42Mn0.62Sn0.98Se4 | MnSe | G–F |
| Mn70 | 1.018 | 1.052 | 0.693 | Cu2.04Zn0.32Mn0.71Sn0.98Se4 | MnSe | G–F |
| Mn80 | 1.022 | 0.995 | 0.794 | Cu2.03Zn0.21Mn0.79Sn0.99Se4 | MnSe | K–D |
| Mn90 | 1.013 | 1.011 | 0.896 | Cu2.02Zn0.10Mn0.90Sn0.99Se4 | MnSe | F–I |
| Mn100 | 1.036 | 0.988 | 1.000 | Cu2.05Mn0.98Sn0.99Se4 | MnSe | K–D |
The compositional and phase analysis revealed striking differences between Zn-rich and Mn-rich mixed crystals. Zn-rich mixed crystals form homogeneous, single phase Cu2(ZnxMn1−x)SnSe4 compounds with an off-stoichiometric composition and no secondary phases are present. Mn-rich mixed crystals also form homogeneous, single phase Cu2(ZnxMn1−x)SnSe4 compounds with an off-stoichiometric composition but binary secondary phases are present. The off-stoichiometry type of the Cu2(ZnxMn1−x)SnSe4 mixed crystals was determined from the cation ratios according to a procedure reported previously.8 The cation ratio plot (Fig. 2) gives an overview of the synthesized Cu2(ZnxMn1−x)SnSe4 mixed crystals.
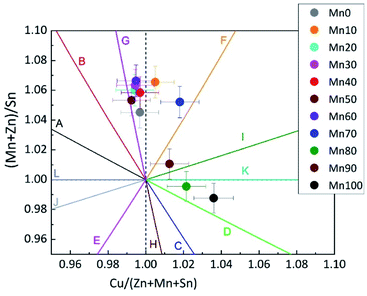 | ||
| Fig. 2 Cation ratio plot showing the Cu2(Zn1−xMnx)SnSe4 mixed crystals synthesized. All of the Zn-rich mixed crystals are located between the G and F type lines. The Mn-rich Cu2(Zn1−xMnx)SnSe4 mixed crystals show a wider spread over the Cu-rich, BII-rich area of the cation ratio plot. Each point refers to a homogeneous, single phase quaternary phase. The off-stoichiometry types refer to Table 4 and ref. 12. | ||
X-ray diffraction (XRD) measurements of the polycrystalline powders were performed on a Panalytical X’Pert Pro MPD in the X-ray CoreLab of the Helmholtz-Zentrum Berlin für Materialien und Energie (HZB) using Bragg–Brentano geometry with a focusing beam and Cu-Kα(1+2) radiation. An instrumental setup with a sample spinner, a ¼ divergence slit, and a 5 mm mask were chosen. The measurements were performed over a 2θ range from 10° to 130° with steps of 0.013° and a measuring time of 100 s per step. The X-ray diffraction patterns of the polycrystalline powder samples within this study were analyzed by LeBail refinements16 using the FullProf Suite software package17 in order to obtain the lattice parameters of the Cu2(ZnxMn1−x)SnSe4 phase (see Table 3). Using the lattice parameters a and c, the tetragonal distortion c/2a was calculated. The distinct change in the composition dependent c/2a behaviour (“kink”) is the first hint of the kesterite–stannite structural transition (Fig. 3). A similar type of “kink” was previously observed in the solid solution series Cu2(Zn1−xFex)SnS4.6
| Sample | Mn/(Zn + Mn) | a, Å | c, Å | c/2a |
|---|---|---|---|---|
| Mn0 | 0.000 | 5.698(1) | 11.349(2) | 0.9959(2) |
| Mn10 | 0.104 | 5.701(1) | 11.364(2) | 0.9967(2) |
| Mn20 | 0.205 | 5.705(1) | 11.381(2) | 0.9975(2) |
| Mn30 | 0.307 | 5.709(1) | 11.399(2) | 0.9983(2) |
| Mn40 | 0.403 | 5.712(1) | 11.415(2) | 0.9992(2) |
| Mn50 | 0.507 | 5.717(1) | 11.431(2) | 0.9997(2) |
| Mn60 | 0.599 | 5.721(1) | 11.445(2) | 1.0003(2) |
| Mn70 | 0.693 | 5.731(1) | 11.431(2) | 0.9973(2) |
| Mn80 | 0.794 | 5.746(1) | 11.404(2) | 0.9923(2) |
| Mn90 | 0.896 | 5.756(1) | 11.386(2) | 0.9891(2) |
| Mn100 | 1.000 | 5.766(1) | 11.375(2) | 0.9864(2) |
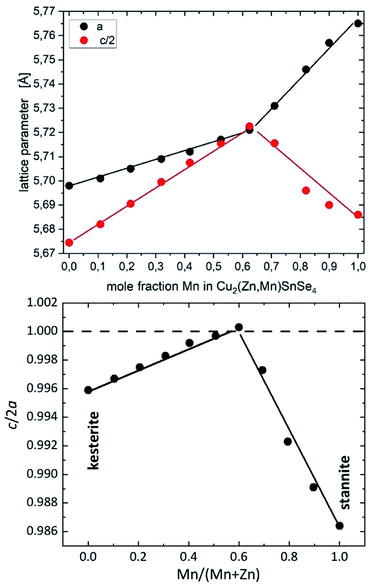 | ||
| Fig. 3 Lattice parameters a and c (top) and tetragonal distortion c/2a (bottom) of Cu2(ZnxMn1−x)SnSe4 mixed crystals depending on the chemical composition. The lines are guides for the eye. | ||
| Type | Composition | Cation substitution reaction | Intrinsic point defects | Formula |
|---|---|---|---|---|
| D | Cu-rich/II-poor/Sn-const | II2+ → 2Cu+ | CuII+ + Cui+ | Cu2+2mII1−mSnSe4 |
| F | Cu-rich/II-rich/Sn-poor | Sn4+→ II2+ + 2Cu+ | IISn2+ + 2Cui+ or CuSn+ + Cui+ + IIi2+ | Cu2(2−x)II2−xSnxSe4 |
| G | II-rich/Sn-poor/Cu-const | Sn4+→ 2II2+ | IISn2+ + IIi2+ | Cu2II1+2xSn1−xSe4 |
| I | Cu-rich/Sn-poor/II-const | Sn4+→ 4Cu+ | CuSn+ + 3Cui+ | Cu2(1+2x)IISn1−xSe4 |
| K | Cu-rich - II/Sn = 1 = const | II2+ +Sn4+ → 6Cu+ | CuII+ + CuSn+ + 4Cui+ | Cu2+6x II1−x Sn1−xSe4 |
Neutron powder diffraction data were collected at the Berlin Research Reactor BER II at HZB using the fine resolution powder diffractometer FIREPOD (E9) (λ = 1.798 Å; ambient temperature).18 Data analysis was done by full pattern Rietveld refinement19 using the FullProf Suite software package.17 The kesterite type structure (space group I![[4 with combining macron]](https://www.rsc.org/images/entities/char_0034_0304.gif) ) with Cu on Wyckoff positions 2a:(0, 0, 0) and 2c:(0, ½, ¼), Zn on 2d:(0, ½, ¾), Sn on 2b:(½, ½, 0) and Se on 8g:(x, y, z),6 as well as the stannite type structure (space group I
) with Cu on Wyckoff positions 2a:(0, 0, 0) and 2c:(0, ½, ¼), Zn on 2d:(0, ½, ¾), Sn on 2b:(½, ½, 0) and Se on 8g:(x, y, z),6 as well as the stannite type structure (space group I![[4 with combining macron]](https://www.rsc.org/images/entities/char_0034_0304.gif) 2m)6 with Mn on Wyckoff position 2a:(0, 0, 0), Cu on 4d:(0, ½, ¼), Sn on 2b:(½, ½, 0) and Se on 8i:(x, x, z), were used as structural models in the Rietveld refinements. The kesterite type structure was applied for mixed crystals with 0 ≤ Mn/(Mn + Zn) ≤ 0.5 and the stannite type structure for mixed crystals with 0.7 ≤ Mn/(Mn + Zn) ≤ 1.0. The mixed crystal with Mn/(Mn + Zn) = 0.6 was refined with both structure models separately. Global profile refinement parameters included a scale factor, a 2θ zero parameter, and parameters of a peak shape function (U, V, W) using a peak full width at half-maximum (FWHM) function of the form FWHM2 = U
2m)6 with Mn on Wyckoff position 2a:(0, 0, 0), Cu on 4d:(0, ½, ¼), Sn on 2b:(½, ½, 0) and Se on 8i:(x, x, z), were used as structural models in the Rietveld refinements. The kesterite type structure was applied for mixed crystals with 0 ≤ Mn/(Mn + Zn) ≤ 0.5 and the stannite type structure for mixed crystals with 0.7 ≤ Mn/(Mn + Zn) ≤ 1.0. The mixed crystal with Mn/(Mn + Zn) = 0.6 was refined with both structure models separately. Global profile refinement parameters included a scale factor, a 2θ zero parameter, and parameters of a peak shape function (U, V, W) using a peak full width at half-maximum (FWHM) function of the form FWHM2 = U![[thin space (1/6-em)]](https://www.rsc.org/images/entities/char_2009.gif) tan
tan![[thin space (1/6-em)]](https://www.rsc.org/images/entities/char_2009.gif) 2θ + V
2θ + V![[thin space (1/6-em)]](https://www.rsc.org/images/entities/char_2009.gif) tan
tan![[thin space (1/6-em)]](https://www.rsc.org/images/entities/char_2009.gif) θ + W. The peak shape function was a Thompson–Cox–Hastings pseudo-Voigt function for the neutron data and a pseudo-Voigt-peak shape for the X-ray data. Profile refinement parameters for the structure were unit cell parameters, metal site occupancies, anion coordinates and isotropic temperature factors. The refinement of the site occupancy factors (SOF) was done without any chemical constraints.
θ + W. The peak shape function was a Thompson–Cox–Hastings pseudo-Voigt function for the neutron data and a pseudo-Voigt-peak shape for the X-ray data. Profile refinement parameters for the structure were unit cell parameters, metal site occupancies, anion coordinates and isotropic temperature factors. The refinement of the site occupancy factors (SOF) was done without any chemical constraints.
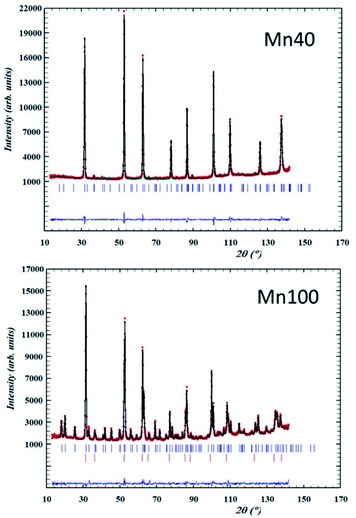
Examples of neutron diffraction patterns and the corresponding Rietveld analysis of the data are shown in Fig. 4.
Diffuse reflectance spectroscopy (DRS) measurements were carried out in air at room temperature by a spectrophotometer equipped with an integrating sphere (PerkinElmer UV/Vis-spectrometer Lambda 750S). The wavelength range of the measurement was adjusted to 800–1800 nm with a step size of 1 nm. Tauc plots were obtained by plotting (F(R) × hν)2versus the photon energy.20 The linear part of the curve was extrapolated to the baseline, and the optical band gap was extracted from the value of the intersection, the same way it was previously reported for Cu2ZnSnS4, Cu2ZnSnSe4 and Cu2ZnGeSe4 powder samples.4
Results
The cation distribution model
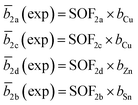
The average neutron scattering length analysis method15,21 was applied to determine the distribution of the cations Cu+, Zn2+, Mn2+ and Sn4+ on the four cation sites of the kesterite type structure (2a, 2b, 2c and 2d), as well as on the three cation sites of the stannite type structure (2a, 2b and 4d). The experimental average neutron scattering lengths![[b with combining macron]](https://www.rsc.org/images/entities/i_char_0062_0304.gif) j(exp) were calculated according to eqn (1) (kesterite structure) and eqn (2) (stannite structure) using the cation site occupancy factors (SOFs) determined by the Rietveld refinement of neutron diffraction data and the neutron scattering length b of the cations (bCu =7.718 fm, bZn = 5680 fm, bMn = −3.73 fm, bSn = 6.225 fm).22
j(exp) were calculated according to eqn (1) (kesterite structure) and eqn (2) (stannite structure) using the cation site occupancy factors (SOFs) determined by the Rietveld refinement of neutron diffraction data and the neutron scattering length b of the cations (bCu =7.718 fm, bZn = 5680 fm, bMn = −3.73 fm, bSn = 6.225 fm).22
Each SOF is indexed by the Wyckoff letter of the corresponding site (SOFj with j = 2a, 2b, 2c and 2d for the kesterite type structure and j = 2a, 4d and 2b for the stannite type structure).
 | (1) |
 | (2) |
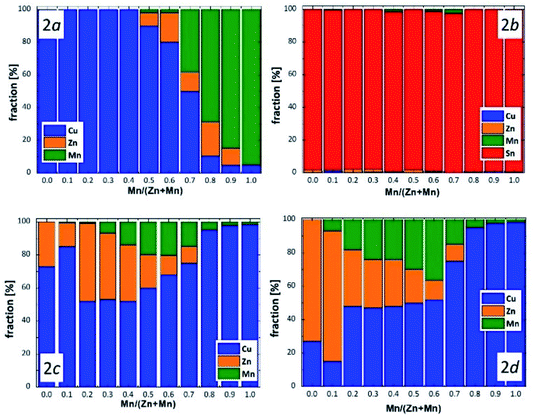
The experimental average neutron scattering lengths calculated by eqn (1) and (2) are compared with the neutron scattering lengths of the cations copper, zinc, manganese and tin (bCu, bZn, bMn, bSn). At a first glance, it becomes obvious that the experimental average neutron scattering length of site 2b (![[b with combining macron]](https://www.rsc.org/images/entities/i_char_0062_0304.gif) 2b(exp)) is almost equal to the neutron scattering length of tin (within an experimental uncertainty) in all the Cu2(Zn1−xMnx)SnSe4 mixed crystals studied (see Fig. 5). This is a strong indication that site 2b is occupied almost exclusively by tin; the resulting cation distribution on site 2b can be seen in Fig. 6.
2b(exp)) is almost equal to the neutron scattering length of tin (within an experimental uncertainty) in all the Cu2(Zn1−xMnx)SnSe4 mixed crystals studied (see Fig. 5). This is a strong indication that site 2b is occupied almost exclusively by tin; the resulting cation distribution on site 2b can be seen in Fig. 6.
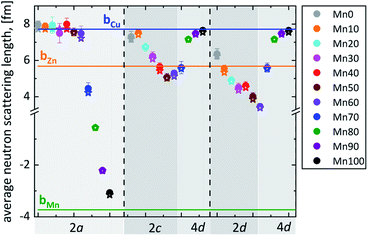 | ||
Fig. 5 Average neutron scattering length ![[b with combining macron]](https://www.rsc.org/images/entities/i_char_0062_0304.gif) j of the cation sites j = 2a, 2c and 2d for Cu2(ZnxMn1−x)SnSe4 mixed crystals with 0 ≤ x ≤ 0.6, as well as j = 2a and 4d for Cu2(ZnxMn1−x)SnSe4 mixed crystals with 0.7 ≤ x ≤ 1 (full symbols – experimental values ( j of the cation sites j = 2a, 2c and 2d for Cu2(ZnxMn1−x)SnSe4 mixed crystals with 0 ≤ x ≤ 0.6, as well as j = 2a and 4d for Cu2(ZnxMn1−x)SnSe4 mixed crystals with 0.7 ≤ x ≤ 1 (full symbols – experimental values (![[b with combining macron]](https://www.rsc.org/images/entities/i_char_0062_0304.gif) j(exp)); star – calculated values ( j(exp)); star – calculated values (![[b with combining macron]](https://www.rsc.org/images/entities/i_char_0062_0304.gif) j(calc)) according to the chosen cation distribution model (Fig. 6); lines – neutron scattering length of the elements Cu, Zn and Mn22). j(calc)) according to the chosen cation distribution model (Fig. 6); lines – neutron scattering length of the elements Cu, Zn and Mn22). | ||
But the situation is significantly different for the other cation sites. The value of the experimental average neutron scattering length of site 2a (![[b with combining macron]](https://www.rsc.org/images/entities/i_char_0062_0304.gif) 2a(exp)) is almost constant at values of bCu within 0 ≤ x ≤ 0.6, and decreases drastically afterwards (Fig. 5). This is a strong indication that the site 2a is almost exclusively occupied by Cu in Cu2(Zn1−xMnx)SnSe4 mixed crystals with 0 ≤ x ≤ 0.6. The strong decrease of
2a(exp)) is almost constant at values of bCu within 0 ≤ x ≤ 0.6, and decreases drastically afterwards (Fig. 5). This is a strong indication that the site 2a is almost exclusively occupied by Cu in Cu2(Zn1−xMnx)SnSe4 mixed crystals with 0 ≤ x ≤ 0.6. The strong decrease of ![[b with combining macron]](https://www.rsc.org/images/entities/i_char_0062_0304.gif) 2a(exp) for x > 0.6 can be explained by the substitution of copper on 2a by manganese. Mn has a negative scattering length, so even a small amount of manganese on the copper site 2a has an enormous influence on the average neutron scattering length of this site. The values of the average neutron scattering lengths
2a(exp) for x > 0.6 can be explained by the substitution of copper on 2a by manganese. Mn has a negative scattering length, so even a small amount of manganese on the copper site 2a has an enormous influence on the average neutron scattering length of this site. The values of the average neutron scattering lengths ![[b with combining macron]](https://www.rsc.org/images/entities/i_char_0062_0304.gif) 2c(exp) and
2c(exp) and ![[b with combining macron]](https://www.rsc.org/images/entities/i_char_0062_0304.gif) 2d(exp) for the cation 2c and 2d sites decrease constantly, as long as
2d(exp) for the cation 2c and 2d sites decrease constantly, as long as ![[b with combining macron]](https://www.rsc.org/images/entities/i_char_0062_0304.gif) 2a(exp) remains constant. This behaviour can be explained by the incorporation of manganese on these cation sites (2c and 2d). As soon as the average neutron scattering length of site 2a (
2a(exp) remains constant. This behaviour can be explained by the incorporation of manganese on these cation sites (2c and 2d). As soon as the average neutron scattering length of site 2a (![[b with combining macron]](https://www.rsc.org/images/entities/i_char_0062_0304.gif) 2a(exp)) decreases, the values of
2a(exp)) decreases, the values of ![[b with combining macron]](https://www.rsc.org/images/entities/i_char_0062_0304.gif) 2c(exp) and
2c(exp) and ![[b with combining macron]](https://www.rsc.org/images/entities/i_char_0062_0304.gif) 2d(exp) (and later
2d(exp) (and later ![[b with combining macron]](https://www.rsc.org/images/entities/i_char_0062_0304.gif) 4d(exp)) increase (see Fig. 5).
4d(exp)) increase (see Fig. 5).
Due to the Cu/Zn disorder present in kesterite type materials, the situations at the 2c and 2d sites are even more complex. Considering the values of the experimental average neutron scattering lengths ![[b with combining macron]](https://www.rsc.org/images/entities/i_char_0062_0304.gif) 2c(exp) and
2c(exp) and ![[b with combining macron]](https://www.rsc.org/images/entities/i_char_0062_0304.gif) 2d(exp), it can be concluded that the copper 2c site is partly occupied by zinc and/or manganese, respectively, decreasing the experimental average neutron scattering length with increasing Mn content in the Cu2(Zn1−xMnx)SnSe4 mixed crystals. On the other hand, the experimental average neutron scattering length of the zinc 2d site indicates a partial occupation by copper first and manganese later, first increasing and later decreasing the average neutron scattering length with increasing Mn content in the Cu2(Zn1−xMnx)SnSe4 mixed crystals.
2d(exp), it can be concluded that the copper 2c site is partly occupied by zinc and/or manganese, respectively, decreasing the experimental average neutron scattering length with increasing Mn content in the Cu2(Zn1−xMnx)SnSe4 mixed crystals. On the other hand, the experimental average neutron scattering length of the zinc 2d site indicates a partial occupation by copper first and manganese later, first increasing and later decreasing the average neutron scattering length with increasing Mn content in the Cu2(Zn1−xMnx)SnSe4 mixed crystals.
Considering the experimentally determined chemical composition of the Cu2(Zn1−xMnx)SnSe4 mixed crystals as obtained by WDX analysis, and assuming that all four cation sites of the kesterite type structure and all three cation sites of the stannite type structure are fully occupied by the cations, the respective cation occupancy of each of the crystallographic sites can be derived with high reliability. Vacancies are not considered here, because the respective off-stoichiometry types of the quaternary mixed crystals (D, F, G, K, I) are not expected to contain vacancies.12
Based on a cation distribution model which is derived from the considerations above and taking into account the according off-stoichiometry type that the mixed crystal belongs to (Table 4), an average neutron scattering length can be calculated according to eqn (3):
 | (3) |
In this calculation, the requirement that the sum of a cation species in the cation distribution model is the cation species amount measured by wavelength dispersive spectroscopy (WDX) in the chemical analysis of the sample has to be taken into account.
 | (4) |
In order to establish a reasonable cation distribution model, the experimental average neutron scattering lengths ![[b with combining macron]](https://www.rsc.org/images/entities/i_char_0062_0304.gif) j(exp) and the calculated average neutron scattering lengths
j(exp) and the calculated average neutron scattering lengths ![[b with combining macron]](https://www.rsc.org/images/entities/i_char_0062_0304.gif) j(calc) are compared, minimizing their difference by varying the cation fractions (k)modelj (agreement within the experimental error). The final cation distribution model for the Cu2(Zn1−xMnx)SnSe4 mixed crystals is presented in Fig. 6.
j(calc) are compared, minimizing their difference by varying the cation fractions (k)modelj (agreement within the experimental error). The final cation distribution model for the Cu2(Zn1−xMnx)SnSe4 mixed crystals is presented in Fig. 6.
The cation re-distribution process in Cu2(Zn1−xMnx)SnSe4 mixed crystals
On the basis of the cation distribution model, it was possible to deduce the cation re-distribution process which transforms kesterite type Cu2(Zn1−xMnx)SnSe4 mixed crystals to stannite type mixed crystals when increasing the Mn content.In detail, this transformation goes in the following way: when starting to substitute Zn by Mn in Cu2ZnSnSe4 (Zn2+ ↔ Mn2+), the substituted Mn occupies the 2c and 2d sites (with a strong preference for the 2d site), whereas the 2a site is fully occupied by copper. When increasing the Mn content above x = 0.4 in the Cu2(Zn1−xMnx)SnSe4 mixed crystals, the substituted manganese occupies the 2a site as well, in addition to the 2c and 2d sites. When a manganese content of x > 0.7 is reached in the Cu2(Zn1−xMnx)SnSe4 mixed crystals, the substituted manganese occupies the 2a site, and the 2c and 2d sites are (nearly) only occupied by copper. It has to be taken into account that the 2c and 2d sites of the kesterite type structure are equivalent to the 4d site of the stannite type structure. Thus, an occupation of the 4d site by copper only and an occupation of the 2a site by the divalent cations of zinc and manganese indicate that the cation re-distribution process is finished and the Cu2(Zn1−xMnx)SnSe4 mixed crystals with x > 0.7 adopt the stannite type crystal structure. It should be noted that the strongest change of the lattice parameter ratio c/2a occurs also in this compositional range.
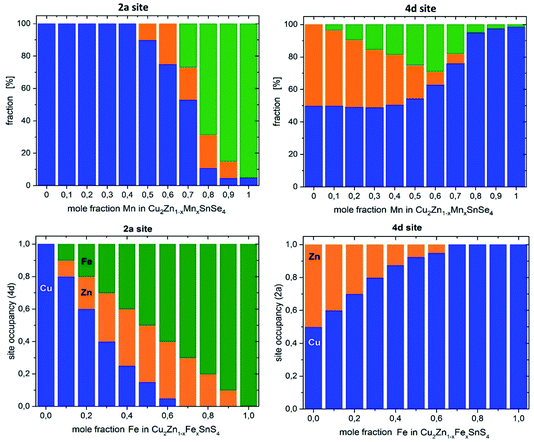
The cation re-distribution process deduced for Cu2(Zn1−xMnx)SnSe4 is quite complex and different from the re-distribution process in the Cu2(ZnxFe1−x)SnS4 series described in the literature;6 a comparison is shown in Fig. 7. In Cu2(ZnxFe1−x)SnS4, the substituted iron (according to Zn2+ ↔ Fe2+) is never present at the 2c and 2d sites (or the corresponding 4d site). The substituted iron always occupies the 2a site. This difference between the cation re-distribution processes may be related to the different divalent cations of iron and manganese, as well the different anions in the two solid solution series. But there is also a common feature of the cation re-distribution process in both series: for x ≥ 0.7, the 4d site is occupied only by Cu, indicating the finished cross-over from the kesterite type to the stannite type crystal structure.
Intrinsic cation point defects in Cu2(Zn1−xMnx)SnSe4 mixed crystals
In addition to the cross-over from the kesterite to stannite type structure, which influences the cation distribution in Cu2(Zn1−xMnx)SnSe4 mixed crystals strongly, changes in the intrinsic cation point defects can be observed.Based on the analysis of the WDX data, most of the Cu2(Zn1−xMnx)SnSe4 mixed crystals can be located in the G–F area of the cation ratio plot (see Fig. 2), whereas the Cu2(Zn1−xMnx)SnSe4 mixed crystal with x = 0.8, as well as the end member of the series, Cu2MnSnSe4, are in the K–D region. The Cu2(Zn1−xMnx)SnSe4 mixed crystal with x = 0.9 is in the F–I area of the cation ratio plot. The obtained intrinsic point defect scenario in the Cu2(Zn1−xMnx)SnSe4 mixed crystals is summarized in Table 5. According to the cation distribution model derived from the average neutron scattering length analysis, all expected off-stoichiometry type related intrinsic cation point defects have been revealed (see Fig. 8). Thus, it can be concluded that the cation re-distribution process does not affect the off-stoichiometry type related intrinsic point defect scenario.
| Sample | 2a site, % | 2c site, % | 2d site, % | 2b site, % | Q | E g, eV | |||||||||
|---|---|---|---|---|---|---|---|---|---|---|---|---|---|---|---|
| Cu | Zn | Mn | Cu | Zn | Mn | Cu | Zn | Mn | Cu | Zn | Mn | Sn | |||
| Mn0 | 100 | — | — | 73 | 27 | 0 | 27 | 73 | 0 | 0.3 | 1.3 | 0 | 98.4 | 0.46 | 0.99 |
| Mn10 | 100 | — | — | 85 | 14.2 | 0.8 | 15 | 78.1 | 6.9 | 1.2 | 0.8 | 0.5 | 97.5 | 0.7 | 0.96 |
| Mn20 | 100 | — | — | 52 | 47 | 1 | 48 | 33.8 | 18.2 | 0.3 | 1.8 | 0 | 97.9 | 0.04 | 0.92 |
| Mn30 | 100 | — | — | 53 | 40 | 7 | 47 | 29 | 24 | 0.4 | 1.8 | 0 | 97.8 | 0.06 | 0.92 |
| Mn40 | 100 | — | — | 52 | 34 | 14 | 48 | 27.9 | 24.1 | 0.5 | 0 | 1.6 | 97.9 | 0.04 | 0.97 |
| Mn50 | 90 | 8 | 2 | 60 | 20 | 20 | 50 | 20 | 30 | 0.1 | 1.7 | 0 | 98.2 | 0 | 0.94 |
| Mn60 | 80 | 18 | 2 | 68 | 11.65 | 20.35 | 52 | 11.65 | 36.35 | 0.4 | 0.5 | 1.4 | 97.7 | 0 | 0.94 |
| Sample | 2a site, % | 4d site, % | 2b site, % | Q | E g, eV | |||||||
|---|---|---|---|---|---|---|---|---|---|---|---|---|
| Cu | Zn | Mn | Cu | Zn | Mn | Cu | Zn | Mn | Cu | |||
| Mn70 | 50 | 11.6 | 38.4 | 75 | 10 | 15 | — | — | 2.4 | 97.6 | 0 | 0.92 |
| Mn80 | 10.6 | 20.5 | 68.9 | 95.1 | — | 4.9 | 0.4 | — | — | 99.6 | 0.804 | 1.02 |
| Mn90 | 4.7 | 10.4 | 84.9 | 97.65 | — | 2.35 | 0.7 | — | — | 99.3 | 0.906 | 1.16 |
| Mn100 | 5 | — | 95 | 98.35 | — | 1.65 | 0.4 | — | — | 99.6 | 0.967 | 1.21 |
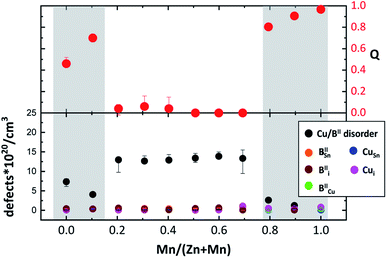 | ||
| Fig. 8 Concentration of Cu2d and BII2c point defects (related to Cu/BII disorder) and CuSn, Cui, IICu, IISn and IIi point defects (related to the off-stoichiometry type), as well as the order parameter Q calculated from the Cu and BII distribution on the Wyckoff positions 2c and 2d (according to eqn (5)) dependent on the Mn/(Mn + Zn) ratio. | ||
Cu/Zn disorder in Cu2(Zn1−xMnx)SnSe4 mixed crystals
Since the discovery of the Cu/Zn disorder during the investigation of the Cu2(Zn1−xFex)SnS4 solid solution series by neutron diffraction,6 it is well known that Cu and Zn are disordered in the 2c and 2d sites of the kesterite type structure, forming CuZn and ZnCu anti-sites. In case of the Cu2(Zn1−xMnx)SnSe4 solid solution studied here, Cu/BII disorder has to be discussed (BII = Zn and Mn), formed by Cu2d and BII2c anti-site defects. It has to be noted, that the concentration of these anti-site point defects is much higher than the concentration of the off-stoichiometry type related defects (see Fig. 8).The presence of Cu/Zn disorder in the end member Cu2ZnSnSe4 is very visible by the significant difference between the experimental average neutron scattering lengths of the 2c and 2d sites and the neutron scattering length of the respective cations, bCu and bZn. It can be found that ![[b with combining macron]](https://www.rsc.org/images/entities/i_char_0062_0304.gif) 2c(exp) < bCu and
2c(exp) < bCu and ![[b with combining macron]](https://www.rsc.org/images/entities/i_char_0062_0304.gif) 2d(exp) > bZn. These scattering length differences can be explained by the formation of intrinsic point defects. In this case, zinc on copper anti-site defects (ZnCu) would decrease the average neutron scattering length of the 2c site because bZn = 5.680 fm < bCu = 7.718 fm; likewise, the copper on zinc anti-site defect (CuZn) would lead to an increase of the average neutron scattering length of the 2d site, in this way forming the Cu/Zn disorder. The resulting cation distribution on the 2c and 2d Wyckoff sites can be seen in Fig. 6 (the equivalent 4d site is shown in Fig. 7). Similar behaviour of the experimental average neutron scattering lengths
2d(exp) > bZn. These scattering length differences can be explained by the formation of intrinsic point defects. In this case, zinc on copper anti-site defects (ZnCu) would decrease the average neutron scattering length of the 2c site because bZn = 5.680 fm < bCu = 7.718 fm; likewise, the copper on zinc anti-site defect (CuZn) would lead to an increase of the average neutron scattering length of the 2d site, in this way forming the Cu/Zn disorder. The resulting cation distribution on the 2c and 2d Wyckoff sites can be seen in Fig. 6 (the equivalent 4d site is shown in Fig. 7). Similar behaviour of the experimental average neutron scattering lengths ![[b with combining macron]](https://www.rsc.org/images/entities/i_char_0062_0304.gif) 2c(exp) and
2c(exp) and ![[b with combining macron]](https://www.rsc.org/images/entities/i_char_0062_0304.gif) 2d(exp) can be recognized for the Cu2(Zn1−xMnx)SnSe4 mixed crystal with x = 0.1 (see Fig. 6 and 7).
2d(exp) can be recognized for the Cu2(Zn1−xMnx)SnSe4 mixed crystal with x = 0.1 (see Fig. 6 and 7).
The cation re-distribution process due to the cross-over from the kesterite to the stannite type crystal structure in the Cu2(Zn1−xMnx)SnSe4 mixed crystals with 0.1 < x < 0.7 introduces the necessity of extending the concept of Cu/Zn disorder to consider both divalent cations (BII with B![[double bond, length as m-dash]](https://www.rsc.org/images/entities/char_e001.gif) Zn and Mn). Cu/BII disorder would be formed by equal amounts of Cu2d and BII2c anti-site defects, respectively. The fact that in Cu2(Zn1−xMnx)SnSe4 mixed crystals with 0.4 < x < 0.7, the divalent cations also partly occupy the 2a site (besides copper), is related to the cation re-distribution process, because the 2a site in the stannite type structure is occupied by the divalent cation exclusively.
Zn and Mn). Cu/BII disorder would be formed by equal amounts of Cu2d and BII2c anti-site defects, respectively. The fact that in Cu2(Zn1−xMnx)SnSe4 mixed crystals with 0.4 < x < 0.7, the divalent cations also partly occupy the 2a site (besides copper), is related to the cation re-distribution process, because the 2a site in the stannite type structure is occupied by the divalent cation exclusively.
Using the derived cation distribution and taking into account the cation re-distribution process, the order parameter Q of the Cu/BII disorder in kesterite type Cu2(Zn,Mn)SnSe4 mixed crystals was calculated according to
 | (5a) |
Eqn (5a) was modified from the definition of the order parameter in the literature23 to introduce the two divalent cations present in Cu2(Zn1−xMnx)SnSe4 mixed crystals. The order parameter is defined so that Q = 0 for complete disorder and Q = 1 for order.
The order parameter Q, calculated by eqn (5a), is shown in Fig. 9. In the end member Cu2ZnSnSe4 and the mixed crystal with x = 0.1, significant Cu/BII disorder is present. Kesterite type Cu2(Zn1−xMnx)SnSe4 mixed crystals with 0.1 < x ≤ 0.7 (compositional region of the cation re-distribution process) show full Cu/BII disorder (Q = 0). In the compositional region where the Cu2(Zn1−xMnx)SnSe4 mixed crystals adopt the stannite type structure (0.7 < x < 1), another type of cation disorder is present. The Cu/BII disorder occurs in the {010} lattice planes (between the 2a and 4d sites). The order parameter Q of the Cu/BII disorder in stannite type mixed crystals was calculated according to
 | (5b) |
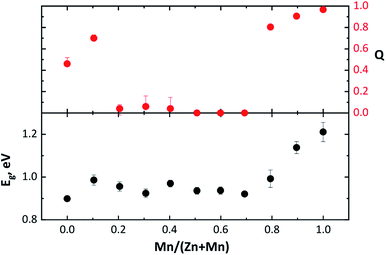 | ||
| Fig. 9 Band gap energy Eg and order parameter Q of Cu2(Zn1−xMnx)SnSe4 mixed crystals dependent on the Mn/(Mn + Zn) ratio. | ||
It increases drastically to values of Q > 0.8, reaching a Q ∼ 1, for the end member Cu2MnSnSe4. This compositional dependent behaviour of the order parameter Q shows that the Cu/BII disorder in Cu2(Zn1−xMnx)SnSe4 mixed crystals is influenced by the cation re-distribution process. The detailed cation distributions, as well as the Q values, are presented in Table 5. It should be noted that the concentration of anti-site point defects correlated to Cu/BII disorder (Fig. 8) is almost an order of magnitude higher than the concentration of each of the off-stoichiometry type related defects.
Band gap energy Eg
In an attempt to correlate the obtained intrinsic cation point defect concentrations and the Cu/BII disorder expressed by the order parameter Q with the optoelectronic properties of Cu2(Zn1−xMnx)SnSe4 mixed crystals, the optical band gap energy Eg was determined by analyzing the DRS data. The results are summarized in Table 5.The dependence of the band gap energy Eg on the Mn/(Zn + Mn) ratio in Cu2(Zn1−xMnx)SnSe4 mixed crystals is shown in Fig. 9. It is found that the band gap energy Eg varies between 0.90 eV for Cu2ZnSnSe4 and 1.21 eV for Cu2MnSnSe4 with a non-linear behaviour.
A comparison of the band gap energy Eg dependence on the Mn/(Zn + Mn) ratio to the dependence of the order parameter Q on the Mn/(Zn + Mn) ratio (Fig. 9) highlights a very similar trend for both dependences. In both cases, the values (Eg and Q) slightly increase with the beginning of the Zn2+ ↔ Mn2+ substitution. In the compositional region of the cation re-distribution process, both Eg and Q drop and stay almost constant. As soon as the Cu2(Zn1−xMnx)SnSe4 mixed crystals adopt the stannite type structure, Eg and Q increase.
Conclusions
Wavelength dispersive X-ray spectroscopy, X-ray and neutron diffraction, and diffuse reflectance spectroscopy were used to investigate the Cu2(ZnxMn1−x)SnSe4 solid solution series, grown by solid state reaction.The site occupancy factors, obtained by simultaneous Rietveld analysis of the neutron and X-ray diffraction data were used to determine the average neutron scattering length of the cation sites in kesterite type Cu2ZnSnSe4, stannite type Cu2MnSnSe4 and Cu2Zn1−xMnxSnSe4 mixed crystals, giving new insights into the cation distribution.
The cross-over from the kesterite to the stannite type structure by Zn2+ ↔ Mn2+ substitution in the Cu2Zn1−xMnxSnSe4 solid solution series can be seen as a cation re-distribution process among the positions at (0, 0, 0), (0, ½, ¼) and (0, ¼, ¾), which includes Cu+, Zn2+ and Mn2+. The Sn4+ cation does not take part in this process and remains on the 2b site. Moreover, the cross-over is visible in the ratio of the lattice parameter ratio c/(2a), showing a characteristic dependence on the chemical composition. A similar behaviour of the lattice parameter ratio was observed for the Cu2(Zn1−xFex)SnS4 solid solution series.6
Starting the Zn2+ ↔ Mn2+ substitution in the Cu2Zn1−xMnxSnSe4 solid solution, substituted manganese occupies the 2c & 2d sites, whereas the 2a site is fully occupied by copper. When the substituted manganese in Cu2(Zn1−xMnx)SnSe4 mixed crystals exceeds 40% (x ≥ 0.4), it also occupies the 2a site, besides the 2c and 2d sites. When reaching a manganese content of 70% (x = 0.7), the substituted manganese overwhelmingly occupies the cation 2a site, whereas the amounts of manganese on the 2c and 2d sites strongly decrease. Thus, these two sites (2c and 2d), which are equivalent to the 4d site in the stannite type structure, are nearly only occupied by copper. It can be concluded that Cu2(Zn1−xMnx)SnSe4 mixed crystals with a manganese content of more than 70% (x ≥ 0.7) adopt the stannite type structure, finishing the structural cross-over.
The off-stoichiometry type related intrinsic point defects have been deduced from the cation distribution model, as well the Cu/BII disorder (BII = Zn and Mn). Interestingly, the order parameter Q, the quantitative measure of Cu/BII disorder, shows a distinct dependence on the Mn/(Mn + Zn) ratio. In Zn-rich Cu2(Zn1−xMnx)SnSe4 mixed crystals, the order parameter shows Q ∼ 0.7 and drops to Q ∼ 0 (complete Cu/BII disorder) in the compositional region 0.3 ≥ x ≥ 0.7. In Mn-rich Cu2(Zn1−xMnx)SnSe4 mixed crystals, adopting the stannite type structure, the order parameter reaches Q ∼ 1 (order). Thus, it can be concluded that only Mn-rich Cu2(Zn1−xMnx)SnSe4 mixed crystals do not show Cu/BII disorder.
The room temperature DRS measurements revealed a strong effect of the order parameter Q on the electronic properties of the studied Cu2(Zn1−xMnx)SnSe4 mixed crystals. A similar trend of the dependence on the chemical composition for both Cu/BII-disorder and band gap energy Eg in Cu2(Zn1−xMnx)SnSe4 mixed crystals was observed.
Author contributions
Galina Gurieva: design of the study, ND measurements and data analysis, conceptualization & writing – original draft, writing – review & editing. Sara Niedenzu: solid state synthesis, WDX & XRD measurements and data analysis. Nikita Siminel: DRS methodology, DRS measurements and data analysis. Alexandra Franz: support in ND measurements (instrument scientist). Susan Schorr: conceptualization, supervision, methodology, writing – review & editing.Conflicts of interest
There are no conflicts to declare.Acknowledgements
We thank HZB for the allocation of neutron diffraction beamtime. We thank the Freie Universitaet Berlin for the allocation of WDX measuring time. The research leading to the presented results has been partially supported by the CUSTOM-ART project funded from the European Union’s Horizon 2020 Research and Innovation Programme under the grant agreement no. 952982. Also, the research leading to the presented results has been partially supported by the INFINITE-CELL projects funded from the European Union’s Horizon 2020 Research and Innovation Programme under the Marie Skłodowska-Curie grant agreement no. 777968.Notes and references
- J. Zhou, X. Xu, B. Duan, H. Wu, J. Shi, Y. Luo, D. Li and Q. Meng, Nano Energy, 2021, 89, 106405 CrossRef CAS.
- A. Lafond, L. Choubrac, C. Guillot-Deudon, P. Deniard and S. Jobic, Z. Anorg. Allg. Chem., 2012, 638, 2571–2577 CrossRef CAS.
- G. Gurieva, L. E. Valle Rios, A. Franz, P. Whitfield and S. Schorr, J. Appl. Phys., 2018, 123, 161519 CrossRef.
- S. Schorr and G. Gurieva, in Crystallography in Materials Science, ed. S. Schorr and C. Weidenthaler, De Gruyter, 2021 Search PubMed.
- T. Gokmen, O. Gunawan, T. K. Todorov and D. B. Mitzi, Appl. Phys. Lett., 2013, 103, 103506 CrossRef.
- S. Schorr, H.-J. Hoebler and M. Tovar, Eur. J. Mineral., 2007, 19, 65–73 CrossRef CAS.
- L. E. Valle Rios, K. Neldner, G. Gurieva and S. Schorr, J. Alloys Compd., 2016, 657, 408 CrossRef CAS.
- G. Gurieva, D. M. Többens, S. Levcenco, T. Unold and S. Schorr, J. Alloys Compd., 2020, 846, 156304 CrossRef CAS.
- G. Gurieva, D. M. Toebbens, M. Ya. Valakh and S. Schorr, J. Phys. Chem. Solids, 2016, 99, 100–104 CrossRef CAS.
- R. Gunder, J. A. Marquez-Prietro, G. Gurieva, T. Unold and S. Schorr, CrystEngComm, 2018, 20, 1491 RSC.
- S. Schorr, Sol. Energy Mater. Sol. Cells, 2011, 95(6), 1482 CrossRef CAS.
- S. Schorr, G. Gurieva, M. Guc, M. Dimitievska, A. Perez-Rodriguez, V. Izquierdo-Roca, C. Schnohr, J. Kim, W. Jo and J. M. Merino, J. Phys.: Energy, 2020, 2, 012002 CAS.
- M. Ya Valakh, V. M. Dzaghan, I. S. Babichuk, X. Fontane, A. Perez-Rodriguez and S. Schorr, JETP Lett., 2013, 98, 255–258 CrossRef.
- V. Sachanyuk, I. Olekseyuk and O. Parasyuk, Phys. Status Solidi A, 2006, 203(3), 459–465 CrossRef CAS.
- S. Schorr, in Neutron Applications in Materials for Energy, ed. G. J. Kearley and V. Peterson, Springer, 2015 Search PubMed.
- A. Le Bail, Powder Diffr., 2005, 20(4), 316–326 CrossRef CAS.
- J. Rodriguez-Carvajal and T. Roisnel, https://www.ill.eu/sites/fullprof/.
- Helmholtz-Zentrum Berlin für Materialien und Energie, E9: The Fine Resolution Powder Diffractometer (FIREPOD) at BER II, Journal of large-scale research facilities JLSRF, 2017, 3, A103 CrossRef.
- H. M. Rietveld, J. Appl. Crystallogr., 1969, 2, 65–71 CrossRef CAS.
- J. Tauc, R. Grigorovici and A. Vancu, Phys. Status Solidi B, 1966, 15, 627–637 CrossRef CAS.
- S. Schorr et al., X-Ray and Neutron Diffraction on Materials for Thin-Film Solar Cells, in Advanced Characterization Techniques for Thin Film Solar Cells, ed. D. Abou-Ras, T. Kirchartz and U. Rau, Wiley-VCH Verlag GmbH & Co. KGaA, 2011, p. 347 Search PubMed.
- A.-J. Dianoux and G. Lander, Neutron Data Booklet, Old City, Philadelphia, 2003 Search PubMed.
- D. M. Többens, G. Gurieva, S. Levcenko, T. Unold and S. Schorr, Phys. Status Solidi B, 2016, 253, 1890–1897 CrossRef.
| This journal is © The Royal Society of Chemistry 2022 |


