Development of a novel cellulose foam augmented with candle-soot derived carbon nanoparticles for solar-powered desalination of brackish water†
Received
3rd December 2021
, Accepted 1st March 2022
First published on 11th March 2022
Abstract
Scarcity of clean water is a worldwide challenge, hampering the further development of human civilization. Solar driven water desalination using solar stills (SS) provides an attractive and sustainable approach to solve this severe challenge by converting brackish water to freshwater using solar energy. However, the low thermal performance and water productivity of this approach are bottlenecks for realizing efficient clean water harvesting from brackish water. Here, we designed and implemented a tubular SS for brackish water purification using fully renewable and locally available materials, namely a novel porous 3-dimensional cellulose foam (CF) modified by deposition of carbon nanoparticles synthesized from candle soot (CSCNPs). With its rough surface, the modified CF could absorb more than 92% of the energy across the solar spectrum. The 3-D interconnected hydrophilic micro-channels of the CSCNP modified foam fibers augment heat localization and promote excellent water transportation. The solar driven evaporation efficiency of the modified tubular SS resulted in a full day water production of 6.40 L m−2 (compared to 2.32 L m−2 for the conventional tubular SS) with peak evaporation efficiency of 360% and significantly lower water cost per liter. The CSCNP modified CF based tubular SS unit thus offers a low-cost and efficient choice for improved solar driven evaporation and freshwater production. The presented work provides new insights into solar driven evaporation/condensation processes and thermal performance during sustainable brackish water desalination and waste-water management.
Environmental significance
Water scarcity is becoming an increasingly pressing issue, particularly for people living in low-income countries where centralized water infrastructure is often lacking. Various desalination methods are available to address the prevailing water scarcity, however, most require advanced infrastructure, and have huge energy requirements for operation which mainly comes from fossil fuels. Using abundant solar energy, solar desalination using solar stills holds great potential for producing fresh water from sea/brackish water, however it has low energy efficiency and water productivity, which has limited its widespread adoption so far. Our work demonstrated a way to convert candle soot, which is considered an air-pollutant, into highly conductive low-cost carbon nanoparticles which are deposited onto cellulose foam with a 3-D interconnected structure and used in a tubular solar still to convert brackish water into potable water. The low-cost device achieves peak water productivity of 6.4 L m−2 under outdoor conditions, with a freshwater cost of 0.009 US $ per liter. The architecture and design principles revealed in the present work will pave the way for highly efficient low-cost passive desalination systems for remote locations and could potentially be used in further solar-thermal applications.
|
1. Introduction
With ongoing rapid growth in worldwide population and tremendous expansion in manufacturing and farming, clean water scarcity is becoming more severe globally, impacting the potential for sustainable environment development.1,2 With the present growth in population, it is expected that by 2025, around 3500 million people will suffer from (clean) water stress.3,4 Substantial efforts have been applied to alleviate the clean water crisis utilizing methods such as multi-effect distillation and reverse osmosis filtration. However, these methods generally require high energy consumption and their engineering requirements have high costs,5 which leads to other adverse ecological problems. Therefore, there is an urgent need to design and develop low-cost, pollution-free sustainable approaches for efficient water purification.6
Solar energy, as an essential source of renewable energy, can be used for seawater or brackish water desalination and wastewater purification, providing an alternate sustainable answer to the severe water crisis.7 Solar based desalination units or solar stills (SS) are low-cost, simple devices with low-maintenance and long-life operation, which are widely used to purify brackish/sea water using solar energy.8 Nevertheless, they possesses low water yield and low thermal efficiency and thus, several modifications have been proposed to augment the performance of SS. Modification of the design of the still, such as pyramid SS9 and hemispherical SS10 have been implemented to improve the performance of the SS. Recently, tubular SS (TSS) are gaining attention owing to their unique design, allowing the absorber of the still to be exposed throughout the day to solar radiation from all directions and eliminating the shadow effect present with other (front-facing) geometries which reduces the intensity of radiation that leads to reduced water yields.11 In addition, the cylindrical shape of the cover in the tubular format provides an optimum geometry for condensed water to easily collect at the outlet, compared to other designs where the condensate water flows along the inclined flat-cover.
The efficiency of solar desalination units can be further improved by enhancing the solar absorption and heat localization. Higher solar-absorption materials allow faster and more efficient absorption of solar energy. When sunlight falls onto a material, an electromagnetic interaction occurs that converts some of the solar energy into other forms such as thermal energy, via a process known as photo-thermal conversion.12,13 Various photo-thermal advanced materials, such as carbon-based,14–22 plasmonic metal-based,23–25 heat localized materials,26 metal–organic framework27 and molybdenum disulfide28 have been explored. However, these nanomaterials are typically expensive, raise environmental concerns (in terms of the energy required for their production, their use of elements that have limited availability in the earth's crust, or as a result of inherent toxicity), are often biologically non-compatible and may require complicated synthesis processes that restricts their large scale usage. To address the aforementioned challenges, cellulose foam (CF) modified with photo-thermal materials have recently attracted huge interest owing to their renewable nature, cheaper cost, excellent porosity and biodegradability, along with their robust mechanical properties. The large specific surface area (SSA) and rough surface of CF makes it conducive to solar radiation capture. In addition, CF exhibits excellent hydrophilicity, which promotes higher transportation of water through the fibres of the foam.15
High grade carbon nanoparticles can be extracted from candle soot (CS) by burning the candle. Till 2007, candle soot was considered as an unwanted pollutant, but Liu et al.29 and Mulay et al.30 reported that the soot is a vital source of carbon nanoparticles. CS derived carbon nanoparticles are produced from the combustion of paraffin wax which generates interconnected porous ‘fractal-like’ nano-sized carbon particles.30 This is an efficient way of converting a household pollutant into a useful nanoparticle for energy applications. The resulting carbon nanoparticles exhibit excellent conductivity with large SSA and a mesoporous structure,30 and are widely used in anode materials,31 supercapacitors and solar cells.32,33
Herein, we demonstrate a simple and effective method for fabricating candle soot carbon nanoparticles (CSCNPs) functionalized cellulose foam (CF) and show its utility in improving the evaporation, thermal performance and water yield of a tubular SS. Three different tubular SS were tested – without any modification, TSS modified with the cellulose foam only (TSS-CF), and TSS modified with the CSCNP-functionalized cellulose foam (TSS-CSCNP-CF) – under the outdoor conditions of Coimbatore, India in July, 2021 and the effect of CSCNP-CF and CF on evaporation and water yield of the TSS were analyzed. Considering the low cost, easy preparation, and high evaporation rate, this foam based brackish water desalination system exhibited great potential for water purification and clean water generation in high-sunshine areas that lack larger-scale water purification infrastructure.
2. Experiments and methods
2.1 Preparation of candle soot carbon nanoparticles (CSCNP)
CSCNPs are collected from a colorless and unscented paraffin wax purchased from the local market in Coimbatore, India. Carbon soot is collected from the flame's tip onto a clean glass slide, and the schematic of soot deposition on glass is depicted in Fig. 1. The glass slide is exposed to the flame tip for 10 min to deposit the soot and then it was collected from the glass. The process of collection of CSCNPs was continued until a sufficient amount of sample was obtained. In this work, a candle of 1.4 cm diameter and 12 cm length generated around 0.52 g of soot after complete burning. The soot may have some unburned paraffin wax which can be completely removed by heat treatment. The soot was thus heat-treated in a muffle furnace at 450 °C for two hours in air to effectively remove any residual wax and to achieve fractal-like carbon nanoparticles.33 The mass of residual paraffin wax was very meager as the soot weight loss was only 4% after the heat treatment. Apart from removing paraffin, the high temperature heat treatment also improves the crystallinity of the synthesized CSCNPs.33
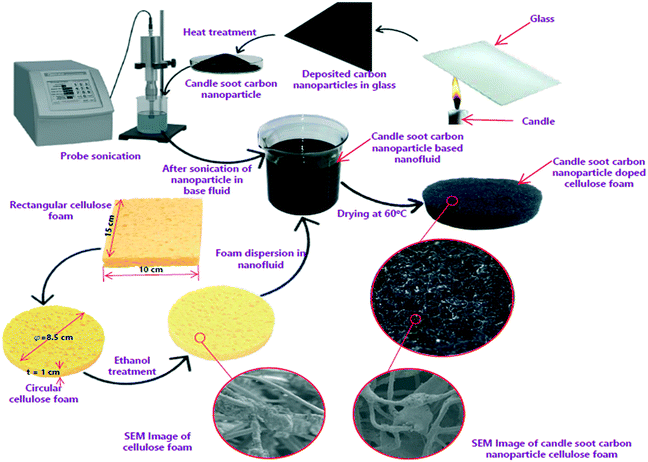 |
| | Fig. 1 Preparation route of candle soot carbon nanoparticles (CSCNPs) and their deposition onto cellulose foam (CF). | |
2.2 Preparation of CSCNP-cellulose foam
The cellulose foam (CF) was purchased from a commercial supplier and exhibited an even surface, which is advantageous for the attachment of CSCNP. The candle soot carbon nanoparticles-cellulose foam (CSCNP-CF) was prepared using the physical liquid deposition method and the steps involved in its preparation are presented in Fig. 1. Firstly, a disc of CF with 8.5 cm diameter and 1 cm thickness was removed from the rectangular CF and was cleaned for 20 minutes with ethanol by sonication, and then thoroughly washed with de-ionized (DI) water. The cleaned CF was placed for 24 hours inside a vacuum drying oven at 50 °C. Meanwhile, 1 g of CSCNP (produced by burning a paraffin wax candle onto a glass sheet) were mixed with 100 mL of DI water and sonicated using a probe sonicator (SM750PS, Samarth Electronics, India) for 60 minutes at 15 kHz to uniformly mix the CSCNP. The CF was immersed into the CSCNP solution and treated by sonication for 100 minutes. Finally, the CF/CSCNP-CF was thoroughly rinsed with DI water, and dried. The adhesion mechanism between the CF and CSCNP is mainly physical adsorption, specifically van der Waals and electrostatic forces. Six identical CF and CSCNP-CF discs were prepared and used in the TSS to evaluate the effect of CSCNP/foam on the evaporation rate inside the TSS.
2.3 Characterization of the CSCNP and CSCNP-CF materials
Scanning electron microscopy (SEM) analysis was carried out to verify the attachment of CSCNP to the CF. The structural morphology of CSCNP, CF and CSCNP-CF were analyzed using field emission (FE)-SEM (CARL ZEISS, USA). Energy dispersive X-ray spectroscopic (EDX) analysis was performed using a Nano-XFlash detector (BRUKER, GERMANY). Nitrogen adsorption–desorption isotherms were measured at 77 K with BELSORP-max (MicrotracBEL Corp. Japan). The SSA was determined by the Brunauer–Emmett–Teller (BET) technique from adsorption isotherms and the pore size and pore volumes were determined by Brunauer-Joyner–Halenda (BJH) analysis. Non-localized density functional theory (NLDFT) and grand canonical Monte Carlo (GCMC) simulations were used to determine the pore size distribution. X-ray Diffraction (XRD; D8-Advance, Bruker, Germany) was used to study the chemical structure of the CSCNP. Raman spectroscopy of the CSCNP was carried out on a confocal Raman microscope (WiTec alpha 300, Germany) to analyse the molecular interactions. Thermogravimetric analysis (TGA) of the CSCNP was conducted using TA Instruments (SDT-Q600, USA) from 30 °C to 800 °C to study nanoparticle decomposition. The optical absorbance behaviours of CF, CSCNP and CSCNP-CF were analyzed using UV-vis spectrophotometry (Perkin Elmer LAMBDA 950). The hydrophilic behavior of CF and CSCNP-CF were examined using a contact angle meter from Dataphysics, GmbH (OCA 20, Germany).
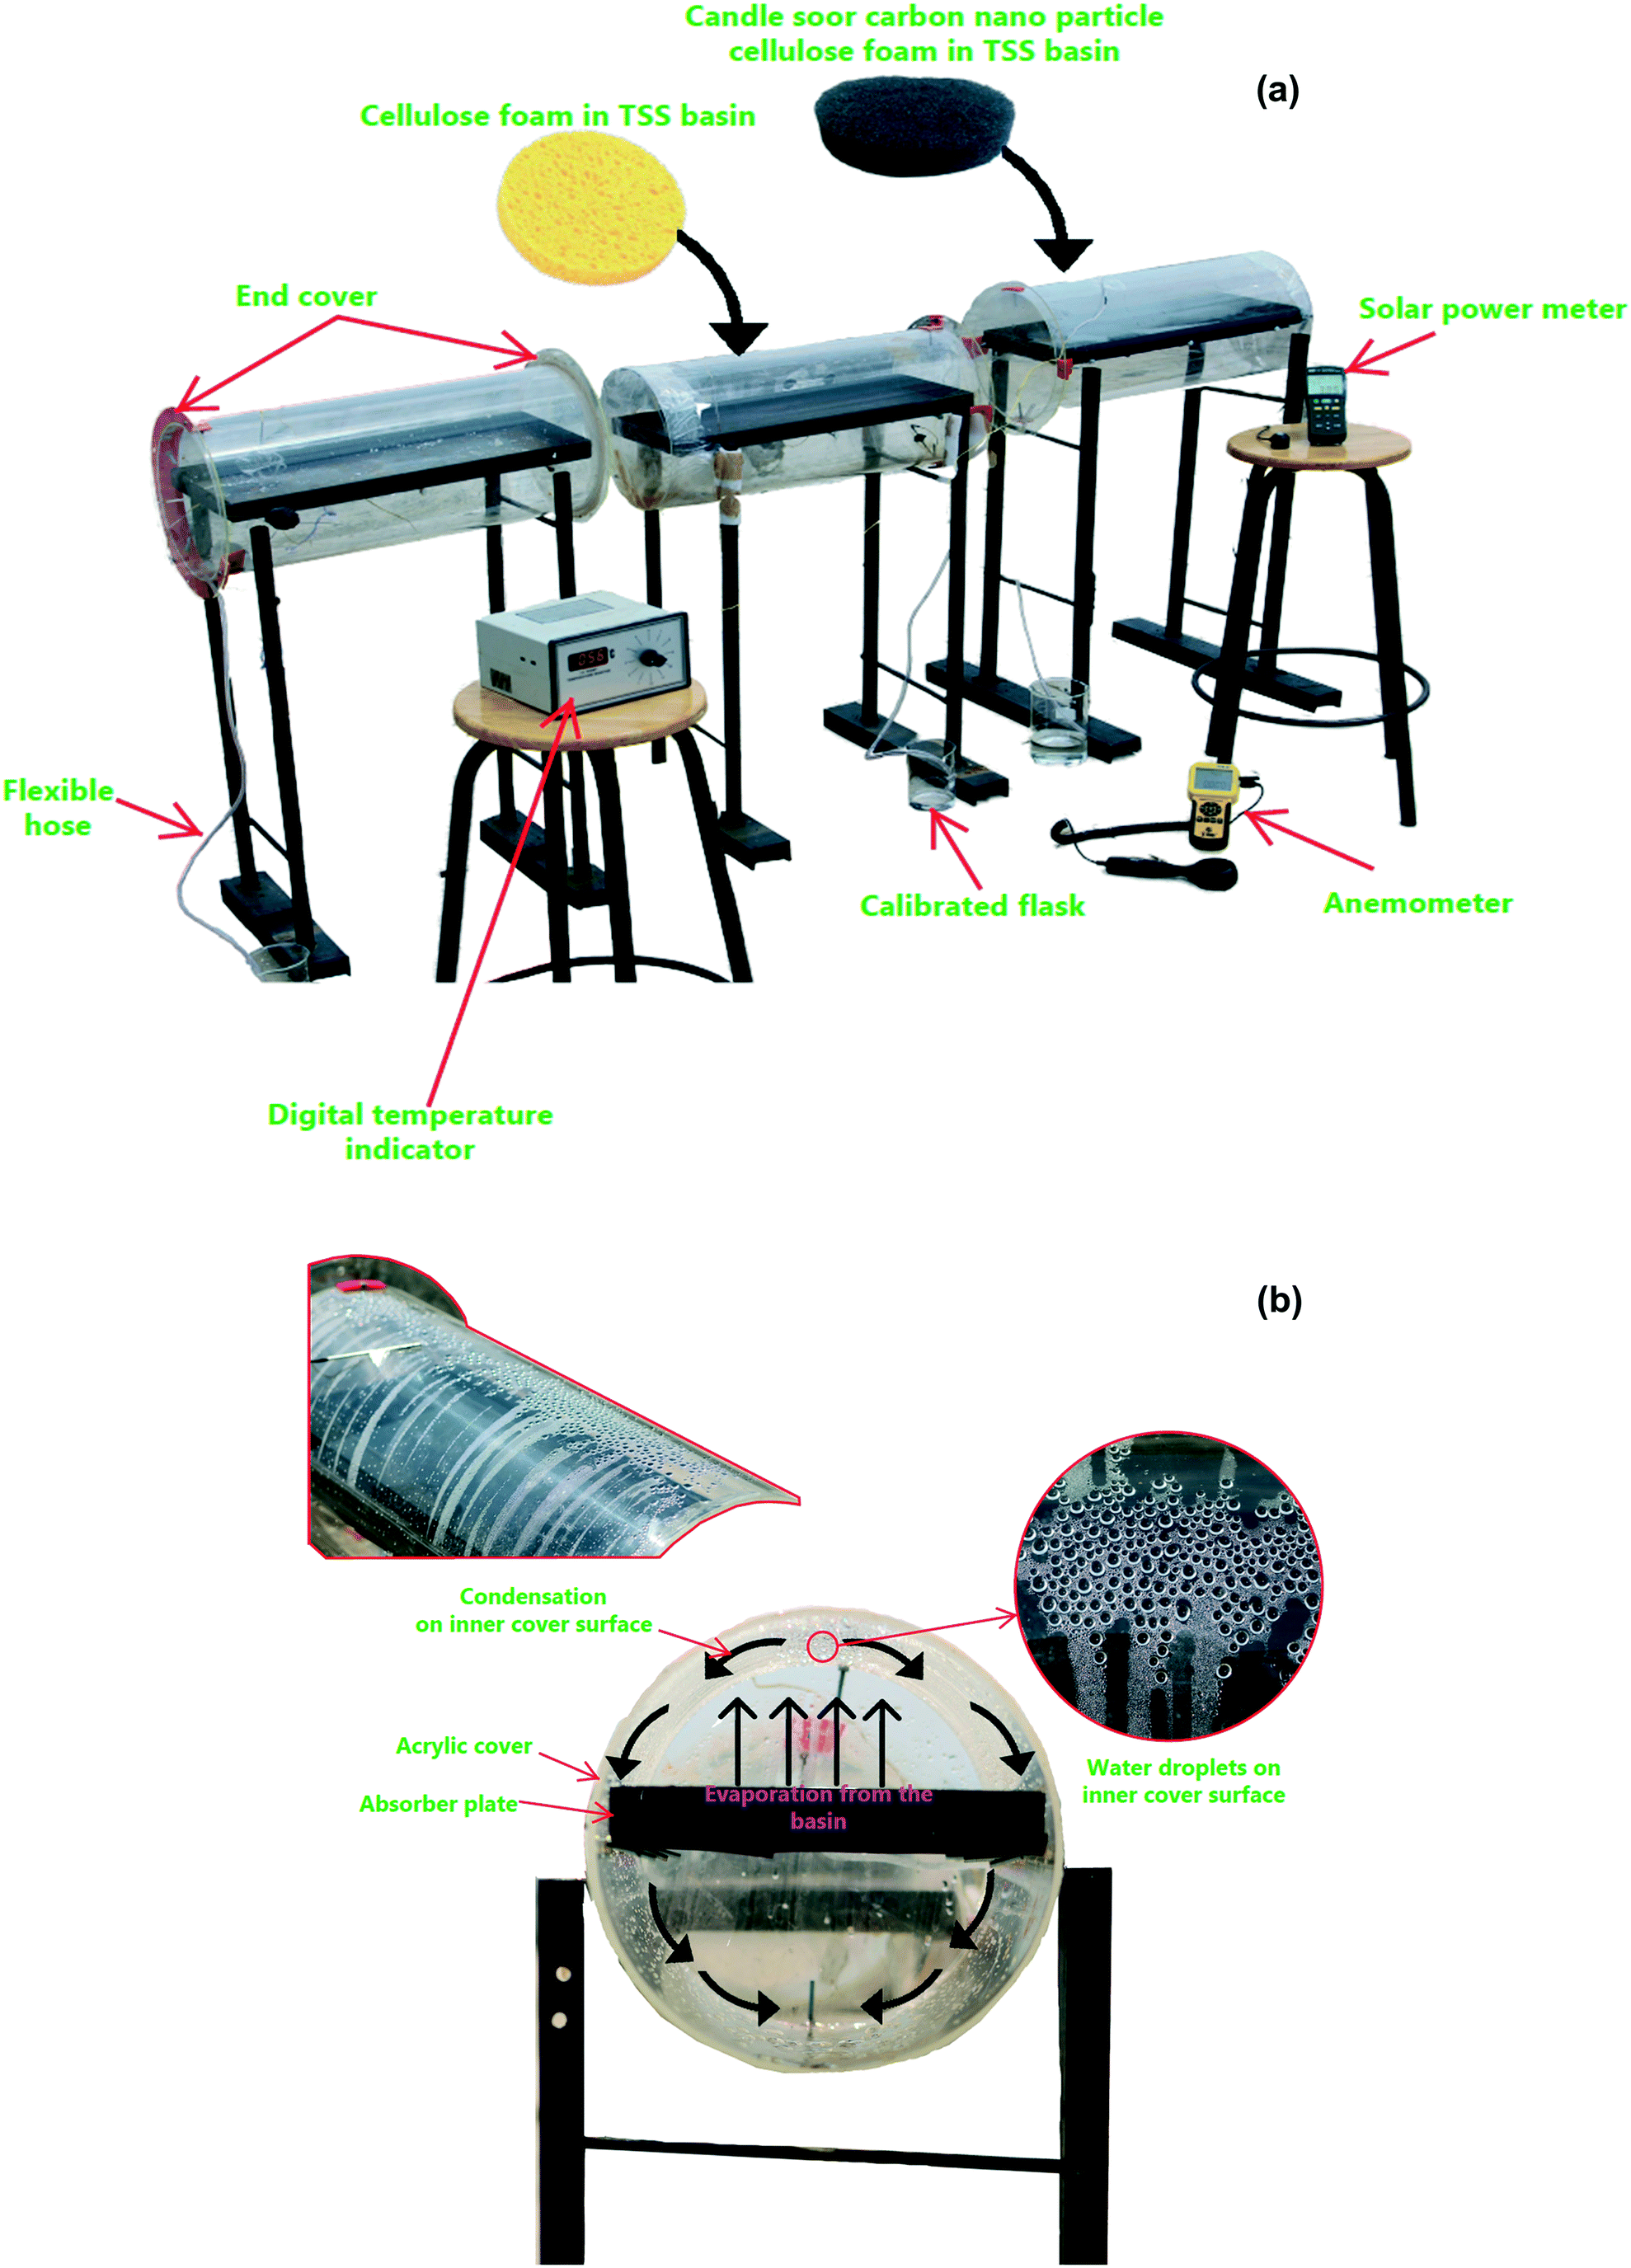
2.4 Outdoor experimental set-up of the tubular SS
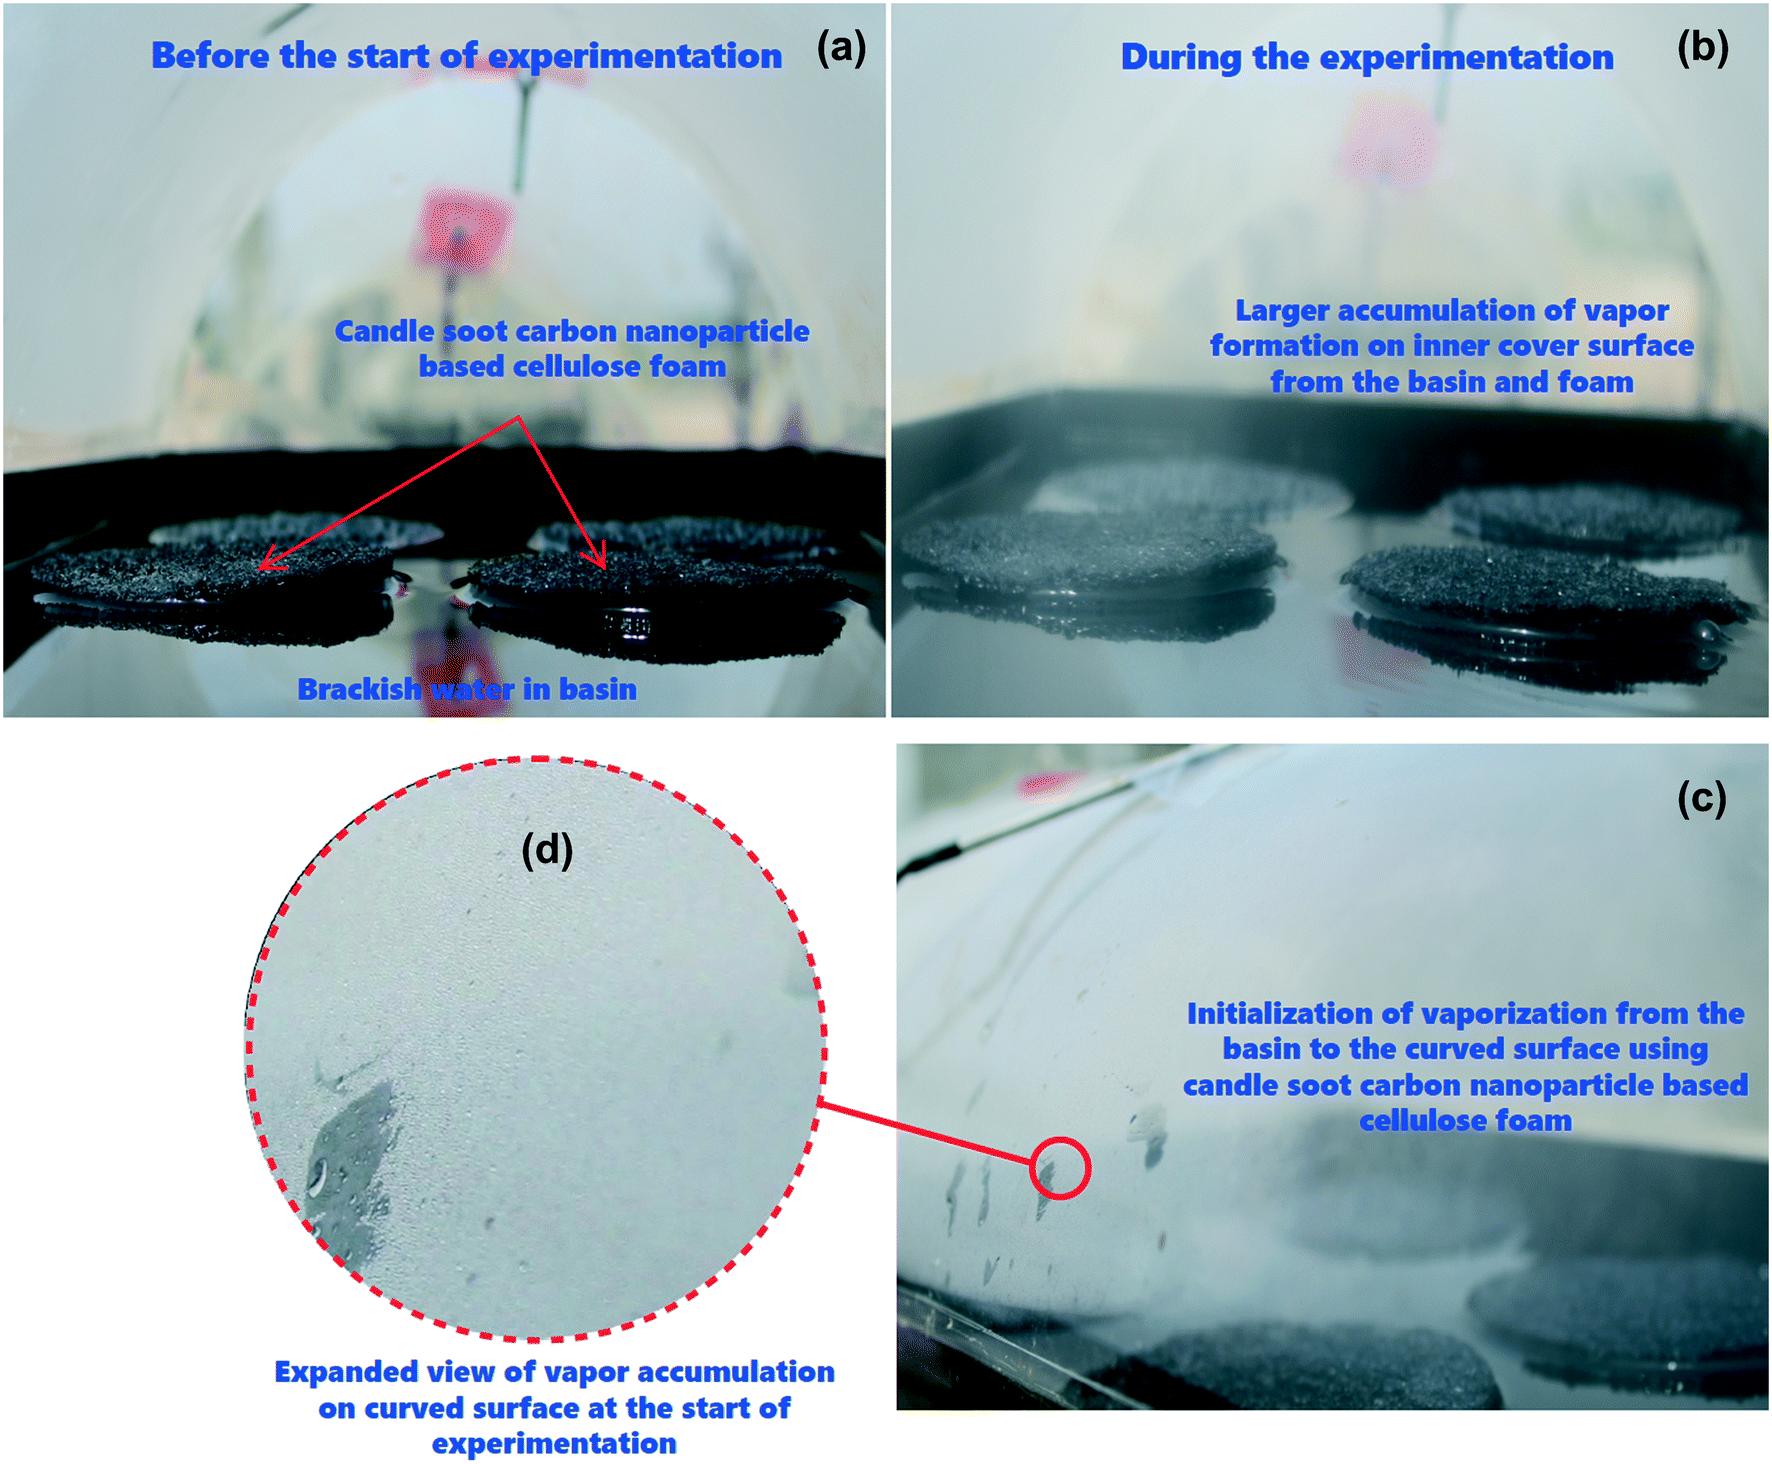
The proposed tubular desalination units were placed on the roof of the Department of Mechanical Engineering, KPR Institute of Engineering and Technology, Arasur, Coimbatore, Tamilnadu, India (latitude 11.08° N and longitude 77.13° E) and outdoor experiments were carried out at atmospheric pressure of 97 kPa (test site pressure). Photographs of the test set-up and close-up images of condensation on the TSS surface are depicted in Fig. 2(a and b). Three identical tubular desalination units – (i) bare tubular solar still (TSS), (ii) tubular solar still with CF (TSS-CF); and (iii) tubular solar still with CSCNP-CF (TSS- CSCNP-CF) - were placed southward facing and their performance was investigated under typical weather conditions in July, 2021. The tubular desalination unit consists of a transparent cylindrical cover with a metallic water basin.
 |
| | Fig. 2 (a) Photograph of the TSS experimental test set-up without CF, functionalized with CF, and functionalized with the CF modified with candle soot derived carbon nanoparticles, (b) photographic view of water droplets condensing on the cover of the TSS. | |
The incident solar radiation falls on the TSS cover, penetrates and reaches the water absorber. Subsequently, the absorber absorbs the incident solar radiation and becomes heated. Accordingly, the brackish feed-water in contact with the absorber gets warm, leading to the initiation of the evaporation process. The generated water vapour then reaches the inner cover surface (under buoyancy) which has a lower temperature and thus condensation of the water vapour starts. Owing to the rounded shape of the transparent cover, the condensate flows to a trough and is collected via a beaker. The tubular desalination unit was made of 4 mm thick transparent acrylic sheeting (transmissivity = 0.88) with an diameter of 290 mm and length of 530 mm. The water basin was fabricated using a 2 mm thick milled steel absorber plate with length, width, and height of 500 mm, 270 mm and 50 mm respectively. A thin layer of black paint was coated onto the absorber to maximize solar absorption and minimize reflection. CF and CSCNP-CF (six of each) were placed inside one of the three water basins (absorber only, CF-absorber, and CSCNP-CF-absorber) to evaluate their impact on water evaporation and water productivity. Brackish water was fed into the basin from a separate water tank (40 L capacity) via a flexible hose. Each TSS was filled with brackish water before the start of the experiment at 9 AM and the basin was refilled with brackish water every hour based on the volume of distillated fresh water output from the respective TSS. The temperature of the water in the still, at the absorber and at the acrylic cover were measured using J-type thermocouples. An anemometer (vane type, AVM-03) was used to measure the wind speed. A solar power meter (TES-132) was used to measure the solar radiation and all ambient parameters and temperatures were recorded on an hourly basis.
Estimation of the freshwater yield was carried out using a calibrated flask. The following equation is applied to assess the propagated uncertainty in the calculation of the yield, based on uncertainties in the measured parameters, of the function X:34
| |  | (1) |
where, ‘
Ux’ represents the propagated uncertainty of ‘
X’ and ‘
Un’ is the uncertainty of measured parameter ‘
xn’. The uncertainties associated with the instruments and the range are provided in
Table 1.
Table 1 Specifications of measuring devices and corresponding uncertainty
| Measurement device |
Measuring range |
Accuracy |
Uncertainty (%) |
| Thermocouple (J-type) |
0–400 °C |
±0.1 °C |
±1.57 |
| Solar power meter (TES-132) |
0–2500 W m−2 |
±10 W m−2 |
±3.56 |
| Anemometer (AM-4832) |
0–25 m s−1 |
±0.1 m s−1 |
±2.34 |
| Calibrated flask |
0–1000 mL |
— |
±1.5 |
3. Evaporation and exergy efficiency analysis of tubular desalination unit
3.1 Evaporation efficiency of the TSS
The evaporation efficiency (ηevap) of the tubular solar desalination units utilized in this work are determined using eqn (2):7| |  | (2) |
where, mw = total freshwater yield of the TSS (kg), Llg = latent heat of evaporation of water (kJ kg−1), Ac = area of the TSS acrylic cover (m2), I = solar radiation (W m−2).
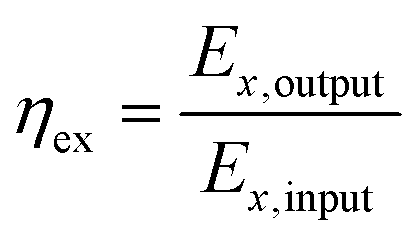
3.2 Second law efficiency analysis of the TSS
The 2nd law efficiency (exergy) of the three TSS was determined using eqn (3):8| | | ∑Ex,input − ∑Ex,output = Ex,destruction | (3) |
where Ex,input = input exergy, Ex,out = output exergy, and Ex,destr = destruction exergy.
The TSS relies completely on solar radiation to work, and thus the exergy input of the TSS is equal to the solar radiation exergy (Ex,sun), which is calculated as follows:
| |  | (4) |
where
Ta = ambient temperature (°C),
Tsun = temperature of the sun (6000 K), and
Aabs = TSS absorber area (m
2).
Exergy output is determined from the following equation:
| |  | (5) |
where,
Tw = water temperature (°C).
The 2nd law efficiency (exergy) of the TSS is determined using eqn (6):
| |  | (6) |
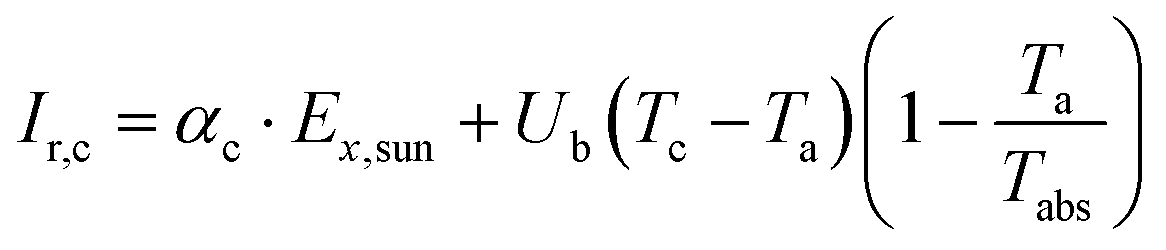
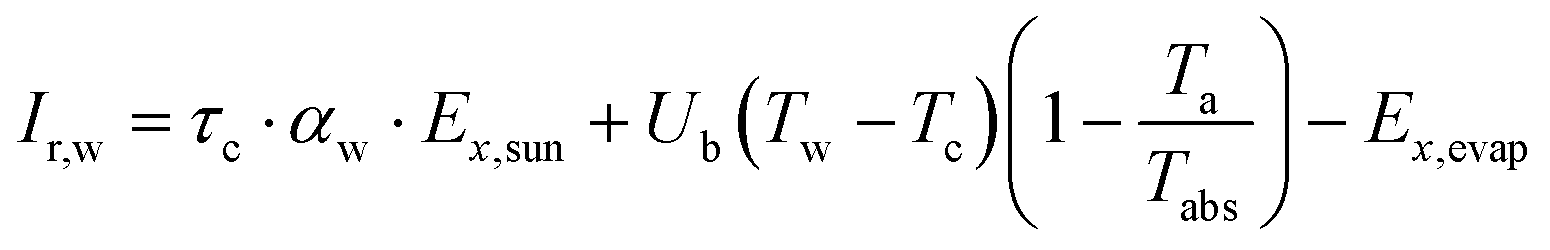
3.3 Rate of irreversibility from TSS cover, water and absorber
The second law efficiency (exergy) of a system that is under equilibrium with the environment is equal to zero. However, irreversibility of the actual processes (i.e., losses to the environment) cause the generation of entropy, which in turn destroys the exergy efficiency.35 Thus, to decrease the irreversibility, significant efforts should be made to determine and reduce the irreversibility effects and thus, to evaluate the rate of irreversibility. The total rate of irreversibility is the summation of the destruction of exergy and loss of exergy.
The rate of irreversibility from the TSS cover is determined using eqn (7):36
| |  | (7) |
The rate of irreversibility from water is determined using
eqn (8):
36| |  | (8) |
The rate of irreversibility from absorber is determined using
eqn (9):
36| |  | (9) |
4. Results and discussion
4.1 Structural characterization of CSCNP and CSCNP-cellulose foam
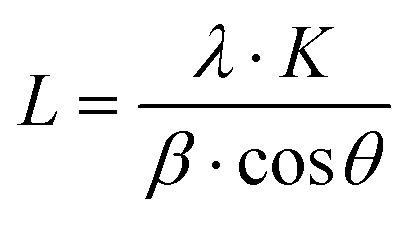
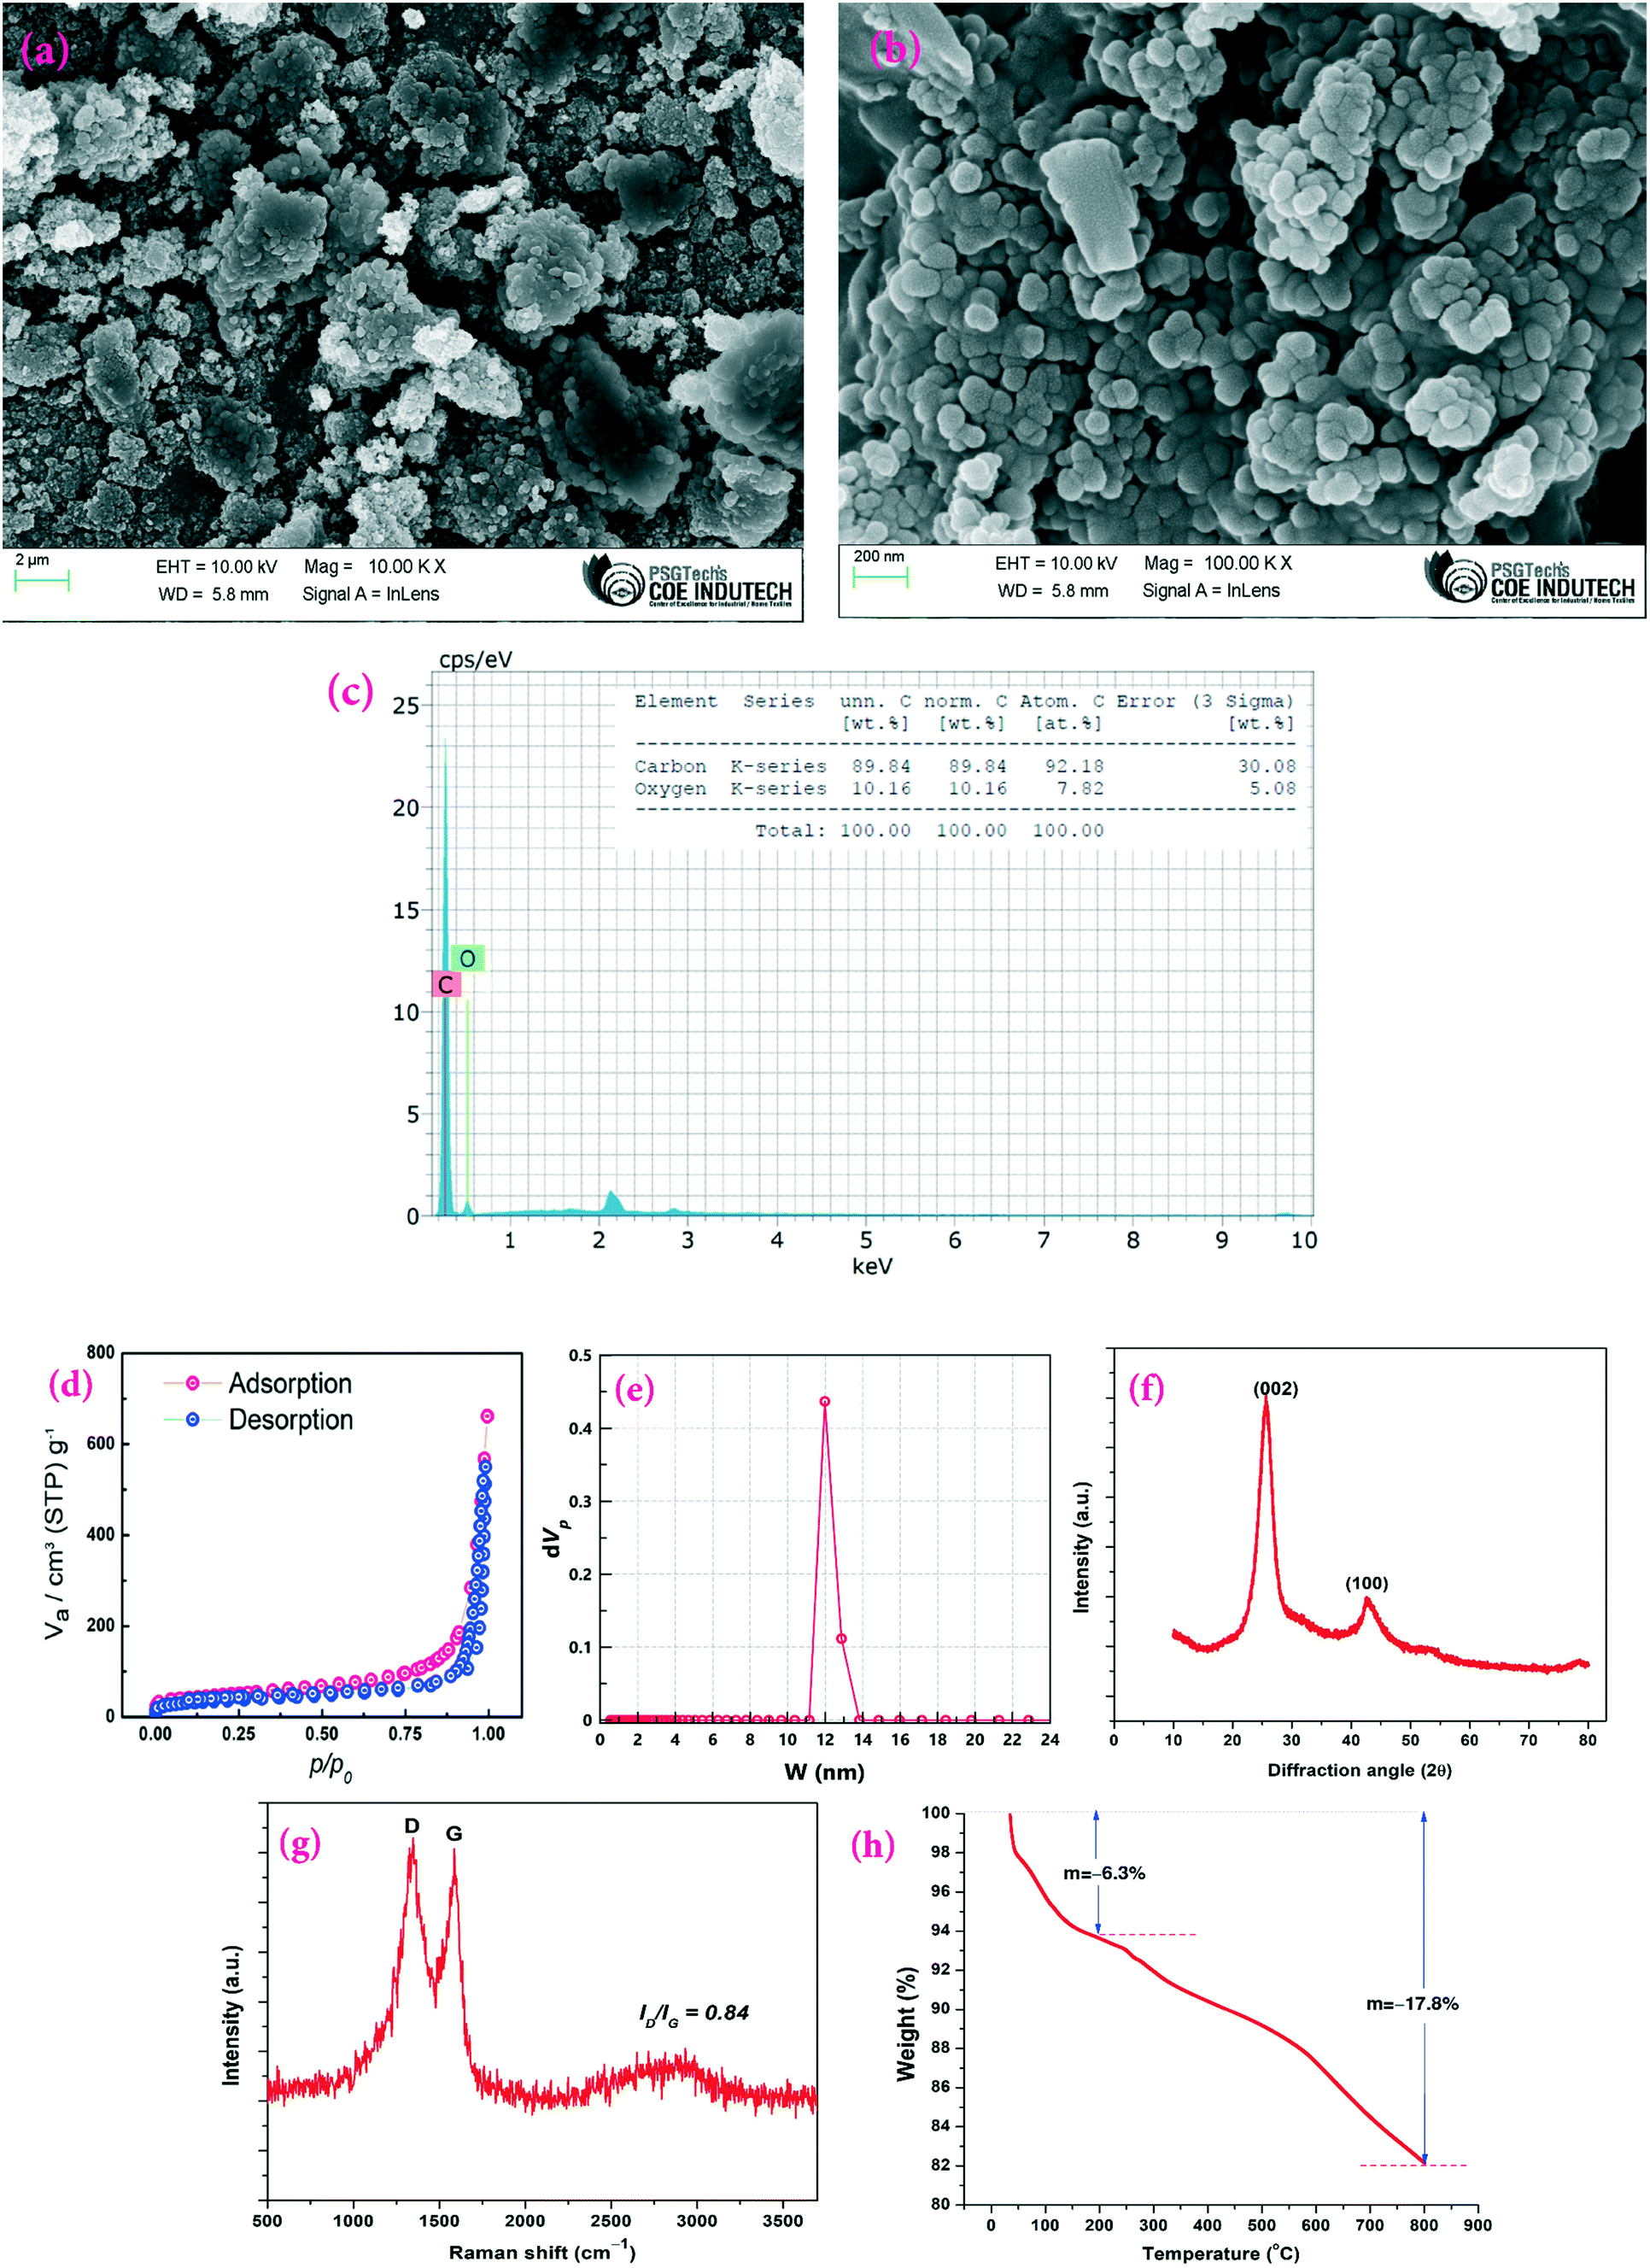
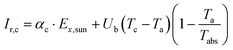
To confirm the morphological structure of the synthesized CSCNP, FE-SEM analysis was carried out and the results are depicted in Fig. 3(a and b). The CSCNPs exhibit a loose ‘fractal like’ network structure formed by carbon particles with the particle size ranging between 50–120 nm. Fig. 3(c) depicts the elemental composition (EDX) of the CSCNP, which clearly highlights the major presence of C (89.84%) and O (10.16%). Similar carbon composition (89–91%) was also reported in previous work.37 The adsorption/desorption isotherms, for analyzing SSA, pore volume and pore diameter of the CSCNP, are depicted in Fig. 3(d and e). From the adsorption–desorption curve in Fig. 3(d), the surface area of the CSCNP was found to be 130.4 m2 g−1 and the total pore volume was 0.797 cm3 g−1. From the pore size distribution analysis by NLDFT/GCMC, peak pore size was found to be 11.98 nm (Fig. 3e). Fig. 3(f) depicts the XRD pattern of the CSCNP, demonstrating prominently two sharp diffraction peaks at 25.5° (002) and 42.7° (100). The broad peak centered at 25.5° (2θ) illustrates that the CSCNP are mostly nano-crystalline in nature. The peak at 42.7° (2θ) mainly resulted from the interlayer scattering of graphene stacks, which clearly demonstrates the existence of graphitic structure.38 The crystallite size of graphite is determined using the Scherrer formula, as per eqn (10):39| |  | (10) |
where, L is the crystallite size of graphite, λ is the wavelength (1.54 × 10⁻¹⁰ m), K (0.9) is the Scherrer constant, β is the full-width at half maximum of the peak (002) in radian and θ is the diffraction angle. The crystallite size of CSCNP was calculated as 3.12 nm. Fig. 3(g) depicts the Raman spectrum of the CSCNP and two distinct bands, D-band (1340 cm−1) and G-band (1593 cm−1) are observed. The G-band represents crystalline graphite, and the high intensity of the G band corresponds to highly graphitized carbon. The D band can only be seen in disordered graphite and indicates the presence of amorphous carbon. The peak at 1340 cm−1 indicates the presence of some disorder in the graphene sheet.
 |
| | Fig. 3 Characterization of the produced CSCNP using SEM micrographs at magnifications of (a) 2 μm and (b) 200 nm; (c) EDX analysis showing the percentage of the elements present; (d) N2 adsorption/desorption isotherm; (e) NLDFT/GCMC pore size distribution analysis; (f) XRD diffractogram; (g) Raman spectrum; and (h) thermogravimetric analysis. | |
Fig. 3(h) presents the TGA analysis of the CSCNPs, enabling evaluation of its mass decomposition under different temperature conditions. As shown in Fig. 3(h), under a nitrogen atmosphere the weight loss in the first stage (room temperature to 200 °C) is ∼6.3%, which is most likely owing to the evaporation of residual water present in the sample. Similar loss for soot was also reported by Bredin et al.40 The weight loss in the second stage (temperature range 200–800 °C) is 11.5% (and ∼17.8% from room temperature to 800 °C), which could be due to the meager fraction of unburned hydrocarbon present in the samples,40 as a result of the heat-treatment.
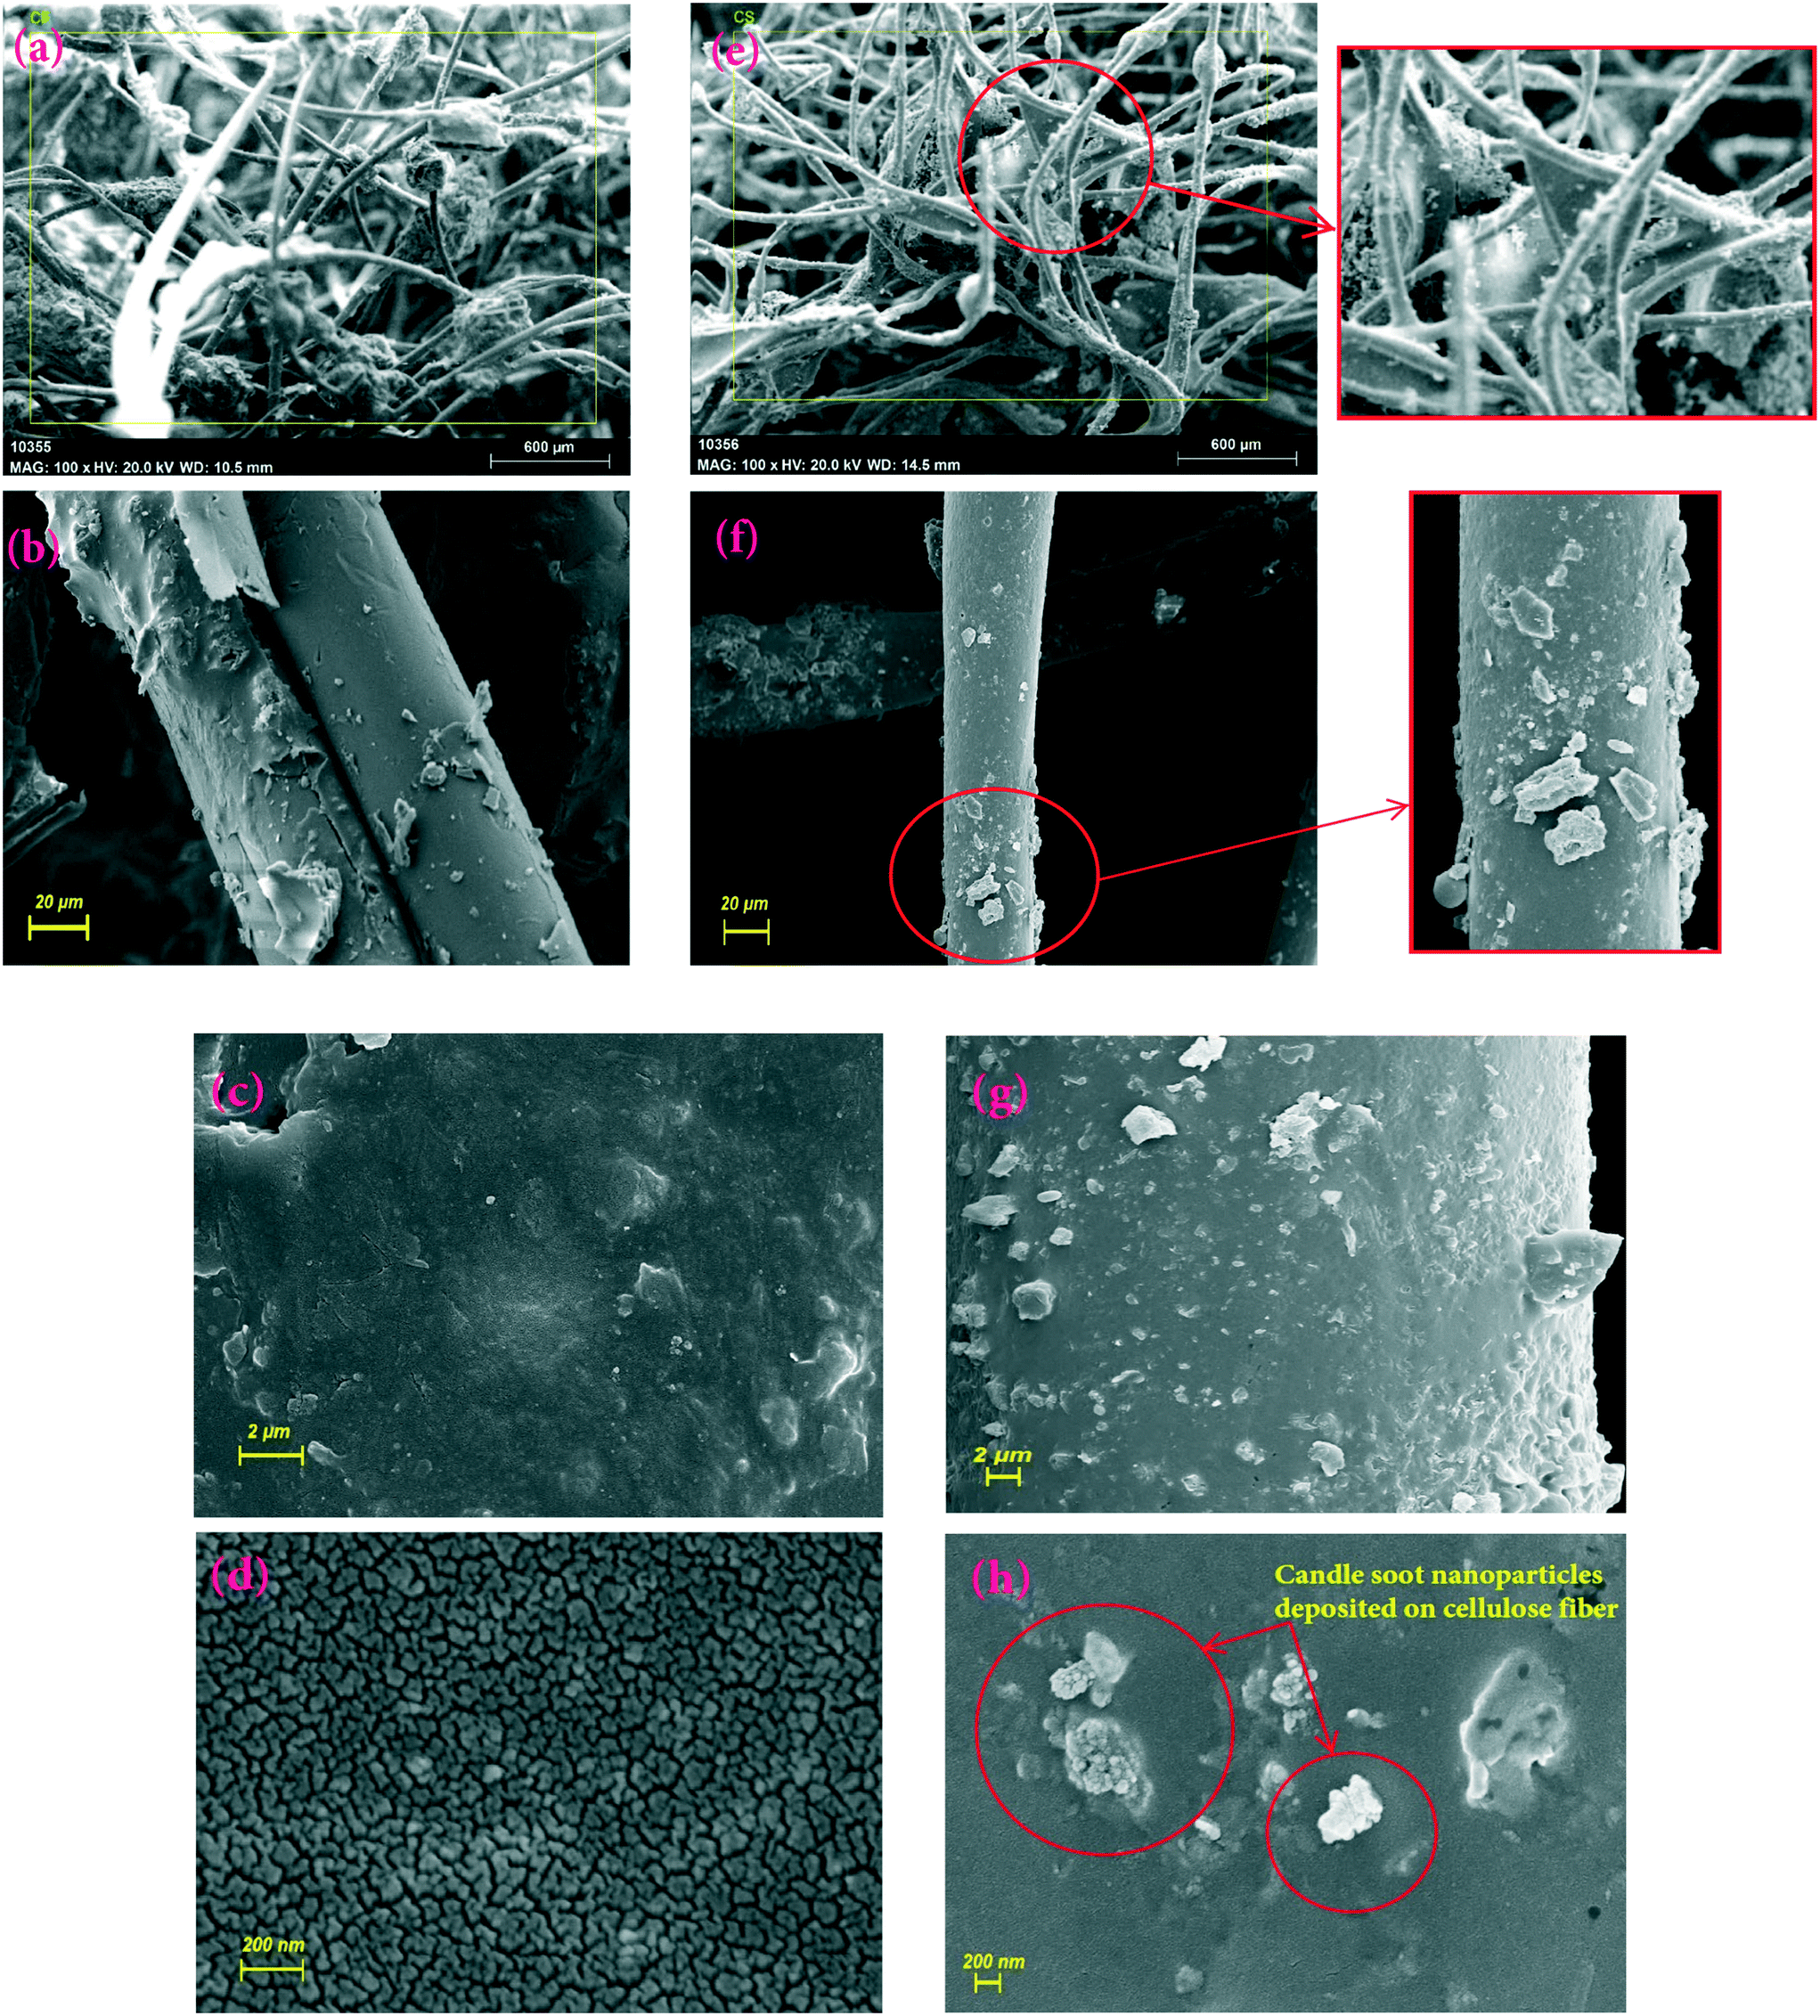
Fig. 4(a–d) presents FE-SEM images of the CF. It clearly exhibits the uneven surface, which is highly beneficial for proper attachment of the CSCNP. It is also important to note that the CF exhibits a 3-D non-aggregated structure, which is highly advantageous for the deposition of CSCNP, and which also supports excellent solar absorption along with faster water evaporation.15 To verify the attachment of CSCNP onto the CF, FE-SEM images of the CF before and after the deposition of CSCNP were compared and evaluated. As can been seen in Fig. 4(e–h), the deposition of CSCNP onto the CF fibers is clearly visible. Red circles display the deposited carbon on the cellulose fiber, and an enlarged view is presented in Fig. 4(e and f). The deposition of CSCNP onto CF will be highly beneficial in improving the solar absorptivity of the foam as well as improving the water evaporation. The CSCNP deposited onto the foam fibers increases the solar absorption behavior owing to the black porous interconnected structure of the CS, which enables faster absorption of the incident radiation and enhances heat transfer across the foam-water interface.
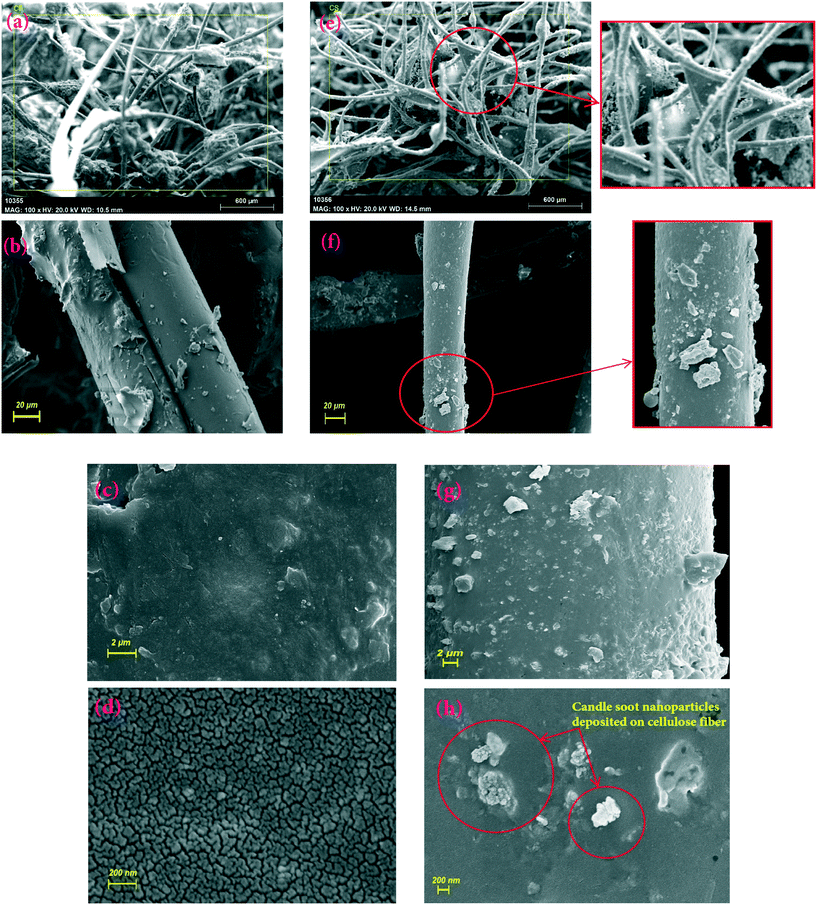 |
| | Fig. 4 (a–d) FE-SEM images of the CF at magnifications of 100X, 500X, 5 KX and 50 KX, and (e–h) FE-SEM images of CF with deposition of CSCNP at magnification of 100X, 500X, 5 KX and 50 KX; red circles indicate CSCNP deposition on the foam fibers, and it is also presented as an enlarged view (e and f). | |
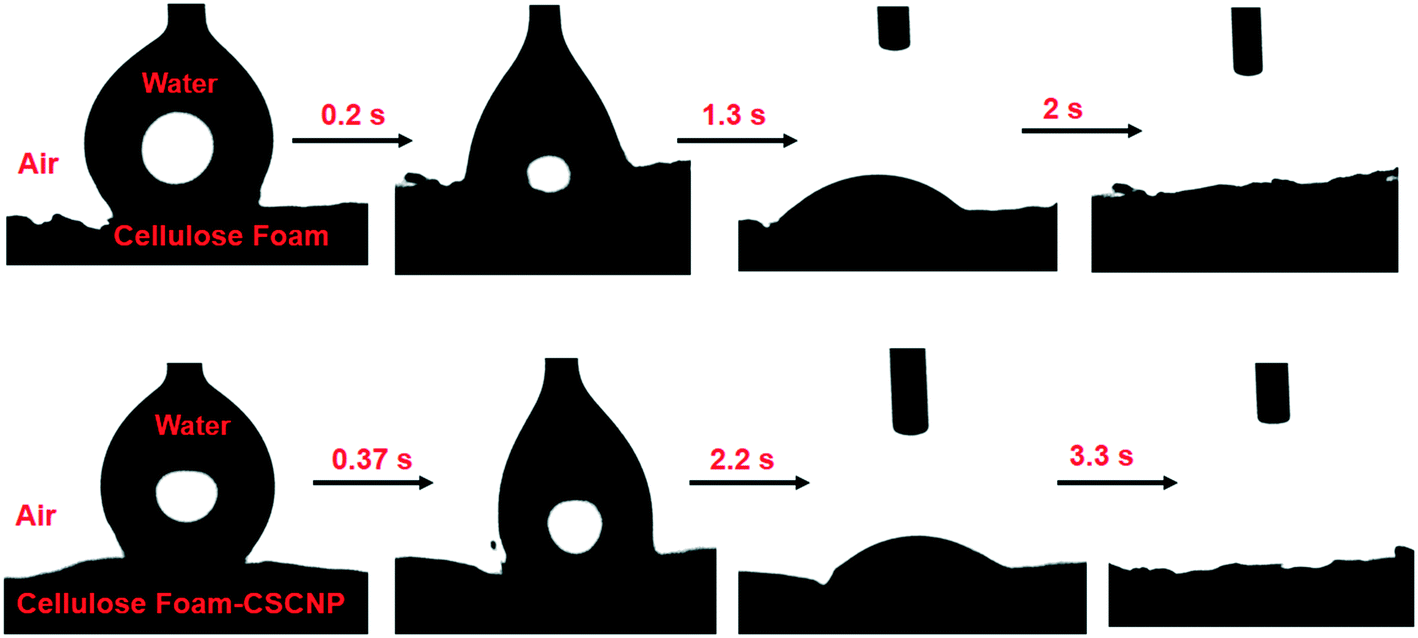
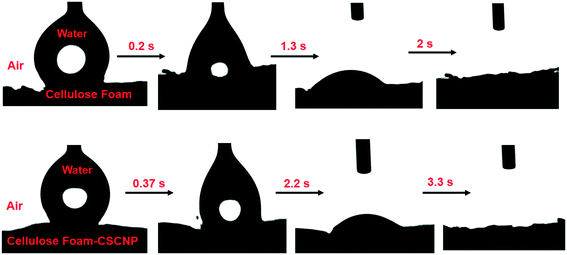
It is important to understand some basic properties of the CF materials modified with CSCNP, especially those factors which are critical in augmenting the rate of evaporation and water generation. The water contact angle (WCA) measurements of CF and CSCNP-CF were conducted to verify their water soaking behavior. Fig. 5 depicts the surface wettability of CF and CSCNP-CF, when a 9 μL water droplet was released through a syringe onto the foams. As the CF possesses a hydrophilic surface, the WCA was almost zero and the CF sample completely absorbs the applied water volume in only 2 s, demonstrating the hydrophilic nature of the sample. With deposition of CSCNPs onto the CF, there was a slight increase in the water absorption time, with CSCNP-CF taking around 3.3 s to completely absorb the water droplet, and thus this surface also exhibited high hydrophilicity.
 |
| | Fig. 5 Water contact angle measurements reveal the hydrophilic nature of the CF and CF-CSCNP surfaces, and indicate the water soaking behaviors with respect to time, captured through different image frames using a contact angle meter. | |
It is important to note that the excellent hydrophilicity of the CF and CSCNP-CF promotes the formation of very thin water films on the foam surfaces and allows fast solar driven evaporation.41 Moreover, the large water absorption capability of the cellulose fibres means that they always maintain a thin layer on the foam surface which promotes faster evaporation from the foam surface, thereby generating higher freshwater yields. To further explore the effect of water absorption for formation of a thin water film on the CF surface, the water holding capacity of CF and CSCNP-CF were examined. CF possesses interconnected-holes (open-pore) throughout its volume leading to the capacity to hold large volumes of water which is advantageous for numerous applications. When placed into water, the air inside the CF is replaced by water and with its excellent hydrophilicity, water spreads rapidly throughout the foam. Water holding capacities for CF and CSCNP-CF were observed to be 210 mL and 158 mL respectively, which is in accordance with the above discussed water soaking behaviours determined through WCA.
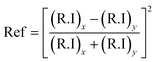
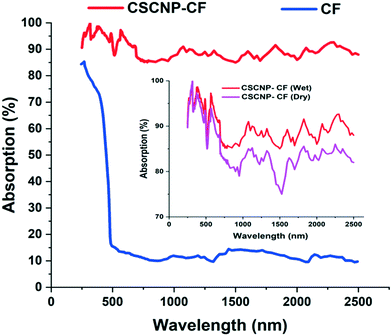
The light absorption potential of the CF and CSCNP-CF in the wavelength range 250–2500 nm is presented in Fig. 6. As seen in Fig. 6, CF in the wet state exhibited excellent absorption behavior in the range 250–400 nm (85–72%), however above 450 nm, there was a significant drop in the absorptivity and CF exhibited average absorption of 13.70% in the wavelength range 500–2500 nm. The optical absorption properties of the foam are crucial for improving the evaporation rate of the water, however the CF exhibited only an average absorption of 25.21% in the wet state. With deposition of CSCNP onto the CF, there was a significant enhancement in the optical absorption behavior of the foam. CSCNP-CF exhibited average absorption of 92.18% in the wavelength range of 250–2500 nm under wet foam conditions. The excellent absorption behavior of the CSCNP-CF could be due to the high-intrinsic absorptivity of the CSCNP coupled with the 3-D structure formed by the CSCNP-CF, which limits light scattering and improves the absorption. It is also interesting to note that the physical condition of the foam plays a vital role in determinating its absorptivity. As seen in Fig. 6 insert, a comparison of the absorptivity of CSCNP-CF under dry and wet conditions is presented. The average absorption of CSCNP-CF in the wet state is 92.18%, while it is 89.59% for the dry state. The higher absorption under wet conditions can be justified by anti-reflection phenomenon and by considering that no light is being transmitted through the CSCNP-CF. By applying the Fresnel formula for reflection, the reflection in dry and wet conditions has been determined. According to the ‘Fresnel equation’, the reflectivity between the two different mediums is determined using eqn (11):15
| |  | (11) |
where (R.I)
x and (R.I)
y are the refractive index of
x and
y medium, respectively. R.I of water, air, and carbon are taken as 1.33, 1.00, and 1.66, respectively.
15
 |
| | Fig. 6 Absorption spectrum of CF and CSCNP-CF; insert: absorption comparison between the dry and wet CSCNP-CF. | |
When there is only air, i.e., when the CSCNP-CF interface is under dry conditions,
| |  | (12) |
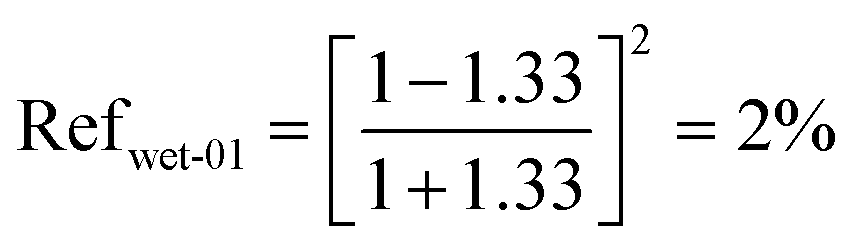
When both air–water and water–CSCNP-CF interfaces are under wet conditions, the reflectivity difference is calculated as:
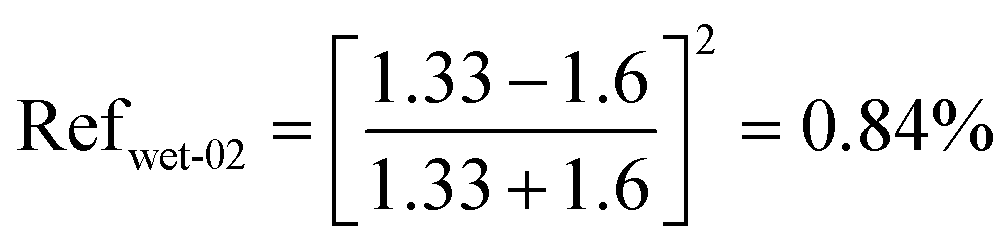
| |  | (13) |
| |  | (14) |
| | | Reftotal,wet = Refwet-01 + Refwet-02 = 2.84% | (15) |
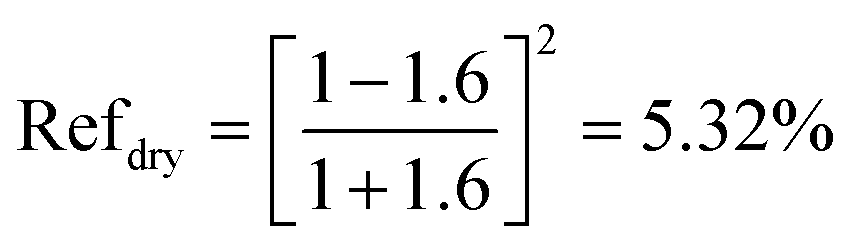
As can be seen, the light reflection through air–water–CSCNP-CF is only 2.84%, whereas the reflection is 5.32% in air–CSCNP-CF under dry conditions. This reduced reflection is generally known as the anti-reflection effect. Thus, the higher absorption behavior of CSCNP-CF in wet conditions will allow excellent absorptivity and improve the water evaporation.
After the development and characterization of the CSCNP enhanced CF, its effect on improving the thermal performance and water yield of the TSS was investigated and is presented in the following section.
4.2 Temperature variations of absorber, water and cover of TSS over a daily cycle
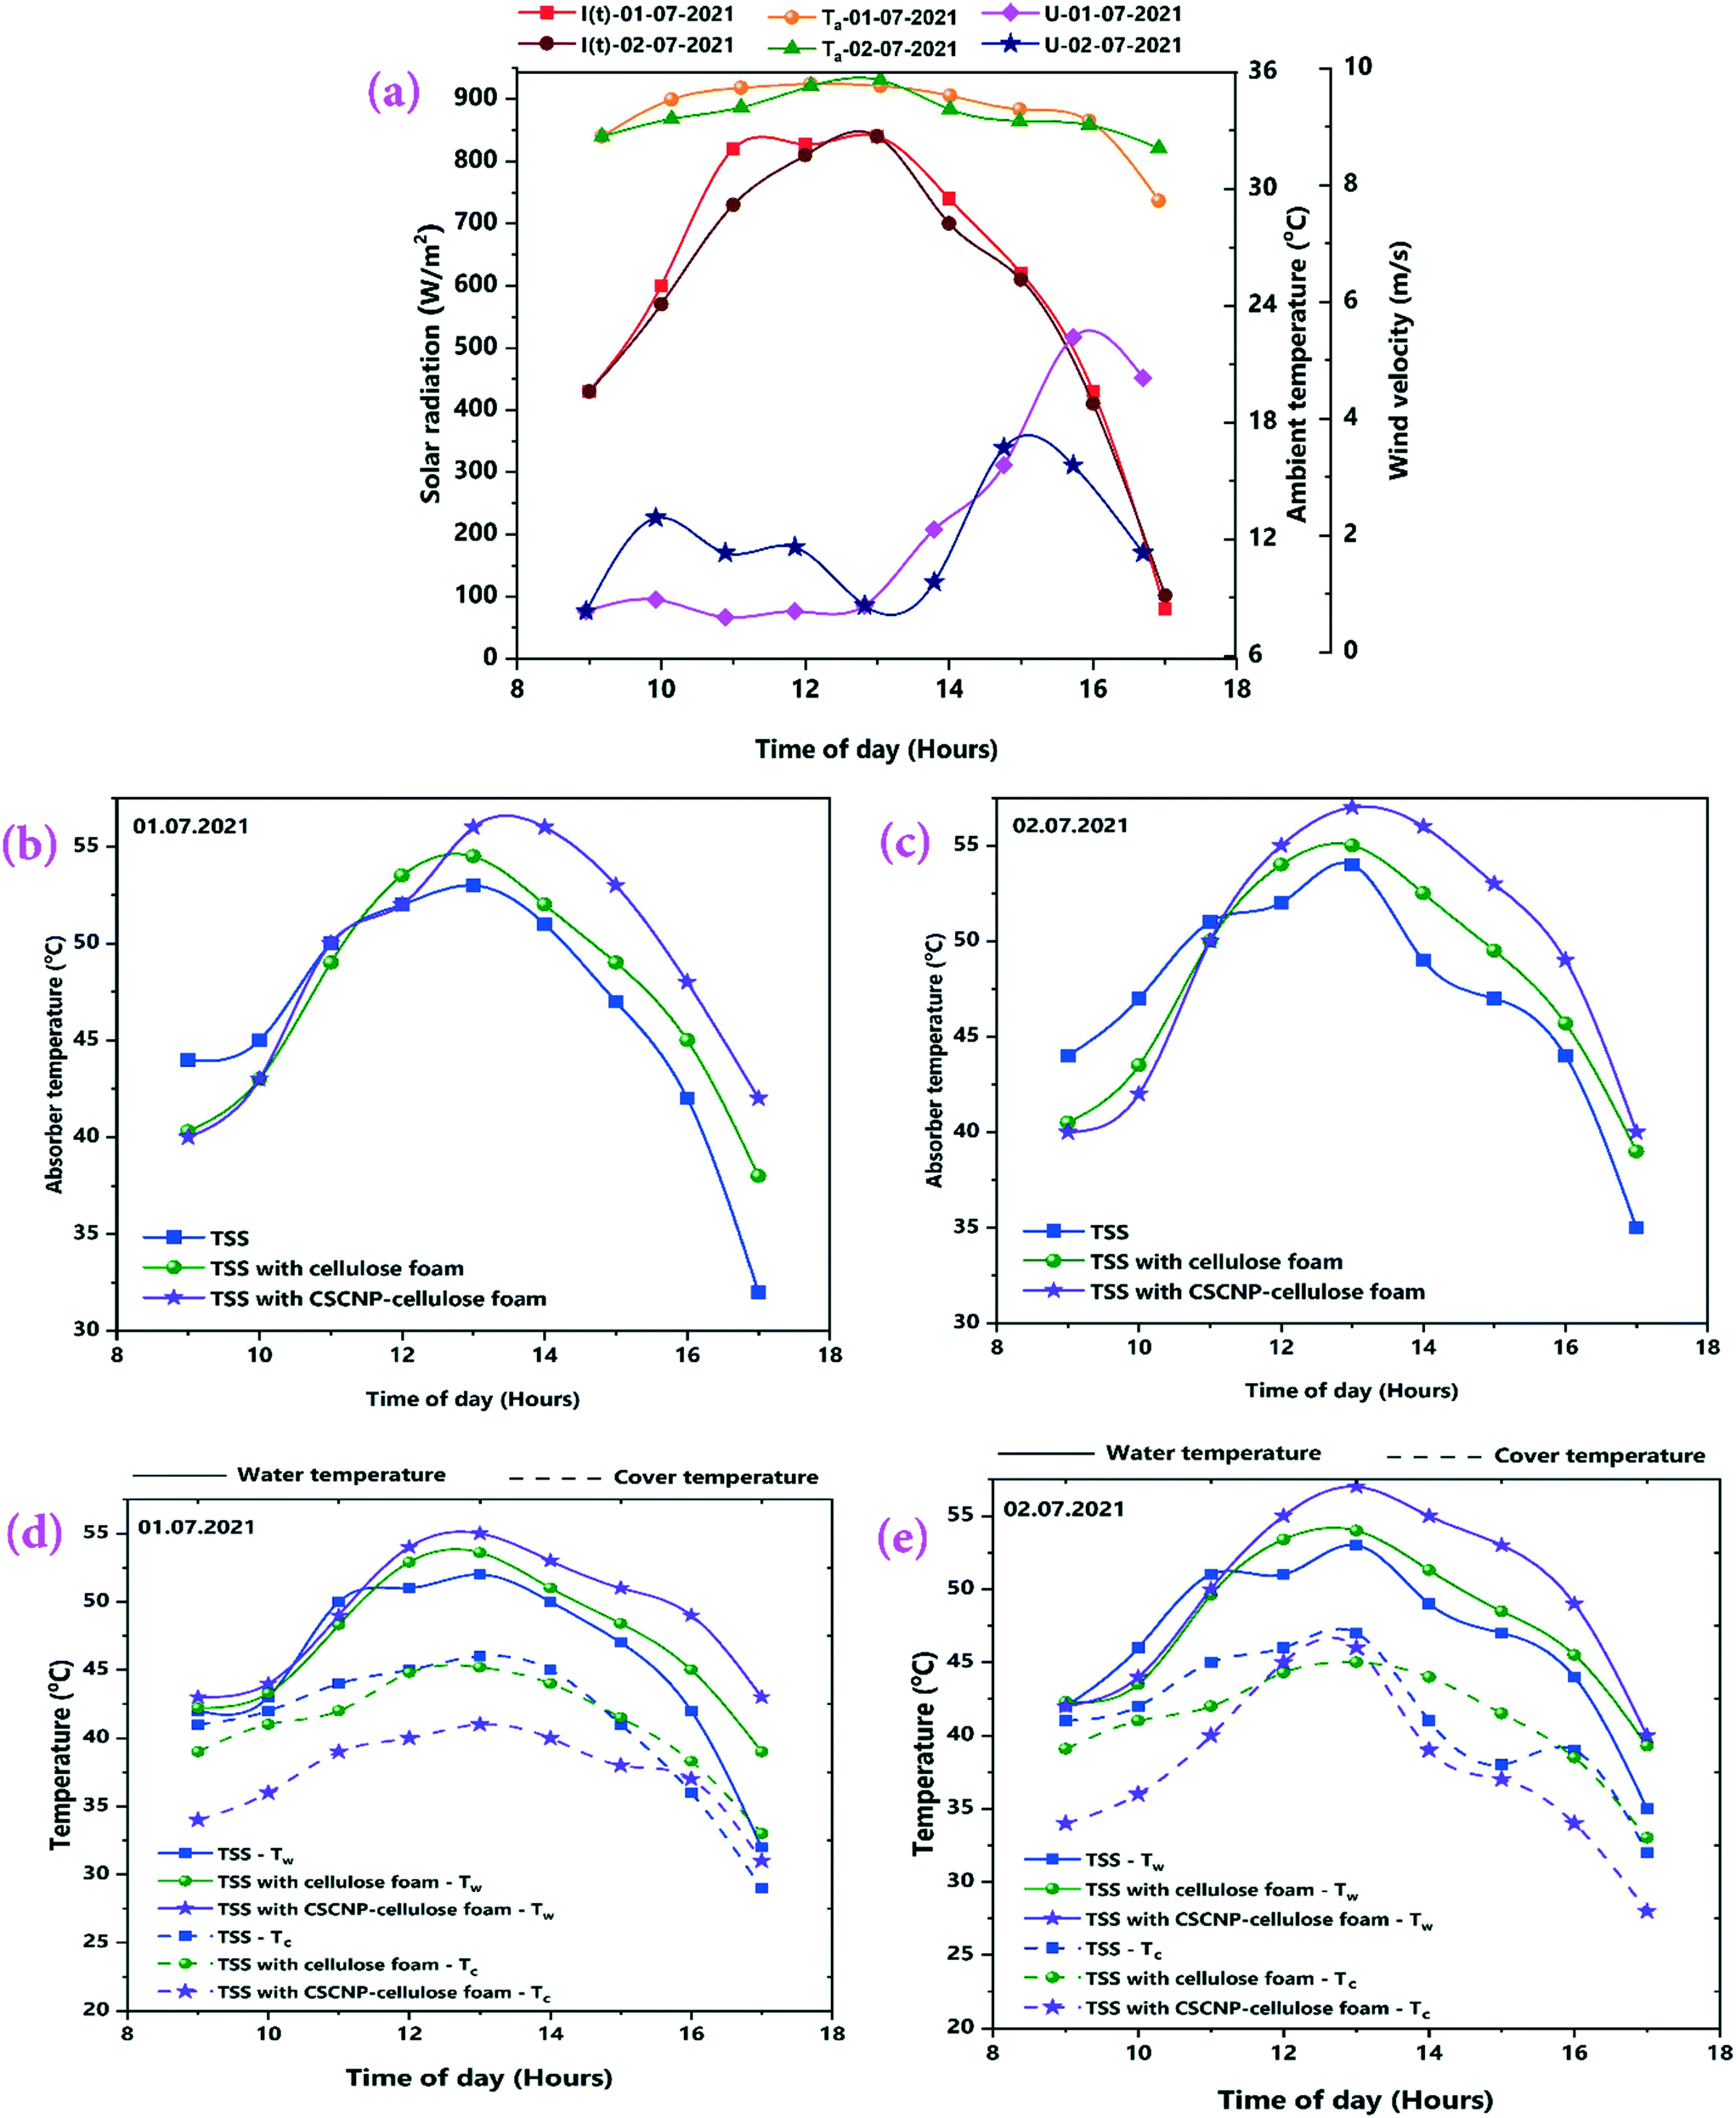
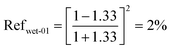
The results from the series of experiments in the TSS during July, 2021 are discussed in this section. The experiments were carried out throughout the month of July and the highest average solar radiation and ambient temperatures were observed on 01.07.2021 and 02.07.2021, respectively and therefore, the experimental results of these days are presented here (more details of the whole month readings, with average solar radiation, ambient temperature and water output by considering only full sunny days with clear sky conditions are shown in Table S1†). Fig. 7(a) depicts the variation in solar radiation, ambient temperature and wind velocity (U) with respect to time over the 8-hour operational period. For both days, solar radiation followed a similar trend and the peak value of solar radiation was 840 W m−2 on both days at 1 PM. The average solar radiation during the experimentation (9 AM – 5 PM) were 598 W m−2 (01.07.2021) and 578 W m−2 (02.07.2021). Similarly, the ambient air temperature peaks of 35.4 °C (01.07.2021) and 35.6 °C (02.07.2021) were monitored. Average wind velocity was 2.14 m s−1 and 1.99 m s−1 for 01.07.2021 and 02.07.2021, respectively. Solar radiation incident on the transparent tubular acrylic cover penetrates it and reaches the water. The absorber is made of milled steel with a black painted surface which helps in heating the water and initiation of evaporation. Therefore, it is very important to analyse the transient-temperature variations of the absorber, water and TSS cover in order to evaluate the water yield and thermal performance. Fig. 7(b and c) depicts the variation in absorber temperature of the TSS units with CF and CSCNP-CF placed inside it. Owing to the superior thermal conductivity (∼50 W m−1 K−1) of the milled steel absorber,42 the absorber exhibited the highest temperature among all three junctions with peak temperatures of 53 °C (01.07.2021) and 54 °C (02.07.2021) for the conventional TSS with the bare absorber.
 |
| | Fig. 7 (a) Variation of solar radiation, ambient temperature and wind speed during the experimental days, (b and c) variations in temperature of the absorber and (d and e) variations in temperatures of water and cover of the TSS, on 1st and 2nd July 2021. | |
Without any modification of the absorber, the operation of the TSS relies mainly on the solar intensity and after the peak solar radiation, the absorber temperature gradually decreases and reaches a minimum of 32 °C (01.07.2021) and 35 °C (02.07.2021) for the conventional TSS. In addition, the average absorber temperature of the conventional TSS was 46.2 °C (01.07.2021) and 47 °C (02.07.2021).
When CF, which exhibits an interconnected pore structure and noteworthy water absorption behavior, was placed onto the absorber, the CF-TSS has a higher absorber temperature as a result of absorption of solar intensity by the CF. As seen in Fig. 7(b and c) with CF, the peak temperature of the absorber reached 54.5 °C (01.07.2021) and 55 °C (02.07.2021). This is attributed to the enhancement in solar absorption owing to the larger SSA and rough surface of the CF that makes it more conducive to capturing light.15 The 3-D interconnected foam structure with large internal space, excellent evaporation and solar absorption behavior prolonged storage of the solar energy and augmented the temperature for longer. With the prolonged energy holding capacity, the average temperature of the absorber was 47.1 °C (01.07.2021) and 47.8 °C (02.07.2021). Higher absorber temperature is beneficial in improving the water temperature which leads to enhanced evaporation and freshwater generation. Therefore, to further increase the absorber temperature, the CF was modified by deposition of CSCNP and placed inside the absorber. The peak temperature of the CSCNP-CF absorber reached 56 °C (01.07.2021) and 57 °C (02.07.2021), mainly due to the excellent solar absorption behavior and interconnected pore structure of the CSCNP based foam, which helps in absorbing maximum incident radiation and significantly increasing absorber temperature. In addition, the average absorber temperature was 48.8 °C (01.07.2021) and 49.1 °C (02.07.2021). This noteworthy improvement in average absorber temperature of the CSCNP-CF TSS is due to the superior thermo-physical properties of the CSCNPs. The porous interconnected CSCNP-CF provided an optimal heat-path, leading to a prolonged period over which energy was supplied to the absorber through the foam. The higher absorber temperature implies a higher water temperature, which is investigated and discussed next.
Fig. 7(d and e) depicts the water temperature variation of conventional and modified TSS. The peak water temperature was 52 °C (01.07.2021) and 53 °C (02.07.2021) for the bare TSS without any modification, while the average water temperature was 45.4 °C (01.07.2021) and 46.4 °C (02.07.2021). Introduction of CF, which exhibited excellent water absorption properties, increases the peak temperature of CF-TSS water to 53.6 °C (01.07.2021) and 54 °C (02.07.2021). The average water temperature was 47.2 °C (01.07.2021) and 47.5 °C (02.07.2021). The noteworthy increase in average temperature of water (∼4% on 01.07.2021 and ∼2.4% on 0.2.07.2021) was achieved due to the excellent water soaking behavior of CF, verified by the contact angle measurements (Fig. 5). In addition, the larger pores inside the CF also promoted excellent water holding capacity so that the increasing temperature of the absorber resulted in increased water temperature also. With the CSCNP-CF, the peak temperature of water further increased to 55 °C (01.07.2021) and 57 °C (02.07.2021). The significant rise in water temperature is ascribed to the higher absorber temperature and the superior solar absorption properties and porosity of the CSCNP-CF that provided an optimal heat transfer path and increased the water temperature. The average water temperature for the CSCNP-CF-TSS was 49 °C (01.07.2021) and 49.4 °C (02.07.2021), a notable (4 °C) increase as compared to the unmodified TSS.
The cover temperature is also noteworthy, as a large difference between the water and cover temperatures increases the water productivity and therefore, the temperature gain of the cover is discussed next. As seen in Fig. 7(d and e), the peak cover temperatures were 46 °C (01.07.2021) and 47 °C (02.07.2021) for the conventional TSS. Once the water is heated by the synergetic effects of the absorber and incident solar radiation, evaporation started and condensation of the water vapour takes place on the TSS cover, which is clearly visible in Fig. 2(b). With increasing vapour formation, the cover temperature also increases. The average cover temperature for the conventional TSS was 41 °C (01.07.2021) and 41.2 °C (02.07.2021), while the temperature difference between the water and cover was only 4.4 °C (01.07.2021) and 5.2 °C (02.07.2021) respectively for the conventional TSS. A high temperature difference between the water and cover promotes higher heat transfer, leading to augmented vapor generation and water production. In the CF-TSS, the peak cover temperature was 45.2 °C (01.07.2021) and 45 °C (02.07.2021), indicating a low reduction in peak temperature of the cover (∼1.7% on 01.07.2021 and 4.2% on 02.07.2021) using CF. This could be due to the formation of large amounts of water vapour inside the cover and its faster gliding from the cover to the water collection point. As the large amount of vapour formation allows faster movement of the water droplet and accelerates the gliding of the drops from the cover, there would be lower possibility of stationary vapour droplets and increased evaporation using CF, which further increases the amount of vapour, and leads to a lower cover temperature. Owing to this, the average cover temperature was 40.7 °C (01.07.2021) and 40.9 °C (02.07.2021) for the CF-TSS. In addition, there was a significant improvement in the average temperature difference between the water and the cover, which reached 6.4 °C (01.07.2021) and 6.5 °C (02.07.2021) for the CF-TSS. Modification of the CF with CSCNP in TSS reduced the average temperature of the TSS cover further to 37.3 °C (01.07.2021) and 37.6 °C (02.07.2021). It is obvious that higher vapor formation using the CSCNP modified CF generated more vapor on the cover and its higher gliding helps in reducing the temperature of the cover further, resulting in the average temperature difference of the water-cover being 11.6 °C (01.07.2021) and 11.7 °C (02.07.2021) for the CSCNP-CF TSS.
4.3 Evaporation/condensation and water-droplet formation behaviour inside the TSS
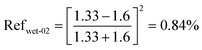
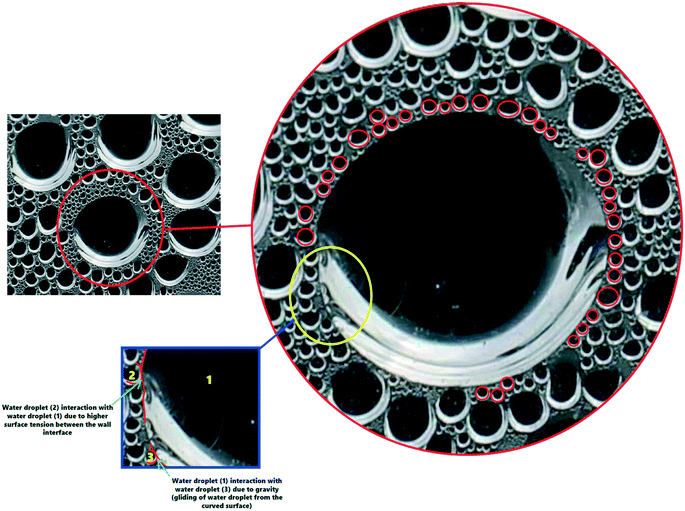
The effect of CSCNP modified CF on solar-driven evaporation and formation of water droplets on the condenser cover is shown in Fig. 8(a–d). The CF modified by deposition of CSCNP is placed inside the evaporation/condensation chamber of the TSS, which is filled with the brackish water. Immediately after the start of the experiment with exposure of solar radiation onto the foam, evaporation takes places and is clearly visible in Fig. 8(b). The continuous evaporation and condensation of the vapour results in formation of water-droplets. Fig. 8(c) depicts the beginning of the condensation of vapour on the inner acrylic cover and the initial size of the condensed water droplet is shown in Fig. 8(d). In a solar-driven water desalination unit, the evaporation depends entirely on the incoming solar radiation, and owing to the closed chamber with its transparent cover, a higher temperature gain inside the TSS promotes higher heat transfer from the absorber to water, which leads to increased evaporation. Moreover, the rate of evaporation directly affects the water droplets formed on the inner cover surface. The evaporated vapour comes into contact with the transparent cover whose surface temperature is lower than the vapour saturation temperature, and thus liquid nucleates are formed on the inner cover surface. The free convection of the vapour phase drives the condensation process, and based on the geometry of the cover, the condensate glides down and gets collected. As solar-driven evaporation governs the condensation process, it is important to establish the connection between the solar radiation and the condensate (which is generated by the evaporated vapour). Therefore, we attempted to analyse the effect of solar radiation on condensate droplet formation on the inner cover, as presented in Fig. 9(a–d) for the TSS with CF-CSCNP on 02.07.2021 (with TSS and TSS-CF data given in Table S2†).
 |
| | Fig. 8 Initial stages of evaporation and condensation of water-droplets on the TSS cover. (a) Modified CSCNP foam is placed in the evaporation/condensation chamber of the TSS before the start of the experiment; (b) occurrence of evaporation in the initial stage of experimentation; (c) condensed water droplets accumulated on the cover at the beginning of the experiment; and (d) an enlarged view of the small sized droplet formation on the TSS cover. | |
 |
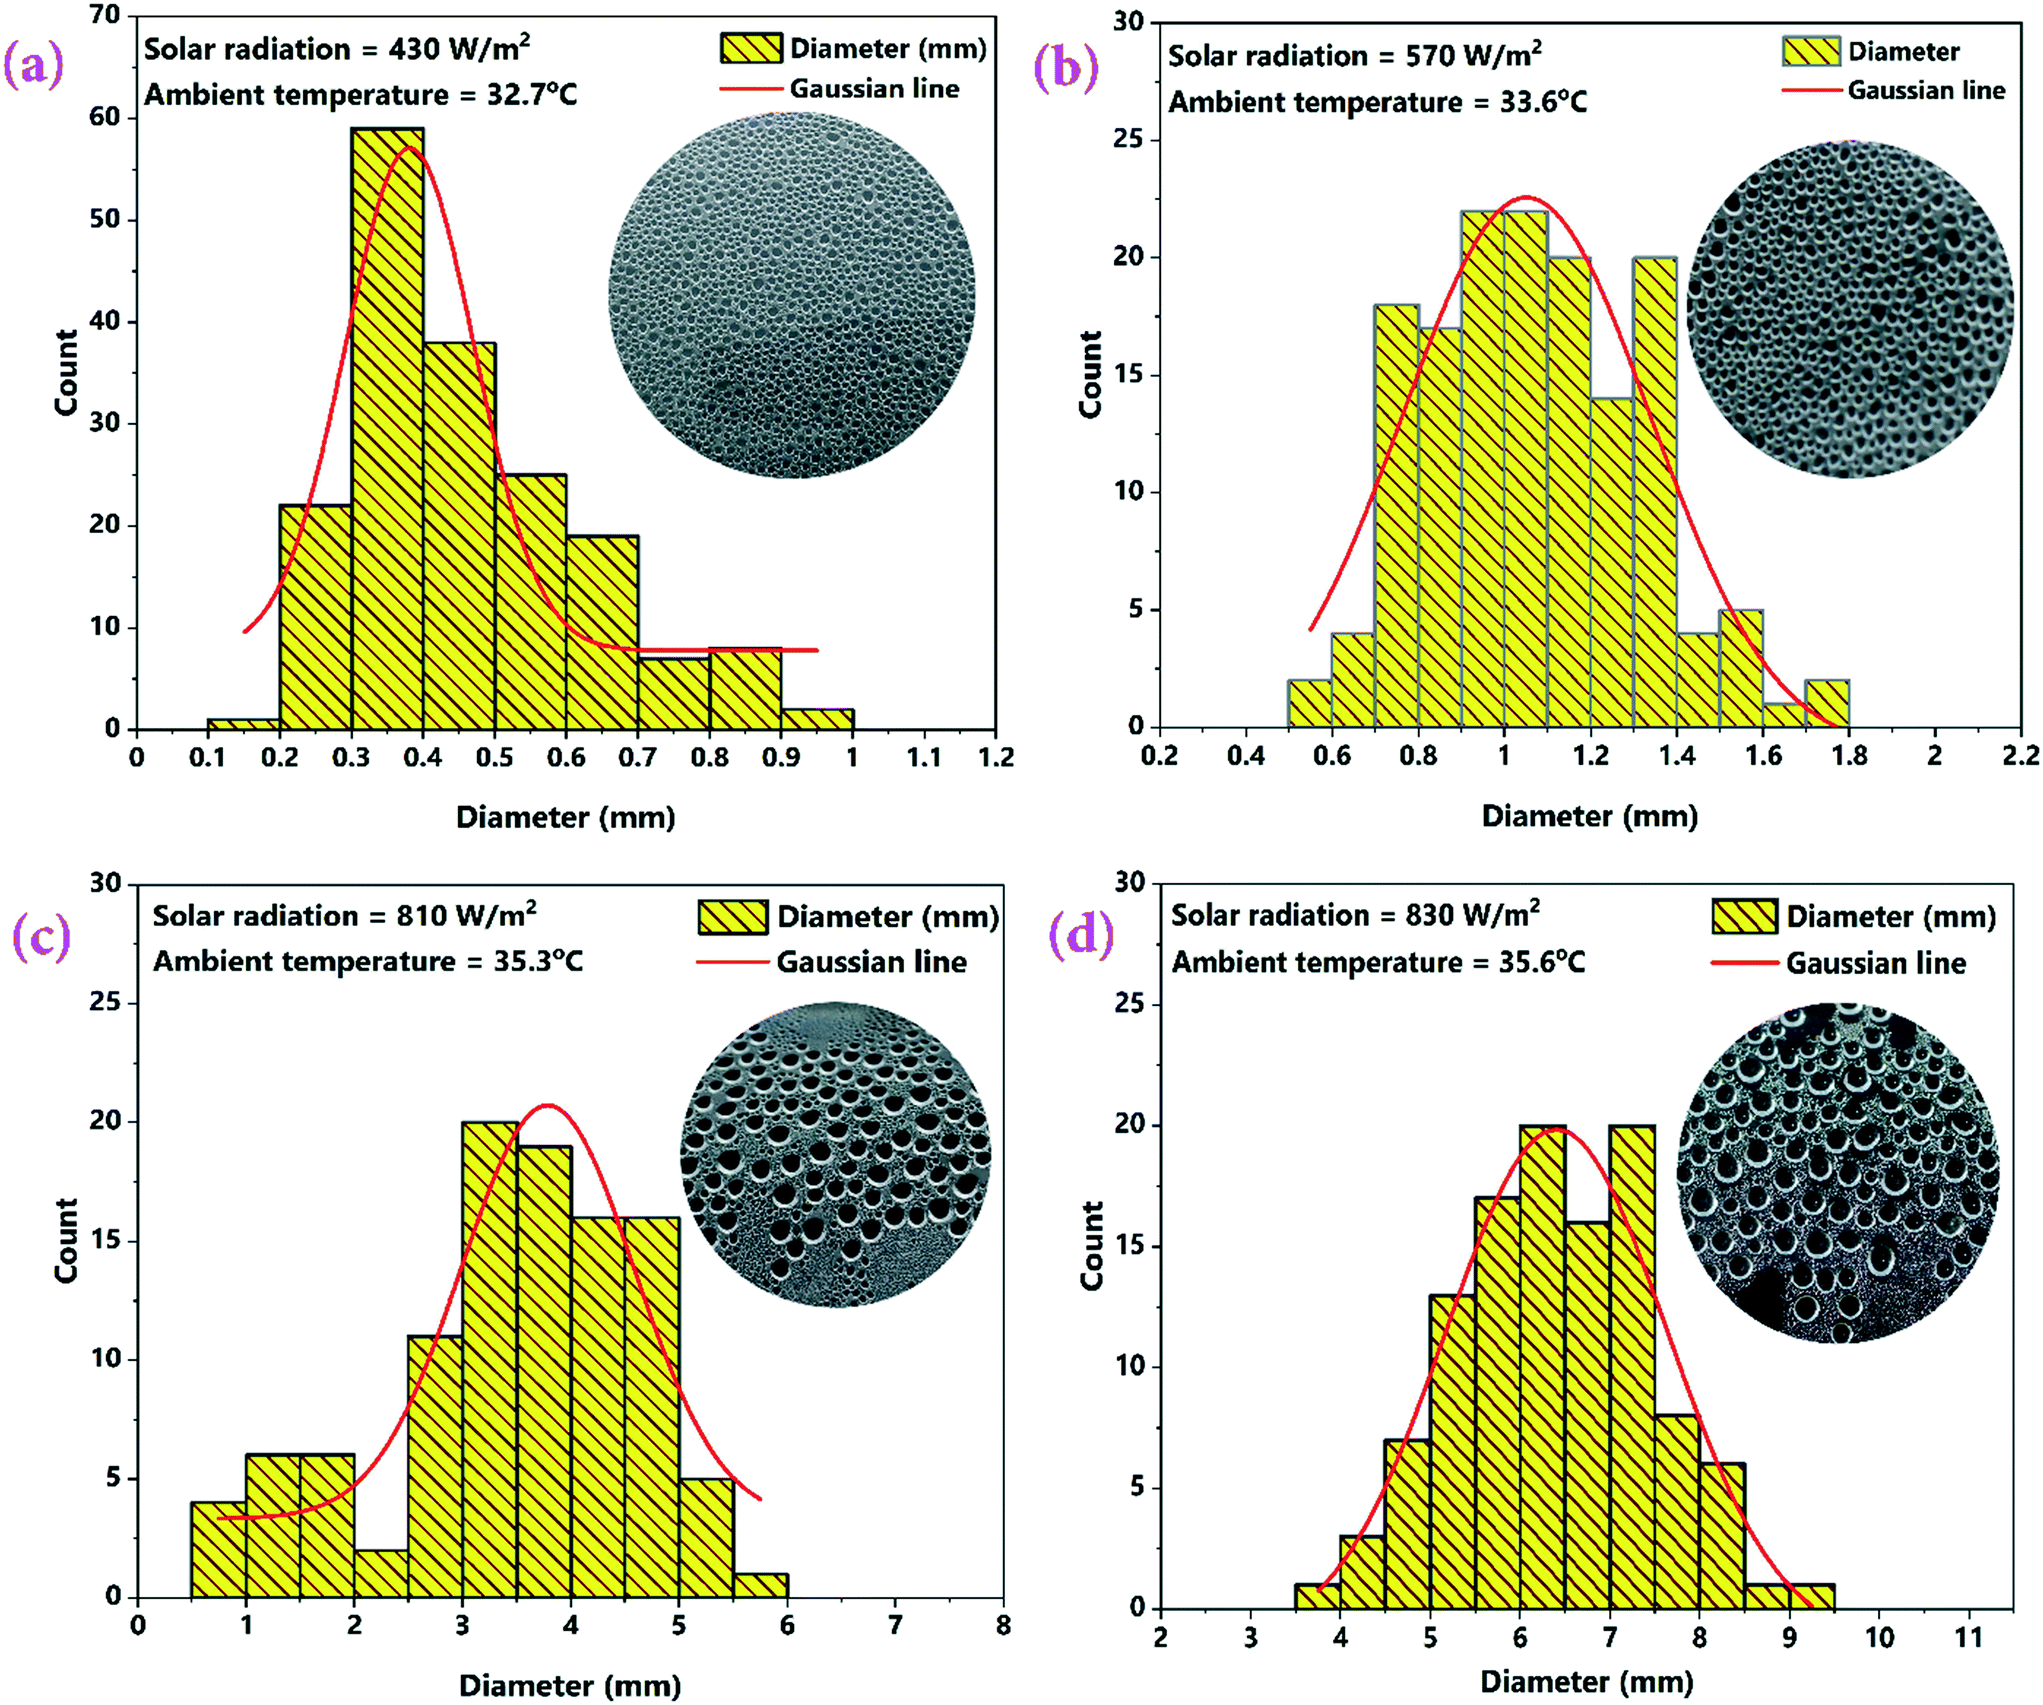
| | Fig. 9 Effect of varying solar radiation intensity on the condensed water-droplet formation inside the cover of the CSCNP-CF-TSS. (a) 430 W m−2, (b) 570 W m−2, (c) 810 W m−2 and (d) 830 W m−2. The insets show the actual droplet sizes (photographs). | |
As seen in Fig. 9, solar radiation affects the size of the water-droplet formed on the inner cover after evaporation. With solar radiation of 430 W m−2 at 9 AM, the water droplet size was found to be in the range 0.1–1 mm, with the majority of droplets in the range 0.2–0.7 mm, as shown in Fig. 9(a). At the start of the experiment, the solar intensity is low resulting in lower evaporation during the early hours, and thus the water-droplets condensed on the cover are smaller in size. Smaller droplet sizes take a longer time to glide from the top of the cover to the water collection point and therefore, a lower freshwater yield is exhibited during this period. As solar radiation increases to 570 W m−2 (between 9 AM and 10 AM), the evaporation rate also increased and the size of the water-droplets condensed on the cover increased. As seen in Fig. 9(b), the droplet size was found to be in range of 0.5–1.8 mm with the majority of the droplets being 0.5–1.6 mm. Increased solar intensity promoted higher evaporation and thus, larger droplet sizes and a faster gliding movement of the droplets, leading to higher water yields using the CSCNP-CF-TSS. To further explore the role of solar radiation on droplet size, the investigation was also carried out at 810 W m−2 (10 AM to 11 AM), and astonishing results were observed. As can be seen in Fig. 9(c), the droplet size was observed to be in the range of 0.5–6 mm, with the majority of the droplets being 2.5–5.5 mm. This is attributed to the higher solar intensity along with the novel 3-D interconnected CF foam structure, which leads to excellent evaporation and formation of larger droplets on the cover during condensation. The larger droplet size provides faster movement of the droplets from the inner cover to the water collection point, and promoted increased water output. Similarly, with solar radiation of 830 W m−2 (12 noon to 1 PM), the droplet size reached a maximum of 3.5–9.5 mm. During the peak solar radiation (11–2 PM), there was thus a noteworthy increase in the size of the droplets, which demonstrates the dependency of the evaporation on the solar radiation intensity.
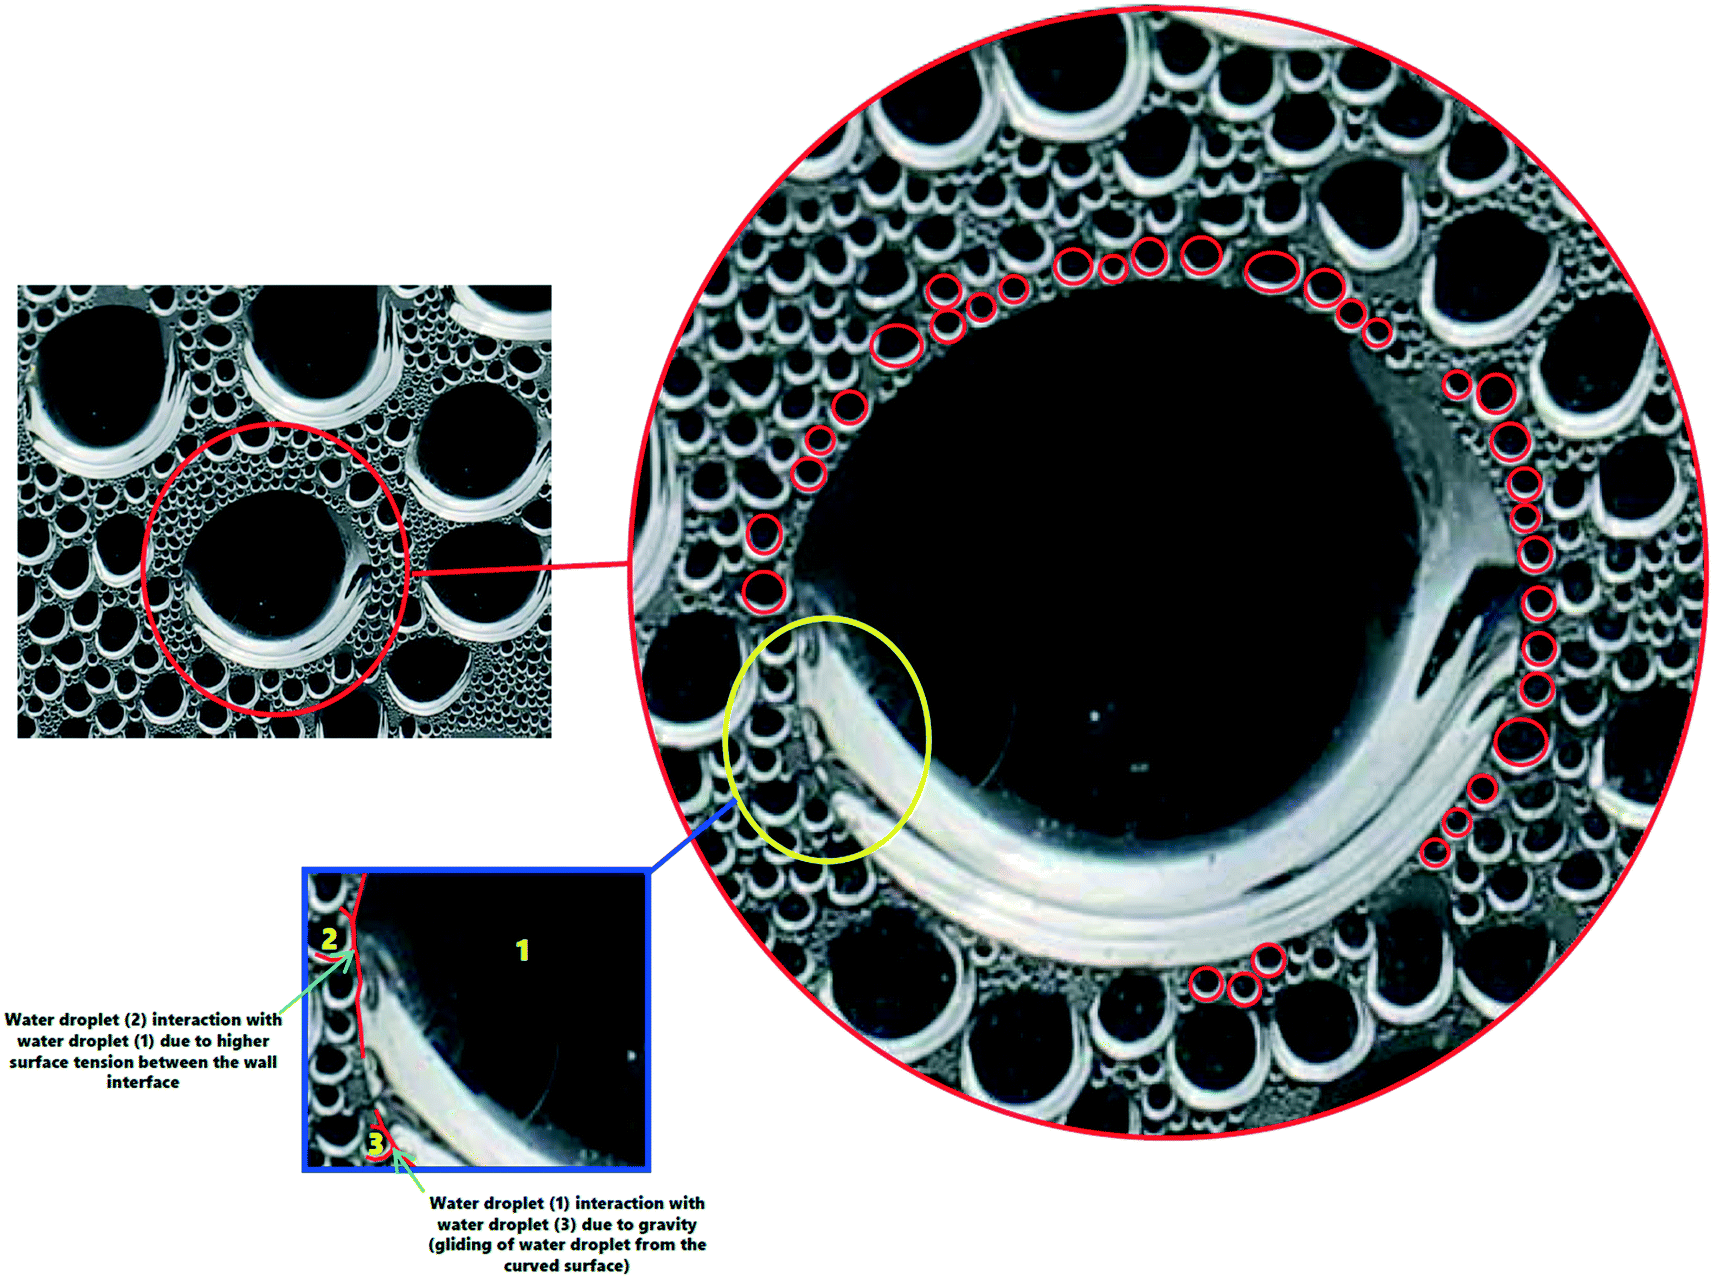
In addition to the effect of solar radiation on the size of the water-droplets, the van der Waals interactions between the water molecules is presented in Fig. 10 to explain the detailed mechanism of formation of larger water-droplets from smaller droplets. The photographs in Fig. 10 are of the inside of the TSS cover at the center, where the vapour accumulated on it with different sizes and illustrates how, over time, due to attraction between smaller drops and gravitational forces, larger sized droplets are formed. van der Waals force is monotonically attractive and this bring two small sized water droplets into contact.
 |
| | Fig. 10 Mechanism of larger droplet formation due to van der Waals interactions between the water molecules. A movie of this processes is included in the ESI.† | |
Red circles in the Fig. 10 illustrate the mechanism behind the force of attraction between the small sized water droplets, leading to formation of larger sized droplets via a process called ‘Ostwald ripening’. The smaller water-droplets provide an optimum pathway for higher inter-molecular attractive forces and this leads to formation of larger sized droplet. It is also interesting to note that the water-droplet profile exhibited spherical shape during the interaction with the cover surface, as clearly visible in Fig. 10. This is attributed to balancing of the elastic force and the interaction force during the rupture of the air-film, which maintains the spherical shape of the water-droplets. It is thus concluded that higher solar radiation combined with usage of the CSCNP-CF in TSS promoted formation of larger size spherical water-droplets, which is beneficial for faster droplet movement from the inner cover to the water collection center, leading to high water output.
4.4 Solar-driven evaporation efficiency and water productivity of desalination unit
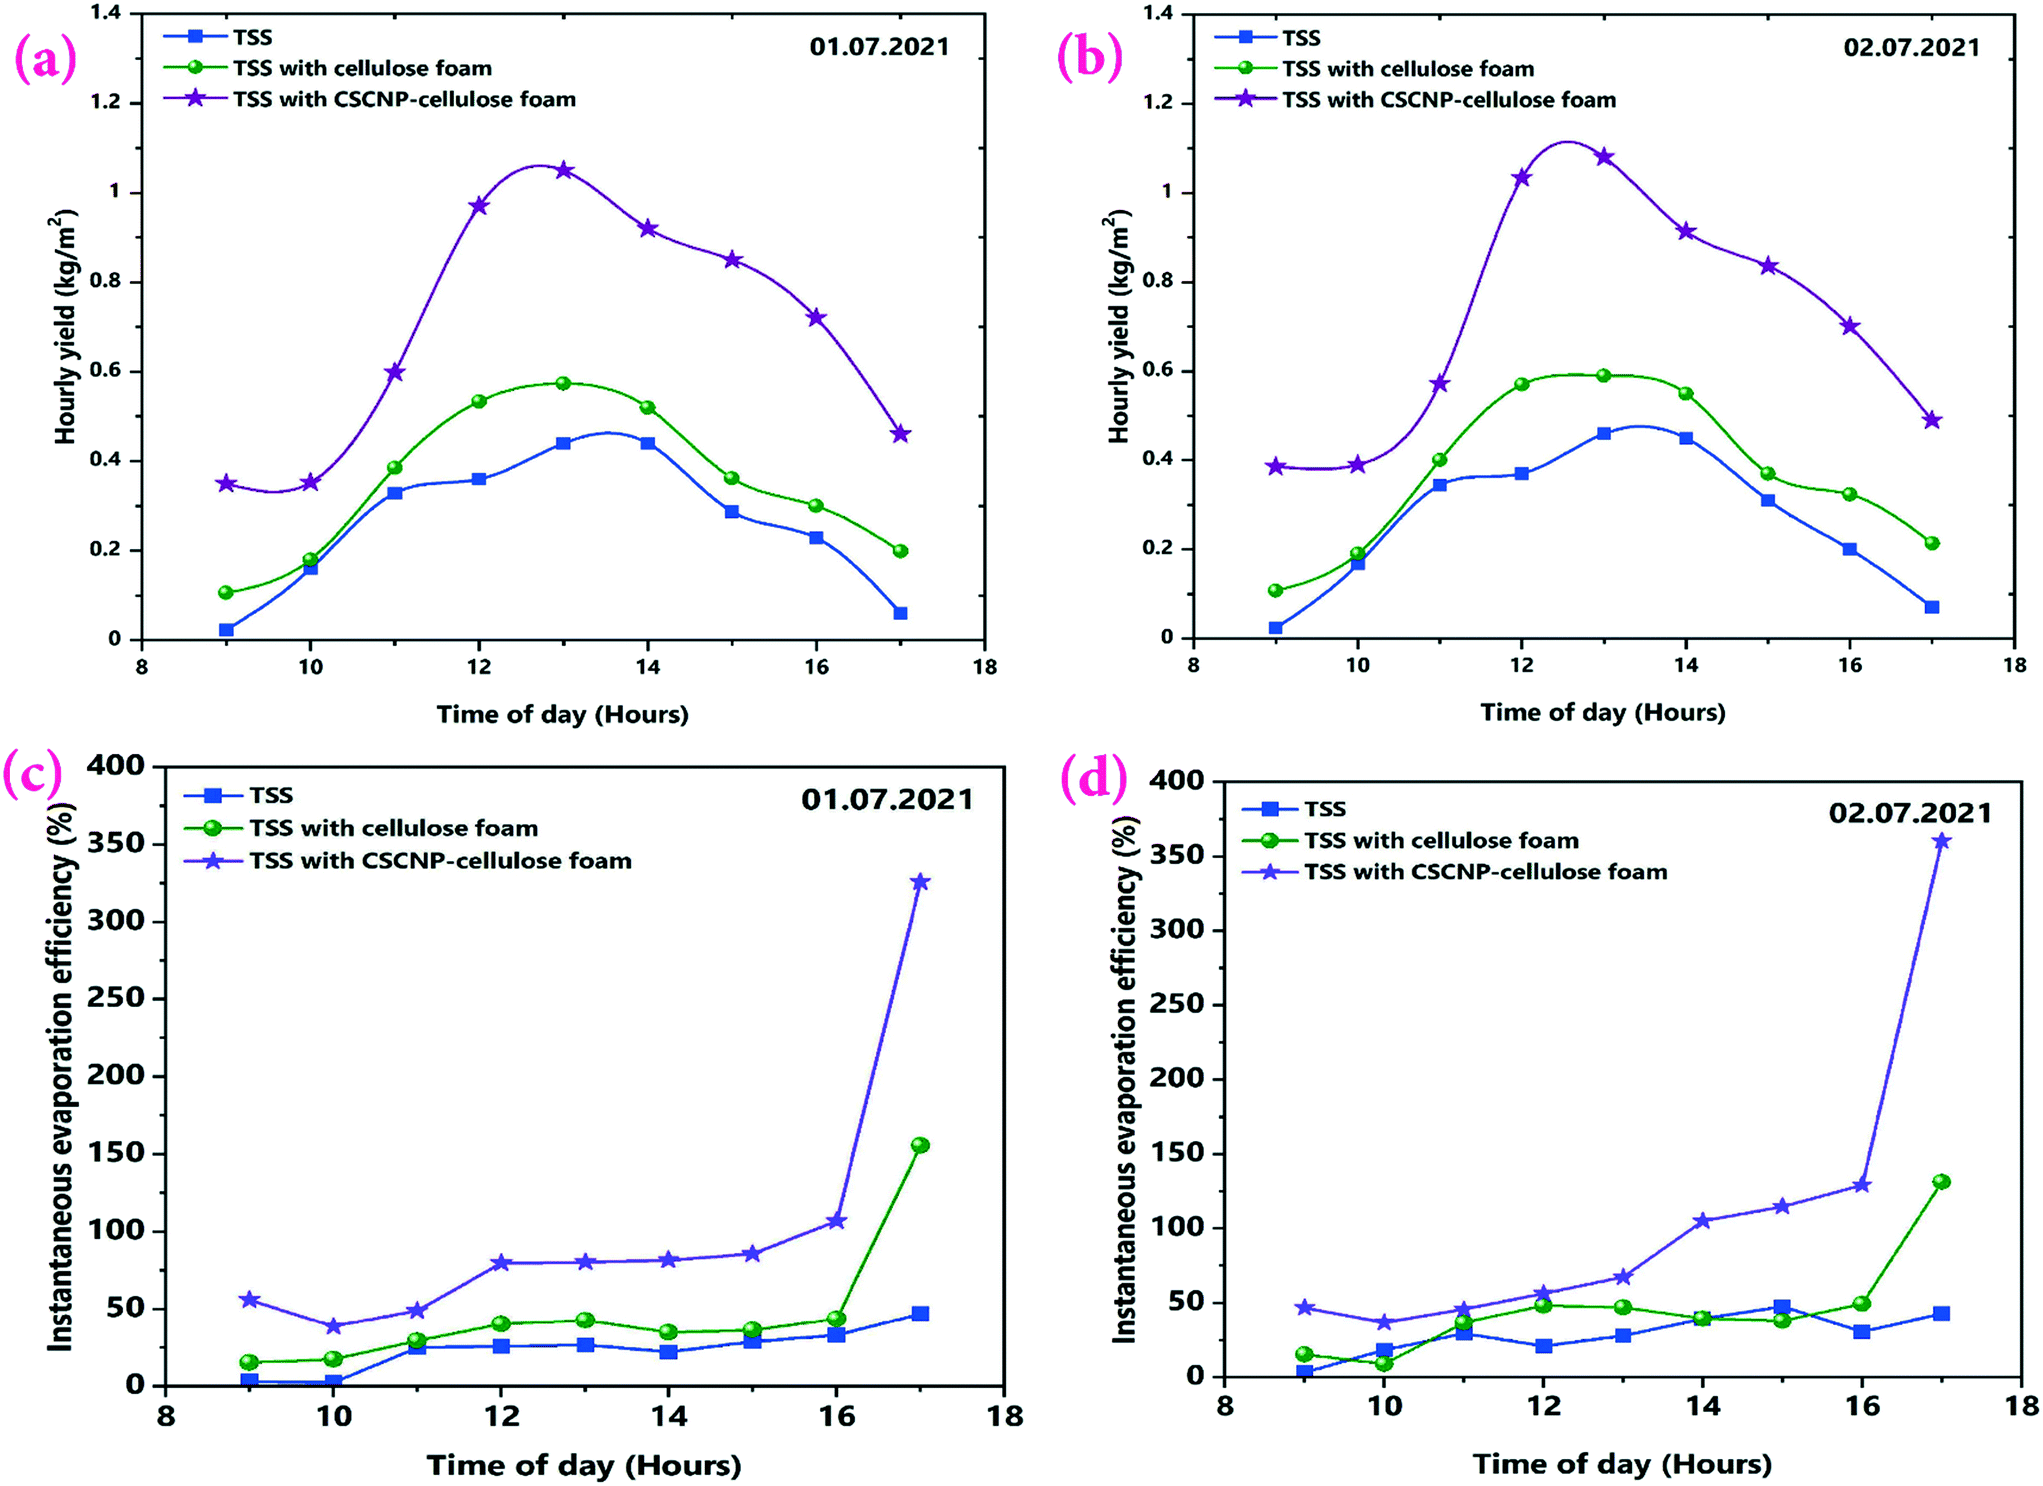
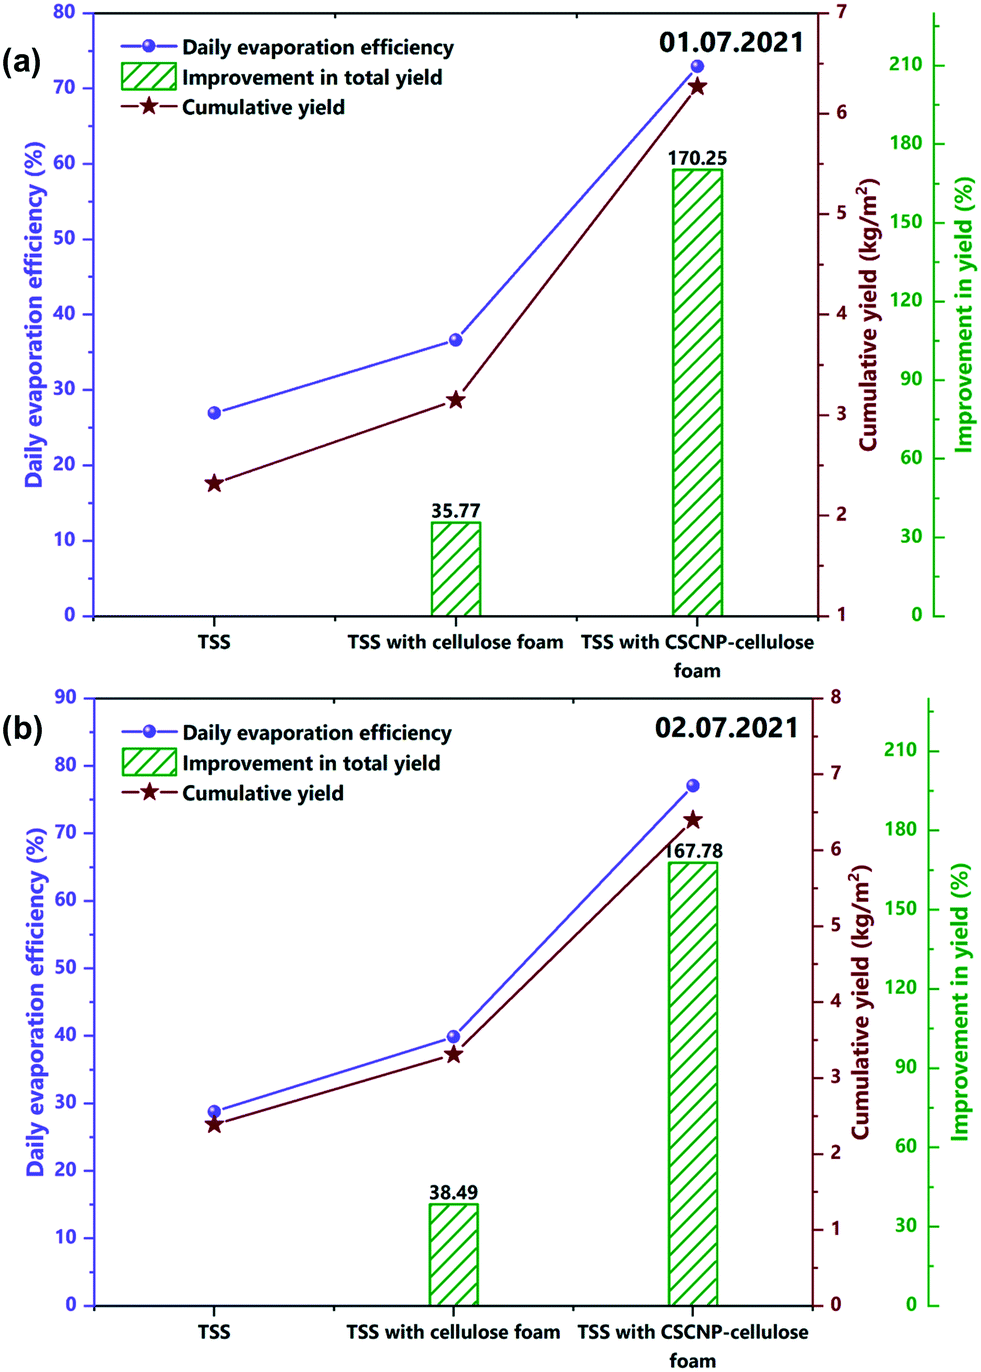
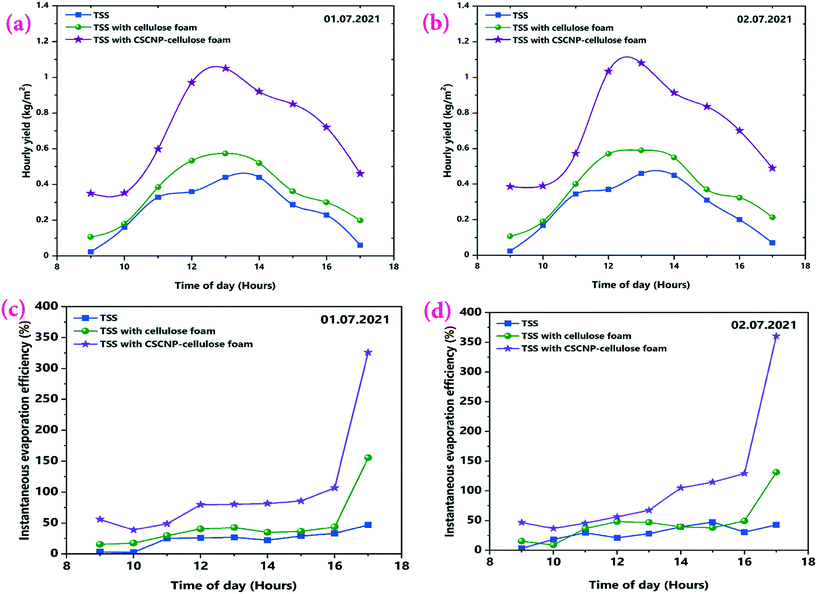
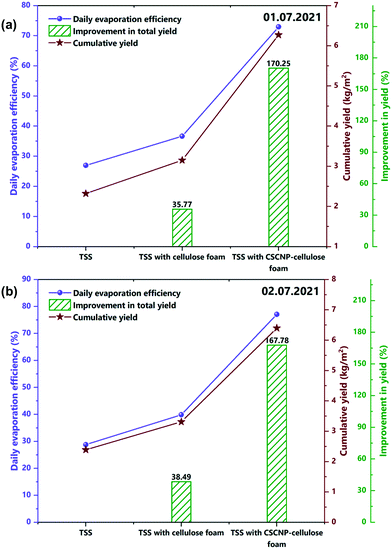
The major objective of the present work is to explore the role of CSCNP-CF in improving the solar-driven evaporation and water yield of the tubular desalination unit. This section presents a detailed investigation of the water production and solar evaporation performance of the CSCNP-CF-TSS, CF-TSS and unmodified TSS. As the evaporation efficiency is a calculated value, based on the hourly water yield (using eqn (2)), we have first analyzed the hourly yield and afterward, using the formula, determined the evaporation efficiency. A peak hourly water yield of 440 mL m−2 (01.07.2021) and 460 mL m−2 (02.07.2021) was exhibited by the conventional TSS, as shown in Fig. 11(a and b). With the gradual reduction in solar radiation throughout the afternoon, the hourly water yield also reduced and reached a minimum of 60 mL m−2 (01.07.2021) and 70 mL m−2 (02.07.2021) at the end of experiment (by 5 PM). The cumulative total full-day water yields were 2.32 L m−2 (01.07.2021) and 2.39 L m−2 (01.07.2021) for the conventional TSS, as shown in Fig. 12(a and b). The instantaneous evaporation efficiency of the unmodified TSS, determined using eqn (2) is presented in Fig. 11(c and d). As observed from Fig. 11(c and d), the conventional TSS with a bare absorber exhibited low instantaneous evaporation efficiency for both days. The instantaneous evaporation efficiency increased from 10 AM till 1 PM, then decreased and later increased again reaching the peak value of 47.2% (01.07.2021) and 42.9% (0.2.07.2021) at 5 PM. A similar trend of instantaneous evaporation efficiency of SS was reported by Elmaadawy et al.43 It is obvious that in the early experimental hours, the amount of energy accumulated in the water is low due to the lower radiation and with increasing exposure of the water to radiation, evaporation occurs faster, leading to increased water generation and thus, higher evaporation efficiency. The maximum value of the instantaneous evaporation efficiency of the unmodified TSS is exhibited at the least solar intense hour (5 PM), which is mainly due to the energy stored in the water and the significant temperature difference between the enclosed TSS cover and ambient air, which allows more evaporation from the water surface to the cover. However, the full-day average evaporation efficiency of the bare TSS was only 27% (01.07.2021) and 28.8% (02.07.2021), as shown in Fig. 12(a and b). The low average efficiency of the TSS is mainly due to the dependence of the evaporation on solar radiation alone.
 |
| | Fig. 11 (a and b) Hourly water yield, and (c and d) Instantaneous evaporation efficiency of the unmodified, CF-modified and CSCNP-CF modified TSS on 1st and 2nd July, 2021. | |
 |
| | Fig. 12 (a and b) Average evaporation efficiency and enhancement in full day water yield of the unmodified, CF-modified and CSCNP-CF modified TSS on 1st and 2nd July, 2021. | |
After exploring the evaporation and water yield of the bare TSS without any modification, CF was placed in the absorber of the TSS and its effect on the evaporation and water productivity is presented. Fig. 11(a and b) depicts the hourly water yield and the peak yields of 574 mL m−2 (01.07.2021) and 590 mL m−2 (02.07.2021) were exhibited by the TSS with CF. With its superior evaporation and water transportation via the 3-D network structure of the CF, the cumulative full-day water productivity was augmented by 35.77% (01.07.2021) and 38.49% (02.07.2021) for the TSS with CF as compared to the bare TSS. Fig. 11(c and d) depicts the instantaneous evaporation efficiency of the CF-TSS showing the significant augmentation in the instantaneous evaporation efficiency. The peak instantaneous efficiency was enhanced 2.29-fold (01.07.2021) and 2.06-fold (02.07.2021) compared to the conventional TSS. The significant improvement in instantaneous evaporation efficiency is due to the larger SSA and excellent roughness of the foam surface that supported maximum light capture, leading to higher evaporation, along with the superior water holding capacity of the foam. In addition, the average evaporation efficiency was found to be 36.6% (01.07.2021) and 39.9% (02.07.2021) for the CF-TSS. The notable increase in instantaneous and average evaporation efficiencies were mainly due to the excellent water transfer capability through the interconnected foam fibers which promote faster evaporation.
Fig. 11(c and d) also depicts the instantaneous evaporation efficiency of the TSS with CSCNP-CF illustrating the further augmentation of the instantaneous evaporation efficiency. Peak evaporation efficiency of the TSS with CSCNP-CF reached 326.1% (01.07.2021) and 360.5% (02.07.2021) that of the bare TSS at the end of the experiment. The porous interconnected structure and inherent absorption of the carbon-based nanoparticles resulted in a modified foam structure that blocks light reflectance and significantly extends the light transport path in the porous foam network. This leads to superior solar absorption behavior and improved evaporation. In addition, it is important to note that the evaporation efficiency is inversely proportional to the solar radiation as per eqn (2) and therefore, in the evening time (when there is minimal solar radiation), evaporation efficiency will be higher. A similar trend has been observed for the other two cases (TSS and TSS-CF). With its porous interconnected structure and excellent solar absorption behavior, the CSCNP-CF based TSS generated 460 mL m−2 (01.07.2021) and 490 mL m−2 (02.07.2021) water even at 5 PM (least solar radiation) and therefore, due to the synergistic effect of lower radiation and stored energy, the CSCNP-CF based TSS has exhibited excellent instantaneous evaporation efficiency.
The average evaporation efficiency reached 72.93% (01.07.2021) and 77% (02.07.2021) for the CSCNP-CF TSS. Fig. 11(a and b) depicts the peak hourly yield which reached 1050 mL m−2 (01.07.2021) and 1080 mL m−2 (02.07.2021) for the TSS with CSCNP-CF. Higher solar absorption and excellent heat transfer from water to the cover synergistically improved the hourly yield of the TSS. With the CSCNP modified foam, the cumulative water yield of the TSS was augmented by 170.25% (01.07.2021) and 167.78% (02.07.2021) as compared to the bare TSS without any modification.
The superior thermo-physical properties of the carbon nanoparticles, with their inherent absorptivity and porosity, allows the CF to absorb the maximum available solar radiation and provides the optimum heat transfer path across the water-cover interface, leading to significantly higher solar driven evaporation and clean water generation. With the significant improvement in water yield using CSCNP-CF, it is important to explore its long-term stability and degradation with respect to time. In this regard, the effect of long-term experimental study using CF and CSCNP-CF on the water productivity enhancement is explored. At the start of the experiment, full-day water yield enhancement was 170.25% using CSCNP-CF in TSS, as compared to conventional TSS. Moreover, after thirty days of experimental investigation, the water yield enhancement was 167.80% and thus, a meager reduction of 2.45% in water yield enhancement was noted. This demonstrates the excellent deposition behavior of CSCNPs on CF and even after thirty days of experimental analysis, only a very slight performance reduction was noted. Similarly, using CF (on 2nd day of experiment), the full day water yield enhancement was 38.49% as compared to conventional TSS. Moreover, after thirty days of analysis, the full day water yield enhancement was 37.04% and thus again a very slight reduction of 1.37% was observed. An entire 180 days experimental results of time degradation and its effect on water yield with CF and CSCNP-CF are presented in Table S3.† From this, it is inferred that the developed CF and CSCNP-CF substrates are durable and give superior water yield performance over the long-term.
4.5 Second law efficiency and irreversibility analysis of desalination units
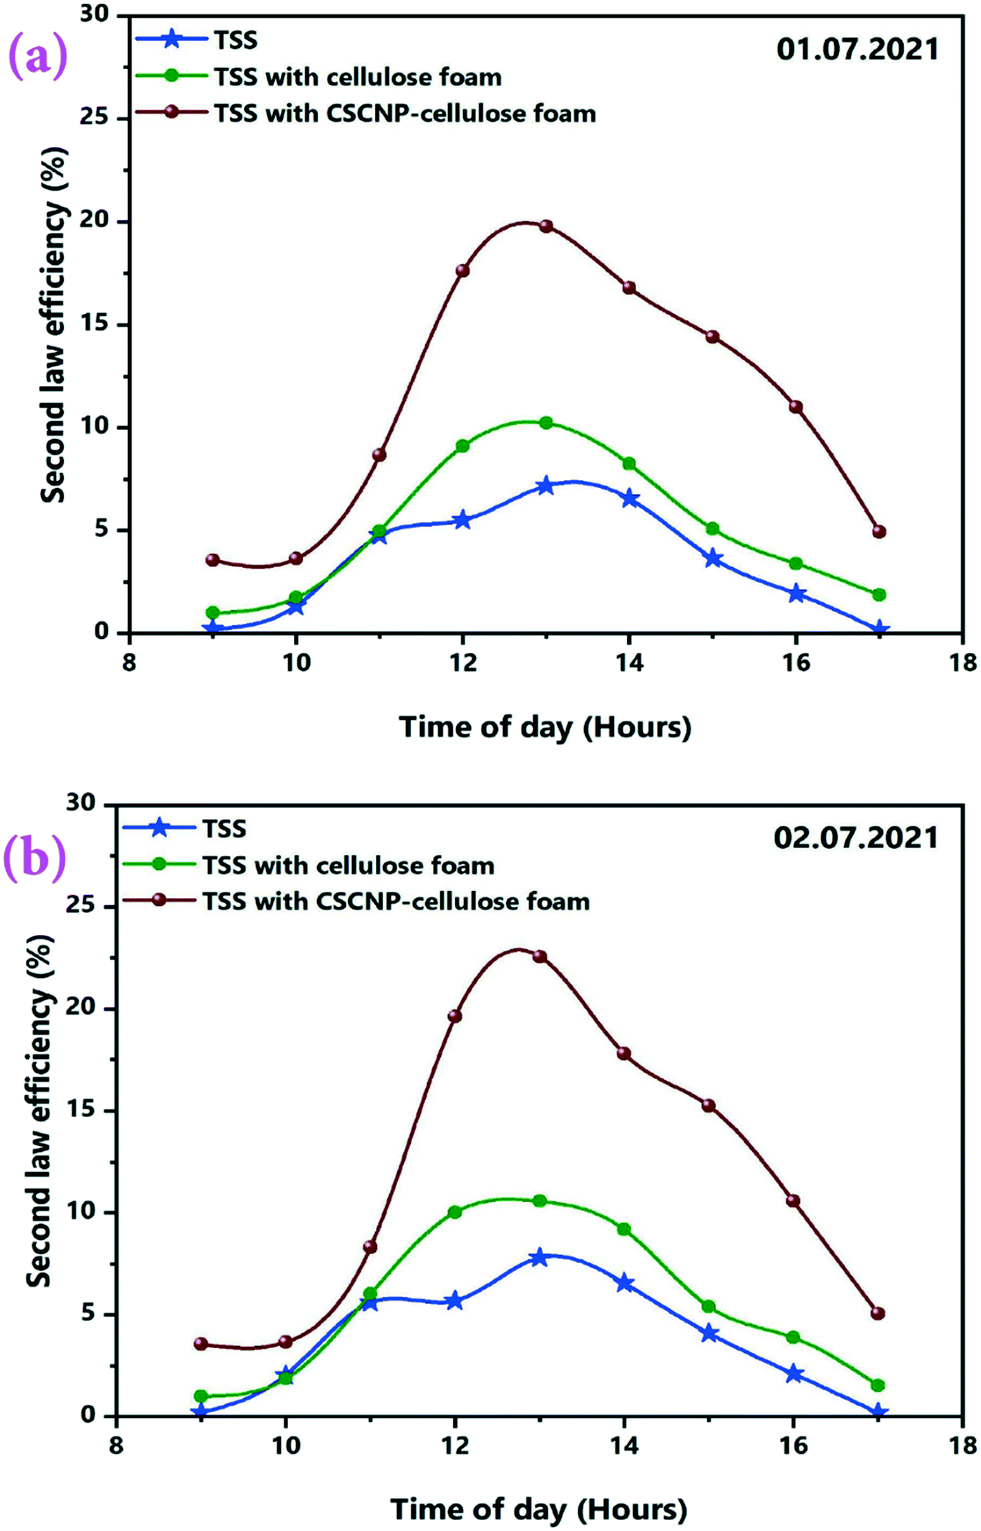
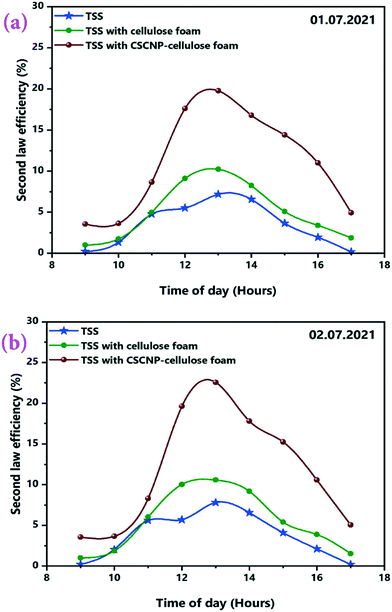
The second law thermodynamics efficiency or the exergy efficiency is a very significant tool to analyse and evaluate the overall performance and system efficiency in solar based applications. The hourly 2nd law efficiency (exergy) of the TSS with and without the CF is determined using the relationship between exergy output and exergy input as illustrated in eqn (6). Fig. 13(a and b) illustrates the 2nd law hourly efficiency of the TSS with and without modification. It is observed from the eqn (6) that the 2nd law efficiency mainly depends on the water yield and that higher water output leads to more efficiency. The unmodified TSS exhibited a peak hourly 2nd law efficiency of 7.18% (01.07.2021) and 7.81% (02.07.2021). The average 2nd law efficiency was 3.48% (01.07.2021) and 3.81% (02.07.2021). The low evaporation and water yield of the conventional TSS is the major reason for lower 2nd law efficiency of the unmodified TSS. Addition of CF improves the peak hourly 2nd law efficiency (of the TSS with CF) to 10.21% (01.07.2021) and 10.56% (02.07.2021). The improvement is due to the higher water generation using the 3-D interconnected porous foam with its superior water evaporation characteristics. The average 2nd law efficiency was 5.06% (01.07.2021) and 5.50% (02.07.2021) for the TSS with CF. The peak hourly 2nd law efficiency reached to a maximum of 19.76% (01.07.2021) and 22.56% (02.07.2021) for the TSS modified with the CSCNP-CF. The significant improvement in the hourly 2nd law efficiency is attributed to the excellent solar absorptivity of the CSCNP modified foam, along with its superior water transport properties and excellent evaporation characteristics, leading to improved water yield and augmented 2nd law efficiency. The average 2nd law efficiency was 11.15% (01.07.2021) and 11.82% (02.07.2021) for the TSS with CSCNP-CF.
 |
| | Fig. 13 Second law efficiency of different TSS on (a) 1st and (b) 2nd July, 2021. | |
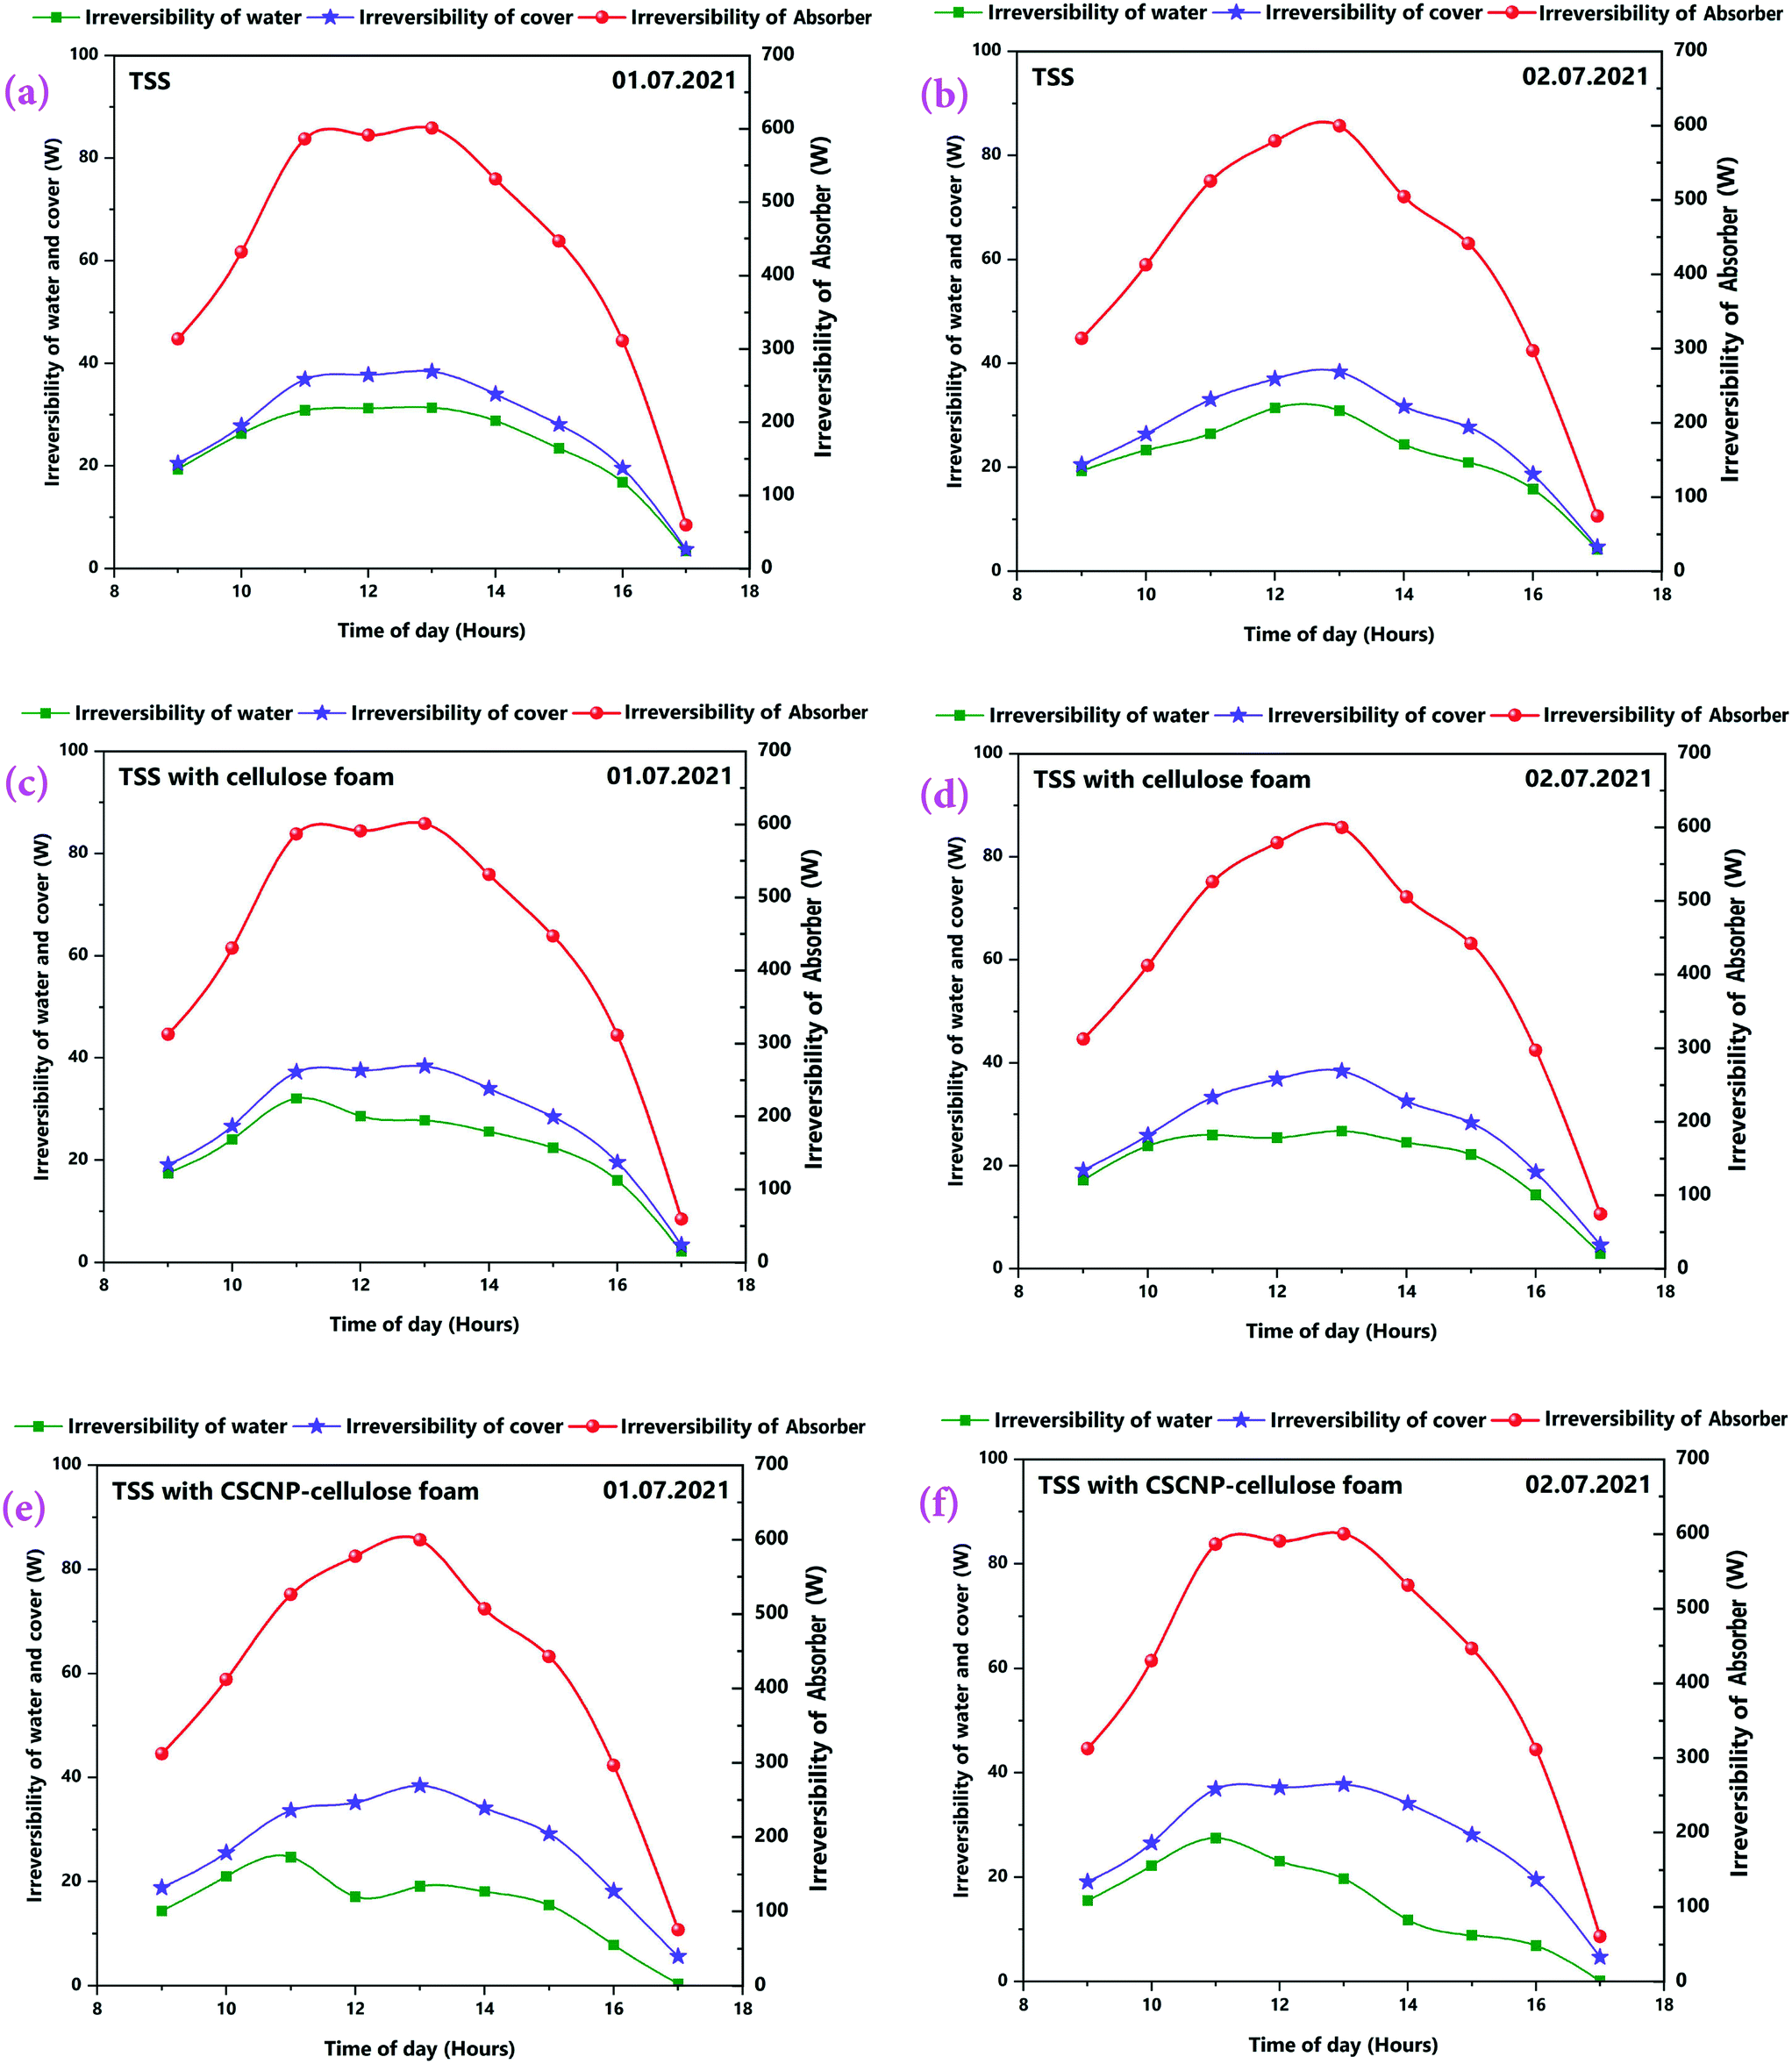
The hourly variation in the irreversibility rates of the TSS cover, water and absorber with and without CF is presented in Fig. 14(a–f), indicating that irreversibility increases throughout the morning as solar radiation increases. The rate of irreversibility for all the three points, i.e., water, cover and absorber reached the respective peak at 1 PM (at the time where solar radiation is maximum) and then, starts gradually reducing until 5 PM. It is clearly seen that the rate of irreversibility of the absorber is significantly higher than for the other two points (water and cover), which implies that the dependence of the rate of irreversibility on solar intensity is highest in the absorber. The higher rate of irreversibility of the absorber is mainly due to the larger temperature difference between the absorber and the sun, as well as the larger rate of exergy loss from the absorber to the surroundings. The rates of irreversibility for the cover and water are very small as compared to the absorber, and so, can be neglected. Similar results of irreversibility for the SS absorber were also reported by Sarhaddi et al.44 It is thus inferred that solar intensity is the major parameter which strongly influences the irreversibility rates. Considering Fig. 14(a–f), average values of the rate of irreversibility of cover, water and absorber of the various TSS set-ups are presented in Table 2.
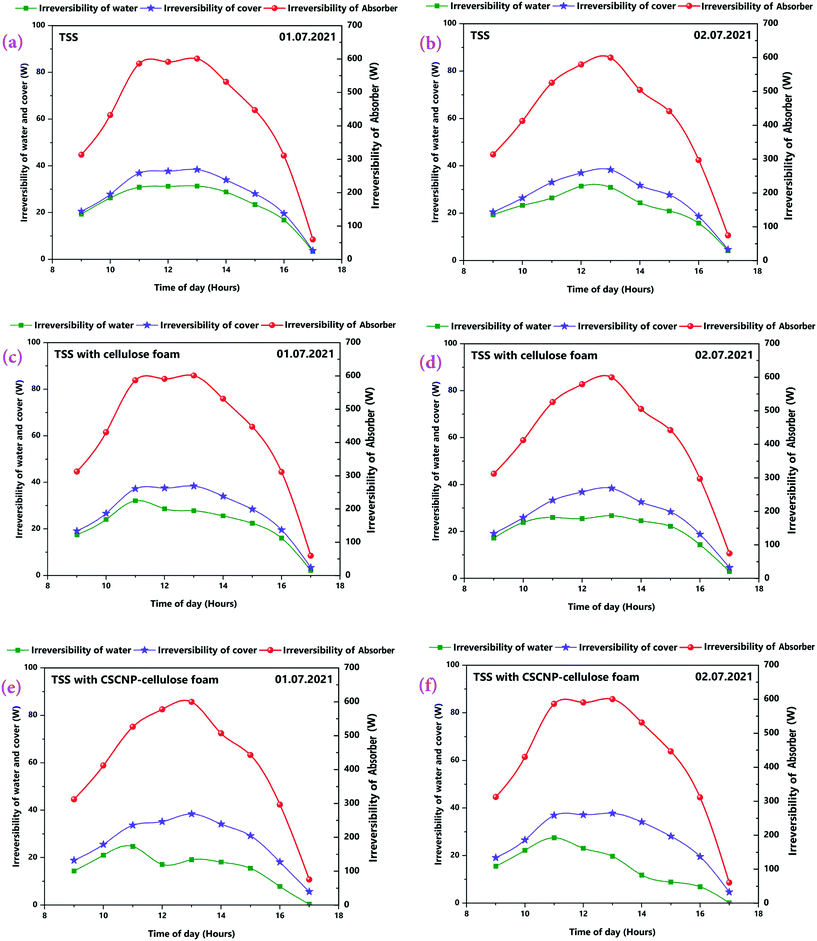 |
| | Fig. 14 (a–f) Rate of irreversibility of absorber, water and cover for three TSS set-ups on 1st and 2nd July, 2021. | |
Table 2 Rate of irreversibility of cover, water and absorber for different TSS for 1st and 2nd July, 2021
| Type of TSS |
Rate of irreversibility in Watt (0.1.07.2021) |
Rate of irreversibility in Watt (0.2.07.2021) |
| Cover |
Water |
Absorber |
Cover |
Water |
Absorber |
| Conventional TSS |
27.45 |
23.53 |
430.26 |
26.49 |
21.90 |
416.50 |
| TSS with CF |
27.18 |
21.81 |
429.98 |
26.45 |
20.38 |
416.45 |
| TSS with CSCNP-CF |
26.55 |
15.36 |
416.55 |
27.13 |
15.09 |
429.93 |
It is inferred that the average rate of irreversibility of the absorber was much higher than the other two components and thus, efforts must focus on reducing the rate of absorber irreversibility by introducing improved absorber design and condenser cover materials.
5. Water quality analysis before and after distillation
The quality of the produced water is the most crucial factor in desalination and the distilled water generated from the conversion of brackish water needs to be analyzed for purity and it should be compared with drinking water quality standards. Our proposed desalination device is capable of converting brackish water into freshwater and the conversion has been significantly improved with the use of CSCNP-CF in the basin. The brackish water sample, collected from industrial areas near Arasur, Coimbatore, India, was used as the feed-water into the basin.
A surface well near the Arasur industrial area was identified and samples were collected to use as feed-water. The water quality analysis is presented in Table 3. The water quality testing was conducted is a certified water testing laboratory in Chennai, India and the results are compared with the standard as prescribed by Indian standard IS 10500-2012. As seen in Table 3, all the water parameters were well-below the tolerable limits after the desalination of brackish water. In addition, the difference between the tolerable/acceptable limit and permitted limit is explained in detail in ESI.† It is concluded that the developed method for brackish water purification can very effectively purify the brackish water and that the developed method can be utilized in areas where the available surface water is brackish by completely operating the device through solar energy.
Table 3 Water quality analysis before and after the distillation of brackish water
| Testing parameters |
Before distillation |
After distillation |
Drinking water ‘IS 10500-2012’ |
| Tolerable limit |
Permitted limit |
| Total hardness (ppm) |
515 |
14 |
200 |
600 |
| Total dissolved solids (ppm) |
830 |
22 |
500 |
2000 |
| pH |
7.2 |
6.6 |
6.5–8.5 |
— |
| Alkalinity (ppm) |
380 |
14 |
200 |
600 |
| Magnesium (ppm) |
55 |
1 |
30 |
100 |
| Electrical conductivity (μS cm−1) |
1054 |
30 |
— |
— |
| Calcium (ppm) |
275 |
3 |
75 |
200 |
6. Cost analysis of the freshwater generated through TSS
Modification of the TSS with CF and CSCNP-CF have significantly augmented the water production and thus, it is important to assess the cost of the freshwater to provide the real-time feasibility of the developed approach. The carbon nanoparticles are derived from carbon soot, or the conversion of a pollutant (carbon soot from IC engine, candle or other similar sources are air-pollutants) into useful carbon nanoparticles that possess excellent thermo-physical properties and demonstrated excellent evaporation and water generation behaviours. The cost analysis of freshwater is carried out for the higher water productivity day i.e., 02.07.2021 using the formulas given by Kabeel et al.45 and El-Sebaii and El-Bialy.46
The annual fixed cost (AFC) is defined as per eqn (16):
where, CC is the present capital cost and CRF is the capital recovery factor, calculated as per
eqn (17):
where,
i is the rate of interest (10%) and
n is the lifespan of the TSS (10 years) and SFF is the sinking fund factor, determined as per
eqn (18):
| |  | (18) |
Salvage value is determined using
eqn (19):
Salvage annual value (SAV) is determined as per
eqn (20):
Yearly maintenance cost (YMC) is determined using
eqn (21):
Yearly cost (YC) is determined as per
eqn (22):
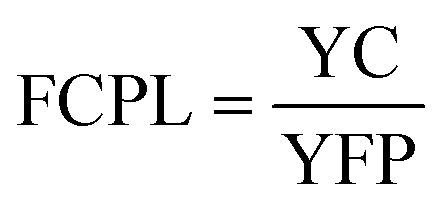
Freshwater cost per liter (FCPL) is determined using
eqn (23):
| |  | (23) |
where, YFP is the yearly freshwater productivity.
Component cost analysis of the three TSS variants is presented in Table 4 and it shows fixed costs of 84, 94 and 99 US $ for the bare, CF and CSCNP-CF TSS, respectively. The water cost analysis generated through the different modifications of the SS is presented in Table 5. As seen in Table 5, the higher water productivity of the modified TSS results in significantly lower water costs, and the CSCNP-CF modified TSS could generate 1920 liters of freshwater per m2 absorber area per year (considering 80% sunny days throughout the year at the experimental site47). The water cost per liter was only 0.009 US $ for the CSCNP-CF modified TSS, and the low cost is due to the operation of the device solely based on solar energy and the higher evaporation and excellent water output generated using the modified CSCNP foam. Table 6 presents the general cost analysis of fresh water generated through different methods reported in the literature.48 It is important to understand that for large capacity water generation, the cost may vary based on different conditions such as location, water intake type, plant capacity etc.
Table 4 Component wise total cost analysis of the different TSS in US $
| Components of still |
TSS |
TSS-CF |
TSS-CSCNP-CF |
| Milled-steel based water basin |
20 |
20 |
20 |
| Acrylic cover |
50 |
50 |
50 |
| Cellulose foam |
|
8 |
8 |
| CSCNP |
— |
— |
5 |
| Black paint |
3 |
3 |
3 |
| Fresh water port |
1 |
1 |
1 |
| Pipes |
2 |
2 |
2 |
| Foam-sheet insulation |
10 |
10 |
10 |
|
Total cost/fixed cost
|
86
|
94
|
99
|
Table 5 Cost analysis of freshwater generated through tubular desalination units. CC – capital cost; CRF – capital recovery factor; AFC – annual fixed cost; SV – salvage value; SFF – sinking fund factor; SAV – salvage annual value; YMC – yearly maintenance cost; YC – yearly cost; FCPL – freshwater cost per liter
| TSS type |
CC (US $) |
CRF |
AFC (US $) |
SV (US $) |
SFF |
SAV (US $) |
YMC (US $) |
YC (US $) |
FCPL (US $) |
| TSS |
86 |
0.163 |
13.996 |
17.2 |
0.0627 |
1.079 |
2.099 |
15.01 |
0.020 |
| TSS-CF |
94 |
0.163 |
15.298 |
18.8 |
0.0627 |
1.179 |
2.294 |
16.41 |
0.016 |
| TSS-CSCNP-CF |
99 |
0.163 |
16.111 |
19.8 |
0.0627 |
1.242 |
2.416 |
17.28 |
0.009 |
Table 6 Estimated cost of water generated through different techniques
| S. no |
Type of desalination method |
Feed-water type |
Cost in US $ m−3 |
| 1 |
Multi-effect distillation |
Brackish water |
0.5–1.05 |
| 2 |
Reverse osmosis |
0.26–0.54 |
| 3 |
Vapour compression |
0.87–1.15 |
| 4 |
Multistage flash desalination |
0.52–1.5 |
| 5 |
Solar desalination |
0.1–0.7 |
Our developed system is a portable small-scale freshwater generation unit, which is generally suitable for use to supply water to a small family. Therefore, the actual cost comparison of the freshwater generation unit operated through complete solar energy for small family purpose and for large scale capacity is not accurate. However, with the scaling of the solar based passive desalination technology, it could be possible to accurately compare the existing purification technology with our proposed technology.
7. Comparison of various approaches employed in TSS to augment the water yield
To demonstrate the significance of using CSCNP-CF in augmenting the overall performance of TSS, a comparison between outcomes achieved from the present work using CSCNP-CF and other modifications reported by various other research groups is presented in Table 7.
Table 7 Comparison of cost of water purification from published work with that determined in the present study
| Ref. |
Enhancement technique |
Water yield (L m−2 per day) |
Increase in water yield, compared to baseline case (%) |
Water cost (US $ L−1) |
| Kabeel et al.49 |
Conventional TSS |
4.5 |
24 |
— |
| TSS with glass cooling |
5.58 |
— |
| Sharshir et al.11 |
Conventional TSS |
3.35 |
62.98 |
0.0384 |
| TSS with mushroom coated with carbon black (75 g m−2) |
5.46 |
0.0254 |
| El-Said et al.50 |
Conventional TSS |
3.25 |
29.2 |
0.0309 |
| TSS using wire-mesh through the harmonic motion |
4.2 |
0.0347 |
| Elashmawy51 |
Conventional TSS |
3.96 |
13.6 |
0.0189 |
| TSS with gravel as energy storage material |
4.5 |
0.0167 |
| Arunkumar et al.52 |
TSS with compound parabolic concentrator |
5.33 |
8.2 |
— |
| TSS with compound parabolic concentrator and phase change material |
5.77 |
— |
| Present case |
Conventional TSS |
2.39 |
— |
0.020 |
| TSS with CF |
3.15 |
35.77 |
0.016 |
| TSS with CSCNP-CF |
6.27 |
170.25 |
0.009 |
As can be seen from Table 7, the present study using CSCNP-CF has significantly improved the freshwater generation potential of TSS. In addition, this method also generated the freshwater at a much lower cost than the other existing TSS approaches reported to date.
8. Conclusion
The utilization of solar energy for water desalting/purification through tubular solar still (TSS) is seen to have enormous potential to offer a sustainable method for increasing clean-energy and clean-water supplies. In this regard, we designed and developed a modified cellulose foam (CF) on which candle soot carbon nanoparticles (CSCNPs) were deposited for interfacial localized solar heating and evaporation inside the TSS. The simple and cheap method of preparing the 3-D interconnected CF through deposition of the carbon nanoparticles (from pollutants i.e., soot generated during burning of candle) are promising for large-scale sustainable solar driven evaporation and water production. The exceptional solar absorption behavior, and the hydrophilic 3-D interconnected fibers of the CSCNP-modified CF can efficiently absorb water and provides an optimal path for augmented solar-driven evaporation inside the TSS. The CSCNP-CF modified TSS achieved exceptional average evaporation efficiency of 77% with significantly improved freshwater productivity of 6.4 L m−2 per day compared to the unmodified TSS. Notably, the CSCNP-CF-TSS shows excellent water purification and the developed method successfully converted brackish water into freshwater, which could be used for drinking purposes. The low-cost fabrication method of the foam based TSS leads to a very low freshwater cost of 0.009 US $ per liter and thus the approach could be widely used in remote locations with abundant availability of solar energy. The present work demonstrates the achievement of high thermal performance and enhanced freshwater water output from tubular SS and the developed system will pave the way towards providing a low-cost, compact and portable desalination units with exceptional freshwater yield for various severe water-stressed low-income areas, and could be a critical step towards achieving the United Nations Sustainable Development Goal 6 of ensuring clean water for all.
9. Future recommendations
According to the proposed design, the water generation capacity of SS can be significantly improved by using CSCNPs deposited into cellulose foam, which is also a cost-effective method. However, the major concern of this device is that it is completely operated using solar energy and due to the intermittent nature of sunlight, operation of the TSS under unfavorable conditions could lead to drastic reduction in water yield. In addition, this device cannot generate freshwater during nocturnal hours. Therefore, phase change materials with excellent latent heat storage capacity could be incorporated into the basin alongside the existing materials to improve the freshwater yield even during nocturnal hours. In addition, use of higher conductive materials such as reduced graphene oxide and carbon-based nanomaterials could be hybridized with the CSCNPs to prepare a composite cellulose foam to further increase the evaporation and water generation. In addition, magnetic field generation could also increase the water evaporation and could be incorporated to increase the water production. Recently, coating of the SS absorber has gained significant attention53–56 and it can be used to increase the water production of TSS also.
Conflicts of interest
The authors declare that they have no known competing financial interests or personal relationships that could have appeared to influence the work reported in this paper.
Acknowledgements
Amrit Kumar Thakur would like to acknowledge the KPR Institute of Engineering and Technology, Coimbatore, India for grant of fellowship. The authors would like to thank Bharathwaaj Ramani and Joel Ebenezer Inbaraj for their support in image processing, and G. Selvakumar for analysing the SEM images from the Electron Microscopy facility at PSG COE INDUTECH. IL acknowledges funding from the European Union Horizon 2020 Programme via the NanoCommons project (grant agreement no 731032).
References
- C. J. Vörösmarty, P. Green, J. Salisbury and R. B. Lammers, Global water resources: vulnerability from climate change and population growth, Science, 2000, 289(5477), 284–288 CrossRef PubMed.
- M. M. Mekonnen and A. Y. Hoekstra, Four billion people facing severe water scarcity, Sci. Adv., 2016, 2(2), 1500323 CrossRef PubMed.
- S. Nisan and N. Benzarti, A comprehensive economic evaluation of integrated desalination systems using fossil fuelled and nuclear energies and including their environmental costs, Desalination, 2008, 229(1–3), 125–146 CrossRef CAS.
- K. M. Kotb, M. R. Elkadeem, A. Khalil, S. M. Imam, M. A. Hamada, S. W. Sharshir and A. Dán, A fuzzy decision-making model for optimal design of solar, wind, diesel-based RO desalination integrating flow-battery and pumped-hydro storage: Case study in Baltim, Egypt, Energy Convers. Manage., 2021, 235, 113962 CrossRef CAS.
- H. Jang, J. Choi, H. Lee and S. Jeon, Corrugated wood fabricated using laser-induced graphitization for salt-resistant solar steam generation, ACS Appl. Mater. Interfaces, 2020, 12(27), 30320–30327 CrossRef CAS PubMed.
- N. Ghaffour, J. Bundschuh, H. Mahmoudi and M. F. Goosen, Renewable energy-driven desalination technologies: A comprehensive review on challenges and potential applications of integrated systems, Desalination, 2015, 356, 94–114 CrossRef CAS.
- A. K. Thakur, R. Sathyamurthy, R. Velraj, R. Saidur and J. Y. Hwang, Augmented performance of solar desalination unit by utilization of nano-silicon coated glass cover for promoting drop-wise condensation, Desalination, 2021, 515, 115191 CrossRef CAS.
- A. K. Thakur, R. Sathyamurthy, R. Velraj, I. Lynch, R. Saidur, A. K. Pandey, S. W. Sharshir, Z. Ma, P. GaneshKumar and A. E. Kabeel, Sea-water desalination using a desalting unit integrated with a parabolic trough collector and activated carbon pellets as energy storage medium, Desalination, 2021, 516, 115217 CrossRef CAS.
- R. Sathyamurthy, H. J. Kennady, P. K. Nagarajan and A. Ahsan, Factors affecting the performance of triangular pyramid solar still, Desalination, 2014, 344, 383–390 CrossRef CAS.
- M. E. Attia, A. E. Kabeel, M. Abdelgaied and G. B. Abdelaziz, A comparative study of hemispherical solar stills with various modifications to obtain modified and inexpensive still models, Environ. Sci. Pollut. Res., 2021, 28(39), 55667–55677 CrossRef CAS PubMed.
- S. W. Sharshir, M. A. Hamada, A. W. Kandeal, E. M. El-Said, A. M. Elsaid, M. Rashad and G. B. Abdelaziz, Augmented performance of tubular solar still integrated with cost-effective nano-based mushrooms, Sol. Energy, 2021, 228, 27–37 CrossRef CAS.
- P. Bermel, K. Yazawa, J. L. Gray, X. Xu and A. Shakouri, Hybrid strategies and technologies for full spectrum solar conversion, Energy Environ. Sci., 2016, 9(9), 2776–2788 RSC.
- P. Wang, Emerging investigator series: the rise of nano-enabled photothermal materials for water evaporation and clean water production by sunlight, Environ. Sci.: Nano, 2018, 5(5), 1078–1089 RSC.
- L. Zhang, B. Bai, N. Hu and H. Wang, Low-cost and facile fabrication of a candle soot/adsorbent cotton 3D-interfacial solar steam generation for effective water evaporation, Sol. Energy Mater. Sol. Cells, 2021, 221, 110876 CrossRef CAS.
- S. Liu, C. Huang, Q. Huang, F. Wang and C. Guo, A new carbon-black/cellulose-sponge system with water supplied by injection for enhancing solar vapor generation, J. Mater. Chem. A, 2019, 7(30), 17954–17965 RSC.
- A. K. Thakur, R. Sathyamurthy, S. W. Sharshir, M. S. Ahmed and J. Y. Hwang, A novel reduced graphene oxide based absorber for augmenting the water yield and thermal performance of solar desalination unit, Mater. Lett., 2021, 286, 128867 CrossRef CAS.
- B. Zhang, C. Song, C. Liu, J. Min, J. Azadmanjiri, Y. Ni, R. Niu, J. Gong, Q. Zhao and T. Tang, Molten salts promoting the “controlled carbonization” of waste polyesters into hierarchically porous carbon for high-performance solar steam evaporation, J. Mater. Chem. A, 2019, 7(40), 22912–22923 RSC.
- N. Liu, L. Hao, B. Zhang, R. Niu, J. Gong and T. Tang, Rational Design of High-Performance Bilayer Solar Evaporator by Using Waste Polyester-Derived Porous Carbon-Coated Wood, Energy Environ. Mater., 2022, 1–10 CAS.
- H. Bai, N. Liu, L. Hao, P. He, C. Ma, R. Niu, J. Gong and T. Tang, Self-Floating Efficient Solar Steam Generators Constructed Using Super-Hydrophilic N, O Dual-Doped Carbon Foams from Waste Polyester, Energy Environ. Mater., 2022, 1–10 Search PubMed.
- S. Dutta, S. Y. Huang, C. Chen, J. E. Chen, Z. A. Alothman, Y. Yamauchi, C. H. Hou and K. C. Wu, Cellulose framework directed construction of hierarchically porous carbons offering high-performance capacitive deionization of brackish water, ACS Sustainable Chem. Eng., 2016, 4(4), 1885–1893 CrossRef CAS.
- M. Wang, X. Xu, J. Tang, S. Hou, M. S. Hossain, L. Pan and Y. Yamauchi, High performance capacitive deionization electrodes based on ultrathin nitrogen-doped carbon/graphene nano-sandwiches, Chem. Commun., 2017, 53(78), 10784–10787 RSC.
- X. Xu, A. E. Allah, C. Wang, H. Tan, A. A. Farghali, M. H. Khedr, V. Malgras, T. Yang and Y. Yamauchi, Capacitive deionization using nitrogen-doped mesostructured carbons for highly efficient brackish water desalination, Chem. Eng. J., 2019, 362, 887–896 CrossRef CAS.
- M. Zhu, Y. Li, F. Chen, X. Zhu, J. Dai, Y. Li, Z. Yang, X. Yan, J. Song, Y. Wang and E. Hitz, Plasmonic wood for high-efficiency solar steam generation, Adv. Energy Mater., 2018, 8(4), 1701028 CrossRef.
- L. Zhou, Y. Tan, D. Ji, B. Zhu, P. Zhang, J. Xu, Q. Gan, Z. Yu and J. Zhu, Self-assembly of highly efficient, broadband plasmonic absorbers for solar steam generation, Sci. Adv., 2016, 2(4), 1501227 CrossRef PubMed.
- Y. Liu, S. Yu, R. Feng, A. Bernard, Y. Liu, Y. Zhang, H. Duan, W. Shang, P. Tao, C. Song and T. Deng, A bioinspired, reusable, paper-based system for high-performance large-scale evaporation, Adv. Mater., 2015, 27(17), 2768–2774 CrossRef CAS PubMed.
- S. W. Sharshir, A. H. Elsheikh, Y. M. Ellakany, A. W. Kandeal, E. M. Edreis, R. Sathyamurthy, A. K. Thakur, M. A. Eltawil, M. H. Hamed and A. E. Kabeel, Improving the performance of solar still using different heat localization materials, Environ. Sci. Pollut. Res., 2020, 27(11), 12332–12344 CrossRef CAS PubMed.
- Z. Wang, X. Xu, J. Kim, V. Malgras, R. Mo, C. Li, Y. Lin, H. Tan, J. Tang, L. Pan and Y. Bando, Nano-architectured metal–organic framework/polypyrrole hybrids for brackish water desalination using capacitive deionization, Mater. Horiz., 2019, 6(7), 1433–1437 RSC.
- X. He, L. Zhang, X. Hu and Q. Zhou, Formation of S defects in MoS2-coated wood for high-efficiency seawater desalination, Environ. Sci.: Nano, 2021, 8(7), 2069–2080 RSC.
- H. Liu, T. Ye and C. Mao, Fluorescent carbon nanoparticles derived from candle soot, Am. Ethnol., 2007, 119(34), 6593–6595 Search PubMed.
- M. R. Mulay, A. Chauhan, S. Patel, V. Balakrishnan, A. Halder and R. Vaish, Candle soot: Journey from a pollutant to a functional material, Carbon, 2019, 144, 684–712 CrossRef CAS.
- R. Kanakaraj and C. Sudakar, Candle soot carbon nanoparticles as high-performance universal anode for M-ion (M= Li+, Na+ and K+) batteries, J. Power Sources, 2020, 458, 228064 CrossRef CAS.
- I. Y. Bu, Synthesis of graphitic carbon nano-onions for dye sensitized solar cells, Sol. Energy, 2014, 105, 236–242 CrossRef CAS.
- B. Zhang, D. Wang, B. Yu, F. Zhou and W. Liu, Candle soot as a supercapacitor electrode material, RSC Adv., 2014, 4(6), 2586–2589 RSC.
- E. M. El-Said, S. M. Elshamy and A. E. Kabeel, Performance enhancement of a tubular solar still by utilizing wire mesh packing under harmonic motion, Desalination, 2020, 474, 114165 CrossRef CAS.
-
T. J. Kotas, The exergy method of thermal plant analysis, Elsevier, 2013 Search PubMed.
- R. Sathyamurthy, A. E. Kabeel, A. Chamkha, H. A. Kumar, H. Venkateswaran, A. M. Manokar, R. Bharathwaaj and S. Vasanthaseelan, Exergy and energy analysis of a tubular solar still with and without fins: a comparative theoretical and experimental approach, Environ. Sci. Pollut. Res., 2021, 1 Search PubMed.
- C. J. Liang, J. D. Liao, A. J. Li, C. Chen, H. Y. Lin, X. J. Wang and Y. H. Xu, Relationship between wettabilities and chemical compositions of candle soots, Fuel, 2014, 128, 422–427 CrossRef CAS.
- B. Jache, C. Neumann, J. Becker, B. M. Smarsly and P. Adelhelm, Towards commercial products by nanocasting: characterization and lithium insertion properties of carbons with a macroporous, interconnected pore structure, J. Mater. Chem., 2012, 22(21), 10787–10794 RSC.
- K. Park, D. B. Kittelson and P. H. McMurry, Structural properties of diesel exhaust particles measured by transmission electron microscopy (TEM): Relationships to particle mass and mobility, Aerosol Sci. Technol., 2004, 38(9), 881–889 CrossRef CAS.
- A. Bredin, A. V. Larcher and B. J. Mullins, Thermogravimetric analysis of carbon black and engine soot—Towards a more robust oil analysis method, Tribol. Int., 2011, 44(12), 1642–1650 CrossRef CAS.
- X. Wu, G. Y. Chen, W. Zhang, X. Liu and H. Xu, A plant-transpiration-process-inspired strategy for highly efficient solar evaporation, Adv. Sustainable Syst., 2017, 1(6), 1700046 CrossRef.
-
J. Carvill, Mechanical engineer's data handbook/J. Carvill, Butterworth-Heinemann, Boston, 1993 Search PubMed.
- K. Elmaadawy, A. W. Kandeal, A. Khalil, M. R. Elkadeem, B. Liu and S. W. Sharshir, Performance improvement of double slope solar still via combinations of low cost materials integrated with glass cooling, Desalination, 2021, 500, 114856 CrossRef CAS.
- F. Sarhaddi, F. F. Tabrizi, H. A. Zoori and S. A. Mousavi, Comparative study of two weir type cascade solar stills with and without PCM storage using energy and exergy analysis, Energy Convers. Manage., 2017, 133, 97–109 CrossRef CAS.
- A. E. Kabeel, A. M. Hamed and S. A. El-Agouz, Cost analysis of different solar still configurations, Energy, 2010, 35(7), 2901–2908 CrossRef.
- A. A. El-Sebaii and E. El-Bialy, Advanced designs of solar desalination systems: A review, Renewable Sustainable Energy Rev., 2015, 49, 1198–1212 CrossRef CAS.
- R. Dhivagar, M. Mohanraj, K. Hidouri and Y. Belyayev, Energy, exergy, economic and enviro-economic (4E) analysis of gravel coarse aggregate sensible heat storage-assisted single-slope solar still, J. Therm. Anal. Calorim., 2021, 145(2), 475–494 CrossRef CAS.
-
R. S. Hansen, Experimental and theoretical investigations on the
performance of inclined type solar stills, Anna University, India, 2018 Search PubMed.
- A. E. Kabeel, M. Abdelgaied and A. Eisa, Effect of graphite mass concentrations in a mixture of graphite nanoparticles and paraffin wax as hybrid storage materials on performances of solar still, Renewable Energy, 2019, 132, 119–128 CrossRef CAS.
- E. M. El-Said, S. M. Elshamy and A. E. Kabeel, Performance enhancement of a tubular solar still by utilizing wire mesh packing under harmonic motion, Desalination, 2020, 474, 114165 CrossRef CAS.
- M. Elashmawy, Improving the performance of a parabolic concentrator solar tracking-tubular solar still (PCST-TSS) using gravel as a sensible heat storage material, Desalination, 2020, 473, 114182 CrossRef.
- T. Arunkumar and A. E. Kabeel, Effect of phase change material on concentric circular tubular solar still-Integration meets enhancement, Desalination, 2017, 414, 46–50 CrossRef CAS.
- A. K. Thakur, R. Sathyamurthy, R. Saidur, R. Velraj, I. Lynch and N. Aslfattahi, Exploring the potential of MXene-based advanced solar-absorber in improving the performance and efficiency of a solar-desalination unit for brackish water purification, Desalination, 2022, 526, 115521 CrossRef CAS.
-
A. K. Thakur, R. Sathyamurthy and K. P. Ganesh, A Comparative Investigation of Energy Storage Potential of Nanoparticles Doped in Black Paint Coated Absorber for Solar Desalination Application, in Composite Materials for Extreme Loading, Springer, Singapore, 2022, pp. 35–50 Search PubMed.
- A. K. Thakur, R. Sathyamurthy, S. W. Sharshir, M. R. Elkadeem, Z. Ma, A. M. Manokar, M. Arıcı, A. K. Pandey and R. Saidur, Performance analysis of a modified solar still using reduced graphene oxide coated absorber plate with activated carbon pellet, Sustain. Energy Technol. Assess., 2021, 45, 101046 Search PubMed.
- A. K. Thakur, R. Sathyamurthy, R. Velraj, R. Saidur, I. Lynch, R. Venkatesh, P. G. Kumar, S. C. Kim and M. Sillanpää, A novel solar absorber using activated carbon nanoparticles synthesized from bio-waste for the performance improvement of solar desalination unit, Desalination, 2022, 527, 115564 CrossRef CAS.
Footnote |
| † Electronic supplementary information (ESI) available. See DOI: 10.1039/d1en01112j |
|
| This journal is © The Royal Society of Chemistry 2022 |
Click here to see how this site uses Cookies. View our privacy policy here. 
 Open Access Article
 This Open Access Article is licensed under a
  *a,
Ravishankar
Sathyamurthy
*a,
R.
Velraj
b and
Iseult
Lynch
*a,
Ravishankar
Sathyamurthy
*a,
R.
Velraj
b and
Iseult
Lynch