
 Open Access Article
 This Open Access Article is licensed under a Creative Commons Attribution-Non Commercial 3.0 Unported Licence
The dependence of soot particle ice nucleation ability on its volatile content†
Kunfeng
Gao
 abc,
Hans-Christian
Koch
d,
Chong-Wen
Zhou
*a and
Zamin A.
Kanji
*c
abc,
Hans-Christian
Koch
d,
Chong-Wen
Zhou
*a and
Zamin A.
Kanji
*c
aSchool of Energy and Power Engineering, Beihang University, Beijing, China. E-mail: cwzhou@buaa.edu.cn
bShenyuan Honours College of Beihang University, Beihang University, Beijing, China
cDepartment of Environmental Systems Science, Institute for Atmospheric and Climate Science, ETH Zurich, Zurich 8092, Switzerland. E-mail: zamin.kanji@env.ethz.ch
dBruker Switzerland AG, Fallanden 8117, Switzerland
First published on 17th August 2022
Abstract
Aviation soot can affect contrail and cirrus cloud formation and impact climate. A product of incomplete combustion, soot particles, are fractal and hydrophobic aggregates comprising carbonaceous spheres with complex physicochemical properties. In the cirrus cloud regime, the surface wettability and pore abundance of soot particles are important determinants for their ice nucleation ability via pore condensation and freezing. In the atmosphere, soot particles can undergo various ageing processes which modify their surface chemistry and porosity, thus acting as ice nucleating particles with varying abilities as a function of ageing. In this study, size-selected soot particles were treated by thermal denuding at 573 K in a pure nitrogen (N2) or synthetic air (N2 + O2) flow and then exposed to varying relative humidity conditions at a fixed temperature in the range from 218 to 243 K, to investigate the role of volatile content in the ice nucleation ability. Both organic-lean and organic-rich propane (C3H8) flame soot particles, as well as two types of commercially available carbon black soot particles with high and low surface wettability, were tested. The size and mass distribution of soot aerosol were monitored during the ice nucleation experiments. Bulk soot samples also prepared in pure N2 or synthetic air environments at 573 K were characterised by thermogravimetric analysis, Fourier transform infrared spectroscopy and dynamic vapour sorption measurements, to reveal the relation between denuding volatile content, associated soot particle property modifications and the ice nucleation ability. Our study shows that thermal denuding induces a change in soot particle porosity playing a dominant role in regulating its ice nucleation via the pore condensation and freezing mechanism. The enrichment in mesopore (2–50 nm) availability may enhance soot ice nucleation. The presence of O2 in the thermal denuding process may introduce new active sites on soot particles for water interaction and increase soot surface wettability. However, these active sites only facilitate soot ice nucleation when mesopore structures are available. We conclude that a change in volatile content modifies both morphological properties and surface chemistry for soot particles, but porosity change plays the dominant role in regulating soot particle ice nucleation ability.
Environmental significanceThe aerosol–cloud-interaction of soot particles is poorly constrained (indirect climate effect). Soot particles with complex and heterogeneous properties are universally found in the troposphere. Soot emission sources co-emit volatile species that can condense or react with the particles thus changing their physical and chemical properties. This process of property modification is termed atmospheric ageing. The complex ageing processes makes it challenging to predict soot particle impacts on ice cloud formation. Here we investigate how the volatile content will influence the physical and chemical properties that are responsible for cloud droplet and ice crystal formation relevant for mixed-phase and cirrus clouds in the troposphere which will have implications for aviation soot induced cloud formation. |
1 Introduction
Soot particles are one of the most important non-CO2 particulate emissions1 with poorly constrained climate impacts.2,3 By acting as cloud condensation nuclei (CCN) or ice nucleating particles (INPs), soot particles can form water droplets or nucleate ice crystals, contributing to liquid or ice cloud formation.4–6 Soot particles emitted by aircraft engines at high altitudes are able to influence aviation contrail evolution and further cirrus cloud formation, thereby modifying the cirrus cloud coverage in aviation corridors and modulating regional atmospheric radiative forcing.7–9 Globally, soot aerosol–cloud interactions can alter both the sign and magnitude of its total annual radiative forcing and the largest uncertainty remains in the cirrus cloud regime.3,6,10 However, laboratory studies suggest that the ice nucleation (IN) ability of soot particles is poorly constrained, in part because of their complex and heterogeneous physicochemical properties, and also due to varying physiochemical properties during their atmospheric transportation.There is accumulating evidence from laboratory studies that the pore condensation and freezing (PCF) process is an important pathway for soot IN in the cirrus cloud regime.11,12 Porosity characteristics and surface wettability are viewed as crucial and decisive properties for soot particle IN via PCF.13–16 PCF favours both mesopore (2 nm < Dp (pore diameter) < 50 nm)17 structures and a low soot–water contact angle to first induce supercooled water condensation in the pore.18–20 An ice crystal can form via homogeneous freezing of supercooled pore-water when the temperature (T) is lower than homogeneous nucleation temperature (HNT = 235 K) or by immersion freezing at T > 235 K if active sites are present within the pore and if the pore size is large enough to host an ice germ at the nucleation temperature.18 Given that soot particles are a product of incomplete combustion and mainly comprise graphitized primary particles,21–23 the porosity and surface wettability can be changed by non-carbonized components associated with soot during combustion or by external material coating during atmospheric ageing processes.24,25 As a result, non-graphitized content changes may interfere with soot particle PCF processes both by changing the pore volume and by influencing the surface wettability.
Laboratory studies suggested that the organic content is of significance to soot particle IN. For example, Möhler et al.26 suggested that the IN ability of propane (C3H8) flame soot can be considerably supressed by high level of organic matter (OM) coverage rendering active sites unavailable. This finding is further supported by Crawford et al.27 who showed that soot particles with a 5% OM content by mass are more active INPs compared to those with a 30% OM content. Mahrt et al.11 also suggested that hydrophobic nature of OM in organic-rich C3H8 flame soot is responsible for its suppressed IN ability. Zhang et al.28 studied the coating effects of secondary organic aerosol (SOA) on the IN ability of soot particles and noted that SOA coating suppresses soot IN at T < HNT in the cirrus cloud regime by filling in pore structures relevant to PCF. However, Friedman et al.29 found that organic acid coated and size-selected C3H8 flame soot particles do not show prominently different IN behaviour for 233 < T < 253 K compared to the uncoated particles. The authors actually observed no IN at T > 233 K,29 which is consistent with a recent study by Kanji et al.30 who reported black carbon particles are not relevant for IN at T > HNT. In contrast to OM addition by coating, Demirdjian et al.31 suggested that the removal of hydrophobic material by heating at 473 K results in enhanced IN for soot particles.
The chemical property of OM on soot particle surface also regulates its IN because the OM content may modify soot particle surface polarity, oxidation level and hydrophilicity. However, conflicting results were reported in the literature. For example, some studies suggested that oxidised soot surfaces promote heterogeneous IN. Gorbunov et al.32 noted that oxidation introduced surface chemical groups enhance soot IN by promoting hydrogen bond formation with water. Kireeva et al.33 and Koehler et al.34 also suggested that oxygen-containing functional groups on soot surfaces may facilitate its IN. Hausler et al.35 reported that surface functionalisation for carbonaceous material increases its hydrophilicity by generating new active sites and thus promoting IN. By contrast, some studies demonstrated that hydrophilicity is not a sufficient predictor for soot IN and low surface oxidation levels facilitate soot IN.36–40 Whale et al.38 reported that less oxidised carbon nanotubes can nucleate ice more effectively than highly oxidised ones because highly oxidised soot surface with a large polar site density inhibits IN by confining the freedom of water molecules and thus preventing them from rearranging into ice structures. Similarly, Bi et al.39 presented simulation results showing that increased hydrophilicity leads to decreased IN. Most recently, Nichman et al.12 reported that oxidised soot particles freeze homogeneously whereas unoxidised or slightly oxidised soot samples can form ice below homogeneous freezing conditions (HNT and Si = 1.4 (saturation ratio with respect to ice)). The authors deduced that surface oxidation inevitably introduces a change in the soot particle pore structure which is favourable for PCF, though accompanied with surface polarity and hydrophilicity increase.12 Very likely, soot particle oxidation level or hydrophilicity modification induced by surface OM content change occurs simultaneously with soot particle morphology modifications, thus the combined effects play the role in changing soot IN.12,35,41 Therefore, determining the role of OM in soot IN requires systematic experimental investigations.
In this study, the dependence of soot particle IN ability on volatile content was investigated under mixed-phase and cirrus cloud conditions. Thermal denuding at 573 K in a pure nitrogen (N2) or a synthetic air (N2 + O2) atmosphere was used to change the soot particle volatile content. Then, the IN abilities of size-selected soot particles were observed in a continuous flow diffusion chamber at 218 < T < 243 K. Additionally, systematic measurements characterising the physicochemical properties of soot samples were performed, including soot particle size and mass distribution, the mass of bulk soot volatile content, the chemical composition and functional group changes of soot samples, as well as soot–water interaction activities.
2 Experimental methods
2.1 Instrumentation
In Fig. 1, the experimental schematic is divided into three parts, including sample generation, IN experiments and sample characterisation measurements. A miniature combustion aerosol standard (miniCAST, model 4200, Jing Ltd, Zollikofen, Switzerland) system was used to generate C3H8 flame soot under different fuel to air ratios and a dry dispersion setup was utilised to disperse two types of carbon black powder. A 1 L min−1 aerosol flow was sent through a differential mobility analyser (DMA; classifier 3080, with a 3081 column and a polonium radiation source, TSI Inc.) to select monodisperse soot aerosol particles of 200 or 400 nm. Size-selected aerosol particles were directed to a thermal denuder at 573 K or to a bypass volume before being diluted by a factor of 5. Diluted aerosol sample (5 L min−1) was split into five pathways, including a condensation particle counter (CPC; Model 3772, TSI Inc.) for measuring particle number concentration (1 L min−1), a horizontal ice nucleation chamber (HINC)42,43 for IN experiments (0.22 L min−1). A high efficiency particulate air capsule (HEPA, PALL Corporation) filter was used for the exhaust flow. A scanning mobility particle sizer (SMPS, classifier 3082, column 3081, CPC 3776 low-flow mode 0.3 L min−1, TSI Inc.) and a centrifugal particle mass analyser (CPMA, Cambustion Ltd, Cambridge, UK) with a 1.5 L min−1 flow pulled by a water CPC (model 3787, high-flow mode, TSI Inc.) were used to test particle size and mass distribution, respectively. In addition, 400 nm C3H8 flame soot particles were visualised using transmission electron microscopy (TEM) technique. Bulk soot samples were also analysed by thermogravimetric analysis (TGA, Q50, TA Instruments, Eschborn), Fourier transform infrared spectroscopy (FTIR, Tensor 27, Brucker) and dynamic vapour sorption (DVS, Aquadyne DVS-2, 3P Instruments GmbH & Co. KG) measurements.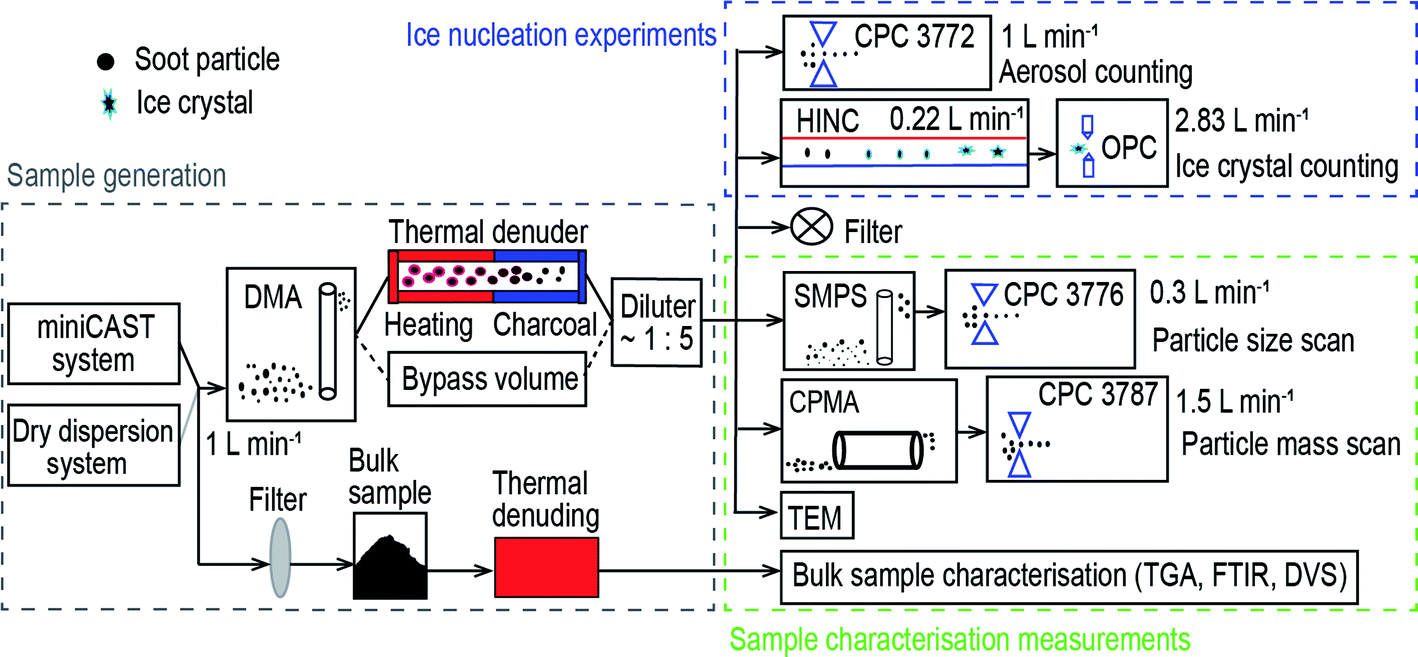 | ||
| Fig. 1 Schematic of the experimental setup. miniCAST: miniature combustion aerosol standard; DMA: differential mobility analyser; CPC: condensation particle counter; HINC: horizontal ice nucleation chamber; OPC: optical particle counter; SMPS: scanning mobility particle sizer; CPMA: centrifugal particle mass analyser; TEM: transmission electron microscopy; TGA: thermogravimetric analyser; FTIR: Fourier transform infrared spectroscopy; DVS: dynamic vapour sorption. | ||
2.2 Sample generation
Each type of soot sample was denuded at 573 K in either a synthetic air or pure N2 atmosphere. It is expected that N2 thermal denuding mainly removes the volatile content from the particle whereas the soot particle surface could oxidise in the presence of O2 upon thermal denuding in air in addition to volatile content removal. The miniCAST system was operated at fuel/air ratios of 0.95 and 1.03 to generate organic-lean and -rich C3H8 flame soot samples, termed mCASTblack and mCASTbrown respectively. Before particle size selection, the combustion exhaust was diluted by a factor of 100 with particle and organic free air (20.9% O2) through a dilutor (Model VKL100, Palas) and then fed into a 125 L mixing volume to allow particle coagulation and concentration stabilisation. The DMA was used to select 200 or 400 nm soot particles with a sample to sheath flow ratio of 1![[thin space (1/6-em)]](https://www.rsc.org/images/entities/char_2009.gif) :13 or 1:7.3, respectively. Size-selected soot particles were either denuded at 573 K, referred to mCASTblack-air or mCASTbrown-air, or bypassed the thermal denuder before sending to downstream experiments. To denude soot particles under N2 atmosphere, the Palas dilutor was connected to a pure N2 (99.99%) source. Generated soot samples were termed mCASTblack-N2 or mCASTbrown-N2 hereafter. In addition, commercial carbon black FW200 and Printex90 (Orion Engineered Carbons GmbH, OEC, Frankfurt, Main, Germany) with different graphitization levels were used. Dry carbon black powder was sufficiently stirred for two weeks and then aerosolised by a dry dispersion setup introduced in Gao et al.13 Filtered and organic free air (20.9% O2) source was used to generate untreated or air denuded carbon black aerosols, termed FW200, PR90, and FW200-air, PR90-air respectively. Pure N2 source was deployed in the dry dispersion setup to establish an O2 free thermal denuding atmosphere, by which generated soot samples are termed FW200-N2 and PR90-N2. Different soot samples are summarised in Table 1.
:13 or 1:7.3, respectively. Size-selected soot particles were either denuded at 573 K, referred to mCASTblack-air or mCASTbrown-air, or bypassed the thermal denuder before sending to downstream experiments. To denude soot particles under N2 atmosphere, the Palas dilutor was connected to a pure N2 (99.99%) source. Generated soot samples were termed mCASTblack-N2 or mCASTbrown-N2 hereafter. In addition, commercial carbon black FW200 and Printex90 (Orion Engineered Carbons GmbH, OEC, Frankfurt, Main, Germany) with different graphitization levels were used. Dry carbon black powder was sufficiently stirred for two weeks and then aerosolised by a dry dispersion setup introduced in Gao et al.13 Filtered and organic free air (20.9% O2) source was used to generate untreated or air denuded carbon black aerosols, termed FW200, PR90, and FW200-air, PR90-air respectively. Pure N2 source was deployed in the dry dispersion setup to establish an O2 free thermal denuding atmosphere, by which generated soot samples are termed FW200-N2 and PR90-N2. Different soot samples are summarised in Table 1.
| Type of soot | Thermal denuding atmosphere | Final mass loss at 300 °C | Distinct functional group changes | D m (nm) | M p* (fg) | Hysteresis in DVS isotherms | |||
|---|---|---|---|---|---|---|---|---|---|
| 400 nm | 200 nm | 400 nm | 200 nm | ||||||
| C3H8 soot | mCASTblack | Fresh | 1.51% | — | 394.5 | 206.4 | 7.31 | 1.78 | Yes |
| mCASTblack-N2 | N2 | — | C![[double bond, length as m-dash]](https://www.rsc.org/images/entities/char_e001.gif) O, C–O O, C–O |
389.8 | 206.7 | 6.82 | 1.75 | — | |
| mCASTblack-air | Air (N2 + O2) | 0.78% | CO, C–O |
391.4 | 203.4 | 7.32 | 1.78 | No | |
| mCASTbrown | Fresh | 11.61% | — | 395.4 | 205.2 | 6.14 | 1.14 | No | |
| mCASTbrown-N2 | N2 | — | CO, CC, CO–NH, C–O, C–O–C, C–H |
307.2 | 179.7 | 5.35 | 0.94 | — | |
| mCASTbrown-air | Air (N2 + O2) | 0.89% | CO, CC, CO–NH, C–O, C–O–C, C–H |
315.3 | 178.8 | 4.46 | 0.92 | Yes | |
| Carbon black | FW200 | Fresh | 6.82% | — | 402.0 | 202.5 | 17.07 | 2.54 | Yes |
| FW200-N2 | N2 | — | No | 397.8 | 200.5 | 17.77 | 2.56 | — | |
| FW200-air | Air (N2 + O2) | 3.25% | No | 399.0 | 198.2 | 16.90 | 2.40 | Yes | |
| PR90 | Fresh | 1.05% | — | 405.3 | 203.0 | 17.65 | 2.57 | Yes | |
| PR90-N2 | N2 | — | No | 402.4 | 201.0 | 17.22 | 2.57 | — | |
| PR90-air | Air (N2 + O2) | 0.56% | No | 400.4 | 200.9 | 16.30 | 2.58 | Yes | |
For bulk sample characterisation, mCASTblack and mCASTbrown soot were first deposited on filters (PALL, 47 mm, Tissuquartz 2500AQT-UP) by an air pump close to the outlet of the miniCAST and then scraped off. To mimic aerosol particle denuding conditions, soot powders were heated in an oven at 573 K in an air (20.9% O2) or pure N2 atmosphere for 6 hours before conducting bulk sample characterisation measurements. For the ease of discussion, oven-heated soot samples are also named using the same suffix as for denuded aerosol particles in the same atmosphere.
2.3 Ice nucleation experiments
Size-selected soot particle IN abilities were measured at a fixed T by running RH (relative humidity) scans in HINC.42,43 The IN experiment T range covers cirrus and mixed phase cloud regime from 218 to 243 K and the RH scan at each T with a 2% min−1 RHi (relative humidity with respect to ice) slope starts from ice saturation conditions (RHi = 100%) and ends at RHw = 110% (relative humidity with respect to water). Diffusion dryers were used to reduce the soot aerosol sample RHw to less than 3%. The concept and principle of HINC operation are elaborated in detail by Lacher et al.43 and Mahrt et al.11 Briefly, a linear T and water vapour pressure profile can be established in the chamber between two ice coated walls at different T (ΔT, Ttop > Tbottom). Since the equilibrium vapour pressure is nonlinear as a function of T (Clausius–Clapeyron equation), a RH profile with water sub- and supersaturated conditions can be achieved in HINC. The RH profile can be determined using the parameterisation suggested by Murphy and Koop.44 Jacketed by a pure N2 sheath flow, a soot particle aerosol flow (aerosol to sheath flow ratio of 1:12) is injected and confined to the centre of the chamber. Hence, RH conditions in the aerosol layer, which is also at the centre of the RH profile, can be determined. Considering an uncertainty of ±0.1 K for T control, the variation of the RH profile across the aerosol layer is calculated to have the largest uncertainty in RHw of about 5% at the lowest T = 218 K and highest RHw = 110% condition, and the uncertainty decreases with increasing T and at lower RH conditions. Detailed discussion can be found in Mahrt et al.11 With a fixed aerosol injector position of 25 cm, the particle residence time is approximately equivalent to 10.1–12.3 s for 243 > T > 218 K in the HINC chamber and increases with decreasing T. To evaluate soot particle activated fraction (AF) values, an optical particle counter (OPC) running at different optical size channels, including 1.0, 2.0, 3.0, 4.0 and 5.0 μm, was used to count the number of ice crystals or water droplets (nice or water droplets) exiting the chamber. The ratio of activated particle number to the total number of soot particles (nsoot particles) entering the chamber recorded by the CPC, i.e., the AF, can be calculated according to (eqn. (1)):| AF = nice or water droplets/nsoot particles | (1) |
The soot particle AF values can be presented as a function of RH at a fixed T. Soot particles detected by the OPC can be water droplets or ice crystals at T > HNT. Since Si > Sw (saturation ratio with respect to water), ice crystals grow much larger than water droplets under the same RH and T conditions in HINC. By comparing the AF curves derived from different OPC size channels, the phase of the particle exiting HINC can be discriminated. At the same T as for soot particle IN experiments, we also performed RH scans for 200 nm ammonium nitrate particles (see Fig. S1†) which do not freeze at T > HNT (remain as supercooled liquid droplets) but freeze homogeneously at T < HNT.43,45 As a reference, we are able to evaluate the particle phase by comparing the AF curves of soot particles to those of ammonium nitrate particles in large OPC channels and at the same T.
2.4 Sample characterisation measurements
:3.0 (0.3:1.8) for 200 (400) nm size-selected soot particles, covering a size scanning range 14–594 (19–851) nm, thus including double-charged particle sizes. The CPMA mass scan was performed with a mass resolution better than 3%.
By assessing the soot water vapour isotherm characteristics, water uptake abilities can be qualitatively evaluated.46,47 The pore-volume based pore size distribution (PSD) of a soot sample as a function of pore radius (rp) can also be derived.15,46 The quantitative porosity analysis is based on the Kelvin equation:
| rk = −(2γsl·vs·cos(θ))/RT ln(RHw/100%) | (2) |
3 Results and discussion
3.1 Ice nucleation dependence on volatile content
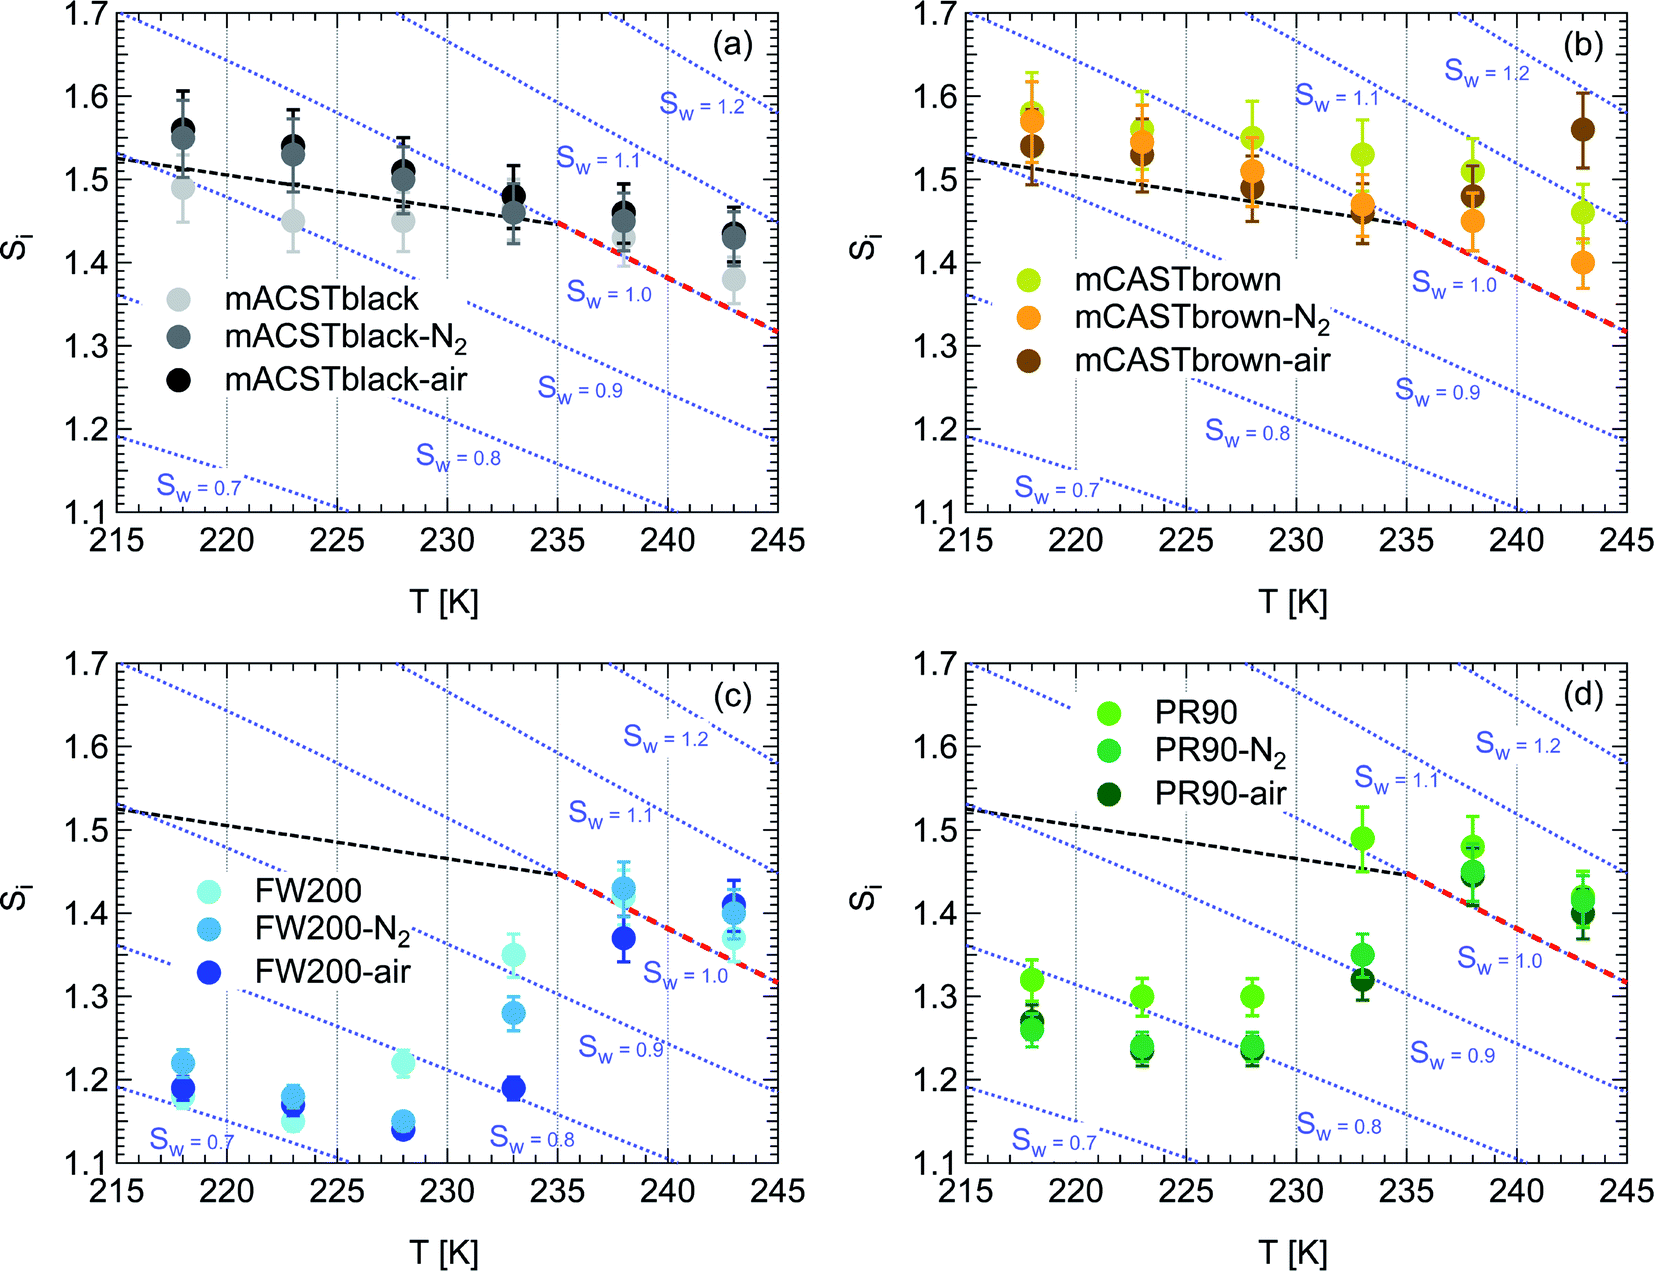 | ||
| Fig. 2 Onset (at AF = 0.1%) ice saturation ratio (Si) as a function of T for fresh and denuded 400 nm mCASTblack (a), mCASTbrown (b), FW200 (c) and PR90 (d). AF is reported from the 1.0 μm OPC channel. Black dashed line: homogeneous freezing conditions for solution droplets at T < HNT, according to Koop et al.45 Light blue dotted line: constant water saturation conditions calculated based on Murphy and Koop.44 Red dashed line: the 1.0 μm size water droplet survival conditions for T > HNT, where the phase of the particle larger than 1.0 μm can be either ice or liquid water. The Si uncertainty due to the temperature uncertainty (±0.1 K) of the HINC chamber is indicated as error bars. Each data point was derived from the AF curves in Fig. 9–12 presented in the Appendix in which each AF curve is an average of at least two individual RH ramps. | ||
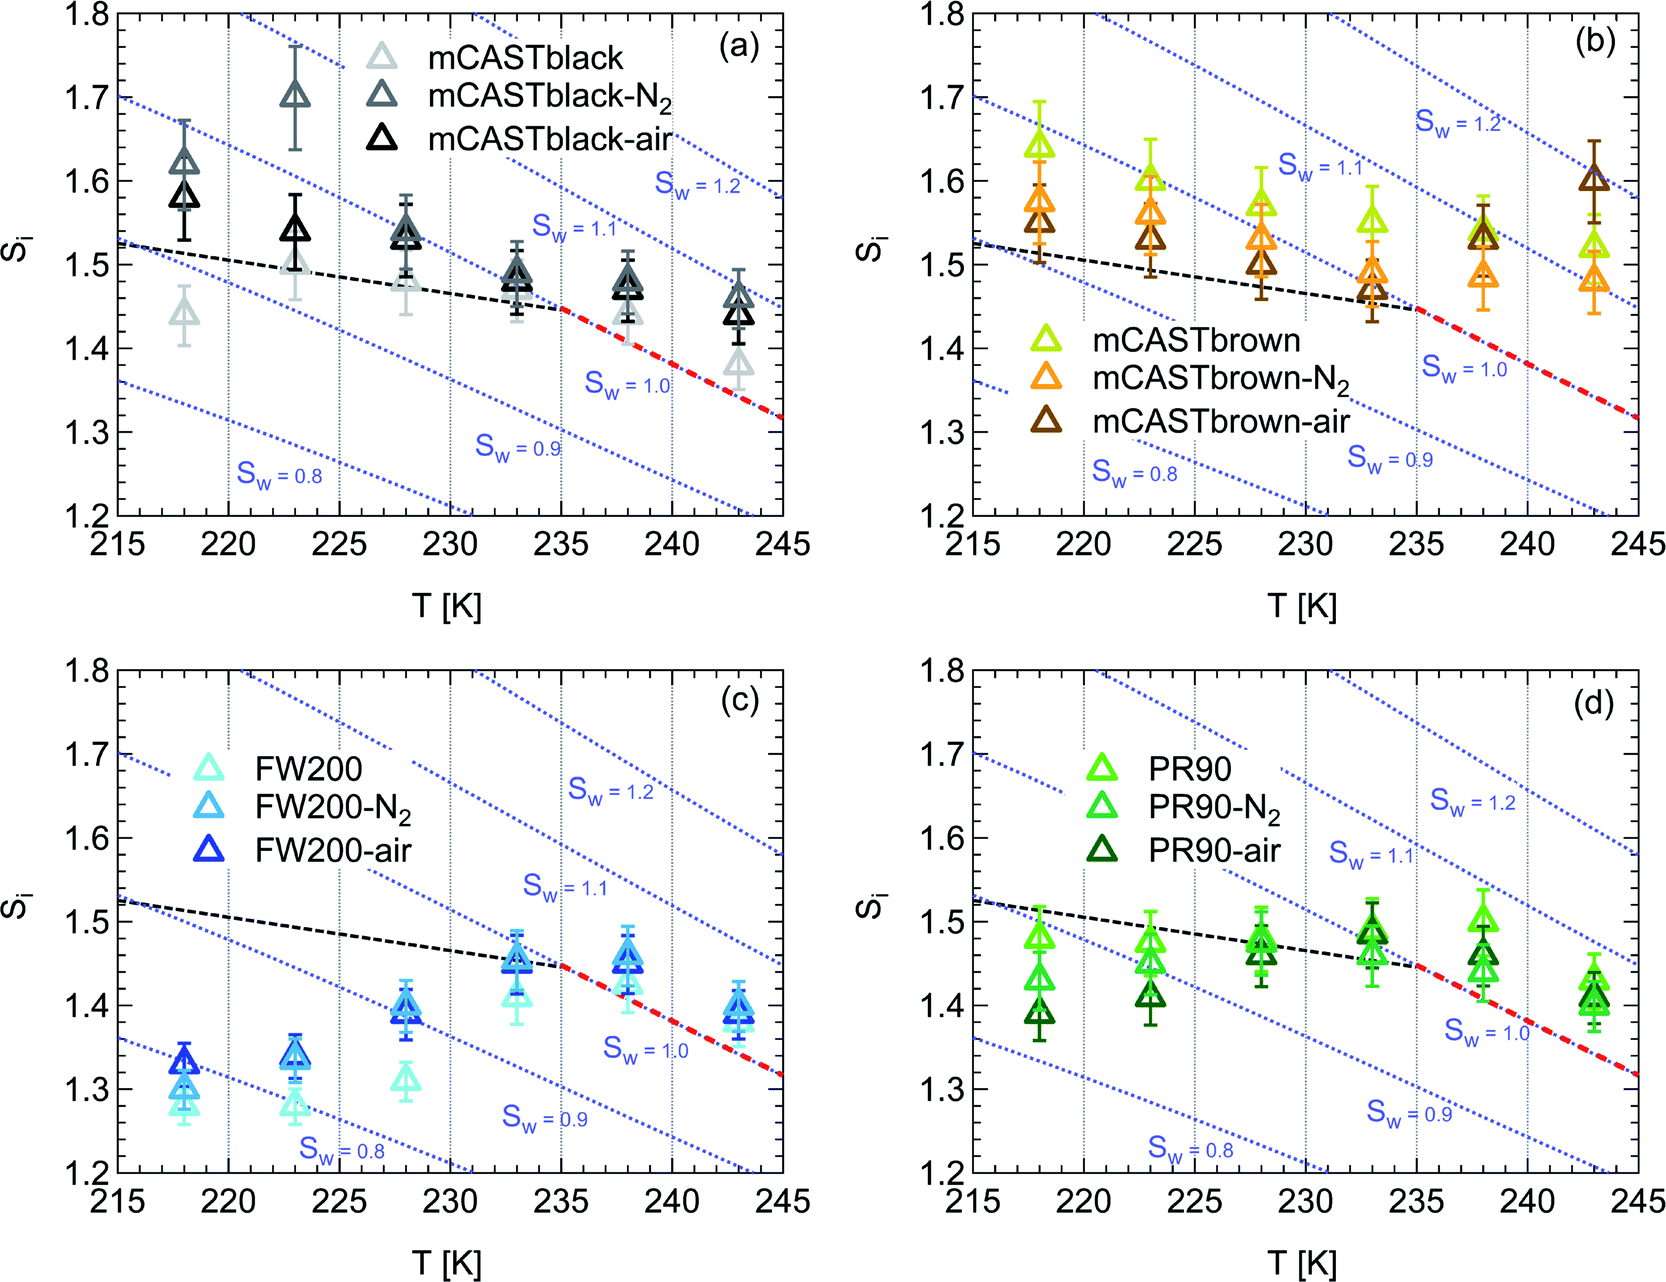 | ||
| Fig. 3 Onset (at AF = 0.1%) ice saturation ratio (Si) as a function of T for fresh and denuded 200 nm mCASTblack (a), mCASTbrown (b), FW200 (c) and PR90 (d). AF is reported from the 1.0 μm OPC channel. Black dashed line: homogeneous freezing conditions for solution droplets at T < HNT, according to Koop et al.45 Light blue dotted line: constant water saturation conditions calculated based on Murphy and Koop.44 Red dashed line: the 1.0 μm size water droplet survival conditions for T > HNT, where the phase of the particle larger than 1.0 μm can be either ice or liquid water. The Si uncertainty due to the temperature uncertainty (±0.1 K) of the HINC chamber is indicated as error bars. Each data point was derived from the AF curves in Fig. 13–16 presented in the Appendix in which each AF curve is an average of at least two individual RH ramps. | ||
3.1.1.1 mCASTblack. As shown in Fig. 2a, fresh 400 nm mCASTblack particles require Sw conditions higher than water saturation to form droplets at T ≥ 238 K, suggesting a hydrophobic surface (consistent with DVS results in Section 3.2.4). Thermal denuding further supresses the water droplet formation ability of mCASTblack as shown by higher onset Si values for denuded mCASTblack, likely resulting from a decrease in surface water interaction ability because of a decline in pore availability47,50 caused by thermal denuding. Popovitcheva et al.47 reported that microstructure and porosity play a role in the soot–water interaction of particles emitted by an aero-engine combustor, in addition to hydrophilicity. Thermal denuding at 573 K potentially can fuse non-volatile OM over soot surfaces, resulting in pore blocking. Additionally, the network of non-rigid soot primary particles may be modified due to thermophoretic forces,51 which decreases the pore openness. For example, Ess et al.52 reported that the nanostructure of C3H8 flame soot can be changed significantly after heating in the air up to 773 K. Similarly, both thermal denuding processes inhibit the water droplet activation of 200 nm mCASTblack particles (Fig. 3a), by showing larger onset Sw values above water saturation at the same T compared to the fresh particles.
For T ≤ 233 K, fresh 400 nm mCASTblack particles freeze at onset Si values close to the homogeneous freezing threshold (Si,hom). After thermal denuding, the onset Si values of both mCASTblack-N2 and mCASTblack-air particles shift to Si conditions higher than Si,hom. This aligns with the suppressed water droplet activation and suggests that a decrease in pore availability also inhibits soot IN via PCF. If the pore is blocked, then liquid water cannot be accommodated for PCF. Whereas if the pore volume becomes smaller, the pore-water will only freeze with a lower homogeneous freezing rate (ω) because it is proportional to the supercooled liquid volume (V) for a fixed T,45,53 following eqn (3):
| ω = J·V | (3) |
| J = Cprefac·exp(−Δg#/(kBT))·exp(−ΔG/kBT) | (4) |
3.1.1.2 mCASTbrown. Fresh 400 nm mCASTbrown particles form water droplets at Sw conditions close to 1.1 for T > HNT as shown in Fig. 2b, indicative of hydrophobicity (also consistent with DVS results in Section 3.2.4). Compared to the fresh particles, 400 nm mCASTbrown-N2 particles activate to water droplets at lower Sw but still above water saturation. This is because of volatile removal induced by thermal denuding as the sample contains relatively large amount of hydrophobic volatile OM (see Section 3.2.1). Thus, thermal denuding increases pore openness51 and exposes active sites,51,59 both facilitating mCASTbrown-N2 soot–water interaction. In addition, 400 nm mCASTbrown-air particles require an onset Sw condition between those of mCASTbrown and mCASTbrown-N2 to form water droplets at 238 K, but the droplet activation ability is considerably supressed at 243 K as shown by an onset Sw value higher than 1.1. The T dependent water activation depression for mCASTbrown-air particles may coincide with the glass transition T (Tg) change60,61 for the OM over mCASTbrown-air surfaces. Zhang et al.62 suggested that the Tg of organic aerosol increases with decreased volatility. As such, the Tg of mCASTbrown-air organic material may be increased to above 238 K compared to fresh mCASTbrown particles with a Tg < HNT, because of declined organic volatility caused by thermal denuding in air.63 Moreover, it is reported that the water vapour uptake by glassy state organics is significantly reduced, hampering the water droplet activation ability.64–66 Therefore, glassy mCASTbrown-air particles (for 238 < Tg < 243 K) require much higher Sw conditions to form water droplets at 243 K. Whereas mCASTbrown-N2 soot does not show glassy transition because its organic content is different from mCASTbrown-air whose organic content may be oxidised with the presence of O2 during air thermal denuding. Also, because light-molecular-weight organics in air denuding may form heavy-molecular-weight organics51 of low volatility by oxidation, mCASTbrown-air may become more hydrophobic and show supressed water droplet activation compared to mCASTbrown. Besides, original organic-rich mCASTbrown can be thermally decomposed/oxidised at 573 K52 in the presence of O2, which makes its graphitization level more like organic-lean mCASTblack-air. For example, Bhandari et al.51 suggested that organic oxidation is already possible for air thermal denuding at T < 300 °C. Hence, the mCASTbrown-air with a higher carbonization degree is similar to mCASTblack-air, both of which require Sw condition higher than 1.05 at T > HNT to form water droplets (Fig. 2a and b). Generally, thermal denuding regulates the water droplet activation of 200 nm mCASTbrown particles similarly to 400 nm large particles. N2 thermal denuding facilitates 200 nm mCASTbrown particles to form water droplets by decreasing the onset Sw values for T > HNT whereas air thermal denuding increases the onset Sw value for 200 nm mCASTbrown particles to activate as droplets especially at 243 K (Fig. 3b).
For T < HNT, fresh 400 nm mCASTbrown particles freeze homogeneously at Si above the Si,hom whereas both denuded soot particles (mCASTbrown-N2 and mCASTbrown-air) freeze at lower Si values than mCASTbrown. The poor IN ability of mCASTbrown may result from a paucity in PCF relevant mesopores and low water uptake abilities because its rich OM content may be hydrophobic and occupy pore structures, both of which impact PCF ability. This aligns with the earlier discussed studies of Möhler et al.,26 Friedman et al.29 and Zhang et al.28 who reported that the IN ability of soot particles is significantly suppressed with increasing OM content or organic coatings. Instead, thermal denuding promotes mCASTbrown-N2 particle IN due to OM removal. In addition to OM removal, air thermal denuding resulted OM oxidation may increase the OM Tg for mCASTbrown-air particles with decreased OM volatility,62,63 by which the IN ability of mCASTbrown-air particles may be further promoted. Murray et al.67 and Berkemeier et al.61 suggested that an increase in Tg for soot organics potentially promotes the particle to nucleate ice heterogeneously, which is opposite to its effect for the same sample on water droplet activation. All 200 nm thermal denuded mCASTbrown particles in Fig. 3b present similar IN ability changes following the pattern as those of 400 nm particles presented in Fig. 2b.
3.1.1.3 FW200. The onset Si values of fresh 400 nm FW200 particles are close to water saturation for T > HNT (Fig. 2c). At 243 K, both denuded FW200 particles require slightly higher Sw conditions than fresh particles to form water droplets, which may result from a decreased soot–water interaction because of the porosity decrease caused by thermophoresis forces.51 Notably, a small fraction of 400 nm FW200-air soot particles are able to form ice crystals at 238 K as shown by the onset Si prior to water saturation (see Fig. 2c, 11 and S10b†). Comparing Fig. S9b† (400 nm FW200-N2) to Fig. S8b† (400 nm FW200), the former may also nucleate ice at 238 K but less than that of FW200-air (Fig. S10b†). Likely, thermal denuding with the presence of O2 may generate new active sites by oxidation, resulting in more IN active FW200-air particles at 238 K. In Fig. 3c, all 200 nm FW200 particles only form water droplets at T > HNT and both thermal denuding processes do not change the onset Sw values for these particles to activate as droplets (also see AF curves in Fig. 15 and S20–S22†) because of their smaller sizes. Compared to 400 nm particles, 200 nm particles contain a smaller amount of volatiles and have a comparatively lower porosity level31 as shown a larger ρeff (see Appendix C). As such, thermal denuding plays a lesser role in regulating the porosity and surface wettability of 200 nm FW200 particles and thus their water droplet activation.
At T < HNT, fresh 400 nm FW200 particles nucleate ice far below Si,homvia PCF, which is consistent with the results reported by Mahrt et al.11 who attributed such an active IN ability of FW200 to its strong surface wettability and abundant mesopore structures. Denuded 400 nm FW200 particles nucleate ice more effectively than the fresh counterpart at 233 K as shown by a decrease in onset Si by 0.07 and 0.16 for FW200-N2 and FW200-air, respectively (see Fig. 2c and 11). At 233 K, the J coefficient (see eqn. (4)) has a small value as it is highly T dependent,68,69 thus the ω value, a product of J and liquid volume (see eqn. (3)), can be limited by the small J value close to the HNT.54 However, if the supercooled liquid volume is large enough, the ω at a T close to the HNT can be compensated.45,70 By volatile material removal similar to C3H8 flame soot, thermal denuding potentially enlarges the FW200 pore volume. Hence, the enlarged pore volume of denuded FW200 particles can promote the PCF processes by increasing ω near the HNT, compared to fresh FW200. Moreover, oxidation may introduce new active sites for FW200-air further promoting its IN by heterogeneous IN.18 The enhanced IN ability of denuded FW200 particles at 233 K can also be validated by calculations following parameterization reported in the literature. As long as the pore filling occurs at Sw < 1, negative pressure induced J promotion can progressively contribute to the homogeneous freezing of supercooled pore-water.70,71 At 233 K, the parameterization for pressure dependent homogeneous freezing based on the classical nucleation theory (CNT) framework54 formulated by Marcolli71 predicts a J value of 1.5 × 10¹⁶ m−3 s−1 at water saturation (P = 0.1 MPa), which increases to 4.8 × 10¹⁷ m−3 s−1 at the onset Sw (0.88 in Fig. 11, P = −13.2 MPa) for 400 nm FW200-N2 pore filling and to 5.9 × 10¹⁸ m−3 s−1 at the onset Sw (0.81 in, Fig. 11P = −23.2 MPa) for 400 nm FW200-air pore filling, respectively explaining the observed IN enhancement. Furthermore, the pore size required for capillary condensation at a fixed humidity condition can be calculated according to the Kelvin equation with a soot–water contact angle assumption of 60° for fresh FW200.19 Considering denuding effect, FW200-N2 may have a similar contact angle (60°) to fresh FW200 and oxidation may decrease the contact angle for FW200-air (assuming 45°).46 Then, a cylindrical mesopore with a rp = 3.2 (2.8) nm in 400 nm FW200-N2 (FW200-air) particles is relevant for pore filling at the onset Sw = 0.88 (0.81) and big enough to host an ice germ with a radius 1.14 nm (1.12 nm).19,20,70 The two rp values are also within the PSD range of both soot samples (see Section 3.2.4). Following the approach suggested by Koop et al.,45 the freezing time required for the particle in this case to reach the AF = 0.1% is 13.3 (14.9) s for FW200-N2 (FW200-air), which is close to the HINC particle residence time range (10.1–12.3 s) in this study. Therefore, the above can explain the IN activity of 400 nm FW200-N2 and FW200-air at 233 K. However, the calculated freezing time for denuded 400 nm FW200 particles at 238 K is larger than the particle residence time in HINC by several orders of magnitude, suggesting supercooled pore-water cannot freeze at 238 K with such a short particle transit time in this study. As such, we must consider that active sites located within the water filled mesopores may nucleate ice through immersion mode freezing.18 Inside the soot-aggregate pore, surface impurities can serve as potential active sites72,73 which could have become exposed after air thermal denuding leading to IN via immersion mode freezing at 238 K for FW200-air and which are otherwise not present for fresh FW200. Potentially, 400 nm FW200-N2 particles may also have some active sites exposed by volatile removal and thus nucleate a small fraction of ice crystals at 238 K (see AF curves in OPC channels ≥ 4.0 μm in Fig. S9b†).
For T = 228 K, the IN enhancement effect brought about by pore enlargement of denuded 400 nm FW200 particles decreases as the T dependent J value increases with decreasing T.68,69 For T ≤ 223 K, fresh and denuded 400 nm FW200 particles show comparable IN ability as onset Si values are within error bars. At a sufficiently low T, the ω is large enough to support the homogeneous freezing of supercooled pore-water regardless of increased porosity due to thermal denuding. As such, 400 nm fresh FW200 particles with abundant PCF relevant mesopores can nucleate ice actively via the PCF mechanism and the denuding effect induced active site increase plays a less important role than the case at warmer T (228 to 238 K).
On the contrary, thermal denuding inhibits the IN of 200 nm FW200 particles by increasing the onset Si values for T < HNT (see Fig. 3c and 15). Different from 400 nm particles, thermal denuding may induce decreased pore volume availability for smaller 200 nm FW200 particles mainly by rearranging the primary particle network and increasing the ρeff (see Appendix C) and thus leading to a slightly suppressed IN ability.
3.1.1.4 PR90. As presented in Fig. 2d, the onset Sw for fresh 400 nm PR90 particles is about 1.05 at T > HNT and thermal denuding decreases the onset Sw value slightly for PR90-N2 and PR90-air but the value is still above water saturation. Denuding effects on PR90, including surface modification and morphology restructuring,51,74 may generate more wettable soot particles which contain more active sites and are more active CCNs. Thermal denuding leads to promoting effects on the water droplet activation of 200 nm PR90 particles (Fig. 3d), similar to the case for 400 nm particles.
Fresh 400 nm PR90 particles freeze homogeneously at 233 K but nucleate ice far below Si,hom conditions via the PCF mechanism for T ≤ 228 K as containing suitable mesopores to PCF processes.16 For denuded 400 nm PR90 particles, the onset Si decreases by more than 0.12 at 233 K, compared to the fresh sample. However, the IN enhancement becomes smaller and the onset Si values of PR90 soot are within error bars at lower T (≤228 K). Gao et al.16 suggested that the IN of fresh 400 nm PR90 particle via PCF is actually ice growth limited at 233 K because its pore volume is too small to support the ice crystal growing out of the pore at such a T close to the HNT19 at which the J coefficient is also small (following eqn. (4)).54,68,69 However, if volatile material removal and surface modification decrease the contact angle51,74 as denuded PR90 already shows enhanced water droplet formation for T > HNT, then the same size mesopores can be filled at lower Sw conditions (<1) or larger mesopores can be filled at the same Sw condition according to the Kelvin equation. Support for the former comes from the fact that the IN of denuded particles is significantly promoted only at 233 K at which a lower Sw for pore filling leads to promoted soot IN via PCF by negative pressure induced IN promotion for pore-water.70 For T < 233 K, the J coefficient which is strongly dependent on T, increases with decreasing T (see eqn. (4)),54 thus the ω at such a low T is sufficient (see eqn. (3)) for the homogeneous freezing of pore-water. As such, the IN promotion brought about by the lower contact angle will not affect denuded 400 nm PR90 at low T (<233 K). On the other hand, larger pore volume filling for denuded PR90 may play a limited role in promoting IN. This is supported by the fact that PR90 only shows a negligible mass loss at the denuding T (573 K, see Section 3.2.1) and presents insignificant changes for mesopore availability (see Section 3.2.4). In addition, the presence of O2 does not affect the thermal denuding effects on PR90 particle IN, since the onset Si values of 400 nm PR90-N2 and PR90-air particles are within error bars at all T tested. This suggests N2 and air thermal denuding lead to comparable effects on PR90 IN promotion by OM removal or surface oxidation induced soot–water contact angle decrease respectively (see Section 3.2.2). From Fig. 3d and 16, the decrease in onset Si of 200 nm PR90 particles due to thermal denuding is less pronounced than the case for 400 nm particles at the same T. This is because small size PR90 particles should have less pore volume and less active sites scaling to the surface area.16
3.1.2.1 mCASTblack and mCASTbrown. Thermal denuding shows systematically opposite effects on the IN ability of mCASTblack and mCASTbrown, though the changes are within reported uncertainties (Fig. 2a, b, 3a and b). Thermal denuding supresses the IN ability of mCASTblack particles for T ≤ 233 K because of decreased pore availability resulting from intra-aggregate change by thermophoresis forces. On the other hand, thermally denuded organic-rich mCASTbrown particles show slightly enhanced IN for T ≤ 233 K which could be facilitated by increased pore availability induced by more significant OM removal than that of denuded organic-lean mCASTblack. In addition to suggesting that the role of organic content in soot IN is dependent on the combustion conditions, this finding also implies that the organic content itself plays a direct role in regulating soot IN by modifying the intrinsic soot properties such as porosity and surface wettability as will be discussed in section 3.2.
3.1.2.2 FW200 and PR90. There is a significant IN promotion for both denuded 400 nm FW200 and PR90 particles at 228 and 233 K. This finding suggests that soot IN via PCF under a T condition close to the HNT is more dependent on the soot particle PSD and surface wettability, compared to lower T conditions. Moreover, the effect of thermal denuding for two types of carbon black samples depends on the particle size but FW200 and PR90 show systematically opposite effects. Thermal denuding suppresses IN for 200 nm FW200 particles, however, it promotes the IN of 200 nm PR90 particles (Fig. 3c and d). This is because thermophoresis forces induced porosity decrease is the overall thermal denuding effect for denuded 200 nm FW200 particles whereas thermal denuding induced surface active site increase and/or soot–water contact angle decrease play the dominant role for denuded 200 nm PR90 particles.
3.2 Volatile content related soot particle property changes
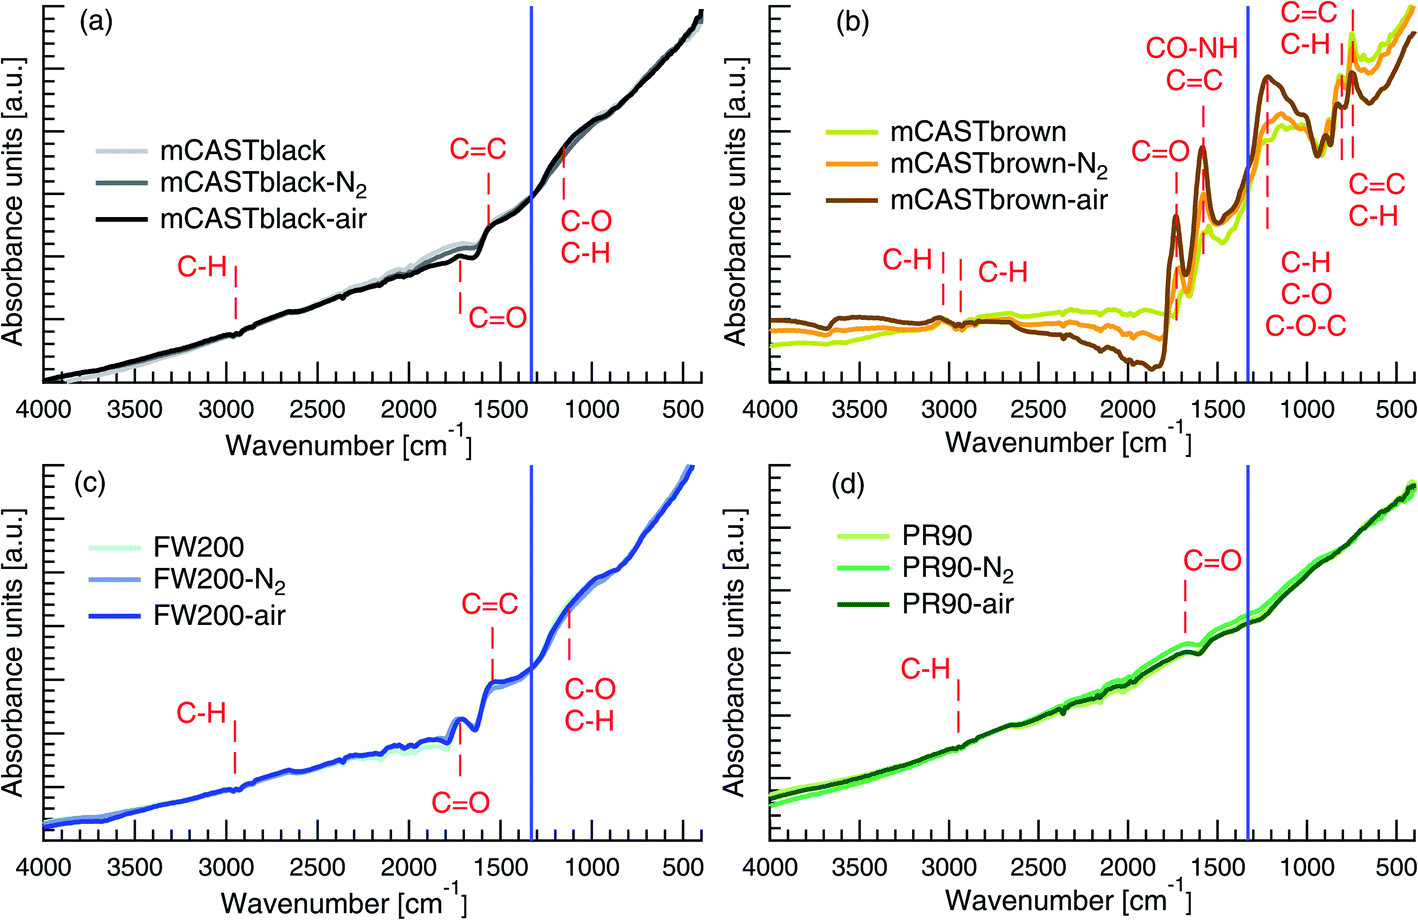
We present soot sample characterisation including bulk soot volatile matter analysis with thermogravimetric analysis (TGA) technique, denuding induced functional group change with Fourier transform infrared spectroscopy (FTIR), the ρeff of size-selected fresh and denuded soot particles derived from single particle size and mass distribution measurements with SMPS-CPMA (Fig. S26–S33),† as well as soot–water interaction activity with dynamic vapour sorption (DVS) measurement. These results illustrate changes in volatile content and associated changes in soot particle porosity and surface wettability, thus supporting our understanding of soot particle IN abilities. A summary of the characteristic results of soot samples used in this study is provided in Table 1. Exemplary transmission electron microscopy (TEM) images for 400 nm mBlack and mBrown particles with/without thermal denuding are presented in Fig. S34† and used in this section to understand thermal denuding effects on soot particle property and morphology changes. Detailed discussion on TEM images is provided in ESI S3†.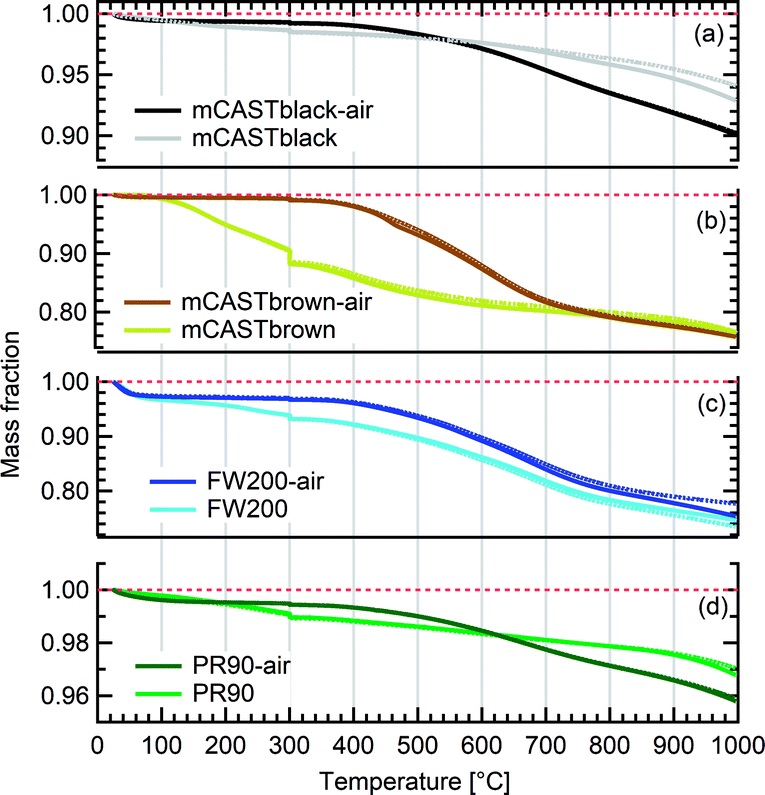 | ||
| Fig. 4 TGA curves for fresh and oven-air-heated (N2 + O2 atmosphere) bulk soot samples. Solid and dotted lines indicate two individual TGA runs. The T was held for 30 minutes at 300 °C. Red dashed line shows the bulk sample mass fraction benchmark, i.e., 100%. Note the different y-axis scales for the samples. | ||
3.2.1.1 mCASTblack. Fresh mCASTblack exhibits less than 1% mass loss up to T of 100 °C (Fig. 4a), indicating absence of highly volatile OM or large amounts of water vapour.47,77,78 The sample mass loss up to 300 °C is smaller than 2% (Fig. 4a and Table 1). Heating the sample at T = 300 °C for 30 minutes does not lead to a distinct mass decrease (Fig. 4a). According to Ess et al.,52 fuel-lean C3H8 flame soot starts to show organic decomposition at T = 280 °C. Thus, the results from T < 300 °C suggest mCASTblack contains a small proportion of volatile content (<2%). When T increases to 1000 °C, the remaining sample weight fraction is 93%, consistent with the study by Moore et al.79 who reported comparable total organic/volatile content for fuel-lean C3H8 flame soot. The mass loss for T > 300 °C is interpreted as loss of heavy-molecular-weight compounds, such as heavy alkanes and PAHs.52 For mCASTblack-air, a number of points are noteworthy. First, its desorbed mass around 100 °C does not change compared to fresh soot. Second, the mass fraction reduction becomes slightly smaller at T ≤ 300 °C (Fig. 4a and Table 1), potentially indicative of a decreased volatile OM content after heating with the presence of O2. In other words, it suggests mCASTblack-air particles for IN experiments may contain less volatile OM than mCASTblack and mCASTblack-N2 particles. Finally, the total mass loss of mCASTblack-air at 1000 °C is larger than fresh mCASTblack by 3%, suggesting the formation of heavy-molecular-weight organics during air thermal denuding52,74 and some of those newly formed OM may be decomposed at high T (300 < T < 1000 °C).75 Additionally, such a small mass loss of mCASTblack (Fig. 4a and Table 1) samples at 300 °C cannot be visualised by the corresponding TEM images of 400 nm particles (Fig. S34b and c†) which do not show pronounced morphology changes compared to fresh mCASTblack sample (Fig. S34a†). In general, the low content of hydrophilic volatiles for mCASTblack partly explains its inactive water droplet formation ability and a decrease in volatile content by thermal denuding may lead to droplet activation depression for mCASTblack-N2 and mCASTblack-air (see Fig. 2a). Moreover, if non-volatile OM can be fused at 300 °C during air thermal denuding they may block pores and supress the IN via PCF for mCASTblack-air even further than for mCASTblack-N2 showing a smaller total OM content, which coincides with the results in Fig. 2a and 3a.
3.2.1.2 mCASTbrown. Both fresh and oven-air-heated mCASTbrown samples show extremely hydrophobic surfaces as the mass loss is negligible (<1%) for T < 100 °C, suggesting an absence of adsorbed water and highly volatile OM. Further evidence can be observed from Fig. 17 which shows a flat mass change derivative line close to zero in the same T regime. This explains the poor CCN activation ability of mCASTbrown particles (Fig. 2b and 3b). Upon heating to T = 300 °C, fresh mCASTbrown most likely loses light-molecular-weight OM80 which can be volatilised below 300 °C.52,81 The significant mass fraction reduction (>10%) until 300 °C for fresh mCASTbrown (Fig. 4b and Table 1) suggests mCASTbrown-N2 particles for IN experiments should have less organic coverage thus exposing some pore structures or active sites. However, mCASTbrown-air sample only shows a mass loss less than 1% up to T = 300 °C (Fig. 4b and Table 1), suggesting a substantial volatile OM loss during air thermal denuding at 300 °C (in the oven). The substantial mass losses of mCASTbrown-N2 and mCASTbrown-air during thermal denuding (at 300 °C) are consistent with the TEM images of these 400 nm particles (Fig. S34e and f†) which show much lacier soot-aggregates caused by OM removal compared to fresh mCASTbrown (Fig. S34d†). It is reported that light-molecular-weight OM reactive to O2 at high T could be a significant part of the OM content in organic-rich C3H8 flame soot particles.82,83 This part of light-molecular-weight OM in fresh mCASTbrown soot is likely to be oxidised and forms heavy-molecular-weight OM51 during air thermal denuding at 300 °C (in the oven), supported by an increased mass loss rate for mCASTbrown-air sample for T between 400 and 700 °C (Fig. 4b) due to charring (pyrolysis) during the TGA measurement in a N2 atmosphere.51,84,85 Hence, the oxidation of organics may consume some hydrocarbons increasing mCASTbrown-air particle pore availability and reduce the OM volatility influencing the OM phase under low T. As discussed in Section 3.1.1, the decreased OM volatility leads to increased Tg for OM in mCASTbrown-air particles, which promotes particle IN for T < HNT (<Tg)61,67 whereas inhibits water droplet activation for T > HNT (>Tg),64–66 compared to mCASTbrown and mCASTbrown-N2 (Fig. 2b and 3b). Additionally, large total mass losses (24%) for the denuded soot samples at T = 1000 °C suggest that both mCASTbrown and mCASTbrown-air have a lower graphitization degree than mCASTblack. Thus, the non-graphitized OM may decrease the availability of pore structures and active sites for soot particle IN, which explains the less active IN ability of mCASTbrown compared to mCASTblack (see Section 3.1).
3.2.1.3 FW200. Significant mass loss (3%) at T < 100 °C for fresh FW200 soot indicates a large number of hydrophilic active sites on soot surfaces or abundant pore structures for water adsorption. The derivative mass loss curve in Fig. 17 also shows that the mass loss in this T regime mainly occurs at T < 50 °C. This strong water adsorption ability, due to hydrophilic surface sites and/or porous structures,47,86 also contributes to its active IN ability (see Section 3.1). FW200-air sample shows less than 3% water vapour desorption at T < 50 °C and a flat mass loss curve between 50 and 300 °C (Fig. 4c), suggesting light-molecular-weight OM resistant to 300 °C are completely removed during air thermal denuding. A 7% mass loss for FW200 at 300 °C (Fig. 4c and Table 1) also implies that the N2 thermal denuding leads to a considerable light-molecular-weight OM removal effect for FW200-N2. Considering that soluble or hydrophilic material usually has a light-molecular-weight and contributes to water droplet formation, hence, denuded FW200 samples show slightly suppressed CCN activation ability (see Fig. 2c and 3c). In addition, the removal of light-molecular-weight OM may result in active site exposure and pore volume increase, both of which enhance denuded FW200 IN (see Fig. 2c). With increasing T, the mass fraction curves of both FW200 soot samples are almost parallel and decrease similarly to approximately 76%. This may indicate that air thermal denuding does not alter the total OM content of FW200-air and may explain the similar onset Si results of FW200-air and FW200 for T < 223 K and T > HNT.
3.2.1.4 PR90. PR90 sample is of the highest thermal resistance and shows the smallest mass loss of all samples, suggesting that it is highly carbonized. Both PR90-air and PR90 samples contain a small amount of water vapour (<0.5%), as shown in Fig. 4d for T < 100 °C. Nonetheless, PR90-air desorbs a slightly larger amount of vapour than PR90 when T < 100 °C (Fig. 4d). The water vapour may be adsorbed during sample storage after oven-air-heating. This suggests that PR90-air contains more active sites to adsorb vapour, which also contributes to its more active water droplet formation ability for T > HNT (Fig. 2d and 3d). At T = 300 °C, fresh PR90 shows a 1% mass reduction (Fig. 4d and Table 1), suggesting an OM removal effect of N2 thermal denuding on PR90-N2 particles, which may promote the soot–water interaction and IN by exposing active sites, e.g., surface defects and functional groups (see Fig. 2d and 3d). However, PR90-air shows a smaller mass loss when T < 300 °C but shows a larger mass loss than fresh PR90 when T > 600 °C. This suggests that some oxidation reactions may occur during air thermal denuding (in the oven), during which the oxidation at 300 °C consumes some light-molecular-weight OM to generate some heavy-molecular-weight OM that can be decomposed when T > 600 °C (during TGA measurements). Potentially, the oxidation modifies PR90-air particles by introducing new active sites which promote PR90-air water interaction and IN via PCF (Fig. 2d and 3d).
In general, TGA measurements demonstrate that soot samples have different proportions of volatile substances (e.g., water vapour and light-molecular-weight OM) by showing varying mass losses for T < 100 °C. The low water affinity of C3H8 flame soot (mCASTblack and mCASTbrown) corroborates their poor CCN and IN abilities whereas the wettable surface of FW200 contributes to its active CCN and IN ability. Although PR90 and mCASTblack contain similar amount of volatile content, PR90's higher IN ability (see Section 3.1) may be attributed to its more abundant mesopores (see Section 3.2.4). In addition, comparing soot mass fraction curves for both fresh and air-heated mCASTblack or PR90 samples at T = 1000 °C demonstrates that air thermal denuding may lead to soot sample oxidation and a total increase in OM content of a low volatility.
 | ||
| Fig. 5 Vector normalized ATR-AB (Attenuated Total Reflection-Absorption) spectra from FTIR measurements for fresh, oven-air (N2 + O2)- and -N2-heated soot. Likely chemical bond assignments are indicated in the individual spectra. The blue line corresponds to the wavenumber 1330 cm−1 which separates the characteristic (left) and the fingerprint region (right). | ||
3.2.2.1 mCASTblack. The spectra of mCASTblack generally show no distinct peaks and are close to those of graphite reported in the literature,95,96 suggesting that these soot samples are highly graphitized (see Fig. 5a). The weak telescopic vibration between 3000 and 2800 cm−1 indicates the presence of C–H for saturated hydrocarbons97,98 in both fresh and denuded mCASTblack samples. The difference in the spectra between 2100 and 1600 cm−1 implies that thermal denuding changes mCASTblack sample C
:O ratio. This is because the small peak appearing at 1725 cm−1 is ascribed to sp2 CO bonds,99,100 suggesting that thermal denuding may decrease the sample O:C ratio by removing volatile OM containing CO bonds. The small peak at 1575 cm−1 is assigned to CC bonds,93,101,102 implying the presence of a small amount of unsaturated hydrocarbons, such as PAHs. In addition, the bending vibration between 1300 and 900 cm−1 in the fingerprint region may suggest C–H belonging to hydrocarbons or C–O belonging to oxidised hydrocarbons.101,102 If it is ascribed to C–H, it suggests that air thermal denuding increases the saturation level of mCASTblack sample. If it is ascribed to C–O, it implies that air thermal denuding increases C–O bonds (1250 cm−1), which coincides with decreased CO bonds (1725 cm−1) for mCASTblack-air (Fig. 5a).101,102 This suggests that air thermal denuding leads to the break of double bonds and the formation of more saturated PAHs because of oxidation.52,74 These functional group changes are consistent with TGA results in Fig. 4a where mCASTblack-air shows smaller mass losses for T < 550 °C but a larger mass losses for T > 550 °C because some unsaturated hydrocarbon material is oxidised and becomes more heat-resistant.74 Most importantly, the newly formed saturated hydrocarbons may not only be hydrophobic but also block mCASTblack pore structures, inhibiting the CCN activation and IN of mCASTblack-air particles.
3.2.2.2 mCASTbrown. The fresh mCASTbrown spectra show distinct peaks in Fig. 5b, indicating the presence of various functional groups. There may exist C–H bonds97,98 as a weak stretch between 3100 and 3000 cm−1 represents unsaturated hydrocarbons and the telescopic vibration between 3000 and 2800 cm−1 represents saturated hydrocarbons. The crossover at this band range for mCASTbrown sample group potentially suggests the C
:H ratio was changed during thermal denuding. The presence of O2 during thermal denuding magnifies the C:H ratio change trend as mCASTbrown-air specta show the largest slope across the band range. The next spectral feature around 1725 cm−1 represents the CO bond.99,100 Different from mCASTblack, both thermal denuding conditions increase the CO bond signal in denuded mCASTbrown. If the CO bond comes from hydrophilic materials, such as carboxylic acids,103 then this feature coincides with the opposite IN effects of thermal denuding on mCASTblack (inhibition) and mCASTbrown (enhancement) (see Section 3.1.2). In addition to the CC bond, the band around 1575 cm−1 could be ascribed to amide groups,104,105 given that the intensity increases after heating in N2 atmosphere and it increases even further with addition of O2 during air thermal denuding. Moreover, the noticeable feature in the fingerprint region is that denuded samples show a larger signal in the band range between 1300 and 900 cm−1 but present a smaller signal for wavenumber <900 cm−1 (see Fig. 5b). Possible bonds in this range can be deduced by linking with the spectral features in the characteristic region, such as C–O–C (1250 cm−1) from epoxy and oxirane rings.92,106,107 In particular, the single and strong absorption band around 830 and 750 cm−1 in Fig. 5b can be ascribed to para- and ortho-aromatic compounds respectively.89,93,108 Thus, such a band change for wavenumber <1300 cm−1 suggests the removal of aromatics52 (double bonds) and the formation of more saturated hydrocarbons (single bonds) during thermal denuding, especially for mCASTbrown-air. If such an OM content change decreases the OM volatility over mCASTbrown-air particles, it coincides with the Tg shift resulted CCN suppression and IN promotion for mCASTbrown-air particles (see Section 3.1.1.).
3.2.2.3 FW200. In Fig. 5c, fresh FW200 shows modified graphite surface with a telescopic vibration between 3000 and 2800 cm−1, and two small absorption bands at 1725 and 1575 cm−1, as well as a broad band between 850 and 1250 cm−1. These bands can be assigned to C–H bonds from saturated hydrocarbons,97,98 C
O bonds (carbonyl or carboxyl groups)107 from heavy PAHs, CC bonds from aromatic rings104 or from the carbon skeleton in heavy-molecular-weight organics,109 and C–H or C–O bonds101,102,110 from unsaturated hydrocarbons, respectively. The distinct CO bond generally is linked to the carboxyl group from carboxylic acids103 which may substantially contribute to the active water interaction and IN ability of FW200 particles (see Section 3.1). Notably, this is different from the case for mCASTblack samples showing a similar spectrum pattern because the much less distinct peaks of mCASTblack samples represent hydrophobic unsaturated hydrocarbons. In addition, the spectra show no significant differences between fresh and denuded FW200 samples. According to the manufacturer, fresh FW200 is highly oxidised carbon black generated by pyrolysis, explaining its resistance to changes in the FTIR spectrum due to thermal denuding. This finding is in line with the TGA results which show parallel mass loss curves for FW200 and FW200-air samples when T > 300 °C suggesting similar content of OM for these two samples (Fig. 4c). The similar functionalization level for fresh and denuded FW200 supports their similar CCN activation at 243 K. Since 400 nm denuded samples are more active INPs at T ≥ 228 and exhibit minor changes in the spectra, it demonstrates that the surface wettability (or soot–water contact angle) plays a secondary role following the porosity change resulted from denuding in the IN of FW200 particles.
3.2.2.4 PR90. In Fig. 5d, fresh PR90 presents a high graphitized surface without distinct bands for functional groups.95,96 Nonetheless, a weak telescopic vibration between 3000 and 2800 cm−1 and a small peak around 1725 cm−1 are indicative of the presence of saturated hydrocarbons97,98 and C
O bonds.93,101,102 The paucity of functional groups on PR90 samples is supported by the TGA results (Fig. 4d) showing a small amount of total mass losses (3%) at 1000 °C and negligible mass loss at T < 300 °C (1%). Thus, such a small OM change by thermal denuding does not lead to detectable functional group changes by the FTIR test. This finding suggests that the enhanced CCN activation and IN for denuded PR90 particles may result from the exposure of particle surface defects but not functional groups as new active sites. The similar FTIR spectra for PR90-N2 and PR90-air also explains their comparable IN and CCN activation abilities at all T tested (see Section 3.1.1).
In brief, mCASTbrown containing plenty of organic groups exhibits detectable changes induced by thermal denuding in the FTIR spectra. For more graphitized FW200, mCASTblack and PR90, functional group changes from thermal denuding (if any) are not as discernible as in mCASTbrown samples.
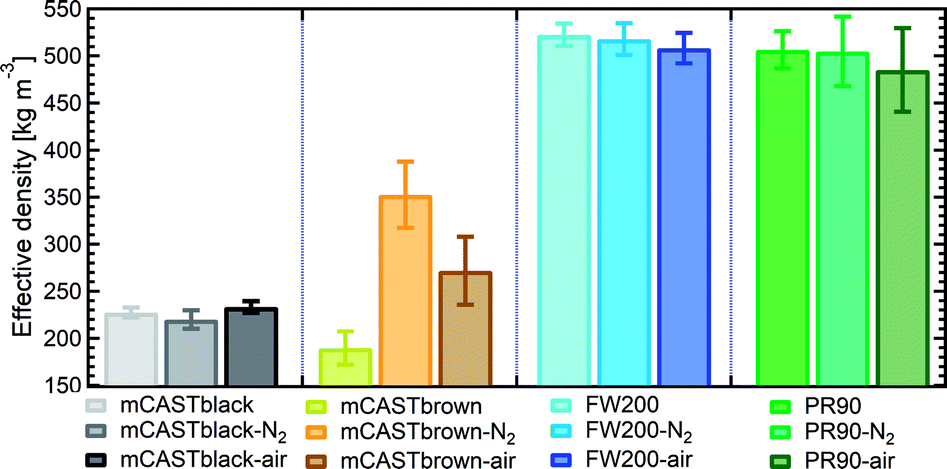 | ||
| Fig. 6 The effective density (ρeff) of fresh and denuded 400 nm soot particles. The error bar indicates one standard deviation. Please note the y-axis origin. | ||
3.2.3.1 mCASTblack. Compared to fresh 400 nm mCASTblack, N2 thermal denuding causes a 3% reduction in ρeff for mCASTblack-N2 (Fig. 6), showing that the mass loss plays a more pronounced role than the size decrease (see Fig. S26 and S27† for size and mass changes respectively). This may result in increased porosity,112i.e., more pore volume or structures, for mCASTblack-N2. However, the increased pores are in the micropore17 range which promote water interaction but are too small for IN via PCF for T < HNT (Fig. 2a). A 2.5% ρeff increase for 400 nm mCASTblack-air particles with respect to fresh mCASTblack results from a small size reduction (smaller than that of mCASTblack-N2) and an unchanged mass (see Fig. S26 and S27† respectively). It implies that the effect of air thermal denuding on the size and mas of 400 nm mCASTblack-air particles shows a combined effect of OM removal and organic oxidation, by which air thermal denuding decreases the particle mass by OM removal similar to that of mCASTblack-N2 meanwhile it leads to mass increment and size growth by oxidation, considering the similar denuding (N2 and air) effect of thermophoresis forces on particle sizes. As such, the oxidation introduced mass increment and size growth compensate more than the mass decrease and size decrease caused by OM removal. Furthermore, new materials produced by oxidation may block pore structures and thus counteract the OM removal effect. This finding coincides with the FTIR results suggesting the formation of more saturated oxygenated hydrocarbons and explains further the IN suppression for mCASTblack-air (Fig. 2a).
3.2.3.2 mCASTbrown. Notably, the ρeff of 400 nm mCASTbrown-N2 is doubled compared to mCASTbrown because of a remarkable size decrease (22.3% in Fig. S28b†) but a comparatively small mass decrease (12.9% in Fig. S29a†). In general, this substantial mass reduction removes volatile coatings over soot surfaces and the significant size shrinkage results in more compacted soot–aggregates, both of which increase the pore availability of mCASTbrown-N2 and thus enhance the particle water droplet formation and IN abilities (Fig. 2b). Compared to mCASTbrown-N2, the ρeff of mCASTbrown-air (400 nm) increases only by ∼50% with respect to that of mCASTbrown because of a smaller size decrease (20.3% in Fig. S28c†) but a larger mass decrease (27% in Fig. S29a†), still suggesting that thermal denuding leads to significant soot–aggregate compaction and thus promoting soot IN via PCF. Such a large mass decrease results from both volatile removal and significant oxidation which oxidises some light-molecular-weight to heavy-molecular-weight OM (see Section 3.2.1 and 3.2.2). These newly formed materials of low volatilities stick to the soot-aggregate, which is supported by the TEM image of 400 nm mCASTbrown-air particle in Fig. S34f† showing OM partially distributed over the soot-aggregate whereas a 400 nm mCASTbrown-N2 aggregate (Fig. S34e†) shows the more bare primary particles with less OM coverage. Thus, these newly formed OM may support the soot-aggregate structure and prevent size decrease from thermophoresis forces. In addition, these low volatile materials may lead to a higher Tg, thus inhibiting mCASTbrown-air CCN activation for T > Tg > HNT but promoting IN for T < HNT < Tg (see Section 3.1.1). Moreover, the smaller ρeff of 400 nm mCASTbrown-air also suggests these particles are less densified and have a larger pore volume compared to mCASTbrown-N2, coinciding with the higher IN ability of 400 nm mCASTbrown-air particles.
3.2.3.3 FW200. The FW200-N2 only exhibits a slight decrease in ρeff (<1%) whereas FW200-air shows a larger decrease but still smaller than 3% (Fig. 6). The overall ρeff decrease mainly results from volatile OM removal which overwhelms the ρeff increase effect caused by particle mobility diameter decrease (see Fig. S30 and S31† for size and mass changes respectively). The light-molecular-weight OM removal may enlarge soot-aggregate pore structures or uncover some active sites over soot surfaces, such as the exposure of surface defects or functional groups.73 As a result, both denuded FW200 particles may have increased pore availability and active site density, thus showing promoted IN via PCF near the HNT (see Fig. 2c). In addition, the larger ρeff decrease for FW200-air than FW200-N2 may be due to a larger mass loss caused by oxidation during air thermal denuding (see Fig. S31a†). The oxidation may consume some volatiles and lead to more significant pore availability increase and/or active site increase, both of which facilitate 400 nm FW200-air particles to nucleate ice more effectively than fresh FW200 particles near the HNT (see Section 3.1.1).
3.2.3.4 PR90. Although containing less total amount of non-graphitized materials, denuded PR90 shows a similar trend in ρeff change to that of denuded FW200 (Fig. 6). However, the error bars are larger than those of denuded FW200. Nevertheless, the decreased ρeff for denuded PR90 suggests that the volatile removal represents the major role of thermal denuding for PR90-N2 and PR90-air particles (see Fig. S32 and S33† for size and mass changes respectively), by which functional groups and surface defects can be exposed and serve as active sites. Consequently, denuded 400 nm PR90 particles show promoted IN and CCN activation (see Fig. 2d). The presence of O2 during air thermal denuding leads to a larger decrease in ρeff than N2 thermal denuding. It suggests the occurrence of oxidation during air thermal denuding. Despite with oxidation, 400 nm PR90-air particles present similar promotion in CCN activation and IN to 400 nm PR90-N2 particles (see Fig. 2d). Perhaps, this is because original PR90 sample is of high graphitization level and such a weak oxidation (e.g., a small ρeff change) plays a limited role in modifying the active site density of the particle (Section 3.1.1).
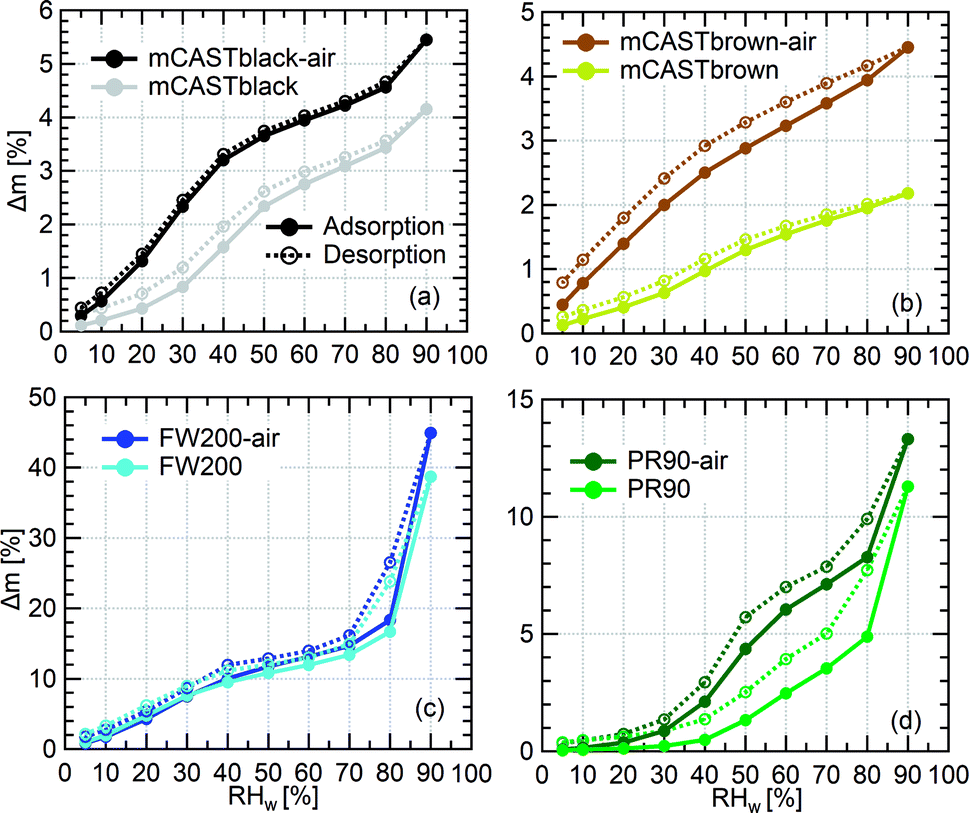 | ||
| Fig. 7 Dynamic water vapour sorption (DVS) isotherms for fresh and synthetic air (N2 + O2) oven-heated (300 °C) soot. The solid lines with closed symbols and dashed lines with open symbols indicate adsorption and desorption isotherms, respectively. Each isotherm loop represents for an individual measurement. Note different y-axis scales. | ||
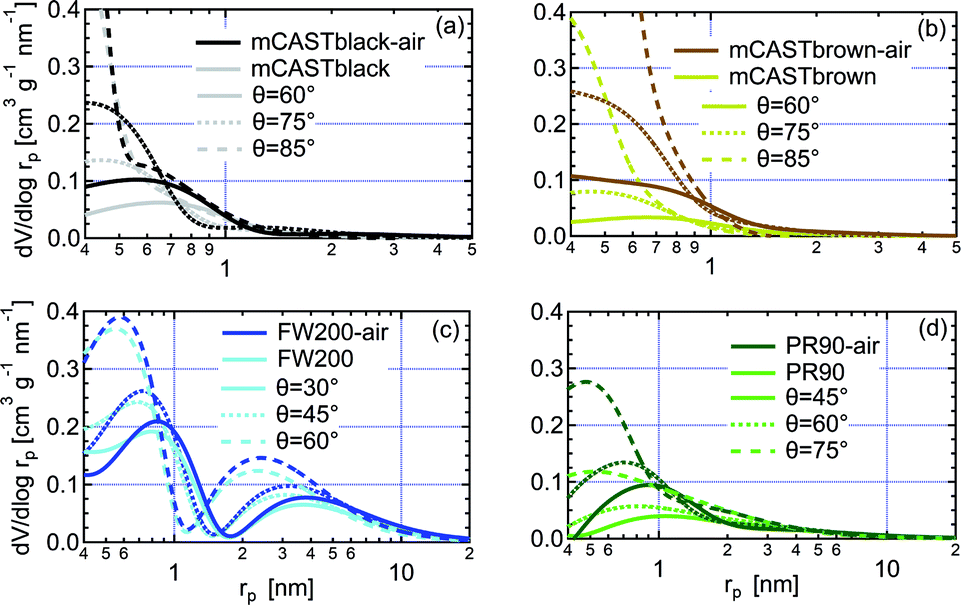 | ||
| Fig. 8 The pore size distribution (PSD) as a function of pore radius (rp) for fresh and synthetic air (N2 + O2) oven-heated soot with different contact angle assumptions, derived from DVS isotherms shown in Fig. 7. (a) mCASTblack, (b) mCASTbrown, (c) FW200, (d) PR90. In each panel, solid line, dotted line and dashed line indicate the PSD results of the same soot sample with different soot–water contact angle assumption values. | ||
3.2.4.1 mCASTblack. Overall, fresh mCASTblack presents a weak water interaction ability and its adsorbed water vapour mass is only 4% at RHw = 90% (Fig. 7a). Fresh mCASTblack shows a small isotherm slope at low RHw levels (<40%), suggesting that it may contain a few active sites such as suitable surface defects or hydrophilic functional groups.59,86 Compared to mCASTblack, mCASTblack-air shows a larger isotherm slope at low RHw levels (<40%), indicating more abundant active sites for water uptake and a lower contact angle. Notably, enhanced surface wettability of mCASTblack-air does not contribute to its water droplet formation ability for T ≥ 238 K (see Fig. 2a and 3a) because the removal of water vapour during thermal denuding (see Section 3.2.1) may lead to a water activation delay for mCASTblack-N2 and -air. Perhaps, non-porous mCASTblack-air particles only activate into water droplets once bulk water condenses onto the hydrophobic surface at Sw > 1 whereas fresh mCASTblack particles contain a few pores can accommodate water at Sw < 1 and then grow into bulk droplets when Sw > 1.18
Considering a hydrophobic surface for mCASTblack, large soot-water contact values of 60°, 75° and 85°, are used to calculate the PSD. As shown in Fig. 8a, mCASTblack contains some micropores (rp < 1 nm) and a few mesopores (1 < rp < 25 nm). These pores are also reflected by its isotherms in Fig. 7a. The small offset between its adsorption and desorption branches over the whole RHw range suggests mCASTblack contains some mesopores leading to isotherm hysteresis. However, a small amount of water can still be preserved in the sample despite substantially decreasing the RHw condition even down to 5% (see Fig. 7a), suggesting some pore structures are too small to release condensed water, i.e., micropores.18,86 The small amount of mesopores (Fig. 8a) for mCASTblack coincides with its weak IN ability via PCF for T < HNT (see Fig. 2a and 3a). From Fig. 8a, mCASTblack-air contains a few but less mesopores than mCASTblack. The absence of hysteresis between the adsorption and desorption isotherms (Fig. 7a) suggests that mesopores are absent in the sample or it may contain conical or cylindrical mesopores that are closed at the tapered end,17 which explains its suppressed IN ability compared to fresh mCASTblack for T < HNT (see Fig. 2a and 3a). Note, the approach for PSD analysis only relies on the desorption branch and has a presupposition that there exist pore structures of different sizes (see Section 2.4). Given this approach, we note that the PSD curve of mCASTblack-air in Fig. 8a may be invalid if no pores exist in the sample. Nonetheless, the DVS results qualitatively imply air thermal denuding decreases mCASTblack-air porosity, supporting the discussion about its CCN activation and IN results in Section 3.1.1.
3.2.4.2 mCASTbrown. The mCASTbrown sample is extremely hydrophobic showing an almost linear adsorption isotherm and has the smallest water uptake ability at low RHw levels (<40%) among all samples (see Fig. 7b). The isotherm slope of mCASTbrown-air is larger than mCASTbrown but its water vapour adsorption only presents a mass increase by 3% at RHw = 40%. Such a hydrophobic surface explains high Sw conditions (>1.05) are required for the CCN activation of both samples (see Fig. 2b and 3b). Also, the same soot–water contact angle values as estimated for mCASTblack are used for mCASTbrown PSD calculations. Fig. 8b merely shows a mesopore paucity for mCASTbrown, which coincides with the small hysteresis loop of its DVS isotherms (Fig. 7b) and suggests minor pore availability. The mCASTbrown-air has more pores than mCASTbrown as the PSD curve of mCASTbrown-air generally stays above mCASTbrown (Fig. 8b), which results from the removal of volatile content and the exposure of pores by air thermal denuding. The increased pore availability for mCASTbrown-air supports its enhanced IN ability compared to fresh mCASTbrown (see Fig. 2b and 3b) at T < HNT. However, limited PSD enrichment for mCASTbrown-air is not enough to significantly contribute to effective IN via PCF because of the initial paucity in pore structures. In addition, the increased pore volume for mCASTbrown-air is mainly attributed to micropores (see Fig. 8b) not relevant for PCF. The enrichment in micropores leads to a stronger water interaction ability for mCASTbrown-air at 298 K by showing a higher isotherm slope (see Fig. 7b) but does not contribute to its CCN activity at 243 K (see Fig. 2b and 3b). This may be because mCASTbrown-air contains some low volatile organics (see Section 3.2.1 and 3.2.2) whose Tg is above the HNT and whose phase transition hampers the CCN activation at 243 K (see Section3.1.1).
3.2.4.3 FW200. According to Thommes et al.,17 the isotherms for FW200 can be classified into Type IVa with a H4 hysteresis loop. This type of isotherm shows a concave curve at low RHw levels (<40%) and a hysteresis loop at high RHw conditions (see Fig. 7c), suggesting that FW200 has a hydrophilic surface with plenty of active sites, i.e., a low contact angle, and possesses abundant mesopores. Both its water affinity surface and rich mesopores may contribute to the active IN ability of FW200 particles via PCF. In the low RHw range, water soluble material on the soot surface (see Section 3.2.1) may contribute to its water uptake.117 Hence, FW200 with a hydrophilic surface can activate as water droplets most readily among all samples (see Fig. 2 and 3). FW200-air shows a similar isotherm slope to fresh FW200 at RHw < 40% and a larger total water vapour adsorption capacity (Fig. 7c), suggesting that its contact angle is comparable to FW200 and its pore volume is larger than FW200. In addition, the pore volume enlargement in FW200-air may also expose more active sites inside the pore and both effects contribute to the IN promotion of FW200-air at 238 and 233 K (see Section 3.1.1).
Hydrophilic soot with a strong water uptake ability should have a low contact angle between 20–45°.114 For example, Marcolli et al.19 suggested FW200 soot-water contact angle with a maximum of 60°. Hence, small values (≤60°) are used for FW200 PSD analysis. The PSD results in Fig. 8c demonstrate that there are mesopores of a rp between 1 and 10 nm dominating the water uptake ability of fresh FW200 at high RHw levels. Comparing the PSD of both soot samples with the same contact angle assumption (see Fig. 8c), FW200-air PSD curve always stays above FW200, which means it contains more mesopores than FW200. This finding suggests that the enhanced IN for FW200-air is related to the increased mesopore availability (see Section 3.1.1). Moreover, the FW200-air PSD peak is larger and broader than FW200 with all contact angle assumptions (see Fig. 8c), showing that thermal denuding enlarges mesopore volume for FW200-air. The increase in the volume of the same size mesopore also facilitates FW200-air to be more IN active via PCF by contributing to the ω of pore-water (see Section 3.1.1).
3.2.4.4 PR90. Fresh PR90 shows an isotherm of Type V with a H3 hysteresis loop,17,118 showing an isotherm with a convex shape at RHw < 40% and a broad sorption hysteresis (see Fig. 7d). This suggests it has a relatively low active site density, i.e., a contact angle higher than FW200. Thus, this explains its lower CCN activity compared to FW200 (see Fig. 2 and 3). In addition, because PR90 shows a stronger water uptake ability than C3H8 flame soot (Fig. 7d), it is estimated to have a contact angle in the range of 45–75° (<60–85°). Presenting a larger isotherm slope at RHw < 40%, air thermal denuding lowers PR90-air contact angle and enhances its water affinity. The decreased contact angle also leads to a lower RHw starting point for PR90-air hysteresis loop, i.e., capillary condensation occurring in smaller mesopores according to the Kelvin equation. The lower the pore filling RHw is, the stronger the negative pressure induced J promotion of pore-water will be,70 which supports the IN enhancement of PR90-air particles for T < HNT, especially at 233 K (see Section 3.1.1). Furthermore, assuming a contact angle for PR90-air smaller by 15° than PR90, the PSD results in Fig. 8d suggest that PR90-air contains more micropores (rp < 1 nm) and small mesopores (1 < rp < 2 nm) whereas there is no pronounced mesopore change for PR90-air when rp > 3 nm. Hence, it may be the thermal denuding induced soot–water contact angle decrease and micropore increase that contribute to PR90-air water interaction and CCN activation at T > HNT, and both the decrease in contact angle and the increase in small mesopores that facilitate PR90-air IN via PCF at T < HNT (see Fig. 2d and 3d). The contact angle decrease resulted pore filling at low RH conditions may play the first important role in PCF enhancement whereas the mesopore availability change may play a limited role (see Section 3.1.1).
4 Atmospheric implications
This study demonstrates that the IN activity of soot particles depend on their volatile content. Thermal denuding induced property modifications, including intra-aggregate pore volume, chemical functional group and surface oxidation changes, can occur. We note that the results of mCASTblack and mCASTbrown samples containing different OM content can be comparable to aviation soot particles of similar sizes (200 and 400 nm), as these are known to be aviation soot proxies. The mCASTblack and mCASTbrown show similar morphological properties to aviation soot22,79,119 which may also have varying OM content because of emissions from different engine technologies, thrust levels, and oxidation and/or organic coating during atmospheric transportation. Our findings show that denuding of volatile content by a small mass fraction (≤3% of original particle mass) can lead to enhanced IN via PCF for porous soot particles (the case for FW200). We attribute this to an increase in pore volume availability relevant for PCF. On the other hand, it can be deduced that OM oxidation or addition on soot particles may decrease pore availability upon new organics formation and pore network change, thus preventing soot IN via PCF (the case for mCASTblack and mCASTbrown). Hence, aircraft soot analogous to mCASTblack and mCASTbrown soot22,79 may also present suppressed IN ability if OM oxidation or OM coating induced pore availability decrease occurs. Moreover, atmospherically coated soot particles with a small pore availability will not serve as cirrus cloud INPs. Bhandari et al.25 reported that approximately 90% of ambient soot particles sampled from foggy weather conditions are coated, which implies a decreased pore availability and suppressed IN ability with respect to the findings in this study. Freshly emitted and near source soot particles without coatings are thus more relevant to cirrus cloud formation via PCF. In addition, our study implies that thermal denuding caused decrease in soot-water contact angle or increase in soot surface active site density may enhance the IN ability of porous soot particles, especially for T close to the HNT (the case for FW200 and PR90). In the atmosphere, porous soot particles can be aged with O3 producing a more wettable surface,120–122 after which aged soot particles can contribute to cirrus cloud formation more significantly. Particularly, if porous soot particles are as active as our FW200 sample, then aged porous soot particles with plenty of active sites can even form ice crystals at T = 238 K, which is relevant to clouds at lower altitudes. Furthermore, this study has atmospheric implications on the role of physicochemical properties in soot particle water droplet activation at supercooled conditions. Both surface oxidation level and pore availability determine soot-water interaction and droplet activation ability whereas the increased surface oxidation alone may not be the decisive factor. For example, albeit with increased oxidation level, mCASTblack-air shows depressed droplet formation ability as it has decreased pore availability whereas mCASTbrown-N2 with increased pore availability shows promoted CCN activation for T > HNT. Moreover, the organic phase state for organic-rich soot particles may be important when evaluating the droplet activation and IN ability (the case for mCASTbrown-air). Lastly, it has been shown that mCASTblack can be as active INPs as FW200 merely by compacting the particles through cloud processing, as such ageing by cloud processing after being freshly emitted could lead to a substantial contribution in cirrus cloud INPs.155 Summary
In this study, different thermal denuding environments (pure N2 or air) were used to modify four soot samples of various volatile content and porosities, including two C3H8 flame soot particles with poor or rich organics (mCASTblack and mCASTbrown), and two porous carbon black particles with high or low surface wettability (FW200 and PR90). Size-selected 200 and 400 nm soot particles with and without thermal denuding were tested for their ice nucleation (IN) ability at fixed temperature (T) between 218 and 243 K, as a function of relative humidity (RH). The particle ρeff was derived from mobility diameter and mass distribution of size-selected soot samples by conducting SMPS and CPMA scans synchronously with the IN experiments. Bulk soot sample T dependent mass losses, chemical functional group changes and water interaction activities were also measured by TGA, FTIR and DVS techniques, respectively. It is demonstrated that thermal denuding modifies both soot-aggregate porosity and surface water interaction ability depending on the original soot porosity and volatile content, affecting the IN activity of soot particles differently. In general, N2 thermal denuding may increase soot particle porosity by removing volatile content and meanwhile it may decrease the particle porosity by regulating its primary particle network through thermophoresis forces. Thus, the combined porosity change may be an increase or a decrease which exerts a promotion or impairment effect on the particle pore condensation and freezing (PCF) respectively. Furthermore, volatile matter removal by thermal denuding can expose active sites on soot surfaces for water interaction, contributing to enhanced IN and water droplet activation if sufficient pores are available for the particle. The air thermal denuding regulates soot properties in a more complex manner. In the presence of O2, surface oxidation may increase the active site density or the product of oxidation may decrease pore openness, which modifies soot particle IN via PCF differently. Especially, the air thermal denuding enhances porous soot particle IN near the HNT if the oxidation increases the active site density. Our results imply that the mesopore availability change induced by thermal denuding likely plays a dominant role in regulating soot IN.Relying on a single predictor to evaluate soot IN activity change may lead to diverse conclusions. Previous studies reported that organic-rich C3H8 flame soot particles are poor INPs compared to organic-lean soot produced by the same technique, which potentially suggests that organics inhibit soot IN ability. The thermal denuding results for mCASTbrown soot in this study are consistent with the literature, showing that organics removal promotes soot IN. However, this is opposite to the case for denuded organic-lean mCASTblack soot, which shows supressed IN. Comprehensively, the IN results of denuded mCASTblack and mCASTbrown soot imply that porosity change is the dominant cause for soot particle IN modification but not the organic content change. It is the mesopore availability change associated with removal of organic content that is responsible for regulating soot IN via PCF. Other than the organic content, the organic properties, e.g., hydrophilicity, also should be considered in evaluating soot IN abilities. For instance, FW200 soot contains comparable amount of volatile (or organic) content to mCASTbrown soot but it is more CCN and IN active. Therefore, the volatile or organic content alone cannot be used to evaluate soot IN ability. In addition, there is no consensus on the role of oxidation on soot particle IN and contrasting cases are reported in the literature (see Introduction). In the scope of soot PCF, our study suggests that increased soot surface oxidation level (see FTIR in Fig. 5a) associated active site density increase contributes to enhanced soot IN only if the mesopores for PCF are available (see DVS Fig. 8a). Otherwise, oxidised soot surface plays a limited role even if more active sites are exposed. Therefore, we propose that porosity and morphology are primary predictors for soot IN via PCF, compared to particle chemistry. To evaluate the single effect of oxidation degree in soot IN, it is promising to only modify the particle surface chemistry and retain its PSD. Finally, soot CCN/IN results at a measured T should be used carefully to infer the results at other T, given that thermal denuding effects on soot CCN/IN showed a T dependence (mCASTbrown, FW200 and PR90).
6 Appendix A
6.1 Ice nucleation activity of fresh and denuded 200 nm soot particles
Fig. 9–12 and 13–16 present the AF plots derived from the IN data in 1.0 μm OPC channel for 400 and 200 nm size-selected soot samples as a function of RHi and RHw, respectively.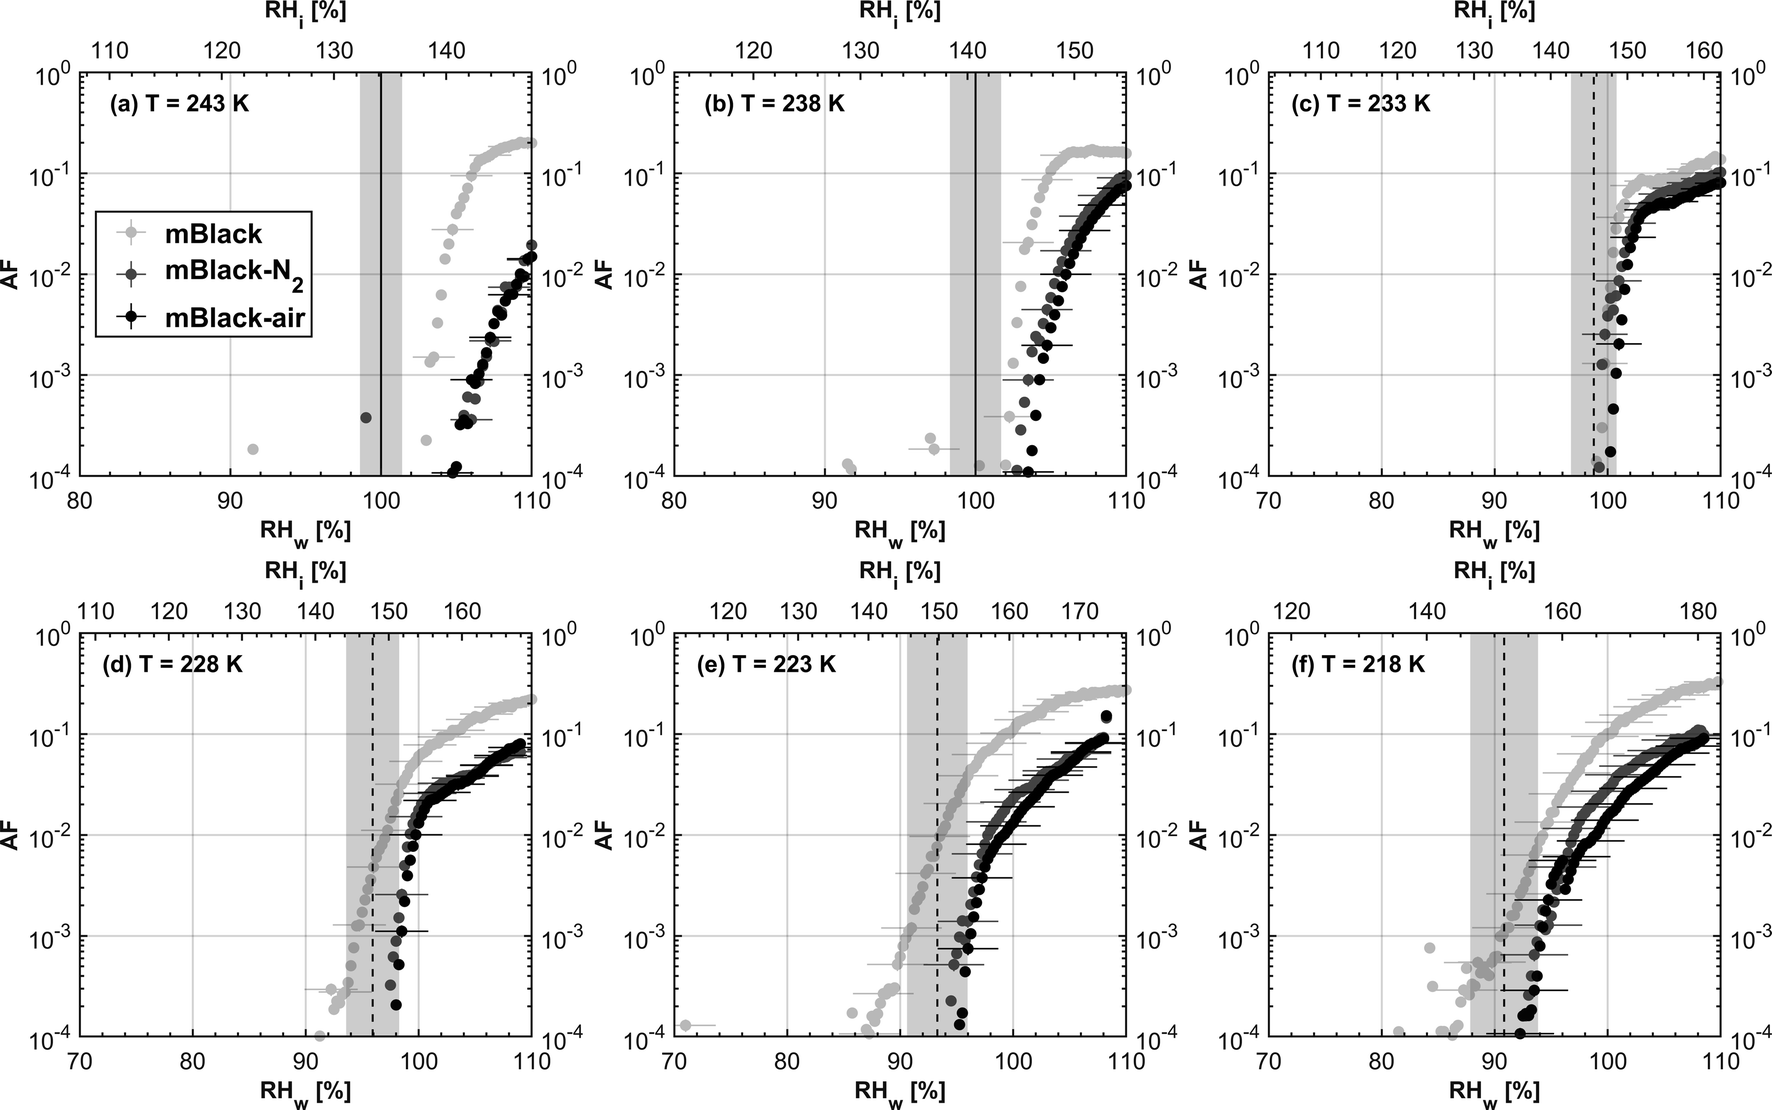 | ||
| Fig. 9 AF curves as a function of RH (relative humidity) with respect to water (RHw) and ice (RHi) for fresh and denuded 400 nm mCASTblack soot particles corresponding to 1.0 μm OPC channel. Black solid line represents water saturation conditions according to Murphy and Koop,44 and dashed lines indicate expected RH values for homogeneous freezing at T < HNT,45 respectively. The grey shading areas show the possible RH uncertainty calculated for water saturation and homogeneous freezing conditions. | ||
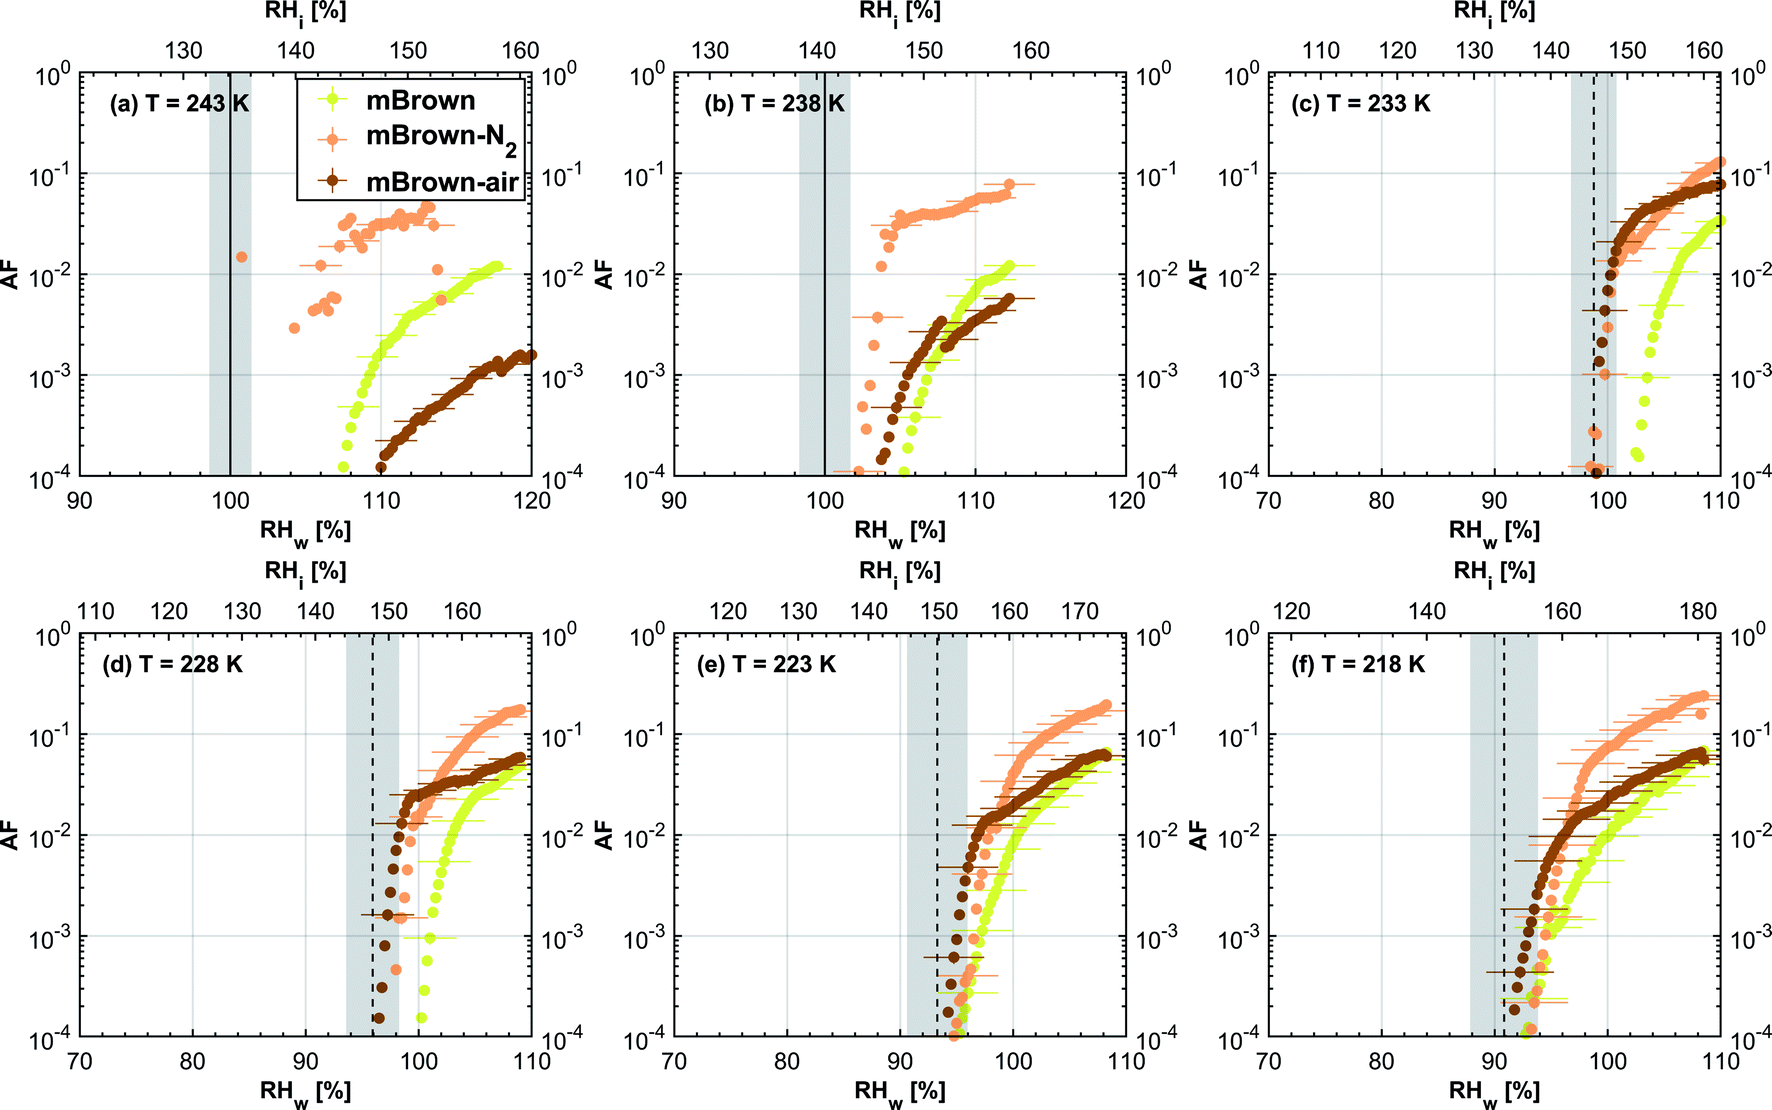 | ||
| Fig. 10 The same as Fig. 9 but for fresh and denuded 400 nm mCASTbrown soot particles. | ||
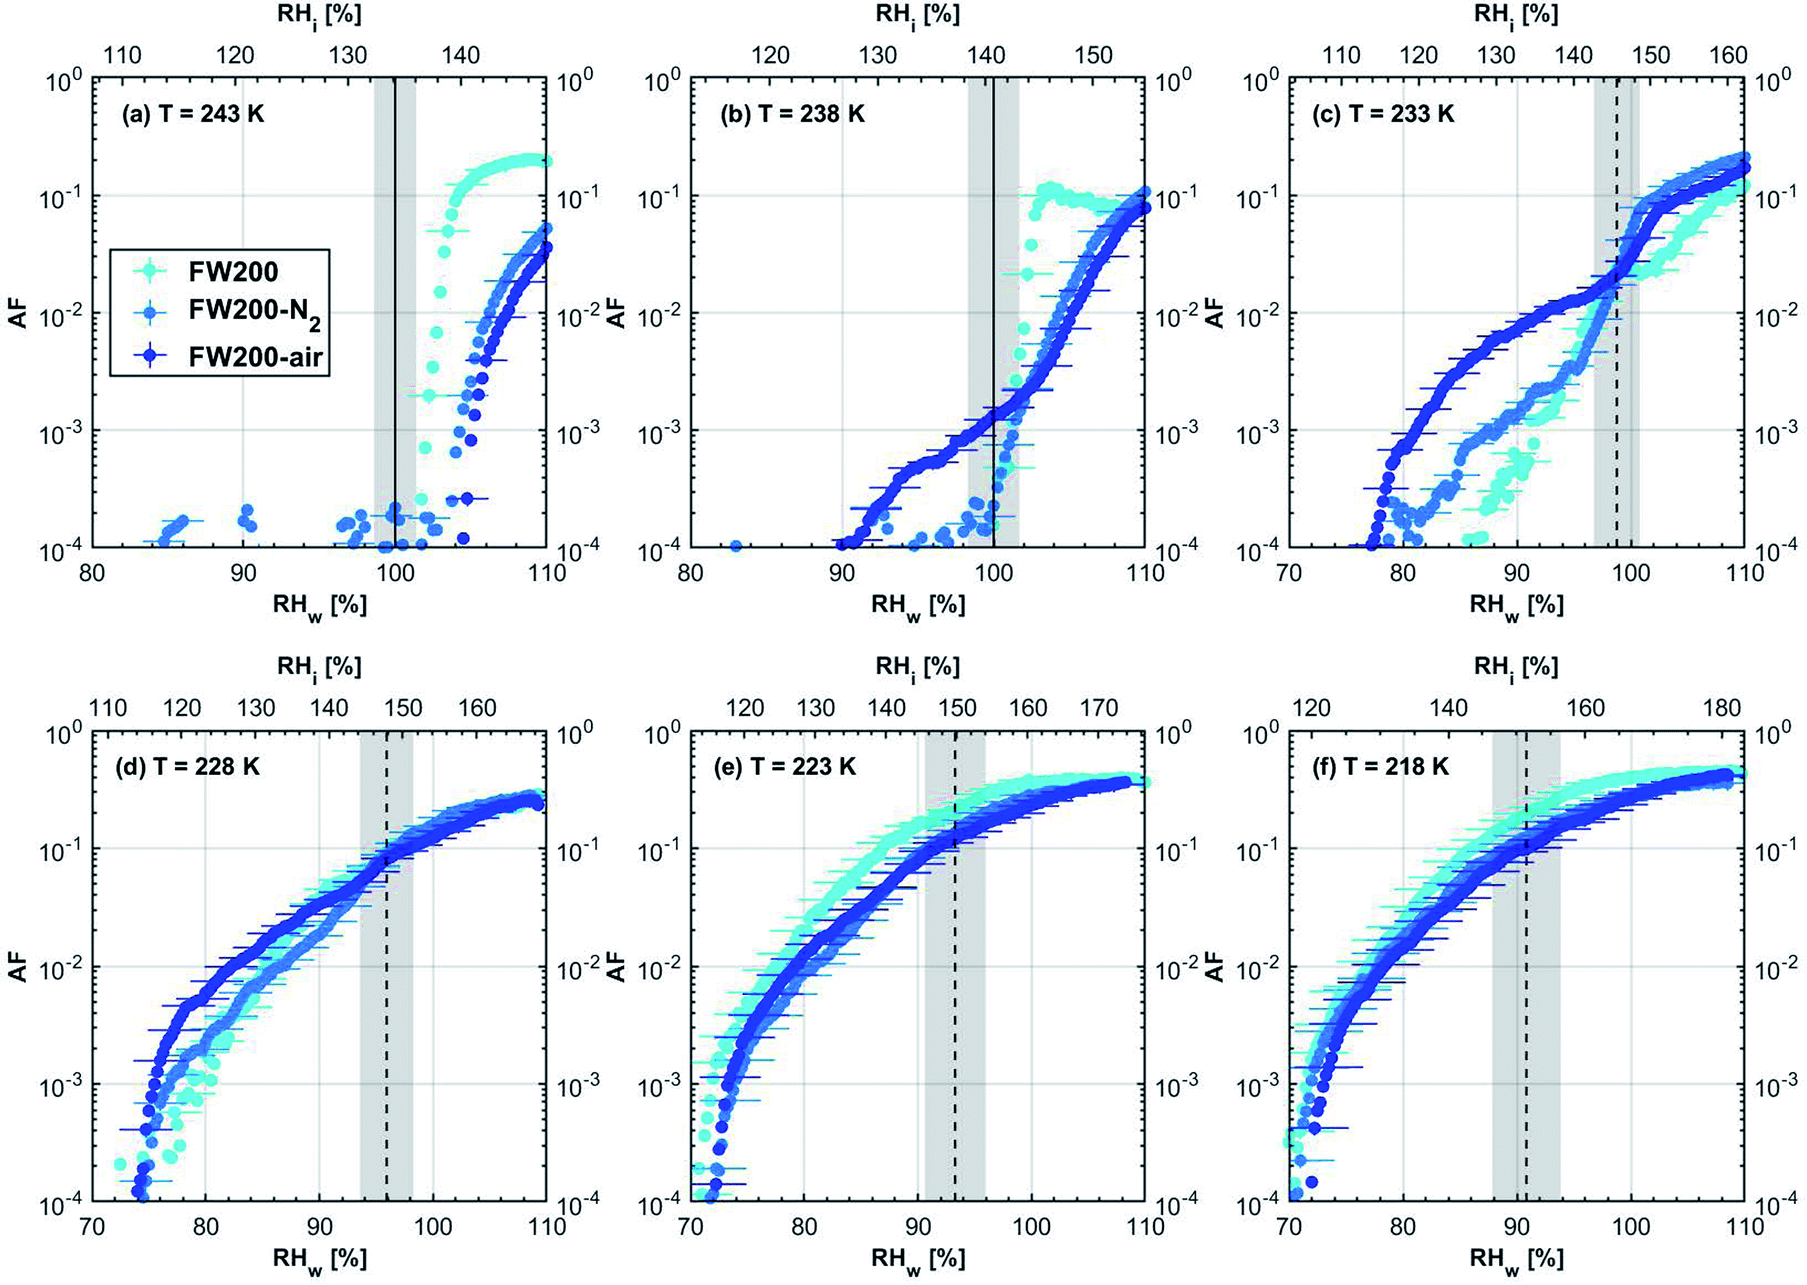 | ||
| Fig. 11 The same as Fig. 9 but for fresh and denuded 400 nm FW200 soot particles. | ||
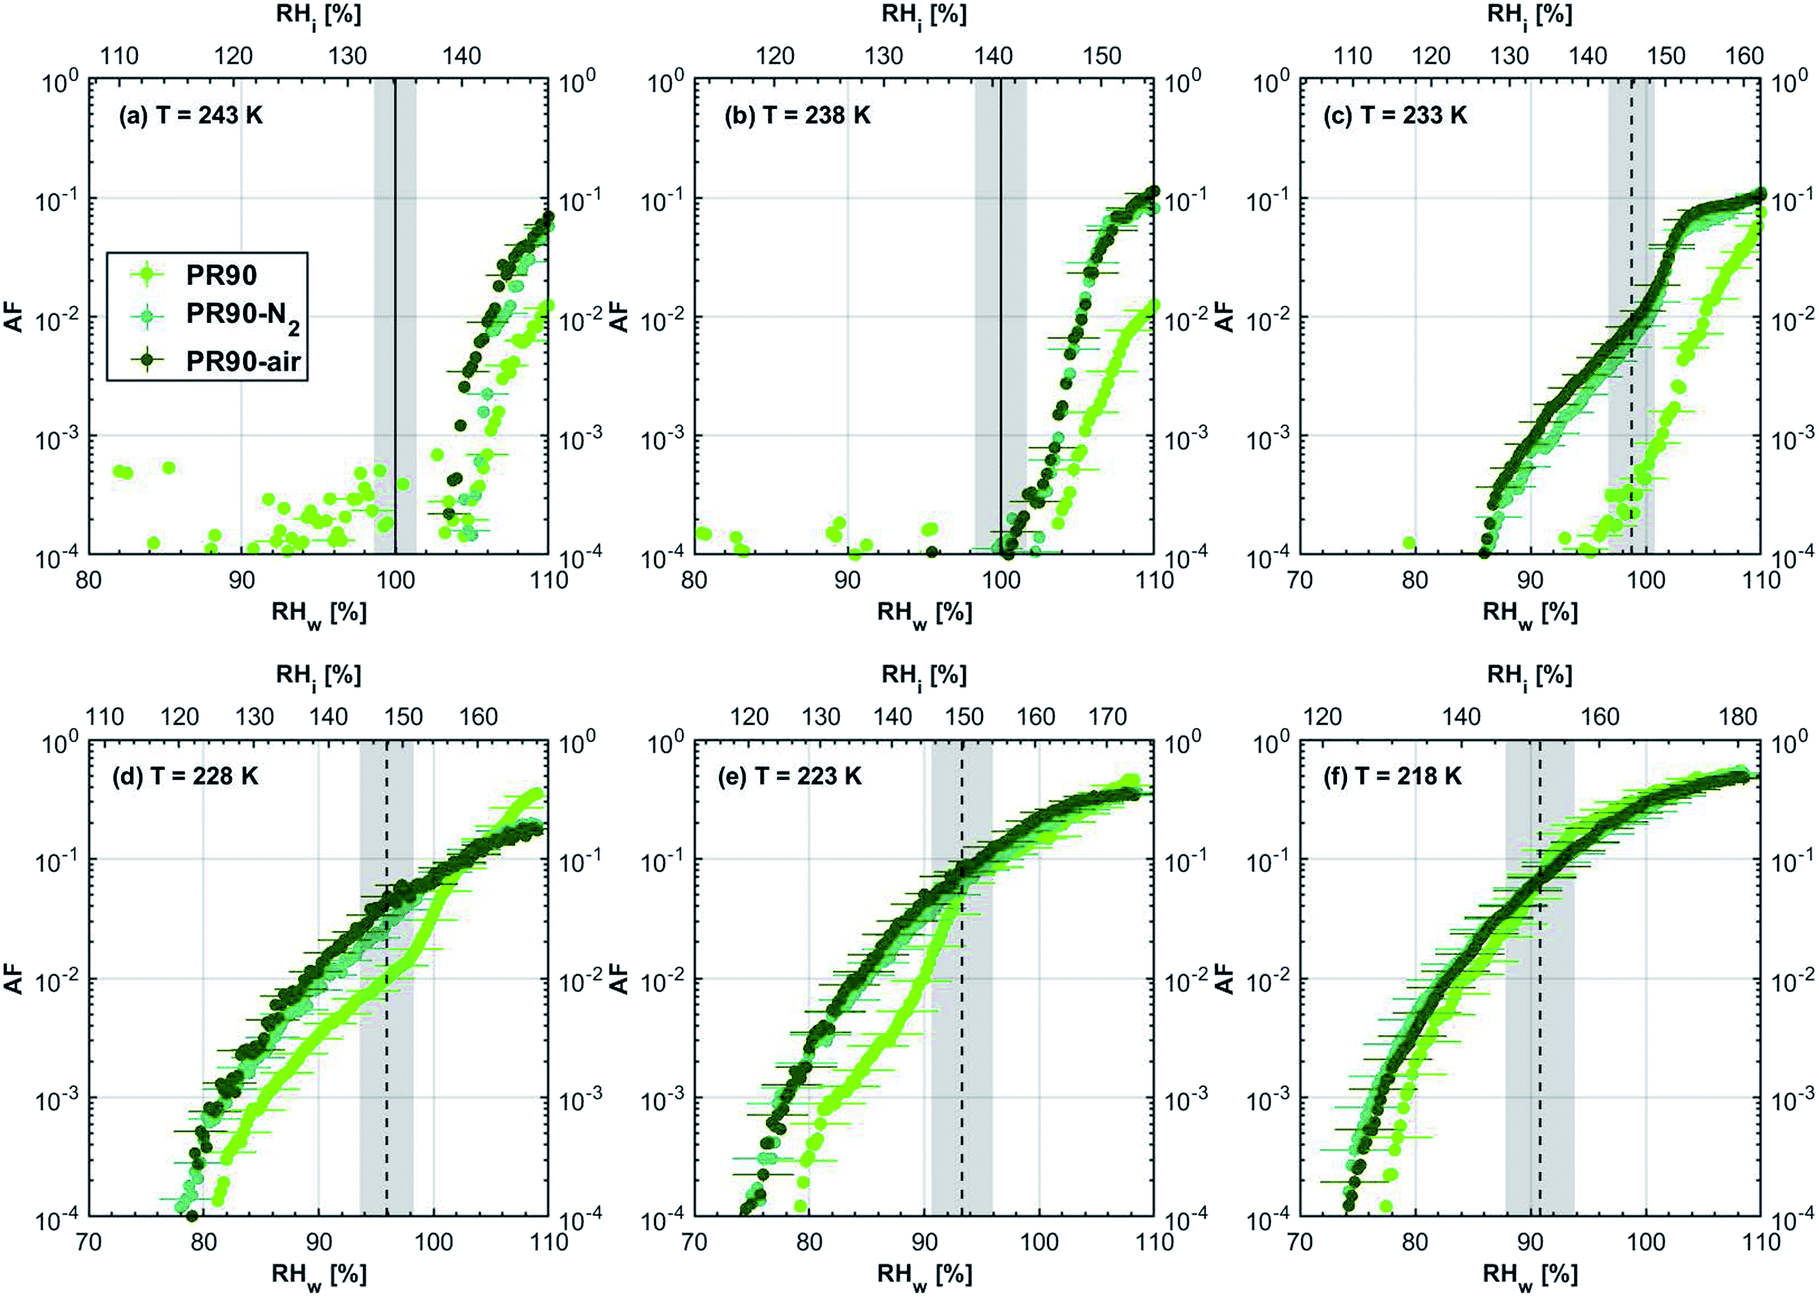 | ||
| Fig. 12 The same as Fig. 9 but for fresh and denuded 400 nm PR90 soot particles. | ||
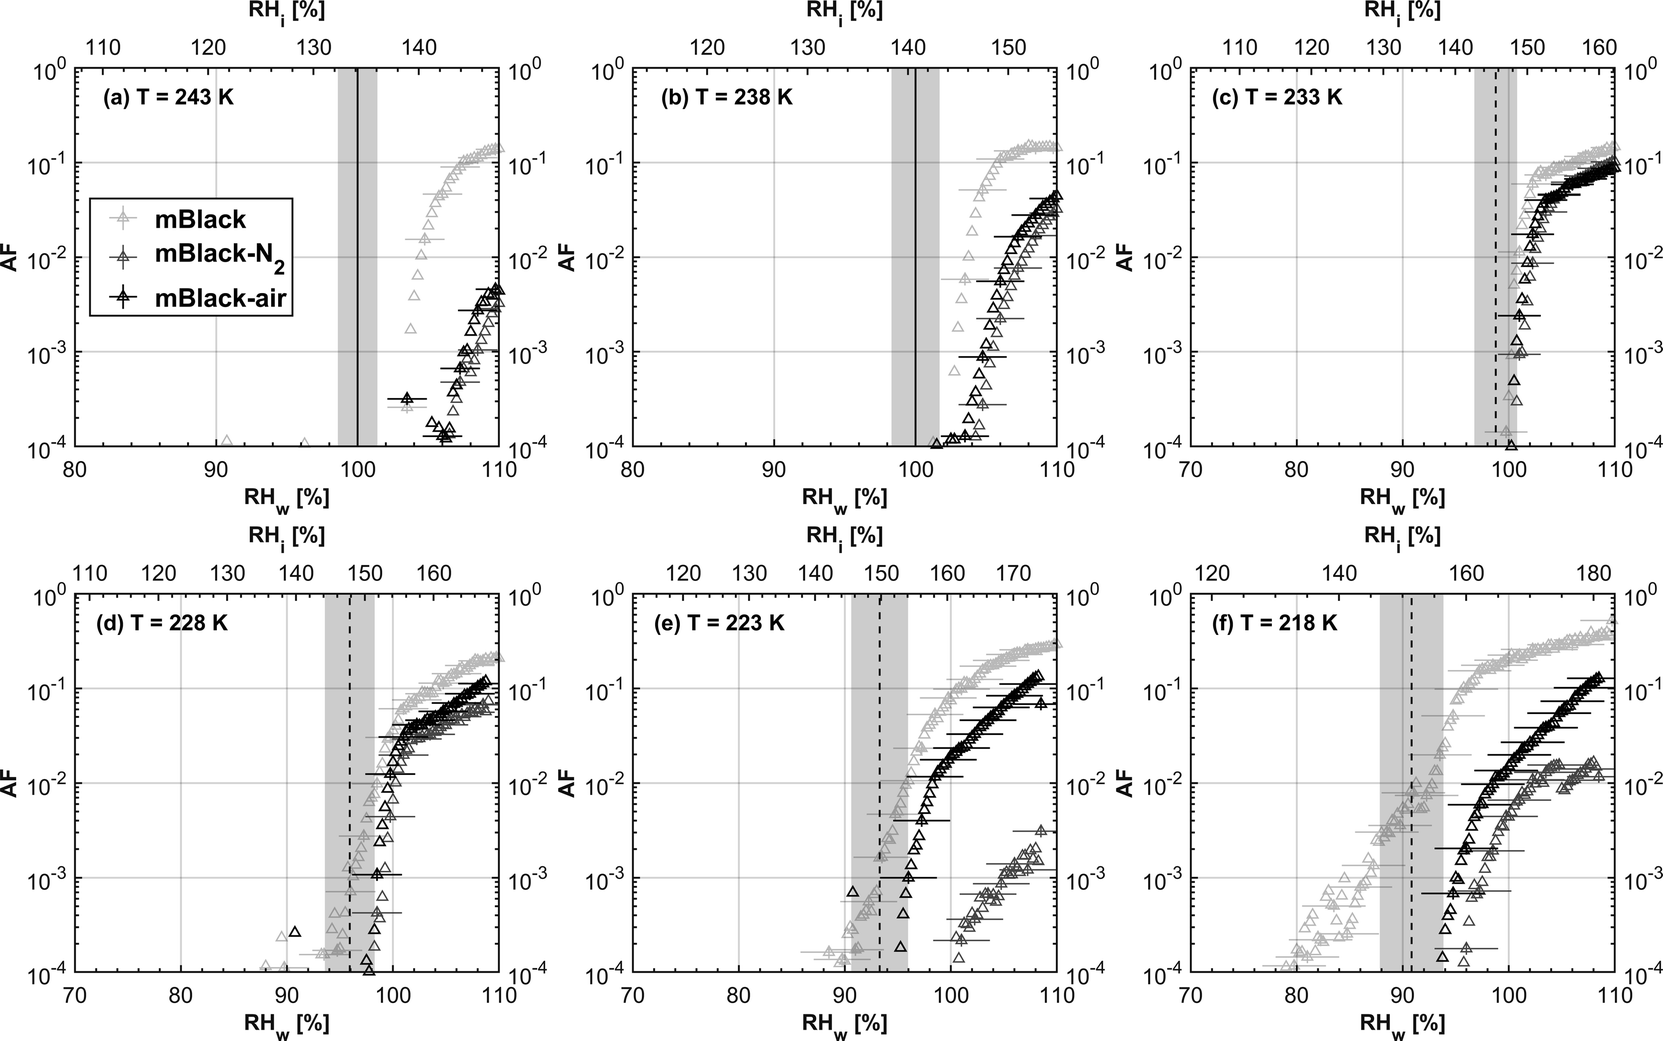 | ||
| Fig. 13 The same as Fig. 9 but for fresh and denuded 200 nm mCASTblack soot particles. | ||
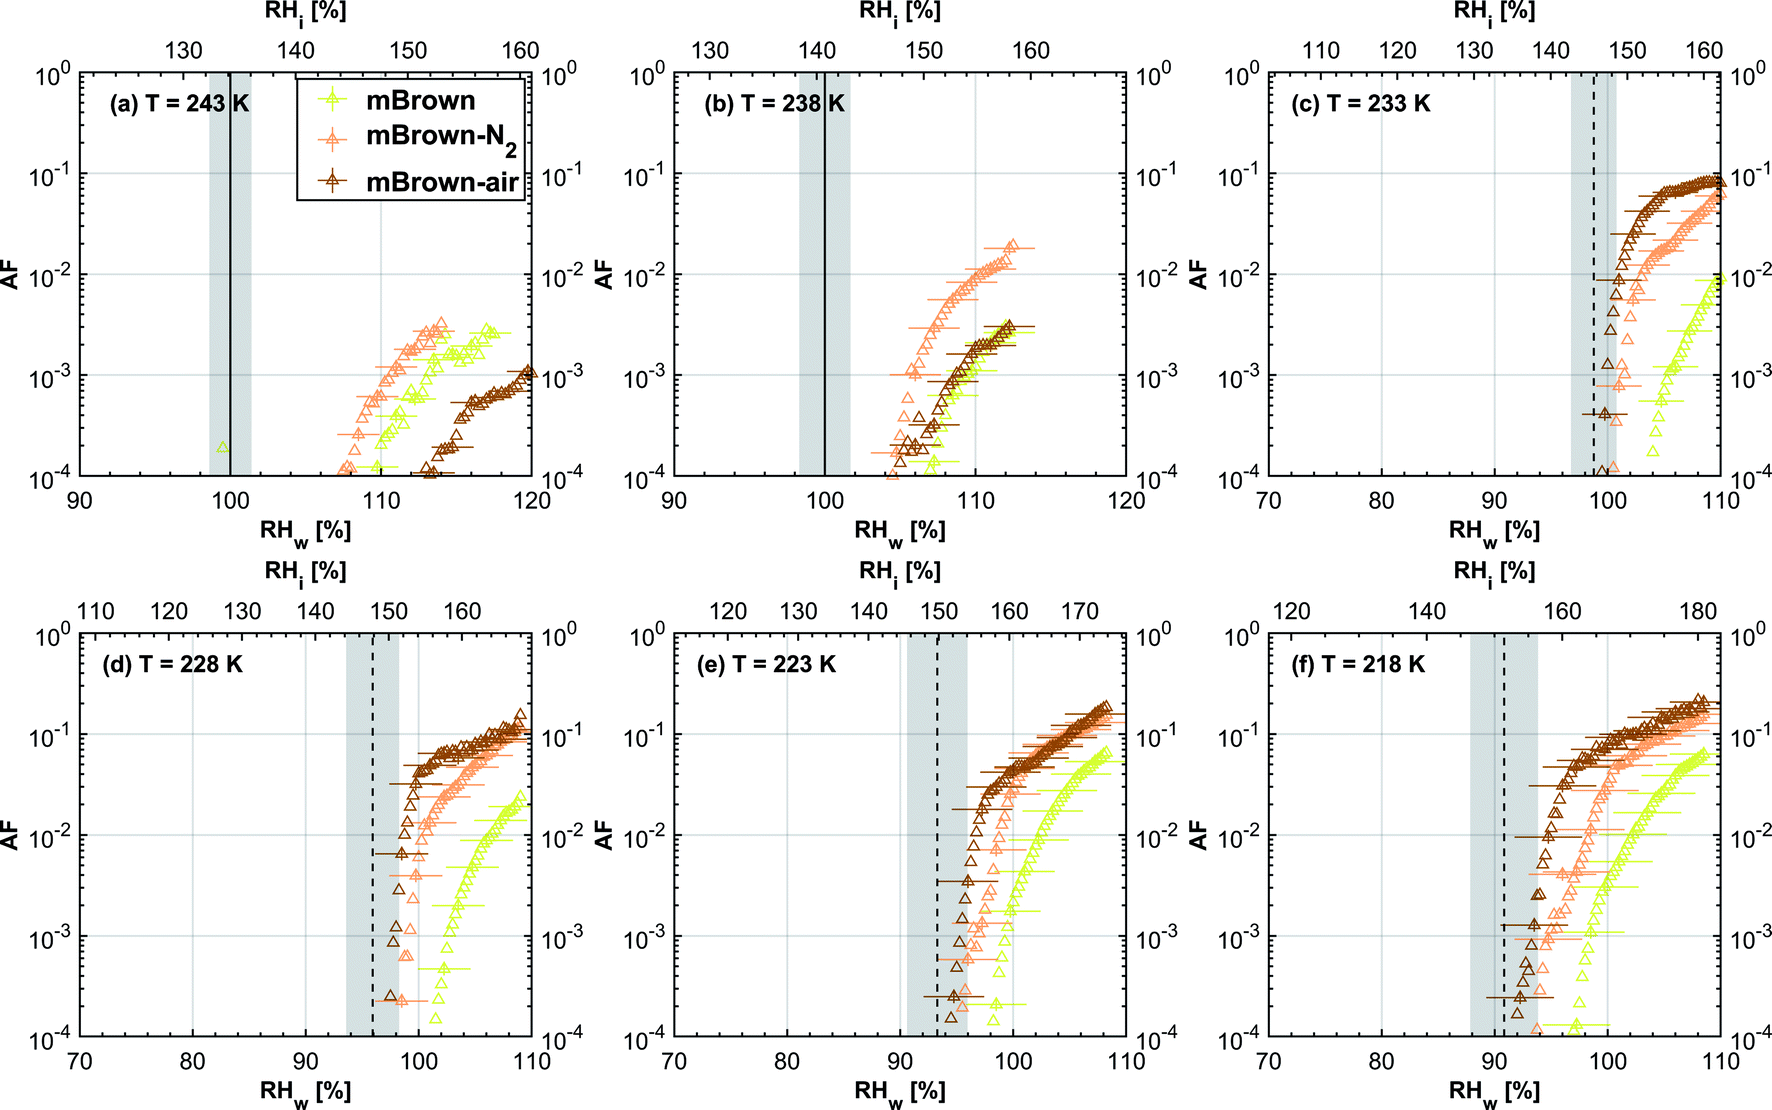 | ||
| Fig. 14 The same as Fig. 9 but for fresh and denuded 200 nm mCASTbrown soot particles. | ||
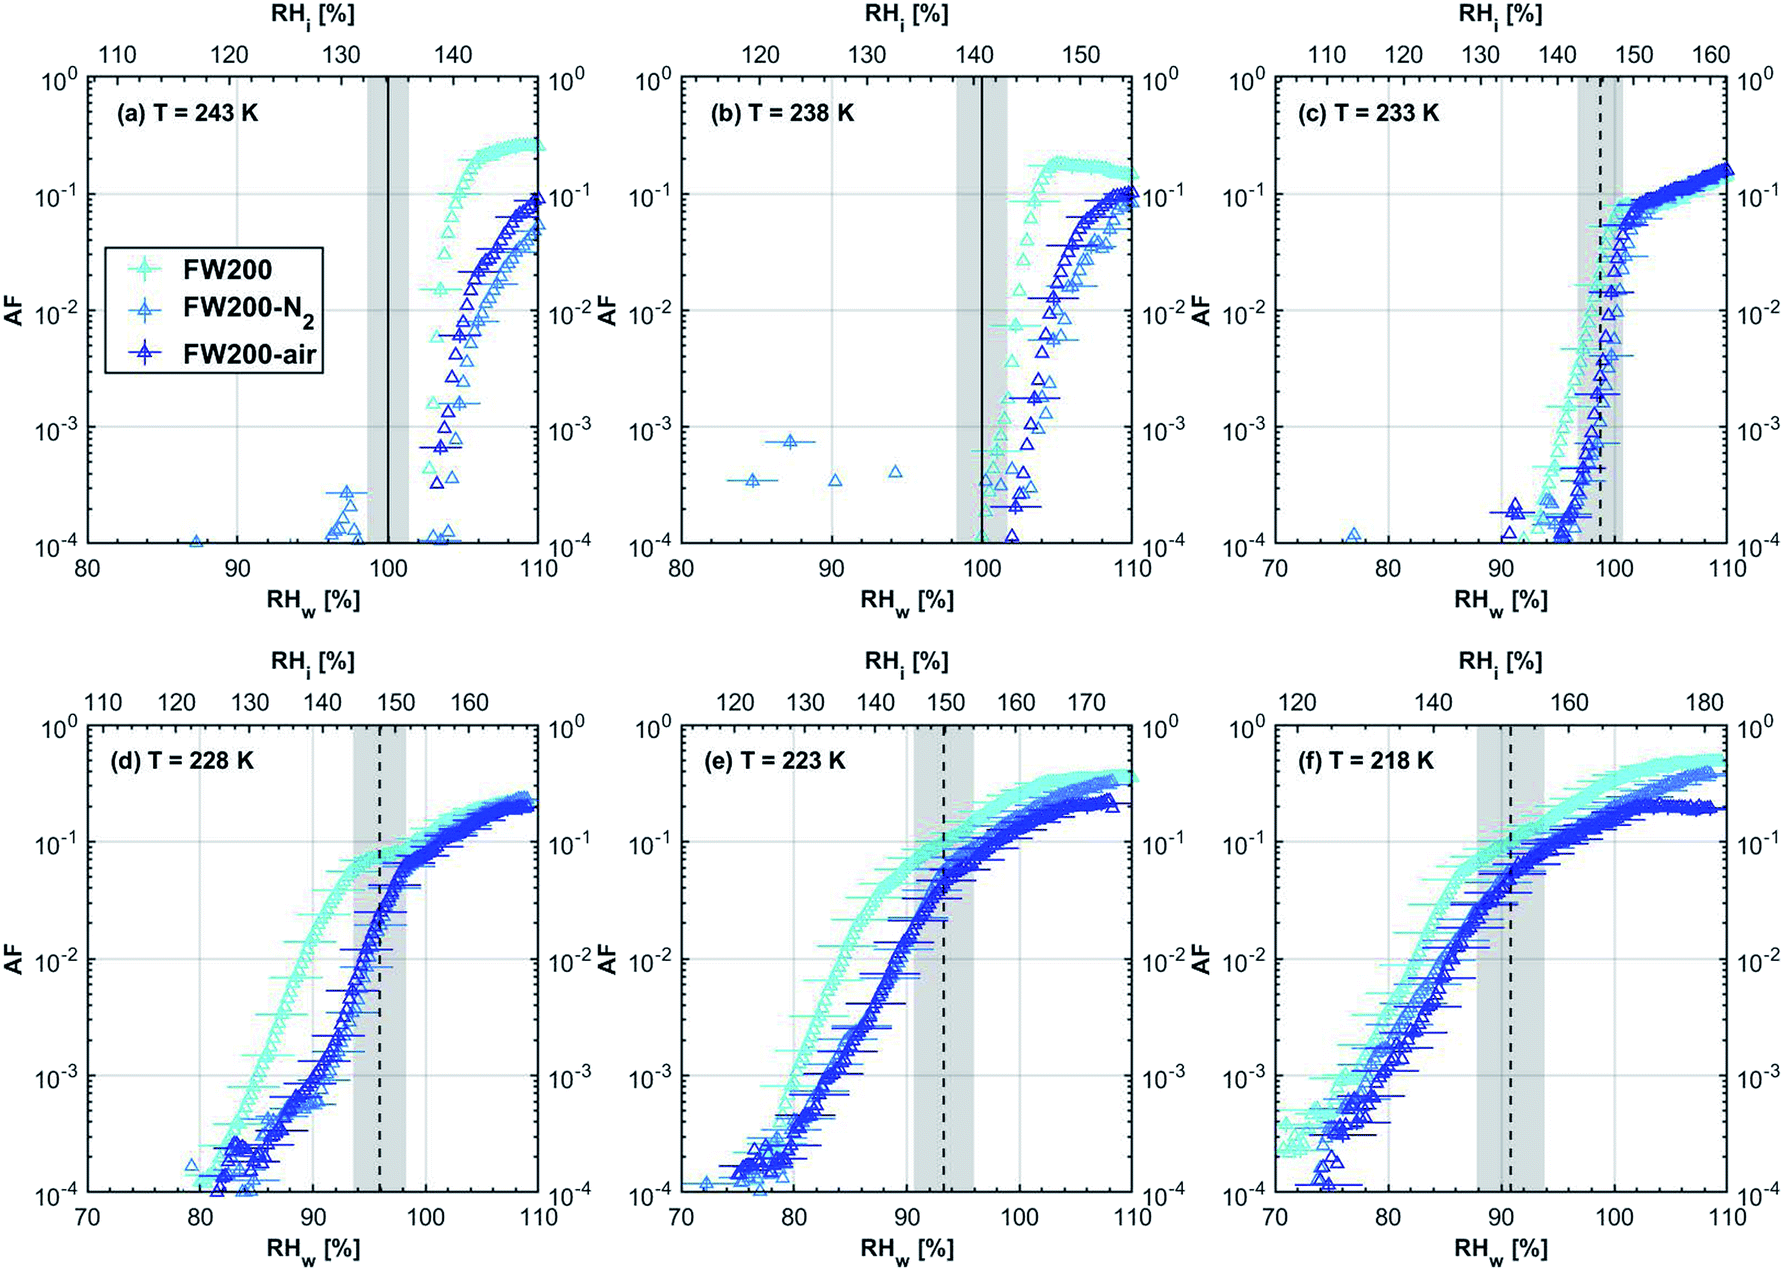 | ||
| Fig. 15 The same as Fig. 9 but for fresh and denuded 200 nm FW200 soot particles. | ||
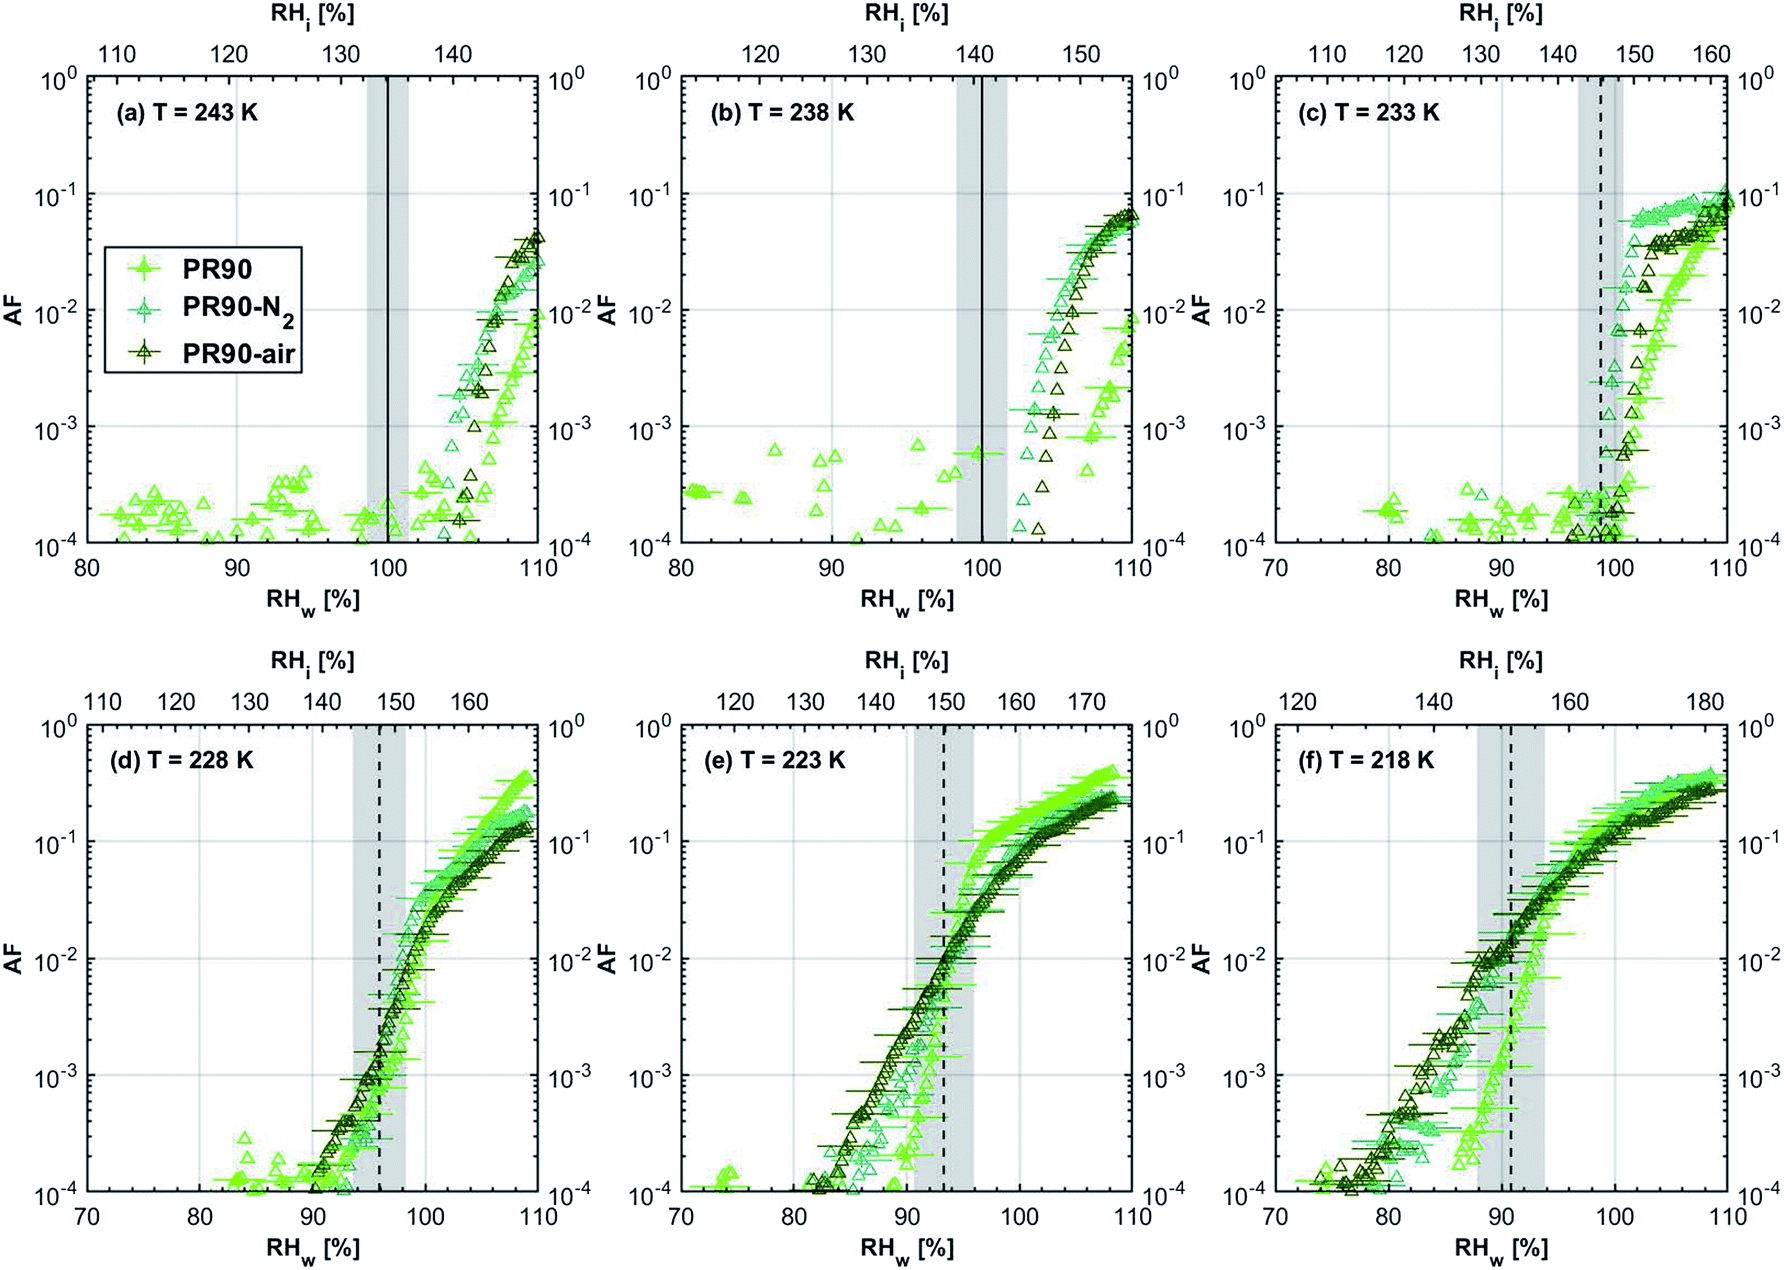 | ||
| Fig. 16 The same as Fig. 9 but for fresh and denuded 200 nm PR90 soot particles. | ||
7 Appendix B
7.1 The mass fraction change derivation rates for TGA measurements
Fig. 17 shows the derivative weight fraction change rates for TGA measurements to support the interpretation of the mass loss presented in Fig. 4 in Section 3.2.1. At the beginning of the measurement (<100 °C), rapid mass loss indicates the desorption of water vapour. At 300 °C, the significant mass loss rate is because the T was held constant for 30 minutes.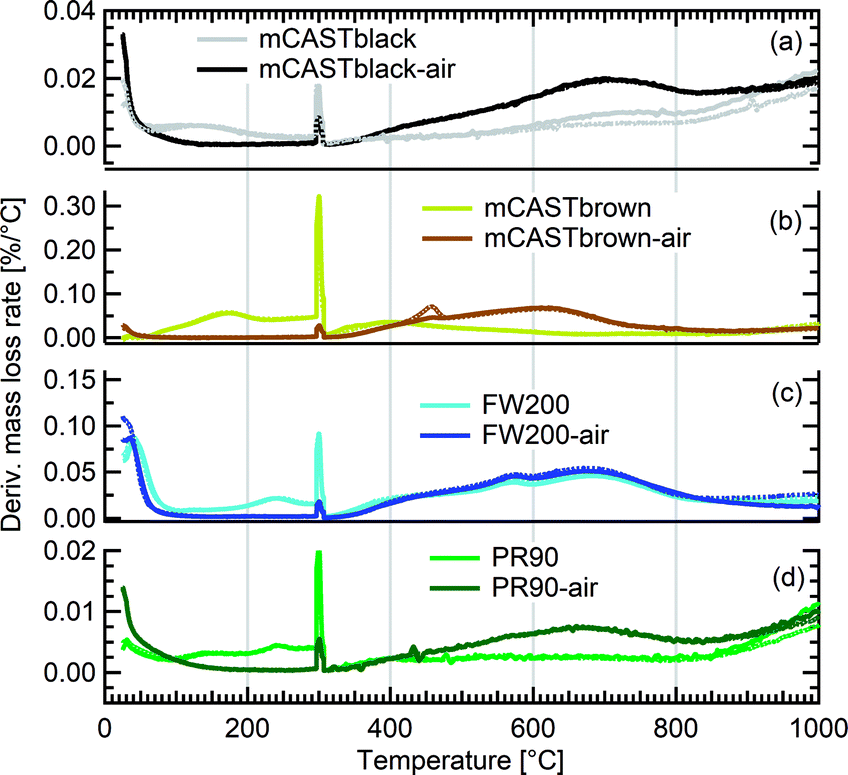 | ||
| Fig. 17 TGA derivative mass loss rates as a function of temperature (T) for fresh and synthetic air (N2 + O2) atmosphere oven heated (300 °C) bulk soot samples solid and dotted lines indicate two individual TGA runs on the same sample type. | ||
8 Appendix C
8.1 Size-selected soot particle effective density results
The single particle mobility diameter and mass values derived from log–normal fitting to the distribution can be used to calculate the particle effective density (ρeff) following the expression below: | (C1) |
The  is the single particle mass and Dm is the single particle mobility diameter. The ρeff of 400 and 200 nm fresh and denuded particles is presented in Fig. 6 and 18, respectively.
In general, thermal denuding does not result in significant (based on overlapping error bars) ρeff change for 200 nm mCASTblack, FW200 and PR90 size-selected particles, compared to the fresh particles. It is reported that smaller soot particles have more rigid structure.123 Hence, thermophoresis forces induced mobility diameter reduction in 200 nm particles is smaller than the case of 400 nm particles, which limits the ρeff increase. The originally larger ρeff of 200 nm particles also suggests they have a higher level of compactness and structural stability. This means 200 nm particles present a smaller size change when undergoing the same thermal denuding as larger particles (400 nm). In Fig. 18, the ρeff change caused by thermal denuding in 200 nm mCASTblack particles shows a similar trend to those of 400 nm mCASTblack particles. The same thermal denuding results in a much smaller ρeff increase for 200 nm mCASTbrown-N2 (23%) and mCASTbrown-air (22%) particles (Fig. 18), compared to 400 nm particles (86% and 43% in Fig. 6, respectively). Both thermal denuding conditions lead to an increase in the ρeff of 200 nm FW200-N2 and FW200-air particles, which suggests 200 nm FW200-N2 and FW200-air particles become more densified and have decreased pore volume. This may explain the suppressed IN of both denuded 200 nm FW200 particles for T between 223 and 233 K (see Fig. 3c). Both denuded 200 nm PR90 particles also show a slight ρeff increase, suggesting thermal denuding induced mobility diameter reduction exceeds mass loss (see ESI S2†) because of the low volatile content of original PR90.
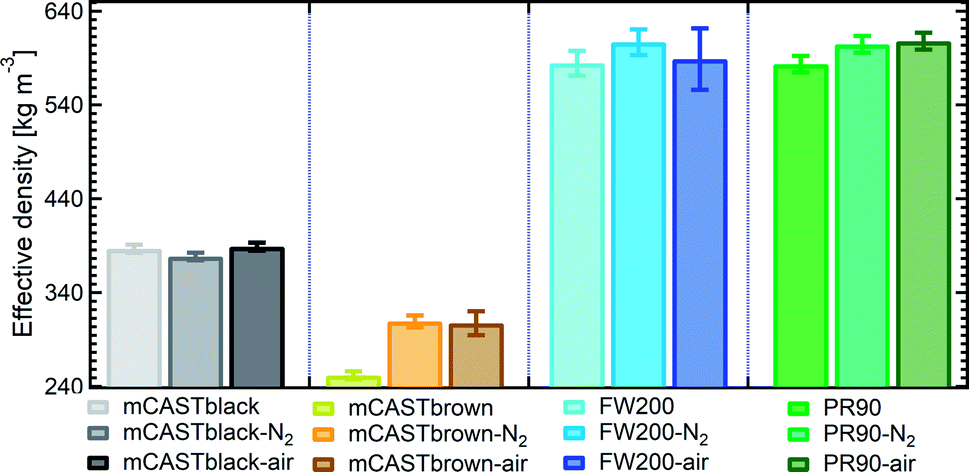 | ||
| Fig. 18 The effective density (ρeff) of fresh and denuded 200 nm soot particles. The error bar indicates one standard deviation. Please note the y-axis origin. | ||
Author contributions
K. G. and Z. A. K. designed the experiment and interpreted the data. H. C.-K. and Z. A. K. helped K. G. with the FTIR experiment. K. G. conducted experiments and data analysis. K. G. wrote the manuscript and prepared the figures with contributions from Z. A. K. All authors discussed and reviewed the manuscript. Z. A. K. supervised the project.Conflicts of interest
The authors declare that they have no conflict of interest.Acknowledgements
We are grateful to the experimental atmospheric physics group at ETH Zurich for their help with instrument trouble shooting. We would like to thank Prof. Ingo Burgert (Department of Civil, Environmental and Geomatic Engineering, ETHZ) for providing access to their TGA and FTIR facilities. This work was supported by China Scholarship Council (grant no. 201906020041) and the Experimental Atmospheric Physics Professorship at ETH Zurich.Notes and references
- R. W. Stratton, P. J. Wolfe and J. I. Hileman, Impact of aviation non-CO(2) combustion effects on the environmental feasibility of alternative jet fuels, Environ. Sci. Technol., 2011, 45, 10736–10743 CrossRef CAS PubMed.
- T. Takemura and K. Suzuki, Weak global warming mitigation by reducing black carbon emissions, Sci. Rep., 2019, 9, 4419 CrossRef PubMed.
- Z. McGraw, T. Storelvmo, B. H. Samset and C. W. Stjern, Global radiative impacts of black carbon acting as ice nucleating particles, Geophys. Res. Lett., 2020, 47, e2020GL089056 CrossRef CAS PubMed.
- U. Schumann and A. J. Heymsfield, On the life cycle of individual contrails and contrail cirrus, Meteorol. Monogr., 2017, 58, 3.1–3.24 CrossRef.
- A. Bier and U. Burkhardt, Variability in Contrail Ice Nucleation and Its Dependence on Soot Number Emissions, J. Geophys. Res.: Atmos., 2019, 124, 3384–3400 CrossRef.
- U. Lohmann, F. Friebel, Z. A. Kanji, F. Mahrt, A. A. Mensah and D. Neubauer, Future warming exacerbated by aged-soot effect on cloud formation, Nat. Geosci., 2020, 13, 674–680 CrossRef CAS.
- C. Alcala-Jornod, H. van den Bergh and M. J. Rossi, Can soot particles emitted by airplane exhaust contribute to the formation of aviation contrails and cirrus clouds?, Geophys. Res. Lett., 2002, 29, 1–4 CrossRef.
- O. B. Popovicheva, N. M. Persiantseva, E. E. Lukhovitskaya, N. K. Shonija, N. A. Zubareva, B. Demirdjian, D. Ferry and J. Suzanne, Aircraft engine soot as contrail nuclei, Geophys. Res. Lett., 2004, 31, L11104 CrossRef.
- B. Karcher, Formation and radiative forcing of contrail cirrus, Nat. Commun., 2018, 9, 1824 CrossRef PubMed.
- D. S. Lee, D. W. Fahey, A. Skowron, M. R. Allen, U. Burkhardt, Q. Chen, S. J. Doherty, S. Freeman, P. M. Forster, J. Fuglestvedt, A. Gettelman, R. R. De Leon, L. L. Lim, M. T. Lund, R. J. Millar, B. Owen, J. E. Penner, G. Pitari, M. J. Prather, R. Sausen and L. J. Wilcox, The contribution of global aviation to anthropogenic climate forcing for 2000 to 2018, Atmos. Environ., 2021, 244, 117834 CrossRef CAS PubMed.
- F. Mahrt, C. Marcolli, R. O. David, P. Grönquist, M. E. J. Barthazy, U. Lohmann and Z. A. Kanji, Ice nucleation abilities of soot particles determined with the Horizontal Ice Nucleation Chamber, Atmos. Chem. Phys., 2018, 18, 13363–13392 CrossRef CAS.
- L. Nichman, M. Wolf, P. Davidovits, T. B. Onasch, Y. Zhang, D. R. Worsnop, J. Bhandari, C. Mazzoleni and D. J. Cziczo, Laboratory study of the heterogeneous ice nucleation on black-carbon-containing aerosol, Atmos. Chem. Phys., 2019, 19, 12175–12194 CrossRef CAS.
- K. Gao, C.-W. Zhou, E. J. B. Meier and Z. A. Kanji, Laboratory studies of ice nucleation onto bare and internally mixed soot–sulfuric acid particles, Atmos. Chem. Phys., 2022, 22, 5331–5364 CrossRef CAS.
- F. Mahrt, P. A. Alpert, J. Dou, P. Gronquist, P. C. Arroyo, M. Ammann, U. Lohmann and Z. A. Kanji, Aging induced changes in ice nucleation activity of combustion aerosol as determined by near edge X-ray absorption fine structure (NEXAFS) spectroscopy, Environ. Sci.: Processes Impacts, 2020, 22, 895–907 RSC.
- F. Mahrt, K. Kilchhofer, C. Marcolli, P. Grönquist, R. O. David, M. Rösch, U. Lohmann and Z. A. Kanji, The impact of cloud processing on the ice nucleation abilities of soot particles at cirrus temperatures, J. Geophys. Res.: Atmos., 2020, 125, 1–23 Search PubMed.
- K. Gao, F. Friebel, C.-W. Zhou and Z. A. Kanji, Enhanced soot particle ice nucleation ability induced by aggregate compaction and densification, Atmos. Chem. Phys., 2022, 22, 4985–5016 CrossRef CAS.
- M. Thommes, K. Kaneko, A. V. Neimark, J. P. Olivier, F. Rodriguez-Reinoso, J. Rouquerol and K. S. W. Sing, Physisorption of gases, with special reference to the evaluation of surface area and pore size distribution (IUPAC Technical Report), Pure Appl. Chem., 2015, 87, 1051–1069 CrossRef CAS.
- C. Marcolli, Deposition nucleation viewed as homogeneous or immersion freezing in pores and cavities, Atmos. Chem. Phys., 2014, 14, 2071–2104 CrossRef.
- C. Marcolli, F. Mahrt and B. Kärcher, Soot-PCF: Pore condensation and freezing framework for soot aggregates, Atmos. Chem. Phys., 2021, 21, 7791–7843 CrossRef CAS.
- R. O. David, C. Marcolli, J. Fahrni, Y. Qiu, Y. A. Perez Sirkin, V. Molinero, F. Mahrt, D. Bruhwiler, U. Lohmann and Z. A. Kanji, Pore condensation and freezing is responsible for ice formation below water saturation for porous particles, Proc. Natl. Acad. Sci. U. S. A., 2019, 116, 8184–8189 CrossRef CAS PubMed.
- R. L. Vander Wal, V. M. Bryg and C.-H. Huang, Aircraft engine particulate matter: Macro- micro- and nanostructure by HRTEM and chemistry by XPS, Combust. Flame, 2014, 161, 602–611 CrossRef CAS.
- I. Marhaba, D. Ferry, C. Laffon, T. Z. Regier, F.-X. Ouf and P. Parent, Aircraft and miniCAST soot at the nanoscale, Combust. Flame, 2019, 204, 278–289 CrossRef CAS.
- A. Liati, D. Schreiber, P. A. Alpert, Y. Liao, B. T. Brem, P. Corral Arroyo, J. Hu, H. R. Jonsdottir, M. Ammann and P. Dimopoulos Eggenschwiler, Aircraft soot from conventional fuels and biofuels during ground idle and climb-out conditions: Electron microscopy and X-ray micro-spectroscopy, Environ. Pollut., 2019, 247, 658–667 CrossRef CAS PubMed.
- K. S. Johnson, B. Zuberi, L. T. Molina, M. J. Molina, M. J. Iedema, J. P. Cowin, D. J. Gaspar, C. Wang and A. Laskin, Processing of soot in an urban environment case study from the Mexico City Metropolitan Area, Acc. Chem. Res., 2005, 5, 3033–3043 CAS.
- J. Bhandari, S. China, K. K. Chandrakar, G. Kinney, W. Cantrell, R. A. Shaw, L. R. Mazzoleni, G. Girotto, N. Sharma, K. Gorkowski, S. Gilardoni, S. Decesari, M. C. Facchini, N. Zanca, G. Pavese, F. Esposito, M. K. Dubey, A. C. Aiken, R. K. Chakrabarty, H. Moosmuller, T. B. Onasch, R. A. Zaveri, B. V. Scarnato, P. Fialho and C. Mazzoleni, Extensive soot compaction by cloud processing from laboratory and field observations, Sci. Rep., 2019, 9, 11824 CrossRef PubMed.
- O. Möhler, C. Linke, H. Saathoff, M. Schnaiter, R. Wagner, A. Mangold, M. Krämer and U. Schurath, Ice nucleation on flame soot aerosol of different organic carbon content, Meteorol. Z., 2005, 14, 477–484 CrossRef.
- I. Crawford, O. Möhler, M. Schnaiter, H. Saathoff, D. Liu, G. McMeeking, C. Linke, M. Flynn, K. N. Bower, P. J. Connolly, M. W. Gallagher and H. Coe, Studies of propane flame soot acting as heterogeneous ice nuclei in conjunction with single particle soot photometer measurements, Atmos. Chem. Phys., 2011, 11, 9549–9561 CrossRef CAS.
- C. Zhang, Y. Zhang, M. J. Wolf, L. Nichman, C. Shen, T. B. Onasch, L. Chen and D. J. Cziczo, The effects of morphology, mobility size, and secondary organic aerosol (SOA) material coating on the ice nucleation activity of black carbon in the cirrus regime, Atmos. Chem. Phys., 2020, 20, 13957–13984 CrossRef CAS.
- B. Friedman, G. Kulkarni, J. Beránek, A. Zelenyuk, J. A. Thornton and D. J. Cziczo, Ice nucleation and droplet formation by bare and coated soot particles, J. Geophys. Res., 2011, 116, D17203 CrossRef.
- Z. A. Kanji, A. Welti, J. C. Corbin and A. A. Mensah, Black Carbon Particles Do Not Matter for Immersion Mode Ice Nucleation, Geophys. Res. Lett., 2020, 46, e2019GL086764 Search PubMed.
- B. Demirdjian, D. Ferry, J. Suzanne, O. B. Popovicheva, N. M. Persiantseva, A. V. Kamaev, N. K. Shonija and N. A. Zubareva, Freezing of water adsorbed on hydrophobic and activated soot particles, Chem. Phys. Lett., 2009, 480, 247–252 CrossRef CAS.
- B. Gorbunov, A. Baklanov, N. Kakutkina, H. L. Windsor and R. Toumi, Ice nucleation on soot particles, J. Aerosol Sci., 2001, 32, 199–215 CrossRef CAS.
- E. D. Kireeva, O. B. Popovicheva, N. M. Persiantseva, T. D. Khokhlova and N. K. Shonija, Effect of black carbon particles on the efficiency of water droplet freezing, Colloid J., 2009, 71, 353–359 CrossRef CAS.
- K. A. Koehler, P. J. DeMott, S. M. Kreidenweis, O. B. Popovicheva, M. D. Petters, C. M. Carrico, E. D. Kireeva, T. D. Khokhlova and N. K. Shonija, Cloud condensation nuclei and ice nucleation activity of hydrophobic and hydrophilic soot particles, Phys. Chem. Chem. Phys., 2009, 11, 7759 RSC.
- T. Hausler, P. Gebhardt, D. Iglesias, C. Rameshan, S. Marchesan, D. Eder and H. Grothe, Ice nucleation activity of graphene and graphene oxides, J. Phys. Chem. C, 2018, 122, 8182–8190 CrossRef PubMed.
- L. Lupi and V. Molinero, Does hydrophilicity of carbon particles improve their ice nucleation ability?, J. Phys. Chem. A, 2014, 118, 7330–7337 CrossRef CAS PubMed.
- L. Lupi, A. Hudait and V. Molinero, Heterogeneous nucleation of ice on carbon surfaces, J. Am. Chem. Soc., 2014, 136, 3156–3164 CrossRef CAS PubMed.
- T. F. Whale, M. Rosillo-Lopez, B. J. Murray and C. G. Salzmann, Ice nucleation properties of oxidized carbon nanomaterials, J. Phys. Chem. Lett., 2015, 6, 3012–3016 CrossRef CAS PubMed.
- Y. Bi, R. Cabriolu and T. Li, Heterogeneous Ice Nucleation Controlled by the Coupling of Surface Crystallinity and Surface Hydrophilicity, J. Phys. Chem. C, 2016, 120, 1507–1514 CrossRef CAS.
- C. I. Biggs, C. Packer, S. Hindmarsh, M. Walker, N. R. Wilson, J. P. Rourke and M. I. Gibson, Impact of sequential surface-modification of graphene oxide on ice nucleation, Phys. Chem. Chem. Phys., 2017, 19, 21929–21932 RSC.
- P. Cabrera-Sanfelix and G. R. Darling, Dissociative adsorption of water at vacancy defects in graphite, J. Phys. Chem. C, 2007, 111, 18258–18263 CrossRef CAS.
- Z. A. Kanji and J. P. D. Abbatt, The University of Toronto Continuous Flow Diffusion Chamber (UT-CFDC): A Simple Design for Ice Nucleation Studies, Aerosol Sci. Technol., 2009, 43, 730–738 CrossRef CAS.
- L. Lacher, U. Lohmann, Y. Boose, A. Zipori, E. Herrmann, N. Bukowiecki, M. Steinbacher and Z. A. Kanji, The horizontal ice nucleation chamber (HINC): INP measurements at conditions relevant for mixed-phase clouds at the high altitude research station Jungfraujoch, Atmos. Chem. Phys., 2017, 17, 15199–15224 CrossRef CAS.
- D. M. Murphy and T. Koop, Review of the vapour pressures of ice and supercooled water for atmospheric applications, Q. J. R. Meteorol. Soc., 2005, 131, 1539–1565 CrossRef.
- T. Koop, B. Luo, A. Tsias and T. Peter, Water activity as the determinant for homogeneous ice nucleation in aqueous solutions, Nature, 2000, 406, 4 CrossRef PubMed.
- N. M. Persiantseva, O. B. Popovicheva and N. K. Shonija, Wetting and hydration of insoluble soot particles in the upper troposphere, J. Environ. Monit., 2004, 6, 939–945 RSC.
- O. B. Popovitcheva, N. M. Persiantseva, M. E. Trukhin, G. B. Rulev, N. K. Shonija, Y. Ya. Buriko, A. M. Starik, B. Demirdjian, D. Ferry and J. Suzanne, Experimental characterization of aircraft combustor soot: Microstructure, surface area, porosity and water adsorption, Phys. Chem. Chem. Phys., 2000, 2, 4421–4426 RSC.
- A. Wheeler, Reaction rates and selectivity in catalyst pores, Reinhold publishing corp., New York, NY, 1955 Search PubMed.
- E. I. Shkol’nikov and E. V. Sidorova, Analytical equation for calculating the pore size distribution from adsorption data, Dokl. Phys. Chem., 2007, 412, 4–7 CrossRef.
- M. M. Dubbin, Water vapor adsorption and the microporous structures of carbonaceous adsorbents, Carbon, 1980, 18, 355–364 CrossRef.
- J. Bhandari, S. China, T. Onasch, L. Wolff, A. Lambe, P. Davidovits, E. Cross, A. Ahern, J. Olfert, M. Dubey and C. Mazzoleni, Effect of thermodenuding on the structure of nascent flame soot aggregates, Atmos, 2017, 8, 166 CrossRef.
- M. N. Ess, D. Ferry, E. D. Kireeva, R. Niessner, F. X. Ouf and N. P. Ivleva, In situ Raman microspectroscopic analysis of soot samples with different organic carbon content: Structural changes during heating, Carbon, 2016, 105, 572–585 CrossRef CAS.
- G. Vali, P. J. DeMott, O. Möhler and T. F. Whale, Technical note: A proposal for ice nucleation terminology, Atmos. Chem. Phys., 2015, 15, 10263–10270 CrossRef CAS.
- L. Ickes, A. Welti, C. Hoose and U. Lohmann, Classical nucleation theory of homogeneous freezing of water: thermodynamic and kinetic parameters, Phys. Chem. Chem. Phys., 2015, 17, 5514–5537 RSC.
- N. H. Fletcher, The physics of rainclouds, Cambridge, University Press, 1962 Search PubMed.
- K. C. Young, Microphysical processes in clouds, Oxford University Press, 1993 Search PubMed.
- P. G. Debenedetti, Metastable liquids: concepts and principles, Princeton University Press, 1996 Search PubMed.
- A. Kiselev, F. Bachmann, P. Pedevilla, S. J. Cox, A. Michaelides, D. Gerthsen and T. Leisner, Active sites in heterogeneous ice nucleation-the example of K-rich feldspars, Science, 2017, 355, 367–371 CrossRef CAS PubMed.
- O. Popovicheva, N. M. Persiantseva, N. K. Shonija, P. DeMott, K. Koehler, M. Petters, S. Kreidenweis, V. Tishkova, B. Demirdjian and J. Suzanne, Water interaction with hydrophobic and hydrophilic soot particles, Phys. Chem. Chem. Phys., 2008, 10, 2332–2344 RSC.
- B. Zobrist, C. Marcolli, D. A. Pedernera and T. Koop, Do atmospheric aerosols form glasses?, Atmos. Chem. Phys., 2008, 8, 5221–5244 CrossRef CAS.
- T. Berkemeier, M. Shiraiwa, U. Pöschl and T. Koop, Competition between water uptake and ice nucleation by glassy organic aerosol particles, Atmos. Chem. Phys., 2014, 14, 12513–12531 CrossRef.
- Y. Zhang, L. Nichman, P. Spencer, J. I. Jung, A. Lee, B. K. Heffernan, A. Gold, Z. Zhang, Y. Chen, M. R. Canagaratna, J. T. Jayne, D. R. Worsnop, T. B. Onasch, J. D. Surratt, D. Chandler, P. Davidovits and C. E. Kolb, The cooling rate- and volatility-dependent glass-forming properties of organic aerosols measured by broadband dielectric spectroscopy, Environ. Sci. Technol., 2019, 53, 12366–12378 CrossRef CAS PubMed.
- K. S. Docherty, E. W. Corse, M. Jaoui, J. H. Offenberg, T. E. Kleindienst, J. D. Krug, T. P. Riedel and M. Lewandowski, Trends in the oxidation and relative volatility of chamber-generated secondary organic aerosol, Aerosol Sci. Technol., 2018, 52, 992–1004 CrossRef CAS PubMed.
- B. Zobrist, V. Soonsin, B. P. Luo, U. K. Krieger, C. Marcolli, T. Peter and T. Koop, Ultra-slow water diffusion in aqueous sucrose glasses, Phys. Chem. Chem. Phys., 2011, 13, 3514–3526 RSC.
- M. Shiraiwa, M. Ammann, T. Koop and U. Poschl, Gas uptake and chemical aging of semisolid organic aerosol particles, Proc. Natl. Acad. Sci., 2011, 108, 11003–11008 CrossRef CAS PubMed.
- H. C. Price, J. Mattsson, Y. Zhang, A. K. Bertram, J. F. Davies, J. W. Grayson, S. T. Martin, D. O'Sullivan, J. P. Reid, A. M. J. Rickards and B. J. Murray, Water diffusion in atmospherically relevant alpha-pinene secondary organic material, Chem. Sci., 2015, 6, 4876–4883 RSC.
- B. J. Murray, T. W. Wilson, S. Dobbie, Z. Cui, S. M. R. K. Al-Jumur, O. Möhler, M. Schnaiter, R. Wagner, S. Benz, M. Niemand, H. Saathoff, V. Ebert, S. Wagner and B. Kärcher, Heterogeneous nucleation of ice particles on glassy aerosols under cirrus conditions, Nat. Geosci., 2010, 3, 233–237 CrossRef CAS.
- B. Zobrist, T. Koop, B. P. Luo, C. Marcolli and T. Peter, Heterogeneous ice nucleation rate coefficient of water droplets coated by a nonadecanol monolayer, J. Phys. Chem. C, 2007, 111, 2149–2155 CrossRef CAS.
- B. J. Murray, S. L. Broadley, T. W. Wilson, S. J. Bull, R. H. Wills, H. K. Christenson and E. J. Murray, Kinetics of the homogeneous freezing of water, Phys. Chem. Chem. Phys., 2010, 12, 10380–10387 RSC.
- C. Marcolli, Ice nucleation triggered by negative pressure, Sci. Rep., 2017, 7, 16634 CrossRef PubMed.
- C. Marcolli, Technical note: Fundamental aspects of ice nucleation via pore condensation and freezing including Laplace pressure and growth into macroscopic ice, Atmos. Chem. Phys., 2020, 20, 3209–3230 CrossRef CAS.
- N. H. Fletcher, Active sites and ice crystal nucleation, J. Atmos. Sci., 1969, 26, 1266–1271 CrossRef CAS.
- Z. A. Kanji, L. A. Ladino, H. Wex, Y. Boose, M. Burkert-Kohn, D. J. Cziczo and M. Krämer, Chapter 1 Overview of ice nucleating particles, in Meteorological Monographs, 2017, vol. 58, ch. 1.1, pp. 1.1–1.33 Search PubMed.
- B. R. Stanmore, J. F. Brilhac and P. Gilot, The oxidation of soot: a review of experiments, mechanisms and models, Carbon, 2001, 39, 2247–2268 CrossRef CAS.
- H. Richter and J. Howard, Formation of polycyclic aromatic hydrocarbons and their growth to soot—a review of chemical reaction pathways, Prog. Energy Combust. Sci., 2000, 26, 565–608 CrossRef CAS.
- H. A. Dandajeh, N. Ladommatos, P. Hellier and A. Eveleigh, Effects of unsaturation of C2 and C3 hydrocarbons on the formation of PAHs and on the toxicity of soot particles, Fuel, 2017, 194, 306–320 CrossRef CAS.
- D. Ferry, J. Suzanne, S. Nitsche, O. B. Popovitcheva and N. K. Shonija, Water adsorption and dynamics on kerosene soot under atmospheric conditions, J. Geophys. Res.: Atmos., 2002, 107, AAC 22-21–AAC 22-10 CrossRef.
- O. B. Popovicheva, N. M. Persiantseva, B. V. Kuznetsov, T. A. Rakhmanova, N. K. Shonija, J. Suzanne and D. Ferry, Microstructure and Water Adsorbability of Aircraft Combustor Soots and Kerosene Flame, J. Phys. Chem. A, 2003, 107, 10046–10054 CrossRef CAS.
- R. H. Moore, L. D. Ziemba, D. Dutcher, A. J. Beyersdorf, K. Chan, S. Crumeyrolle, T. M. Raymond, K. L. Thornhill, E. L. Winstead and B. E. Anderson, Mapping the operation of the miniature combustion aerosol standard (mini-CAST) soot generator, Aerosol Sci. Technol., 2014, 48, 467–479 CrossRef CAS.
- L. Mueller, G. Jakobi, J. Orasche, E. Karg, M. Sklorz, G. Abbaszade, B. Weggler, L. Jing, J. Schnelle-Kreis and R. Zimmermann, Online determination of polycyclic aromatic hydrocarbon formation from a flame soot generator, Anal. Bioanal. Chem., 2015, 407, 5911–5922 CrossRef CAS PubMed.
- F. Portet-Koltalo and N. Machour, Analytical methodologies for the control of particle-phase polycyclic aromatic compounds from diesel engine exhaust, InTech, Rijeka, 2013 Search PubMed.
- M. Frenklach, reaction mechanism of soot formation in flames, Phys. Chem. Chem. Phys., 2002, 4, 10 RSC.
- C. Marchal, J.-L. Delfau, C. Vovelle, G. Moréac, C. Mounaïm-Rousselle and F. Mauss, Modelling of aromatics and soot formation from large fuel molecules, Proc. Combust. Inst., 2009, 32, 753–759 CrossRef CAS.
- J. C. Chow, J. G. Watson, L. W. A. Chen, W. P. Arnott, H. Moosmüller and K. Fung, Equivalence of elemental carbon by thermal/optical reflectance and transmittance with different temperature protocols, Environ. Sci. Technol., 2004, 38, 4414–4422 CrossRef CAS PubMed.
- R. J. Countess, Interlaboratory analyses of carbonaceous aerosol samples, Aerosol Sci. Technol., 1990, 12, 114–121 CrossRef.
- O. B. Popovicheva, N. M. Persiantseva, V. Tishkova, N. K. Shonija and N. A. Zubareva, Quantification of water uptake by soot particles, Environ. Res. Lett., 2008, 3, 025009 CrossRef.
- H. Bladt, J. Schmid, E. D. Kireeva, O. B. Popovicheva, N. M. Perseantseva, M. A. Timofeev, K. Heister, J. Uihlein, N. P. Ivleva and R. Niessner, Impact of Fe Content in Laboratory-Produced Soot Aerosol on its Composition, Structure, and Thermo-Chemical Properties, Aerosol Sci. Technol., 2012, 46, 1337–1348 CrossRef CAS.
- S. Takahama, R. E. Schwartz, L. M. Russell, A. M. Macdonald, S. Sharma and W. R. Leaitch, Organic functional groups in aerosol particles from burning and non-burning forest emissions at a high-elevation mountain site, Atmos. Chem. Phys., 2011, 11, 6367–6386 CrossRef CAS.
- J. Coates, Interpretation of Infrared Spectra, A Practical Approach, in Encyclopedia of Analytical Chemistry, John Wiley & Sons, Ltd, 2006 Search PubMed.
- S. P. Davis, M. C. Abrams and J. W. Brault, Fourier transform spectrometry, Academic Press, San Diego, 2001 Search PubMed.
- S. Albert, K. K. Albert and M. Quack, High resolution Fourier transform infrared spectroscopy, in Handbook of high-resolution spectroscopy, eds. M. Quack and F. Merkt, Wiley, Hoboken, N.J., 2011, vol. 2, pp. 965–1019 Search PubMed.
- M. Mermoux, Y. Chabre and A. Rousseau, FTIR and C-13 NMR study of graphite oxide, Carbon, 1991, 29, 469–474 CrossRef CAS.
- D. Lin-Vien, N. B. Colthup, W. G. Fateley and J. G. Grasselli, The handbook of infrared and raman characteristic frequencies of organic molecules, Academic Press, San Diego, 1991 Search PubMed.
- V. Tucureanu, A. Matei and A. M. Avram, FTIR Spectroscopy for Carbon Family Study, Crit. Rev. Anal. Chem., 2016, 46, 502–520 CrossRef CAS PubMed.
- Z. Çiplak, N. Yildiz and A. Çalimli, Investigation of graphene/Ag nanocomposites synthesis parameters for two different synthesis methods, Fullerenes, Nanotubes, Carbon Nanostruct., 2014, 23, 361–370 CrossRef.
- K. Batra, S. Nayak, S. K. Behura and O. Jani, Optimizing performance parameters of chemically-derived graphene/p-Si heterojunction solar cell, J. Nanosci. Nanotechnol., 2015, 15, 4877–4882 CrossRef CAS PubMed.
- X. B. Yan, T. Xu, S. R. Yang, H. W. Liu and Q. J. Xue, Characterization of hydrogenated diamond-like carbon films electrochemically deposited on a silicon substrate, J. Phys. D: Appl. Phys., 2004, 37, 2416–2424 CrossRef CAS.
- N. B. A. Mansor, J. P. Tessonnier, A. Rinaldi, S. Reiche and M. G. Kutty, Chemically modified multi-walled carbon nanotubes (MWCNTs) with anchored acidic groups, Sains Malays., 2012, 41, 603–609 Search PubMed.
- P. Dubey, D. Muthukumaran, S. Dash, R. Mukhopadhyay and S. Sarkar, Synthesis and characterization of water-soluble carbon nanotubes from mustard soot, Pramana – J. Phys., 2005, 65, 681–697 CrossRef CAS.
- V. A. Chhabra, A. Deep, R. Kaur and R. Kumar, Functionalization of graphene using carboxylation process, Int. j. adv. sci. eng. technol., 2012, 4, 13–19 Search PubMed.
- J. Robertson, Diamond-like amorphous carbon, Mater. Sci. Eng., R, 2002, 37, 129–281 CrossRef.
- L. Marcinauskas, A. Grigonis, V. Valincius and P. Valatkevicius, Surface and structural analysis of carbon coatings produced by plasma jet cvd, Mater. Sci., 2007, 13, 269–272 Search PubMed.
- L. Shahriary and A. A. Athawale, Graphene oxide synthesized by using modified hummers approach, Int. J. Renew. Energy Environ. Eng., 2014, 2, 58–63 Search PubMed.
- A. C. Obreja, D. Cristea, R. Gavrila, V. Schiopu, A. Dinescu, M. Danila and F. Comanescu, Isocyanate functionalized graphene/P3HT based nanocomposites, Appl. Surf. Sci., 2013, 276, 458–467 CrossRef CAS.
- S. Bykkam, V. K. Rao, S. C. Chakra and T. Thunugunta, Synthesis and characterization of graphene oxide and its antimicrobial activity against Klebseilla and Staphylococus, Int. j. adv. biotechnol. res., 2013, 4, 142–146 Search PubMed.
- O. Popovicheva, M. Kistler, E. Kireeva, N. Persiantseva, M. Timofeev, V. Kopeikin and A. Kasper-Giebl, Physicochemical characterization of smoke aerosol during large-scale wildfires: Extreme event of August 2010 in Moscow, Atmos. Environ., 2014, 96, 405–414 CrossRef CAS.
- M. Ibrahim, A. Nada and D. E. Kamal, Density functional theory and FTIR spectroscopic study of carboxyl group, Indian J. Pure Appl. Phys., 2005, 43, 911–917 CAS.
- A. B. D. Nandiyanto, R. Oktiani and R. Ragadhita, How to read and interpret FTIR spectroscope of organic material, Indones. J. Sci. Technol., 2019, 4, 79–118 Search PubMed.
- D. W. Seo, W. J. Yoon, S. J. Park, M. C. Jo and J. S. Kim, The preparation of multi-walled CNT–PMMA nanocomposite, Carbon Sci., 2006, 7, 266–270 Search PubMed.
- P. Peets, K. Kaupmees, S. Vahur and I. Leito, Reflectance FT-IR spectroscopy as a viable option for textile fiber identification, Heritage Sci., 2019, 7, 93 CrossRef.
- T. J. Johnson, J. S. Olfert, J. P. R. Symonds, M. Johnson, T. Rindlisbacher, J. J. Swanson, A. M. Boies, K. Thomson, G. Smallwood, D. Walters, Y. Sevcenco, A. Crayford, R. Dastanpour, S. N. Rogak, L. Durdina, Y. K. Bahk, B. Brem and J. Wang, Effective density and mass-mobility exponent of aircraft turbine particulate matter, J. Propul. Power, 2015, 31, 573–582 CrossRef.
- G. A. Joyce, W. M. Henry and R. W. Magee, Advances in structure measurements of carbon black, Rubber World, 2009, 240, 27–35 CAS.
- Y. J. Shin, Y. Wang, H. Huang, G. Kalon, A. T. Wee, Z. Shen, C. S. Bhatia and H. Yang, Surface-energy engineering of graphene, Langmuir, 2010, 26, 3798–3802 CrossRef CAS PubMed.
- Y. Wei, Q. Zhang and J. E. Thompson, The Wetting Behavior of Fresh and Aged Soot Studied through Contact Angle Measurements, Atmos. Clim. Sci., 2017, 07, 11–22 CAS.
- H. R. Pruppacher and J. D. Klett, Microphysics of clouds and precipitation, Kluwer, Dordrecht, 1997 Search PubMed.
- U. Lohmann, F. Lüönd and F. Mahrt, An introduction to clouds from the microscale to climate, Cambridge University Press, 2016 Search PubMed.
- S. Decesari, M. C. Facchini, E. Matta, F. Lettini, M. Mircea, S. Fuzzi, E. Tagliavini and J.-P. Putaud, Chemical features and seasonal variation of fine aerosol water-soluble organic compound in the PoVally Italy, Atmos. Environ., 2001, 35, 3691–3699 CrossRef CAS.
- K. S. W. Sing, D. H. Everett, R. A. W. Haul, L. Moscou, R. A. Pierotti, J. Rouquerol and T. Siemieniewska, Reporting physisorption data for gas/solid systems with special reference to the determination of surface area and porosity, Pure Appl. Chem., 1985, 57, 603–619 CrossRef CAS.
- M. N. Ess and K. Vasilatou, Characterization of a new miniCAST with diffusion flame and premixed flame options: Generation of particles with high ec content in the size range 30 nm to 200 nm, Aerosol Sci. Technol., 2018, 53, 29–44 CrossRef.
- Y. Liu, C. Liu, J. Ma, Q. Ma and H. He, Structural and hygroscopic changes of soot during heterogeneous reaction with O(3), Phys. Chem. Chem. Phys., 2010, 12, 10896–10903 RSC.
- V. Zelenay, M. E. Monge, B. D'Anna, C. George, S. A. Styler, T. Huthwelker and M. Ammann, Increased steady state uptake of ozone on soot due to UV-vis radiation, J. Geophys. Res., 2011, 116, D1130 CrossRef.
- S. D. Brooks, K. Suter and L. Olivarez, Effects of chemical aging on the ice nucleation activity of soot and polycyclic aromatic hydrocarbon aerosols, J. Phys. Chem. A, 2014, 118, 10036–10047 CrossRef CAS PubMed.
- C. M. Sorensen, The mobility of fractal aggregates: A review, Aerosol Sci. Technol., 2011, 45, 765–779 CrossRef CAS.
Footnote |
| † Electronic supplementary information (ESI) available. See https://doi.org/10.1039/d2em00158f |
| This journal is © The Royal Society of Chemistry 2022 |