
Characterizing photochemical ageing processes of microplastic materials using multivariate analysis of infrared spectra†
Misha
Zvekic
 ab,
Larissa C.
Richards
ab,
Christine C.
Tong
a and
Erik T.
Krogh
*ab
ab,
Larissa C.
Richards
ab,
Christine C.
Tong
a and
Erik T.
Krogh
*ab
aApplied Environmental Research Laboratories (AERL), Department of Chemistry, Vancouver Island University, 900 Fifth Street, Nanaimo, British Columbia, Canada. E-mail: Erik.Krogh@viu.ca
bDepartment of Chemistry, University of Victoria, PO Box 1700, Stn CSC, Victoria, British Columbia, Canada
First published on 8th December 2021
Abstract
Microplastics in the environment are an emerging concern due to impacts on human and environmental health. In addition to direct effects on biota, microplastics influence the fate and distribution of trace organic contaminants through sorption and transport. Environmental weathering may influence the rate and extent of chemical sorption. Changes in the surface characteristics of four common plastics including low-density polyethylene (LDPE), high-density polyethylene (HDPE), polypropylene (PP), and polystyrene (PS) were followed under the influence of both artificial light (UV-B) and natural sunlight for up to six months. Attenuated total reflectance Fourier transform infrared (ATR-FTIR) spectra were collected at regular intervals. Principal component analysis (PCA) of the full dataset of UV-B weathered samples (n >500 spectra) simultaneously discriminated plastic type and extent of photochemical weathering. The magnitude of PCA scores correlated with exposure time and the loadings were consistent with surface chemistry changes including photooxidation. Projecting sunlight and UV-C exposed samples onto this PCA model demonstrated that similar chemical changes occurred, albeit at different rates. The results were compared to the carbonyl index (CI) with similar weathering trends indicating PP weathered at a faster initial rate than LDPE and HDPE. We propose that a multivariate approach is more widely applicable than CI as illustrated by PS, which lacked a stable reference peak. Kinetic analysis of the time series indicated that outdoor weathering occurred 5–12 times slower than the artificial exposure used here, depending on the plastic and the light source employed. The results provide unique insights into weathering processes and the photochemical age of naturally weathered plastics.
Environmental significancePhotochemical weathering is known to change both the chemical and physical properties of microplastics in the environment. Surface characteristics of plastics can be monitored using attenuated total reflectance Fourier transform infrared spectroscopy (ATR-FTIR). Changes induced by natural sunlight are slow, leading to the widespread use of accelerated artificial weathering treatments. Four types of plastics were weathered under natural and artificial conditions for up to six months and monitored by ATR-FTIR. A principal component analysis (PCA) model, built using UV-B weathered plastics, simultaneously discriminated the different plastics and the extent of weathering, and was used to characterize the rates of photodegradation. This work provides a standardized approach for the comparison of different light exposure treatments and is applicable to different plastics. |
1. Introduction
Microplastics, including small fragments (1 μm to 5 mm) and micron-sized fibres, are pollutants which have become ubiquitous in the environment.1,2 They have been reported in remote aquatic,3 atmospheric,4 and terrestrial environments,1,5 including deep ocean sediments6 and in a range of biota.5,7 In addition to direct physical impacts on organisms, there is a growing concern with more subtle effects related to cellular uptake and metabolism, as well as broader ecosystem impacts related to the fate and transport of surface sorbed contaminants.7–10 Once in the environment, plastics are known to undergo a variety of weathering processes which result in changes to their physical structure and chemical makeup.10,11 Environmental weathering and biofouling may impact bioavailability and palatability of microplastics12 and have been found to impact the sorption of contaminants.13,14 The ability to compare plastics that have been weathered under controlled conditions to environmental samples contributes to our understanding of the fate and potential impacts of real-world macro- and microplastics.15A common abiotic weathering process is photooxidation catalyzed by the combination of high-energy ultraviolet (UV) photons in sunlight and the presence of oxygen.16 The absorption of light by the plastic or plastic impurities can lead to the formation of radicals that react with oxygen species or the polymer itself.17–19 Photooxidative weathering is thought to be restricted to the surface layer (ca. 100 μm) due to limited mobility of radicals, penetration of light, and presence of oxygen.20,21 In general, photooxidative processes increase the crystallinity of the plastic via radical cross-linkage reactions and increase its hydrophilic character by introducing polar functional groups, such as hydroxyl and carbonyl groups, to the surface layer.18,19 These changes weaken the integrity of the plastic leading to the production of smaller, secondary microplastics22 and are expected to alter chemical sorption behaviour.13,23
Attenuated total reflectance Fourier transform infrared (ATR-FTIR) spectroscopy has been used to identify the composition of plastics24 and to monitor for the presence of functional groups associated with weathering.25,26 A common metric for photochemical weathering is the carbonyl index (CI), which measures the growth in the carbonyl (C![[double bond, length as m-dash]](https://www.rsc.org/images/entities/char_e001.gif) O) absorption relative to a stable reference absorbance band.20,27 Similarly, the hydroxyl index (HI) has been employed to monitor the growth of the hydroxyl (O–H) absorption band.16,28,29 These metrics use specific IR regions and exclude other potentially relevant spectral data.16,27
O) absorption relative to a stable reference absorbance band.20,27 Similarly, the hydroxyl index (HI) has been employed to monitor the growth of the hydroxyl (O–H) absorption band.16,28,29 These metrics use specific IR regions and exclude other potentially relevant spectral data.16,27
Principal component analysis (PCA) is a chemometric approach that reduces the dimensionality of a multivariate dataset while capturing the variability among samples.30,31 PCA has been widely used for sample discrimination across many fields, and to study degradation kinetics in food sciences.32,33 It has been applied to IR spectral data to create identification tools for real-world plastics that are more robust than library matching,24,34–36 to discriminate between pristine and aged plastics,15 and to distinguish between weathering treatments, such as thermal or photochemical aging.15 PCA has also been applied to variables such as CI, HI, colour, density, tensile strength, and melting temperature to characterize weathering.28,29,37–40
Here, we present a systematic time series of photochemical weathering under artificial and natural conditions of low-density polyethylene (LDPE), high-density polyethylene (HDPE), polypropylene (PP), and polystyrene (PS). ATR-FTIR spectroscopy between 550 and 4000 cm−1 was employed to monitor changes in surface characteristics over six months of lab-based exposure to UV-B treatment and to build a PCA model. The principal component (PC) scores for samples weathered under other conditions, including several months in natural sunlight and several days of UV-C exposure (LDPE only), were determined by projecting the samples onto the PCA model.
2. Materials and methods
2.1 Reagents and materials
Four plastic types were purchased in pellet form from Sigma-Aldrich (Saint Louis, MO, USA): low-density polyethylene, high-density polyethylene, polystyrene, and isotactic polypropylene. Manufacturer-provided properties are listed in the electronic ESI† (Table S1). Prior to spectral analysis and aging, plastic pellets were melted into flat disks (0.22–0.28 cm thick) in an aluminum weighing boat placed on a hot plate, rinsed with methanol, and allowed to air dry. The initial melting step was undertaken to provide a flat surface for exposure to the weathering treatments, to eliminate artefacts in ATR-FTIR spectra caused by irregular surface features, and to avoid distorting the pellets during measurement. Thermal oxidation was reduced by minimizing the heating time and excluding samples that showed evidence of degradation in their initial IR spectra.19 Plastics were stored at room temperature in the dark and shielded from light sources until weathering.2.2 Weathering
To investigate weathering when plastics were exposed to higher energy UV (UV-C treatment), LDPE was placed on an inverted watch glass set on top of a 1000 mL beaker (15.5 cm above base) in an air cooled Rayonet RPR-100 Photochemical Reactor (Southern New England Ultraviolet Company, Branford, CT, USA). The reactor was equipped with eight evenly spaced 35 W low pressure mercury lamps (RPR-2537 Å, Southern New England Ultraviolet Company, Branford, CT, USA) which emitted light at 254 nm. These samples were exposed at temperatures ranging from 26–29 °C for up to nine days.
For natural outdoor weathering experiments, the plastics were fixed to a flat surface (Fig. S3†) and left exposed to natural sunlight in Nanaimo, Vancouver Island, British Columbia, Canada (49 °N, −124 °W) over the period from April 29th to September 1st, 2019 (four months). The cumulative solar irradiation was roughly linear over the course of the outdoor weathering period (Fig. S2†). Prior to spectral analysis, the samples were gently rinsed with deionized water to remove debris, blotted with Kimwipes, and allowed to air dry. No biofilm was observed, and the rinsing step was sufficient to remove debris that may have settled on the surfaces. We did not detect extraneous absorptions in the spectra after rinsing naturally weathered samples.
For the UV-B treatment, spectra were collected every 1–5 (average = 3) days for 70 days for LDPE, PS, and PP and for 34 days for HDPE, after which the interval time between measurements was increased to 2–8 (average = 5) days until around 180 days (6 months) of data was collected. Spectra for the natural weathering treatment were collected once a month, for a total of 120 days. The UV-C weathering treatment for LDPE was measured about once a day (average = ∼27 hours) for a total of 228 hours of weathering time.
O) peak that appears and grows over the course of weathering and the area of a reference peak that remains unchanged over time.20,27 The peak area tool in the OMNIC 9.2.86 software was used to obtain the areas used to calculate the CI for LDPE, HDPE, and PP spectra shown in Fig. 1. The area in the 1505–1885 cm−1 region of the ∼1717 cm−1 carbonyl peak was divided by the area of the 1472 cm−1 reference peak (1465–1497 cm−1) for PEs and the 2721 cm−1 reference peak (2700–2750 cm−1) for PP (eqn (1) and (2)).16,38,41,42| CIPE = Abs(1505–1855 cm−1)/Abs(1465–1497 cm−1) | (1) |
| CIPP = Abs(1505–1855 cm−1)/Abs(2700–2750 cm−1) | (2) |
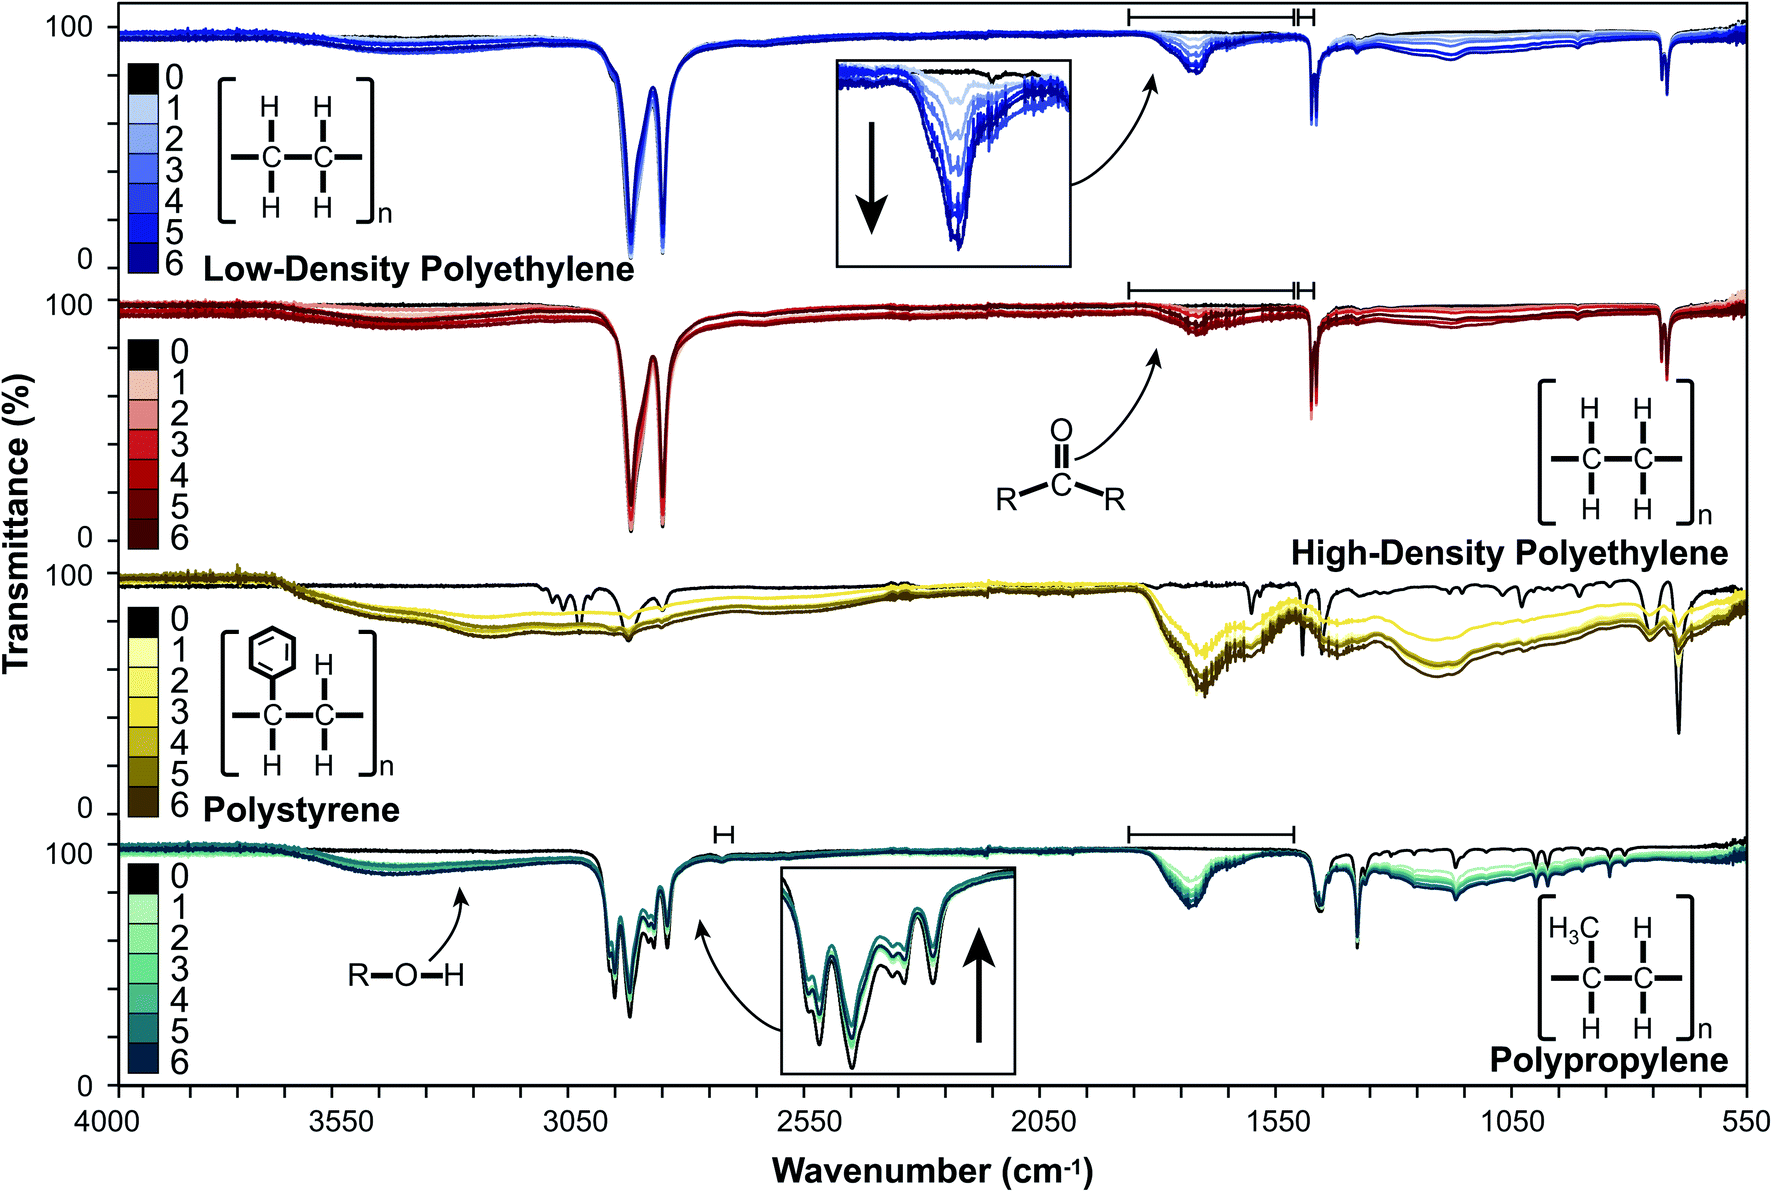 | ||
| Fig. 1 Overlay of IR spectra of four different plastics over the course of six months of photochemical weathering under UV-B light. Black spectra were measured prior to weathering while deepening colour gradations represent spectra having undergone one to six months of weathering (as indicated in the legend) for a total of seven overlaid IR spectra. Areas used to calculate the carbonyl indices for low- and high-density polyethylene and polypropylene are indicated with horizontal lines. | ||
3. Results and discussion
3.1 ATR-FTIR spectra of weathered plastics
Changes in surface characteristics of LDPE, HDPE, PP, and PS induced by UV-B exposure were monitored by ATR-FTIR spectroscopy in a controlled laboratory environment. An overlay of the spectral changes over six, monthly intervals is presented in Fig. 1.For LDPE and HDPE, we observed the appearance and continued growth of broad absorption bands in regions corresponding to increases in the hydroxyl (3125–3660 cm−1) and carbonyl (1717 cm−1) content. There was also a diffuse increase in absorption in the 750–1415 cm−1 region, and slight decreases or no change in the peak absorptions corresponding to characteristic C–C and C–H bonds (2914, 2847, 1473, 1462, 730, 719 cm−1). PP behaved similarly, with an increase in the absorptions associated with hydroxyl (3030–3675 cm−1) and carbonyl (1733 cm−1) groups. We also observed an increase in absorption between 780 and 1350 cm−1 and slight decreases between 2800 and 3000 cm−1, which is associated with C–H stretches, and at 1453 and 1376 cm−1 which are associated with C–H bends.24 The weak absorption at 2721 cm−1 remained unchanged. For PS, we observed the appearance of broad absorptions in the hydroxyl (2380–3670 cm−1) and carbonyl (1505–1830 cm−1) regions. Additionally, we observed an increased absorption in the 780–1490 cm−1 region in weathered PS, which obscured the sharp peaks observed in the fingerprint region of pristine PS.44 These results are consistent with photooxidation processes reported by others in which the production of carbonyl and hydroxyl moieties16–18,44 and changes in C–C and C–H absorptions16,45 have been reported. The broad ATR-FTIR absorptions observed for PS resulted in there being no stable reference peak over the course of weathering. This precluded the analysis of the rate and extent of weathering using indices (e.g., CI or HI) for PS and potentially for other extensively weathered plastics.
3.2 Building a PCA model using UV-B weathered plastics
PCA presents a useful alternative to library searching for identifying types of plastic based on spectral data, while also capturing differences due to weathering. This dimensional reduction technique calculates new variables, called principal components, that are orthogonal to one another and linear combinations of the original variables. PC 1 lies in the direction of most variance in the data, with each subsequent PC accounting for less variance. A PCA scores plot is made by plotting samples on the dominant PCs, revealing underlying patterns due to sample differences. A PCA loadings plot identifies which variables (i.e., wavenumbers in ATR-FTIR spectral data) contribute to a PC.A PCA model was constructed using over 500 pre-processed, full scan IR spectra for LDPE, HDPE, PS, and PP collected during six months of UV-B weathering. PC 1, 2, and 3 described 75.2, 13.6, and 7.4% of the variance, respectively, as shown in the scree plot in Fig. S4.† Each subsequent PC accounted for less than 1.5% of the remaining variance. A two-component model was chosen for further interpretation as this captured nearly 90% of the variance.
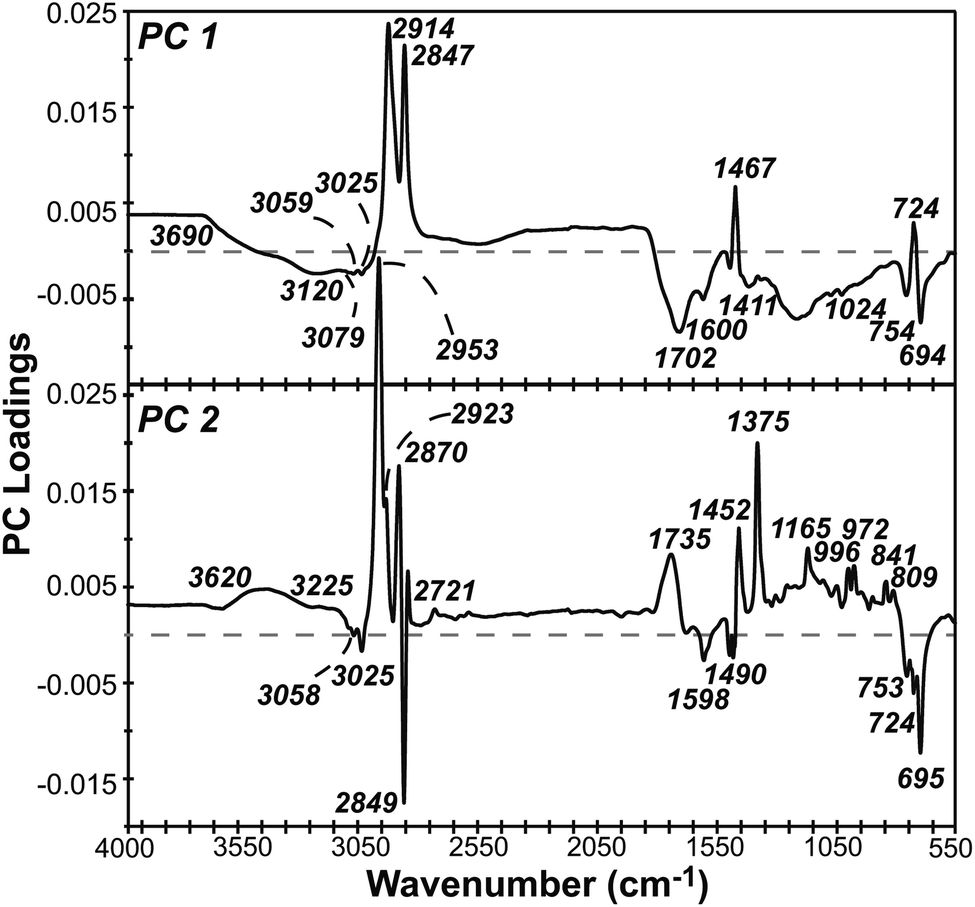 | ||
| Fig. 2 Loadings plots of principal components 1 (top) and 2 (bottom) for IR spectra of four plastics which were photochemically aged with UV-B emitting bulbs. | ||
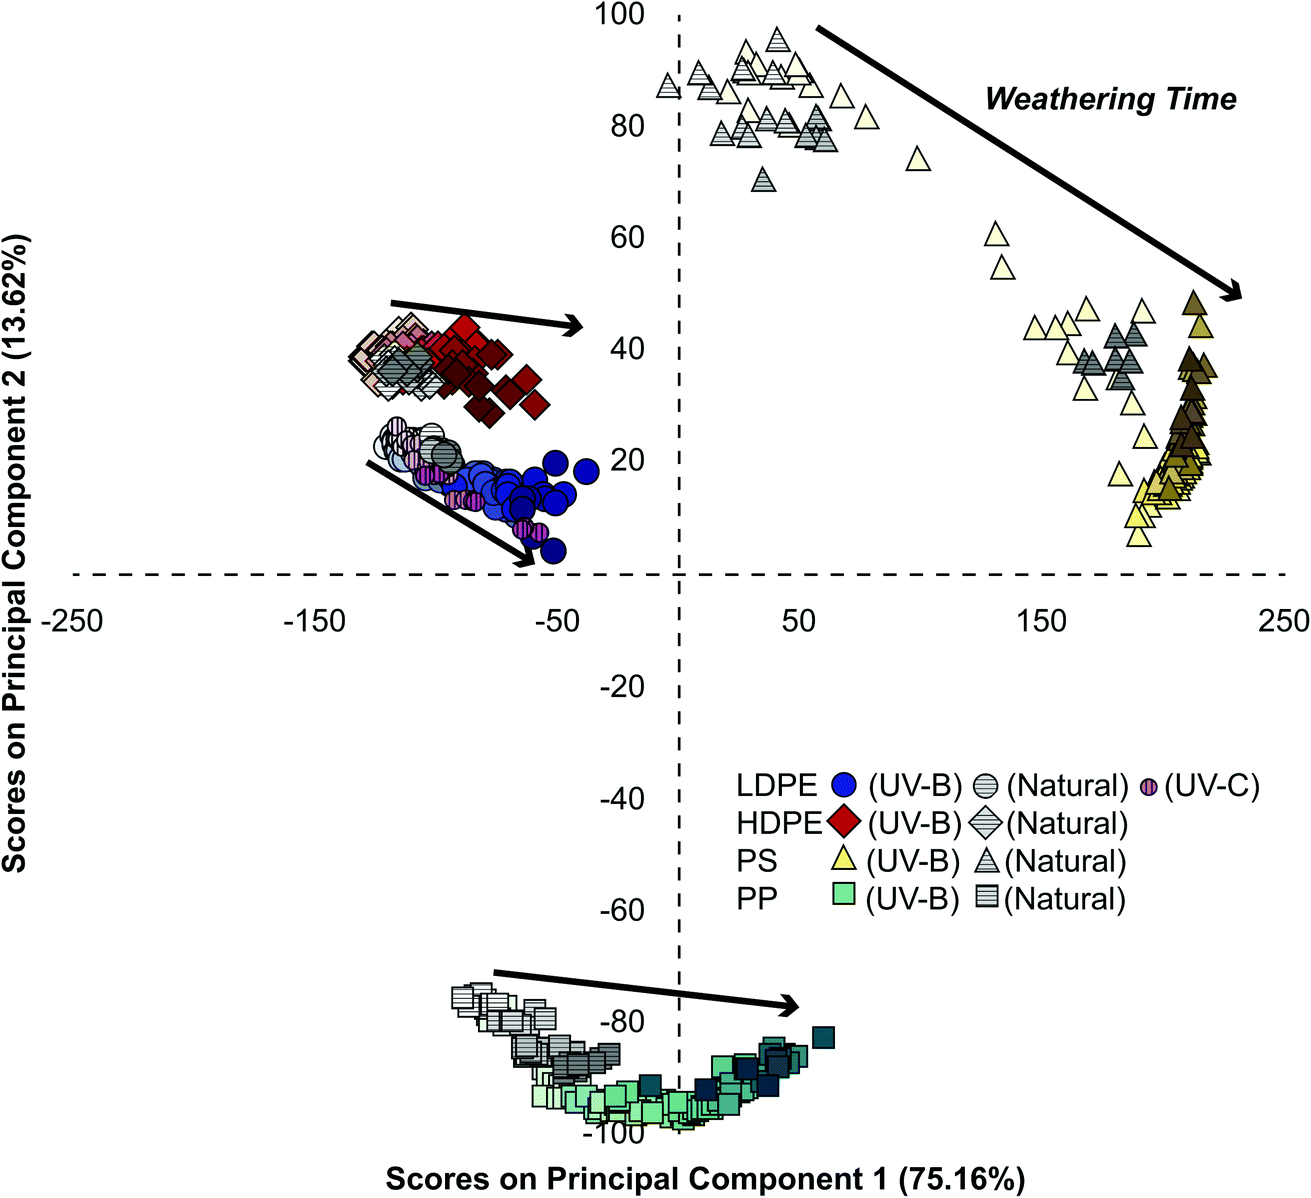 | ||
| Fig. 3 PCA scores plot of all samples. The model was built with IR spectra of UV-B weathered LDPE (blue circles), HDPE (red diamonds), PS (yellow triangles), and PP (teal squares). Increasing photochemical exposure is represented by the colour value, with darker fill associated with increased weathering time. Arrows indicate the progression of weathering. Naturally weathered plastics (grey lined) and UV-C weathered LDPE (pink) are projected onto the model. | ||
3.3 Trends in UV-B weathering kinetics
We extract information on weathering rates by plotting PC 1 scores versus time as presented in Fig. 4 and 5. Similar trends were observed with PC 2 (Fig. S6†). The PC scores for HDPE and LDPE varied linearly over the full 171- and 188 days exposure time (Fig. 4A), with the LDPE samples appearing to weather faster than HDPE. This may result from LDPE's more accessible terminal methyl groups having a greater susceptibility to photooxidation relative to HDPE.47–49 A comparison of weathering rates determined by monitoring the more conventional metric of CI over time showed a similar trend (Fig. 4B). Although PC scores are an aggregate measure of variance in the full spectra, how this score changes over time yields kinetically meaningful data. Time series PCA scores have been employed previously to assess degradation kinetics and hence the shelf-life of individual food products.32,33 To validate the predictive power of the two methods, the UV-B weathered data for each plastic was split into a training set and test set and the scores on PC 1 or CI for each sample in the test set were used to predict weathering time for all plastics except PS. The results (Fig. S7†) suggest that PCA and CI had similar predictive power for the PEs. However, PCA performed better for PP, which exhibited non-linear weathering behaviour and has a reference peak with a small area used to calculate the carbonyl index resulting in larger uncertainties. PCA was clearly superior for PS, as the lack of a stable reference peak in the ATR-FTIR spectra did not allow for the calculation of a carbonyl index.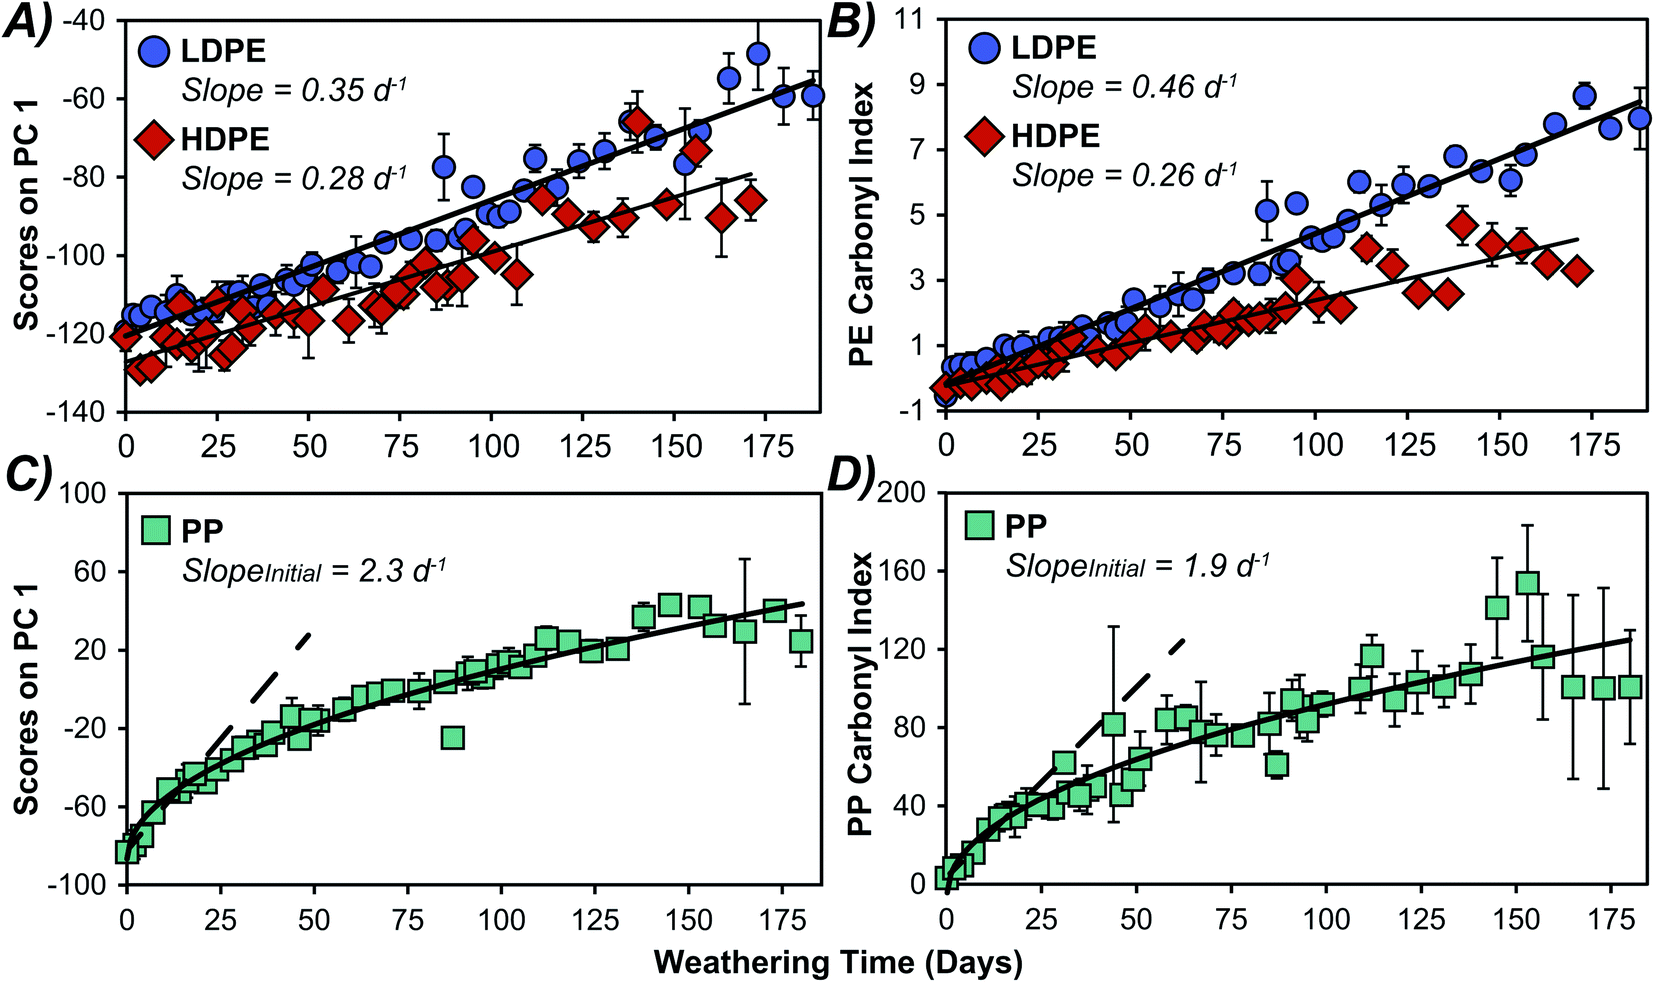 | ||
| Fig. 4 Comparison of PC 1 scores and CI values as a function of weathering time. (A) Scores on PC 1 for LDPE (blue circles) and HDPE (red diamonds), (B) CI for LDPE and HDPE, (C) scores on PC 1 for PP (teal squares), and (D) CI for PP. Standard deviation represented with error bars (based on n ≥ 3). | ||
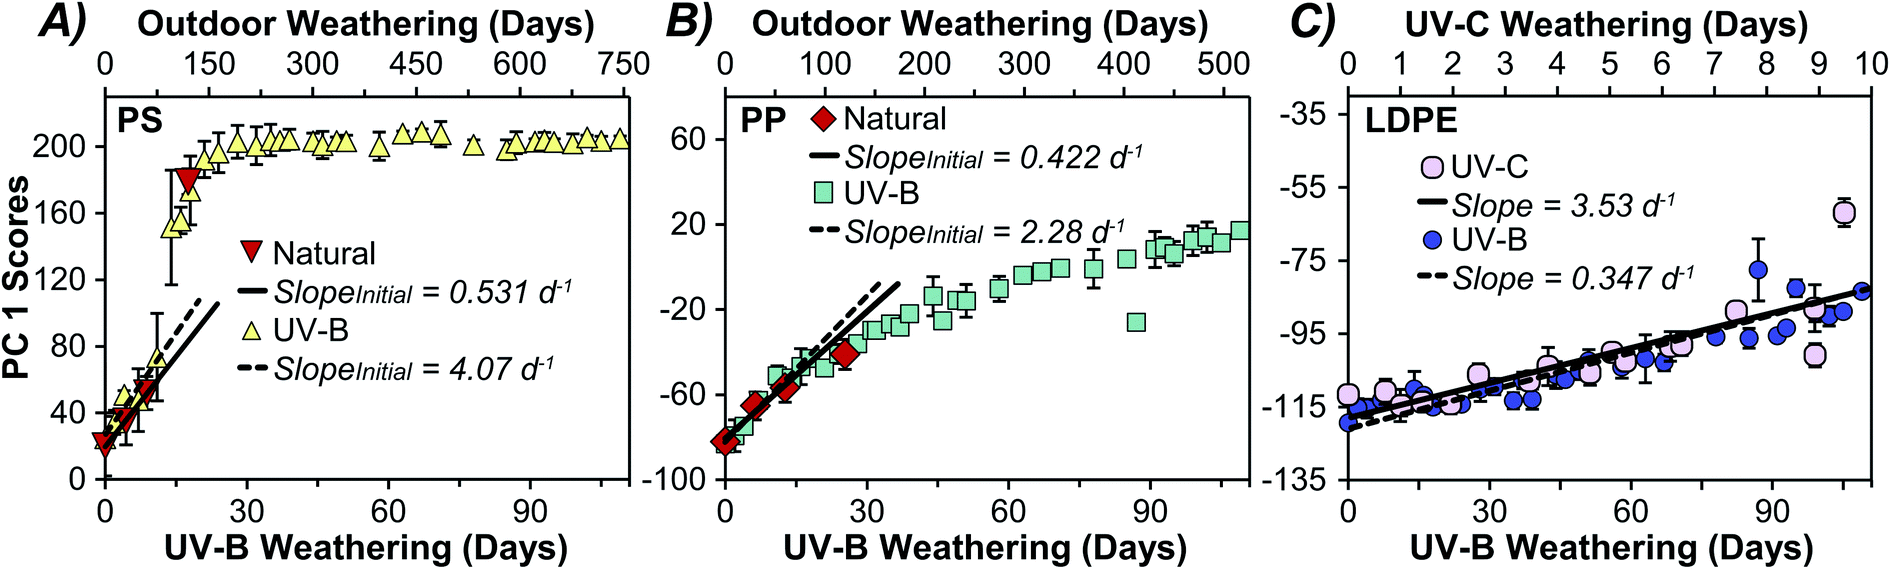 | ||
| Fig. 5 Principal component 1 scores over first 100 days for (A) PS, (B) PP, and (C) LDPE under different weathering conditions. Artificial UV-B weathering time on the bottom x-axis (yellow PS, teal PP, blue LDPE). Natural outdoor ((A) and (B), data shown in dark red) and UV-C weathering time ((C), data shown in light pink) on the top x-axis. | ||
Kinetic analysis of PP over 188 days showed a faster initial rate that began to decrease after about 20 days. The initial rate of change over the first 18 days in PC 1 appears to be similar to that in the CI as shown in Fig. 4C and D, respectively. This initial weathering rate was considerably faster for PP than PE samples when comparing either the PCA scores or the CI, after adjusting for the different reference peak areas in CI as others have done.25 For PP, the PC 1 scores are more reproducible as evidenced by the observably larger standard deviations in measured CI data (Fig. 4), and the larger confidence intervals when fitting the CI data in comparison to the PCA data (Fig. S8†). We attribute the lower reproducibility of the CI method to inherent sensitivity to minute changes in the very small reference peak around 2700 cm−1. The difference in weathering rates between PP and PE have been observed by others and have been attributed to the more accessible methyl groups in PP.42 Interestingly, PS displayed a sigmoidal weathering profile (Fig. 5A), with a relatively slow initial rate followed by an acceleration in weathering in the first month which then slowed after 28 days of UV-B exposure. The rapid weathering has been attributed to the aromatic chromophore in PS and the eventual decrease in reaction rate has been ascribed to increased crystallinity.14,18 Because we did not observe a stable reference peak for PS, a corresponding trend in the CI was not investigated. Previous PS weathering studies utilizing CI have analyzed less extensive weathering or used reference peaks which were not stable in our study.50–53
We believe that PCA provides a widely applicable and comprehensive means of analyzing IR spectral changes and weathering processes. While tracking variations in the CI has been used to monitor changes in the IR spectra of plastics over time, this approach has some constraints as it limits the analysis to specific IR regions and relies on the presence of an invariant reference peak.27 In contrast, PCA captures all changes in the full spectrum, does not require a reference peak, and was used here to analyze multiple plastic types simultaneously. When a separate PCA model was constructed for each individual plastic type alone (Fig. S5†), we observed very similar kinetic features and trends to those observed using the model with multiple plastic types. This suggests that the combined model (Fig. 2 and 3) can be employed to simultaneously identify and provide a photochemical age of plastics.
3.4 Natural and UV-C accelerated weathering
Photochemically aging plastics in a lab environment can be used to better understand and accelerate natural weathering processes. Weathering under natural conditions is subject to greater variability due to meteorological conditions, diurnal cycles, and environmental fouling.54 Additionally, the wavelength distribution and relative intensity in the solar spectrum differs from spectra generated by the lamps used to artificially weather plastics at an accelerated rate (Fig. S1 and Table S2†). Fig. S2† shows that there was a linear relationship between cumulative irradiation and days weathered for all three light sources over the course of the sampling period. Relating observations under natural conditions to those in a controlled lab environment is a long-standing challenge in the study of environmental processes.11 To assess if naturally weathered samples undergo similar changes in surface characteristics to those weathered using UV-B in a lab setting, we projected the PC scores of naturally weathered LDPE, HDPE, PP, and PS samples onto the PCA model generated from UV-B exposed plastics (Fig. 3). Plastics exposed to natural conditions (grey symbols) grouped with the same plastics and along weathering trajectories observed for UV-B weathered samples. Similar results were observed for LDPE exposed to UV-C irradiation (pink circles) in Fig. 3. A separate PCA of only LDPE samples under all three weathering conditions did not discriminate samples based on the weathering treatment (Fig. S9†). This indicates that natural weathering, UV-B, and UV-C exposure led to similar changes in surface characteristics as observed by ATR-FTIR. While others have shown that photooxidative weathering can lead to the production of water-soluble products for some plastics,55–57 these may have been removed by rain and/or the rinsing stage of outdoor samples prior to IR analysis.As expected, weathering under natural outdoor conditions proceeded slower than under continuous irradiation with the UV-B lamps (Fig. S10†). Likewise, photochemical ageing with high-energy UV-C light occurred considerably faster than the other weathering treatments. While the average solar intensity (230 W m−2) over the sampling period was higher than the intensity of both UV-B (22 W m−2) and UV-C (7 W m−2) light sources, the wavelength distribution in the spectra of the three sources differed significantly (Fig. S1†). As shown in Table S2,† the incident light from the UV-B and UV-C sources have a greater proportion of high energy photons than solar insolation. Therefore, despite the higher average solar intensity, there are fewer photons leading to chemical changes in the plastics.
Acceleration factors were calculated for different weathering treatments for PP, PS, and PE by taking the ratio of the exposure times at which the PC 1 scores were identical.58 The averaged acceleration factor values for each plastic were then used to map other weathering treatments onto the UV-B model (Fig. 5) to yield an equivalent photochemical age. Fig. 5 compares natural and UV-B weathering for PS and PP. By plotting the PC 1 scores for plastics weathered under different conditions, we can express the rate of change on a standardized lab-controlled time scale. For example, 100 days of natural outdoor exposure was roughly equivalent to 15 days of UV-B exposure for PS (panel A), whereas for PP (panel B) 100 days of natural weathering was equivalent to 22 days under the UV-B treatment. Differences between the acceleration factors between plastics are expected as their absorption cross sections will overlap to different extents with the irradiance spectra (Fig. S1†). Panel C illustrates a similar comparison between UV-C and UV-B for LDPE, showing that UV-C aging of this plastic occurred roughly ten times faster than the UV-B conditions employed here. The average acceleration factors for PS, PP, and UV-C weathered LDPE were 6.9, 4.5, and 11.5, respectively (Table 1). It is important to note that the acceleration factors presented here are dependent on the specific conditions including the intensity and spectral distribution (photonic energy) of the light source employed (Fig. S1, S2 and Table S2†).
| Plastic | Average acceleration factor | Ratio of initial weathering rates |
|---|---|---|
| LDPE | 11.5 (UV-C/UV-B) | 10 (UV-C/UV-B) 8.0 (UV-B/natural) |
| HDPE | — | 8.0 (UV-B/natural) |
| PP | 4.5 (UV-B/natural) | 5.4 (UV-B/natural) |
| PS | 6.9 (UV-B/natural) | 7.7 (UV-B/natural) |
The temporal profile of PS natural weathering was initially slow and accelerated after roughly 100 days of outdoor exposure (Fig. 5A). Natural weathering for PP also appeared to follow the same trend seen with UV-B weathering (Fig. 5B). The weathering profiles for the PEs showed linear behaviour under all weathering treatments (Fig. S10†). Acceleration factors and initial rate ratios for the plastics studied are summarized in Table 1, except for naturally weathered LDPE and HDPE which were not significantly weathered outdoors. A comparison of the initial rates of change in PC 1 scores over time for PP and PS shows that they initially weathered 5.4 and 7.7 times faster under UV-B conditions than natural conditions (Table 1). LDPE and HDPE weathered 8.0 times faster under UV-B and 80 times faster under UV-C when compared to natural sunlight (Table 1). Importantly, the approach described here can be used to find an equivalent photochemical age of environmental samples.
Our results are broadly consistent with previous observations,16,18,42 though degradation rates for PS and PP are generally underrepresented in literature.49 Spectroscopic changes in PS due to photochemical weathering are rarely contextualized alongside other plastic types, though previous studies have found the change in CI to be faster in PP than PS under the weathering conditions employed.51,52 The kinetic behaviour of PP and PS reported by Mylläri et al. does appear to be quite different from what we observe in our analysis, which may arise from variations in polymer used or the illumination characteristics (i.e., lower intensity UV-B).51 It should be noted that spectroscopic techniques probe surface phenomena and may not capture macroscopic changes in physical characteristics. UV-C exposed LDPE yellowed faster than UV-B weathered samples at the same PCA scores and CI, while UV-B weathered LDPE was more brittle, suggesting differences in induced chromophores and crystallinity.25,38 We caution that changes in the bulk properties may not be representative of natural environmental processes and that the weathering mechanisms may differ.59 This may be particularly relevant as UV-C is often used to rapidly weather microplastics for contaminant sorption studies23,60,61 despite not reflecting terrestrial conditions (Fig. S1†).59 Nonetheless, we propose that the multivariate approach described here can be used to photochemically age environmental microplastics.
4. Conclusion
In this work, LDPE, HDPE, PP, and PS were weathered under natural and artificial light conditions and changes in the surface composition were monitored by ATR-FTIR spectroscopy over extended exposure times. Multivariate analysis of spectra from UV-B weathered plastics was employed to generate a PCA model that simultaneously discriminated between the four types of plastics and the extent of photochemical weathering. Samples weathered under natural sunlight and UV-C irradiation were projected onto the model and found to follow similar trends. PCA offers some advantages over CI as a means of monitoring changes in surface composition of plastics due to weathering because it captures changes across the entire IR spectrum and is less prone to errors in the CI approach introduced by weak or unstable reference absorptions. Plots of PC scores versus time were used to compare weathering kinetics between plastics. The overall spectral changes observed by ATR-FTIR and kinetic trends were the same regardless of the type of weathering; PS weathered the fastest followed by PP, LDPE, and HDPE. This approach was particularly useful in defining acceleration factors for different photochemical treatments and enabling the expression of an equivalent photochemical age based on standardized lab-controlled conditions. We propose that the time series of PC scores provides kinetically meaningful results that can be used to provide insight into changes in surface characteristics. Future work in our group will employ in situ membrane introduction mass spectrometry as a direct monitoring strategy to assess the rate and extent of trace contaminant sorption on pristine and weathered microplastics.Conflicts of interest
There are no conflicts of interest to declare.Acknowledgements
The authors acknowledge Vancouver Island University and University of Victoria for ongoing support of the Applied Environmental Research Laboratories and students. Research was supported through the Natural Sciences and Engineering Research Council of Canada (Discovery Grant 2016-06454 ETK; USRA MZ) and the VIU REACH award (MZ). We gratefully acknowledge contributions from Peter Diamente for collecting the light source spectra and for training on and maintenance of the ATR-FTIR Spectrometer.References
- R. C. Hale, M. E. Seeley, M. J. la Guardia, L. Mai and E. Y. Zeng, A Global Perspective on Microplastics, J. Geophys. Res.: Oceans, 2020, 125(1), e2018JC014719 Search PubMed.
- J. L. Xu, K. V. Thomas, Z. Luo and A. A. Gowen, FTIR and Raman Imaging for Microplastics Analysis: State of the Art, Challenges and Prospects, Trends Anal. Chem., 2019, 119, 115629 CrossRef CAS.
- C. Wayman and H. Niemann, The Fate of Plastic in the Ocean Environment – a Minireview, Environ. Sci.: Processes Impacts, 2021, 23(2), 198–212 RSC.
- S. O'Brien, E. D. Okoffo, J. W. O'Brien, F. Ribeiro, X. Wang, S. L. Wright, S. Samanipour, C. Rauert, T. Y. A. Toapanta, R. Albarracin and K. V. Thomas, Airborne Emissions of Microplastic Fibres from Domestic Laundry Dryers, Sci. Total Environ., 2020, 747, 141175 CrossRef PubMed.
- E. E. Burns and A. B. A. Boxall, Microplastics in the Aquatic Environment: Evidence for or Against Adverse Impacts and Major Knowledge Gaps, Environ. Toxicol. Chem., 2018, 37, 2776–2796 CrossRef CAS PubMed.
- E. M. Cunningham, S. M. Ehlers, J. T. A. Dick, J. D. Sigwart, K. Linse, J. J. Dick and K. Kiriakoulakis, High Abundances of Microplastic Pollution in Deep-Sea Sediments: Evidence from Antarctica and the Southern Ocean, Environ. Sci. Technol., 2020, 54, 13661–13671 CrossRef CAS PubMed.
- J. C. Anderson, B. J. Park and V. P. Palace, Microplastics in Aquatic Environments: Implications for Canadian Ecosystems, Environ. Pollut., 2016, 218, 269–280 CrossRef CAS PubMed.
- S. L. Wright, R. C. Thompson and T. S. Galloway, The Physical Impacts of Microplastics on Marine Organisms: A Review, Environ. Pollut., 2013, 178, 483–492 CrossRef CAS PubMed.
- R. Lehner, C. Weder, A. Petri-Fink and B. Rothen-Rutishauser, Emergence of Nanoplastic in the Environment and Possible Impact on Human Health, Environ. Sci. Technol., 2019, 53, 1748–1765 CrossRef CAS PubMed.
- M. Kedzierski, M. D'Almeida, A. Magueresse, A. Le Grand, H. Duval, G. César, O. Sire, S. Bruzaud and V. Le Tilly, Threat of Plastic Ageing in Marine Environment. Adsorption/Desorption of Micropollutants, Mar. Pollut. Bull., 2018, 127, 684–694 CrossRef CAS PubMed.
- H. P. H. Arp, D. Kühnel, C. Rummel, M. MacLeod, A. Potthoff, S. Reichelt, E. Rojo-Nieto, M. Schmitt-Jansen, J. Sonnenberg, E. Toorman and A. Jahnke, Weathering Plastics as a Planetary Boundary Threat: Exposure, Fate, and Hazards, Environ. Sci. Technol., 2021, 55(11), 7246–7255 CrossRef CAS PubMed.
- Z. L. R. Botterell, N. Beaumont, T. Dorrington, M. Steinke, R. C. Thompson and P. K. Lindeque, Bioavailability and Effects of Microplastics on Marine Zooplankton: A Review, Environ. Pollut., 2019, 245, 98–110 CrossRef CAS PubMed.
- J. P. Rodrigues, A. C. Duarte, J. Santos-Echeandía and T. Rocha-Santos, Significance of Interactions between Microplastics and POPs in the Marine Environment: A Critical Overview, Trends Anal. Chem., 2019, 111, 252–260 CrossRef CAS.
- P. Liu, L. Qian, H. Wang, X. Zhan, K. Lu, C. Gu and S. Gao, New Insights into the Aging Behavior of Microplastics Accelerated by Advanced Oxidation Processes, Environ. Sci. Technol., 2019, 53, 3579–3588 CrossRef CAS PubMed.
- G. Mitchell, F. France, A. Nordon, P. L. Tang and L. T. Gibson, Assessment of Historical Polymers Using Attenuated Total Reflectance-Fourier Transform Infra-Red Spectroscopy with Principal Component Analysis, Heritage Sci., 2013, 1, 1–10 CrossRef.
- G. Grause, M. F. Chien and C. Inoue, Changes during the Weathering of Polyolefins, Polym. Degrad. Stab., 2020, 181, 109364 CrossRef CAS.
- E. Yousif and R. Haddad, Photodegradation and Photostabilization of Polymers, Especially Polystyrene: Review, SpringerPlus, 2013, 2, 1–32 CrossRef CAS PubMed.
- B. Gewert, M. M. Plassmann and M. Macleod, Pathways for Degradation of Plastic Polymers Floating in the Marine Environment, Environ. Sci.: Processes Impacts, 2015, 17, 1513–1521 RSC.
- B. Singh and N. Sharma, Mechanistic Implications of Plastic Degradation, Polym. Degrad. Stab., 2008, 93, 561–584 CrossRef CAS.
- A. ter Halle, L. Ladirat, X. Gendre, D. Goudouneche, C. Pusineri, C. Routaboul, C. Tenailleau, B. Duployer and E. Perez, Understanding the Fragmentation Pattern of Marine Plastic Debris, Environ. Sci. Technol., 2016, 50, 5668–5675 CrossRef CAS PubMed.
- M. Masry, S. Rossignol, J. Gardette, S. Therias, P. Bussière and P. Wong-Wah-Chung, Characteristics, fate, and impact of marine plastic debris exposed to sunlight: A review, Mar. Pollut. Bull., 2021, 171, 112701 CrossRef CAS PubMed.
- L. Andrady, The Plastic in Microplastics: A Review, Mar. Pollut. Bull., 2017, 119, 12–22 CrossRef PubMed.
- G. Liu, Z. Zhu, Y. Yang, Y. Sun, F. Yu and J. Ma, Sorption Behavior and Mechanism of Hydrophilic Organic Chemicals to Virgin and Aged Microplastics in Freshwater and Seawater, Environ. Pollut., 2019, 246, 26–33 CrossRef CAS PubMed.
- M. R. Jung, F. D. Horgen, S. v. Orski, V. Rodriguez C., K. L. Beers, G. H. Balazs, T. T. Jones, T. M. Work, K. C. Brignac, S. J. Royer, K. D. Hyrenbach, B. A. Jensen and J. M. Lynch, Validation of ATR FT-IR to Identify Polymers of Plastic Marine Debris, Including Those Ingested by Marine Organisms, Mar. Pollut. Bull., 2018, 127, 704–716 CrossRef CAS PubMed.
- J. Brandon, M. Goldstein and M. D. Ohman, Long-Term Aging and Degradation of Microplastic Particles: Comparing in Situ Oceanic and Experimental Weathering Patterns, Mar. Pollut. Bull., 2016, 110, 299–308 CrossRef CAS PubMed.
- H. de Frond, R. Rubinovitz and C. M. Rochman, μATR-FTIR Spectral Libraries of Plastic Particles (FLOPP and FLOPP-e) for the Analysis of Microplastics, Anal. Chem., 2021, 93(48), 15878–15885 CrossRef PubMed.
- C. Rouillon, P. Bussiere, E. Desnoux, S. Collin, C. Vial, S. Therias and J. Gardette, Is Carbonyl Index a Quantitative Probe to Monitor Polypropylene Photodegradation?, Polym. Degrad. Stab., 2016, 128, 200–208 CrossRef CAS.
- J. J. Guo, H. Yan, J. Dai, Z. de Hu and J. J. Yang, Evaluation of Thermal Degradation of High Density Polyethylene by Principal Component Analysis, Mater. Sci. Forum, 2016, 852, 632–638, DOI:10.4028/www.scientific.net/msf.852.632.
- J. Dai, H. Yan, J. J. Yang and J. J. Guo, Evaluation of the Aging Behavior of High Density Polyethylene in Thermal-Oxidative Environment by Principal Component Analysis, Key Eng. Mater., 2017, 727, 447–449, DOI:10.4028/www.scientific.net/kem.727.447.
- K. Varmuza and P. Filzmoser, Introduction to Multivariate Statistical Analysis in Chemometrics, Taylor & Francis Group, Baton Rouge, U.S., 2009 Search PubMed.
- S. Wold, K. Esbensen and P. Geladi, Principal Component Analysis, Chemom. Intell. Lab. Syst., 1987, 2, 37–52 CrossRef CAS.
- M. K. Pedro and M. M. C. Ferreira, Multivariate Accelerated Shelf-Life Testing: A Novel Approach for Determining the Shelf-Life of Foods, J. Chemom., 2006, 20, 76–83 CrossRef.
- M. M. A. Chaudhry, M. L. Amodio, F. Babellahi, M. L. V. de Chiara, J. M. Amigo Rubio and G. Colelli, Hyperspectral Imaging and Multivariate Accelerated Shelf Life Testing (MASLT) Approach for Determining Shelf Life of Rocket Leaves, J. Food Eng., 2018, 238, 122–133 CrossRef CAS.
- G. Renner and T. C. Schmidt, A New Chemometric Approach for Automatic Identification of Microplastics from Environmental Compartments Based on FT-IR Spectroscopy, Anal. Chem., 2017, 89, 12045–12053 CrossRef CAS PubMed.
- V. H. da Silva, F. Murphy, J. M. Amigo, C. Stedmon and J. Strand, Classification and Quantification of Microplastics (<100 Mm) Using a Focal Plane Array-Fourier Transform Infrared Imaging System and Machine Learning, Anal. Chem., 2020, 92, 13724–13733 CrossRef CAS PubMed.
- Q. Duan and J. Li, Classification of Common Household Plastic Wastes Combining Multiple Methods Based on Near-Infrared Spectroscopy, ACS ES&T Engg, 2021, 1, 1065–1073 Search PubMed.
- D. Song, J. Gao, L. Lu and X. Li, Evaluation of Service Life of Polystyrene in Tropical Marine Environment by Principal Component Analysis, Adv. Mater. Sci. Eng., 2015, 604935 Search PubMed.
- Y. Lv, Y. Huang, M. Kong, Q. Yang and G. Li, Multivariate Correlation Analysis of Outdoor Weathering Behavior of Polypropylene under Diverse Climate Scenarios, Polym. Test., 2017, 64, 65–76 CrossRef CAS.
- L. Lu, X. Li and J. Gao, Evaluation of Aging Behavior of Medium Density Polyethylene in Natural Environment by Principal Component Analysis, J. Appl. Polym. Sci., 2012, 125, 19–23 CrossRef CAS.
- D. Song, J. Gao, X. Li and L. Lu, Evaluation of Aging Behavior of Polypropylene in Natural Environment by Principal Component Analysis, Polym. Test., 2014, 33, 131–137 CrossRef CAS.
- R. A. Majid, H. Ismail and R. M. Taib, The Effects of Natural Weathering on the Properties of Linear Density Polyethylene (LDPE)/Thermoplastic Sago Starch (TPSS) Blends, Polym.-Plast. Technol. Eng., 2010, 49, 1142–1149 CrossRef CAS.
- F. Julienne, F. Lagarde and N. Delorme, Influence of the Crystalline Structure on the Fragmentation of Weathered Polyolefines, Polym. Degrad. Stab., 2019, 170, 109012 CrossRef.
- G. Renner, A. Nellessen, A. Schwiers, M. Wenzel, T. C. Schmidt and J. Schram, Data Preprocessing & Evaluation Used in the Microplastics Identification Process: A Critical Review & Practical Guide, TrAC, Trends Anal. Chem., 2019, 111, 229–238 CrossRef CAS.
- L. Cai, J. Wang, J. Peng, Z. Wu and X. Tan, Observation of the Degradation of Three Types of Plastic Pellets Exposed to UV Irradiation in Three Different Environments, Sci. Total Environ., 2018, 628–629, 740–747 CrossRef CAS PubMed.
- M. Hamzah, M. Khenfouch, A. Rjeb, S. Sayouri, D. S. Houssaini, M. Darhouri and V. v. Srinivasu, Surface Chemistry Changes and Microstructure Evaluation of Low Density Nanocluster Polyethylene under Natural Weathering: A Spectroscopic Investigation, J. Phys.: Conf. Ser., 2018, 984, 012010 CrossRef.
- V. Fernández-González, J. M. Andrade-Garda, P. López-Mahía and S. Muniategui-Lorenzo, Impact of Weathering on the Chemical Identification of Microplastics from Usual Packaging Polymers in the Marine Environment, Anal. Chim. Acta, 2021, 1142, 179–188 CrossRef PubMed.
- A. Martínez-Romo, R. González-Mota, J. J. Soto-Bernal and I. Rosales-Candelas, Investigating the Degradability of HDPE, LDPE, PE-BIO, and PE-OXO Films under UV-B Radiation, J. Spectrosc., 2015, 586514 Search PubMed.
- J. V. Gulmine, P. R. Janissek, H. M. Heise and L. Akcelrud, Degradation Profile of Polyethylene after Artificial Accelerated Weathering, Polym. Degrad. Stab., 2003, 79, 385–397 CrossRef CAS.
- A. Chamas, H. Moon, J. Zheng, Y. Qiu, T. Tabassum, J. H. Jang, M. Abu-Omar, S. L. Scott and S. Suh, Degradation Rates of Plastics in the Environment, ACS Sustainable Chem. Eng., 2020, 8, 3494–3511 CrossRef CAS.
- E. Yousif, J. Salimon and N. Salih, New Stabilizers for Polystyrene Based on 2-N-Salicylidene-5-(substituted)-1,3,4-Thiadiazole Compounds, J. Saudi Chem. Soc., 2017, 16, 299–306 CrossRef.
- V. Mylläri, T. P. Ruoko and S. Syrjälä, A Comparison of Rheology and FTIR in the Study of Polypropylene and Polystyrene Photodegradation, J. Appl. Polym. Sci., 2015, 132, 1–6 Search PubMed.
- P. Liu, X. Wu, H. Huang, H. Wang, Y. Shi and S. Gao, Simulation of Natural Aging Property of Microplastics in Yangtze River Water Samples via a Rooftop Exposure Protocol, Sci. Total Environ., 2021, 785, 147265 CrossRef CAS PubMed.
- F. A. Bottino, A. R. Cinquegrani, G. di Pasquale, L. Leonardi and A. Pollicino, Chemical Modifications, Mechanical Properties and Surface Photo-Oxidation of Films of Polystyrene (PS), Polym. Test., 2004, 23, 405–411 CrossRef CAS.
- R. Satato, W. S. Subowo, R. Yusiasih, Y. Takane, Y. Watanabe and T. Hatakeyama, Weathering of High-Density Polyethylene in Different Latitudes, Polym. Degrad. Stab., 1997, 56, 275–279 CrossRef.
- B. Gewert, M. Plassmann, O. Sandblom and M. MacLeod, Identification of Chain Scission Products Released to Water by Plastic Exposed to Ultraviolet Light, Environ. Sci. Technol. Lett., 2018, 5, 272–276 CrossRef CAS.
- L. Zhu, S. Zhao, T. B. Bittar, A. Stubbins and D. Li, Photochemical dissolution of buoyant microplastics to dissolved organic carbon: Rates and microbial impacts, J. Hazard. Mater., 2020, 383, 121065 CrossRef CAS PubMed.
- N. Walsh, C. M. Reddy, S. F. Niles, A. M. McKenna, C. M. Hansel and C. P. Ward, Plastic Formulation is an Emerging Control of Its Photochemical Fate in the Ocean, Environ. Sci. Technol., 2021, 55, 12383–12392 CrossRef PubMed.
- C. Badji, J. Beigbeder, H. Garay, A. Bergeret, J. C. Bénézet and V. Desauziers, Correlation between Artificial and Natural Weathering of Hemp Fibers Reinforced Polypropylene Biocomposites, Polym. Degrad. Stab., 2018, 148, 117–131 CrossRef CAS.
- M. Doğan, Ultraviolet Light Accelerates the Degradation of Polyethylene Plastics, Microsc. Res. Tech., 2021, 1–10 Search PubMed.
- T. Hüffer, A. K. Weniger and T. Hofmann, Data on Sorption of Organic Compounds by Aged Polystyrene Microplastic Particles, Data Brief, 2018, 18, 474–479 CrossRef PubMed.
- T. Vockenberg, T. Wichard, N. Ueberschaar, M. Franke, M. Stelter and P. Braeutigam, The Sorption Behaviour of Amine Micropollutants on Polyethylene Microplastics – Impact of Aging and Interactions with Green Seaweed, Environ. Sci.: Processes Impacts, 2020, 22, 1678–1687 RSC.
Footnote |
| † Electronic supplementary information (ESI) available: Supplier details on plastics, spectral distribution and intensities of light treatments, photographs, summary of outdoor sunlight exposure data, assignment of IR spectral features identified by PC loadings, and additional PCA and CI results not included in the main document. See DOI: 10.1039/d1em00392e |
| This journal is © The Royal Society of Chemistry 2022 |