 Open Access Article
Creative Commons Attribution 3.0 Unported Licence
Influence of the spatial distribution of copper sites on the selectivity of the oxygen reduction reaction†
N. W. G.
Smits
a,
D.
Rademaker
a,
A. I.
Konovalov
 a,
M. A.
Siegler
b and
D. G. H.
Hetterscheid
 *a
*a
aLeiden Institute of Chemistry, Leiden University, P.O. box 9502, 2300 RA Leiden, The Netherlands. E-mail: d.g.h.hetterscheid@chem.leidenuniv.nl
bDepartment of Chemistry, Johns Hopkins University, 3400 N. Charles Street, Baltimore, MD 21218, USA
First published on 21st December 2021
Abstract
Moving towards a hydrogen economy raises the demand for affordable and efficient catalysts for the oxygen reduction reaction. Cu-bmpa (bmpa = bis(2-picolyl)amine) is shown to have moderate activity, but poor selectivity for the 4-electron reduction of oxygen to water. To enhance the selectivity towards water formation, the cooperative effect of three Cu-bmpa binding sites in a single trinuclear complex is investigated. The catalytic currents in the presence of the trinuclear sites are lower, possibly due to the more rigid structure and therefore higher reorganization energies and/or slower diffusion rates of the catalytic species. Although the oxygen reduction activity of the trinuclear complexes is lower than that of mononuclear Cu-bmpa, the selectivity of the copper mediated oxygen reduction was significantly enhanced towards the 4-electron process due to a cooperative effect between three copper centers that have been positioned in close proximity. These results indicate that the cooperativity between metal ions within biomimetic sites can greatly enhance the ORR selectivity.
Introduction
The development and storage of renewable energy are crucial to limit our fossil fuel consumption while sustaining the demand for energy. Within such a hydrogen society, fuel cell technology plays a central role.1–3 The limiting factor of such systems lies with the oxygen reduction reaction (ORR), which involves the redistribution of four protons and four electrons with a simultaneous cleavage of the O–O bond.4 This leads to a complex reaction mechanism with numerous intermediates.5 Consequently, a significant overpotential is required for ORR catalysis, which results in a substantial loss of energy. For the ORR, platinum catalysts are typically employed due to their relatively low overpotential, which is still quite substantial with roughly 400 mV.6,7 Moreover, platinum is not a sufficiently abundant material for large scale applications. This raises the demand for catalysts based on more affordable materials to drive the ORR at a low overpotential.Inspiration for the design of efficient catalysts that catalyse the ORR at a low overpotential and are based on abundant materials can be found in natural systems, particularly in redox metalloenzymes. A prime example is the multicopper enzyme laccase, which belongs to a family of oxidases and can be found in a variety of natural sources.8,9 This enzyme couples the oxidation of an organic substrate near a mononuclear Cu site to ORR catalysis at a trinuclear Cu cluster.10,11 Electrochemical studies on immobilized laccase have shown that the enzyme catalyzes the ORR close to the equilibrium potential.12–14 However, laccase has a low overall efficiency for the ORR in fuel cells due to the instability of the enzyme under fuel cell conditions and slow electron transfer to the active site.15 Nevertheless, the active site of laccase represents an interesting starting point for the development of new Cu-based molecular catalysts for the ORR that operate with a low overpotential and a high efficiency.
Mononuclear Cu complexes have been explored to catalyze the ORR.16–34 Additionally, several dinuclear complexes have been investigated to induce a cooperative effect during ORR catalysis.35–38 We have recently shown that the mononuclear complex [Cu(tmpa)(solv)]+ (Cu-tmpa, tmpa = tris(2-picolyl)amine) shows exceptionally high ORR catalytic performance with a turn-over frequency (TOF) of almost 2 million per second.19,39 We showed that the reduction of oxygen to water proceeds via a two-step process in which hydrogen peroxide is formed as an obligatory intermediate product.40 The complexes Cu-terpy and Cu-bmpa, which showed a lower denticity and flexibility of the ligand framework than Cu-tmpa, undergo the ORR with a lower activity and with a lower selectivity towards water (terpy = 2,2′:6′,2′′-terpyridine; bmpa = bis(2-pyridylmethyl)amine).20 Since H2O2 is damaging to fuel cell systems, the production of this compound is an unwanted side-reaction.
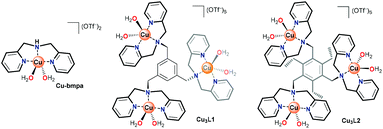
In laccase, the cooperativity of the Cu ions in the trinuclear cluster results in the reduction of oxygen to water, without the formation of H2O2 as an intermediate product. Inspired by laccase, several trinuclear Cu-based molecular catalysts have been reported for the ORR, of which most are based on ligands bearing alkylamine and pyridylalkyl-amine functional groups.41–52 In early reports, only oxygen binding and reductive cleavage were investigated.41,42,44 Later, the ORR activity of several trinuclear Cu complexes was investigated.46–48 These studies were carried out either by using organic solvents in the presence of sacrificial reagents,47 or by dropcasting the catalyst as part of carbon paste onto electrodes. Due to the very flexible and dynamic linkers employed to tether the copper sites together, it remains difficult to assess whether under these operative conditions these structures truly function as trinuclear sites.44,47 Consequently, the reported results have been rather inconclusive thus far. Inspired by the active site of laccase, and lessons learned in the previous studies, our study here focuses on a structurally rigid triethylbenzene node that forces all three copper sites linked to the remaining aromatic positions in close proximity to each other (Fig. 1).
Copper complexes with the L1 and L2 ligands have previously been reported for their reactivity with oxygen in organic solution and for their ability to cleave DNA via hydrolysis.53–56 In these studies, the crystal structures of these trinuclear complexes indicated that in Cu3L2 all three copper sites are forced into close proximity due to steric repulsion between neighboring groups on the aromatic node, while in Cu3L1 only two Cu centers will lie in close proximity.55,56 We report here that Cu3L1 has a similar selectivity for H2O compared to the parent mononuclear complex Cu-bmpa, and that the close proximity of the three Cu ions in Cu3L2 induces high selectivity for the selective formation of H2O.
Results
Characterization of the trinuclear compounds
Single crystal X-ray crystallography
Slow vapour diffusion of Et2O into a concentrated solution of Cu3L1 in acetone at 279 K resulted in single crystals which were suitable for X-ray crystallography (Fig. 2 and ESI 3†).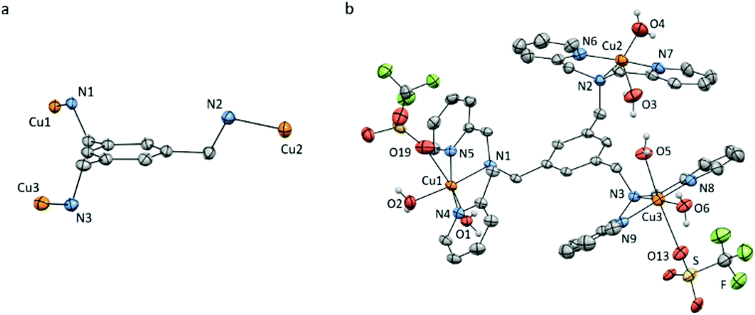 | ||
| Fig. 2 Displacement ellipsoid plots (50% probability level) of Cu3L1 at 110(2) K. (a) Orientation of the Cu ions relative to the benzene plane. (b) Full structure of Cu3L1. Lattice solvent molecules, four non-coordinating triflate ions, and all hydrogen atoms which are not part of the aqua ligands are omitted for clarity. Selected bond distances and angles are reported in ESI section 3.† | ||
The crystal structure clearly shows an asymmetric distribution of the three Cu-bmpa sites relative to the benzene plane. A similar distribution was published for the crystal structure of [L1(CuCl2)3] by Guo et al. in 2006,56 who reported square pyramidal geometries for all three CuII ions. In contrast, two of the three CuII ions in the crystal structure of Cu3L1 have an octahedral geometry due to the close proximity of triflate counter ions (Fig. 2b). The relatively short Cu1–O19 and Cu3–O13 bond distances of 2.691(3) and 2.650(3) Å, respectively, suggest that the triflate counter ions are weakly coordinated to the two Cu centers.
For Cu3L2, the various single crystals that were obtained during this study did not diffract well enough for X-ray structure determination. However, the crystal structure of [L2(CuCl2)3] has been reported by Anslyn et al. and showed closer proximity of the three Cu-bmpa sites to each other.55 All three sites are forced to the same side of the benzene plane due to the steric effect of the three ethyl substituents (Fig. 3).
 | ||
| Fig. 3 Reported crystal structure of the cationic part of [L2(CuCl2)3] as determined by X-ray crystallography with displacement ellipsoids scaled at the 30% probability level. (a) Orientation of the Cu ions relative to the benzene plane. (b) All hydrogen atoms, lattice solvent molecules, and the chloride ions are omitted for clarity. Adapted with permission from Anslyn et al. Copyright (2002) American Chemical Society.55 | ||
Magnetic properties
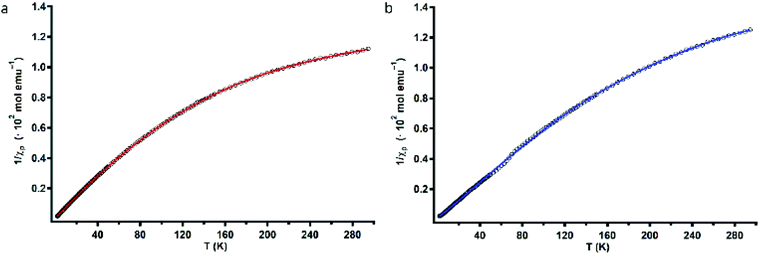
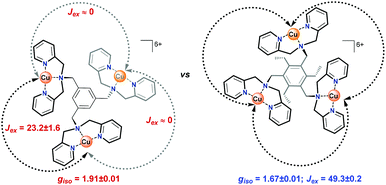
To assess the strength of the spatial interaction of the three paramagnetic CuII centers, the magnetic properties of complexes Cu3L1 and Cu3L2 were investigated using a superconducting quantum interference device (SQUID). In Fig. 4, the inverse of the obtained paramagnetic susceptibility (Xp) is plotted versus temperature. To extract the exchange coupling constants (J) between each pair of CuII ions, the obtained magnetic data were fitted using the PHI software (ESI 4†).57For Cu3L1, this resulted in three J-values, two of which were negligibly small suggesting virtually no magnetic coupling between two pairs of CuII ions. The third constant amounted to +23 cm−1 indicating ferromagnetic coupling (Fig. 5).58 In order to be able to couple ferromagnetically, the Cu ions have to be in close proximity to each other which is consistent with the two Cu ions being on one side of the benzene plane and the third one to the other side of the ring as was observed in the acquired crystal structure. For Cu3L2, the fitting returns one J value of +49 cm−1 confirming the symmetric distribution of the three CuII sites as expected on the basis of the reported crystal structure for [L2(CuCl2)3] (Fig. 5).
Structure in solution
Although the X-ray and SQUID analysis confirm the structure in the solid phase, conversion to other conformers may still occur in solution. The structure of hexaethylbenzene and variations thereof have been extensively studied in solution in the past. Both computational and NMR studies showed that for hexaethylbenzene the up–down–up–down–up–down conformation of six substituents is the lowest conformer, with at least 3.46 kcal mol−1 energy difference to the next favorable geometry (i.e. up–down–down–up–down–down).59,60 Therefore, a large majority of the compounds adopts the alternating up–down conformation. We anticipate that the even more bulkier Cu-bmpa substituent will not lower this energy difference between the various conformers, and therefore, it is expected that the alternating up–down conformation is also predominantly adopted by Cu3L2 in solution.59–63 For Cu3L1 the rotation of the Cu-bmpa substituents around the benzene node will be less prohibited due to the absence of the ethyl groups. Therefore, the distribution between the conformers is expected to be much more random for Cu3L1.Electrochemical behaviour of Cu3L1 and Cu3L2
Differential pulse voltammetry (DPV), and linear sweep voltammetry (LSV) were used to further pinpoint the redox behavior of Cu3L1 and Cu3L2. In the latter experiment, a resting potential is applied either at a high or low potential before the start of the LSV measurement to ensure that all copper sites are either in the +II or +I oxidation state at the start of the LSV experiment despite the slow electron transfer kinetics.
For Cu3L1, both anodic LSV and DPV measurements indicated the presence of two anodic peaks at 0.38 and 0.48 V vs. the RHE (Fig. S4†). The separation of the broad anodic peak into multiple oxidative processes has previously been observed for [L1(CuCl2)3] by Zhao et al.,56 who identified three individual anodic peaks in 0.1 M aqueous KCl. The observation of three separate anodic processes instead of two for Cu3L1 might be an effect of the presence of a different electrolyte and other counter ions. The cathodic peak could not be resolved in separate reduction processes for Cu3L1.
For Cu3L2, a cathodic sweep resulted in a separation of the main cathodic peak into two distinct reductive processes at 0.46 and 0.17 V vs. the RHE (Fig. S5†). Assuming the influence of the magnetic coupling of the CuII ions on this separation, the initial reduction of one or two CuII ions could result in a thermodynamically less favorable reduction of the other CuII ion(s). Not only this electronic coupling, but also the structural changes upon reduction can cause a separation of the cathodic peak.65–68 Separation of both the cathodic and anodic peak has been reported for [L2(CuX)3] (X = Br or I) in DCM by Kim et al.54 In contrast, the DPV of Cu3L2 did not result in the separation of the main anodic peak into distinct processes.
Oxygen reduction reaction catalysis
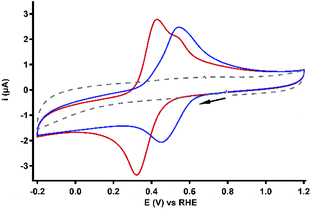
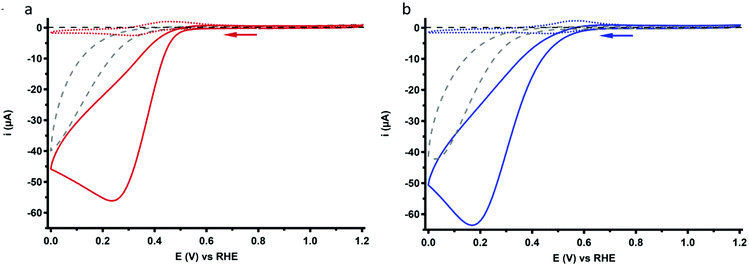
The ORR behavior of Cu3L1 and Cu3L2 was investigated with CV under 1 atm O2. Under these conditions, the voltammograms of both complexes show a peak-shaped catalytic wave (Fig. 7). For Cu-bmpa, an Ecat/2 value of 0.37 V vs. the RHE has been reported with the notion that Ecat/2 > E1/2 due to substrate depletion near the electrode.20 However, a relatively low Ecat/2 value is observed for both Cu3L1 and Cu3L2, amounting to 0.37 V vs. the RHE for Cu3L1 and 0.33 V vs. the RHE for Cu3L2. This means that Ecat/2 is equal to the E1/2 value for Cu3L1 and lower than the E1/2 value for Cu3L2. This suggests that the rates for the oxygen reduction reaction are not much influenced by substrate depletion compared to Cu-bmpa.Active species homogeneity
The homogeneity of the redox behavior of both Cu3L1 and Cu3L2 was assessed by performing a scan rate dependence study. From the ip,redvs. ν1/2 plots depicted in Fig. S6,† a linear relationship is observed between the cathodic peak current and the square root of the scan rate for both Cu3L1 and Cu3L2, which is in good agreement with a diffusive species (ESI 6.2†).A deposition test with CV under 1 atm O2 indicated that after 1 scan, an ORR active deposit was formed (ESI 7.1†). However, the activity of this deposition was significantly lower than that for the catalyst solution. Moreover, electrochemical quartz crystal microbalance (EQCM) experiments were performed to quantify the amount of complex that was deposited during a CV experiment (ESI 7.2†) which showed that only 7.0 and 8.8 pmol cm−2 of Cu3L1 and Cu3L2 are deposited during one scan, respectively. Therefore, the effect of the deposit on the ORR catalysis during CV experiments was considered to be negligible.
Product selectivity determination
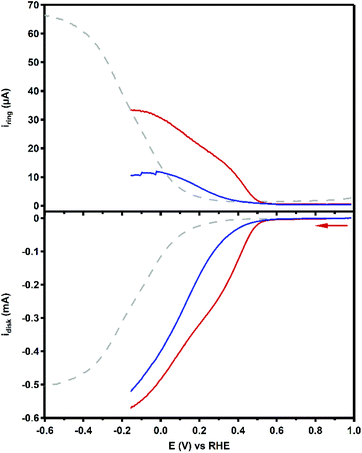
The product selectivity of the ORR catalyzed by Cu3L1 and Cu3L2 was investigated using a setup with a rotating ring disk electrode (RRDE).20 This was done by performing LSV at the GC disk and chronoamperometry (CA) at the Pt ring while rotating the RRDE at a speed of 1600 RPM. For both Cu3L1 and Cu3L2, LSV was performed between 1.0 and −0.15 V vs. the RHE, while CA at the ring was performed at 1.2 V vs. the RHE to be able to oxidize any H2O2 that is produced during ORR catalysis (Fig. 8). Since H2O2 is the product of the two-electron ORR, the presence of the Pt ring enables the determination of the product selectivity of the catalyzed ORR (ESI 8.2†).For the RRDE LSV measurements the ORR onset potential of Cu3L1 and Cu3L2 has been defined as the potential at which ic/iGC > 3, in which ic is the disk current observed during ORR catalysis performed by the catalyst and iGC is the disk current observed in the absence of the catalyst.19,20 For Cu3L1 and Cu3L2, this onset potential is located at 0.55 and 0.52 V vs. the RHE, respectively. Considering the reported ORR onset potential of 0.49 V vs. the RHE for Cu-bmpa, the overpotential for the ORR catalyzed by the trinuclear catalysts is slightly lower than the overpotential of Cu-bmpa.20 For Cu3L1, this slight decrease of 0.06 V for the overpotential reflects the slight positive shift in the E1/2 value of 0.07 V vs. the RHE compared to Cu-bmpa. However, this is not the case for Cu3L2; the slight decrease of 0.03 V for the overpotential does not reflect the large positive shift in the E1/2 value of 0.20 V vs. the RHE compared to Cu-bmpa.
The RRDE LSV data of Cu3L1 and Cu3L2 show maximum catalytic disk current (icat) values of 0.57 and 0.52 mA at −0.15 V vs. the RHE, respectively (Fig. 8). These values are similar to the reported icat value of 0.57 mA for Cu-bmpa at −0.15 V vs. the RHE.20 Just like for Cu-bmpa, an increase in the ring current is observed with decreasing applied disk potential for both Cu3L1 and Cu3L2. This indicates that both catalysts produce H2O2 along the entire potential window in which the ORR takes place.
To quantify the formation of H2O2 along the potential regime for ORR catalysis, the percentage of H2O2 produced during ORR catalysis (%H2O2) was determined according to the following equation:
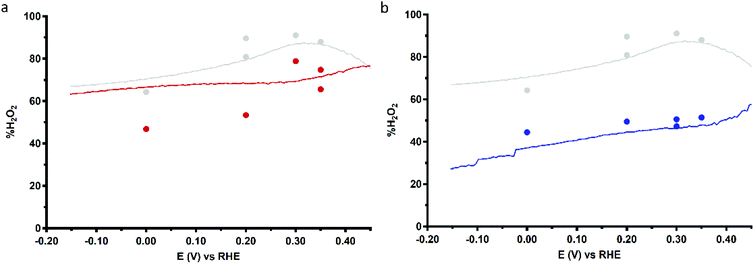
Fig. 9 shows the %H2O2 values along the potential regime for ORR catalysis by Cu3L1 and Cu3L2 obtained from the RRDE LSV data. For Cu3L1, the percentage of H2O2 produced during ORR catalysis remains relatively stable with a slight decrease from ∼76% near the ORR onset potential to ∼63% at −0.15 V vs. the RHE (Fig. 9a). These values are comparable to the reported %H2O2 values for Cu-bmpa.20 For Cu3L2, the initial %H2O2 of ∼58% near the ORR onset potential decreases more rapidly to ∼27% at −0.15 V vs. the RHE (Fig. 9b). This %H2O2 value of ∼27% observed for Cu3L2 at −0.15 V vs. the RHE is significantly lower than the observed %H2O2 values for Cu3L1 and Cu-bmpa.
Additionally, the values for %H2O2 were determined by RRDE CA measurements as a function of time. These RRDE CA measurements were performed at applied disk potentials of 0.35, 0.30, 0.20 and 0.0 V vs. the RHE for 5 minutes (ESI 8.3†). As shown in Fig. 9b, the %H2O2 values obtained from the RRDE CA data of Cu3L2 correlate well with the values obtained from the RRDE LSV data. However, the %H2O2 values obtained from the RRDE CA data of Cu3L1 at applied disk potentials of 0.0 and 0.20 V vs. the RHE are significantly lower than the values obtained from the RRDE LSV data (Fig. 9a). These observations are concomitant with an increase of the disk current and a decrease of the ring current over time during CA. This points to the formation of Cu0 at the electrode surface which catalyzes the 4-electron reduction of dioxygen, as we have observed previously for Cu-bmpa (ESI 8.3†).20 The involvement of Cu0 in the LSV experiments can be excluded on the basis of the aforementioned dipping and microbalance experiments (ESI 7†). Overall, it can therefore be concluded that Cu3L1 has a comparable product selectivity to Cu-bmpa, while Cu3L2 has a much higher selectivity for the 4-electron process.
H2O2 reduction behavior
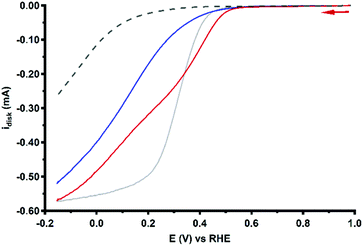
As discussed in the previous section, the RRDE LSV data of both Cu3L1 and Cu3L2 result in %H2O2 values above zero along the entire ORR active potential window. This means that both complexes do not catalyze the full four-electron ORR in the investigated potential window. However, since there is also no complete H2O2 selectivity, limitations seem to arise after the initial two-electron reduction of O2 to H2O2. Therefore, the H2O2 reduction behavior of both Cu3L1 and Cu3L2 was investigated by performing rotating disk electrode (RDE) measurements in phosphate buffer containing 1.1 mM H2O2 (Fig. 10). The H2O2 concentration amounted to 1.1 mM in order to reproduce the concentration of O2 in O2 saturated 0.1 M pH 7 phosphate buffer.20,70–72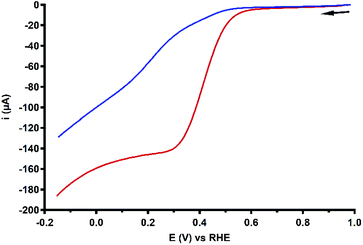 | ||
| Fig. 10 RDE LSV curves of 0.1 mM Cu3L1 (red) and Cu3L2 (blue) in the presence of 1.1 mM H2O2 under 1 atm Ar. Conditions: 0.1 M pH 7 phosphate buffer, 293 K, GC disk, 1600 RPM, 50 mV s−1 scan rate. | ||
The H2O2 reduction profile obtained by RDE measurements for both Cu3L1 and Cu3L2 did not show the presence of a mass-transport limiting current plateau between 1.0 and −0.15 V vs. the RHE, which we expect to find at 400 μA according to the Levich equation (ESI 6.3†). This absence of a mass-transport limiting current plateau confirms that the H2O2 reduction by these trinuclear catalysts must be a relatively slow process, which was shown for Cu-bmpa and Cu-terpy previously as well.20,39
Upon addition of 1.1 mM H2O2 to the Cu3L2 solution in aqueous phosphate buffer, a change in the color and more specifically a change in the UV-Vis spectrum were observed (Fig. S13†). For the triethylbenzene ligand it has been observed previously that oxygen reactivity can induce an aromatic ligand hydroxylation reaction involving an NIH-shift of one of the ethyl substituents on the benzene spacer.41,42,50 To investigate if this is also induced by H2O2, the ligand was recovered from the complex upon treatment with a strong acid and EDTA to bind the free Cu ions after the exposure of Cu3L2 to H2O2 (ESI 9.2†). Spectroscopy analysis does not suggest a shift of the ethyl substituent as was previously observed. The exact nature of the final structure could not be determined, but the absence of ligand oxidation for Cu3L1 after the addition of H2O2 suggests that the benzylic ethyl–CH2 substituents of L2 are prone to oxidation upon exposure of Cu3L2 to high concentrations of H2O2.73
An overview of the electrochemical characteristics of Cu3L1, Cu3L2 and Cu-bmpa is given in Table 1.
| Cu-bmpa 20 | Cu3L1 | Cu3L2 | |
|---|---|---|---|
| E 1/2 (V vs. RHE) | 0.30 | 0.37 | 0.50 |
| ΔEp (mV) | 56 | 105 | 90 |
| Diffusion coefficient (cm2 s−1) | 2.1 × 10⁻⁶ | 8.6 × 10⁻⁷ | 4.8 × 10⁻⁷ |
| E cat/2 (V vs. RHE) | 0.37 | 0.37 | 0.33 |
| RRDE onset (V vs. RHE) | 0.49 | 0.55 | 0.52 |
| %H2O2 at onset | 75 | 76 | 58 |
Discussion
There are four factors that have been considered during this work: the nature of the active species, the selectivity of the reaction, the efficiency of the Cu-mediated ORR, and the catalytic stability of Cu3L1 and Cu3L2.Active species
The active species during the ORR catalysis by Cu3L1 and Cu3L2 are the reduced molecular species of these complexes. The deposition tests and RRDE experiments under Ar illustrate that both Cu3L1 and Cu3L2 do deposit on the electrode surface to some extent, yet that the activities of these deposits are negligible. This was confirmed by the low deposited mass found by the EQCM experiments. Also, during CA for several minutes under rotating conditions we did not see an increase of the catalytic activity, unless potentials below 0.2 V vs. RHE were applied. Under these conditions we see a clear build-up of Cu0, which is directly visualized by a decrease in %H2O2 for Cu3L1 at these potentials, due to the 4-electron ORR on metallic copper. We do not see these effects in the LSV curves and at prolonged CA above 0.2 V vs. the RHE for both complexes. The formation of substantial amounts of Cu0 requires time and negative potentials, which we have reported previously in a study concerning Cu-bmpa.20 It is therefore likely that the catalytic activity displayed in the LSV curves is due to the ORR mediated by the homogeneous active species of Cu3L1 and Cu3L2.Selectivity
During the ORR three reactions can occur, namely the direct 4-electron reduction of oxygen to water, the 2-electron reduction of oxygen to H2O2, and the subsequent reduction of H2O2 to water.19,39 During the direct 4-electron mechanism, no H2O2 is evolved, while H2O2 is formed as an obligatory intermediate in a [2 + 2]-stepwise mechanism.Directly from the onset of the catalytic wave the determined %H2O2 is significantly lower with Cu3L2 compared to that with Cu3L1 in the LSV RRDE experiments. In the case of Cu-tmpa we have shown that the build-up of hydrogen peroxide is directly affected by the relative rates between the two electron reduction of dioxygen versus the reduction of hydrogen peroxide, and by their relative concentration near the electrode surface.19,39 In the case of Cu-tmpa this leads to a build-up of hydrogen peroxide, unless the oxygen reduction reaction becomes mass transport limited in oxygen. In the case of Cu3L1 and Cu3L2 mass transport limitations do not seem to play a role and consequently these catalysts produce hydrogen peroxide over the entire potential domain in the LSV curves. Whereas the oxygen reduction rates of Cu3L1 and Cu3L2 are fairly similar, there appears to be a significant difference between the LSV curves of Cu3L1 and Cu3L2 in the presence of H2O2, with Cu3L2 being the slower catalyst (Fig. 10).
The slower H2O2 reduction by Cu3L2 is inconsistent with the lower %H2O2 observed for this catalyst, compared to Cu-bmpa and Cu3L1 (Fig. 9). This indicates that the selectivity must be due to other reasons besides the relative rates of the ORR versus the hydrogen peroxide reduction reaction (HPRR). In other words, Cu3L2 must carry out the ORR in a different manner compared to Cu3L1 and Cu-bmpa. The low %H2O2 for Cu3L2 suggests that the selectivity is not a product from freely exchanging H2O2 from the coordination sphere of the trinuclear center, but instead must be due to a cooperative effect. Two modes of cooperation may occur. The cooperative effect might be caused by the trinuclear copper site at Cu3L2 to operate in a similar manner to laccase and facilitate a direct 4-electron reduction reaction leading to a transformation of dioxygen to water without the intermediacy of hydrogen peroxide. However, since H2O2 is still formed along the entire measured potential regime, this is not likely to be the sole form of cooperation. Most likely the improved selectivity of Cu3L2 towards the overall four electron reduction of dioxygen is that it is difficult for hydrogen peroxide to effectively dissociate from the trinuclear copper site of Cu3L2, resulting in the alternating reduction of O2 and H2O2 at the catalytic site. We anticipate that this is an effect of the three Cu centers being positioned in close proximity to each other, making the probability of H2O2 to diffuse from the catalytic pocket lower.
Efficiency
Due to considerable uncertainty regarding the number of involved Cu centers during ORR catalysis performed by Cu3L1 and Cu3L2, quantitative methods to determine the turnover frequencies of the catalysts such as the foot-of-the-wave analysis (FOWA) and the catalytic current enhancement methods cannot be performed without making substantial assumptions.74–78 However, a qualitative description can be put forward by comparison of the RDE LSV profiles obtained during ORR catalysis. Specifically a comparison of the steepness of the ORR profiles provides more insight into the relative catalytic rate. The RDE LSV profiles for ORR catalysis performed by Cu3L1, Cu3L2 and Cu-bmpa are depicted in Fig. 11.20 The reductive current for the ORR profile of Cu3L1 increases faster than for the ORR profile of Cu3L2, especially between the onset potential and ∼0.3 V vs. the RHE. This indicates that the rate for ORR catalysis is higher for Cu3L1. Additionally, a comparison with the RDE LSV profile for ORR catalysis performed by Cu-bmpa reveals a slower increase in the reductive current for the ORR profiles of the trinuclear catalysts compared to the mononuclear catalyst above ∼0.2 V vs. the RHE.20 This indicates that the turnover frequencies of the trinuclear catalysts are substantially lower than those of the mononuclear systems reported previously.20There are several possible explanations for the slow catalysis in these complexes. One reason might be found in the reorganization energy associated with the change of the oxidation state of the Cu ions.79,80 According to the Marcus theory the rates of electron transfer reactions are affected by their accompanying reorganization energies.81 This largely relates to the ability of the ligands to accommodate the metal site at multiple oxidation states, and to switch between the different preferred geometries via facile transitions. It is therefore expected that slow electron transfer kinetics and consecutive slow ORR catalysis are the result of large structural reorganization barriers during the formation of the fully reduced state of Cu3L1 and Cu3L2. Due to the steric hindrance by the relatively close proximity of the Cu-bmpa sites of Cu3L2 to one another compared to the Cu-bmpa sites of Cu3L1, this effect is more pronounced in Cu3L2. The lower catalytic currents may also be caused by the lower diffusion rate of the trinuclear complexes compared to for example Cu-bmpa (Table 1). This results in a relatively low number of catalytic sites being reduced by the cathode compared to those in the case of catalysts with higher diffusion constants.
Stability
With UV-Vis spectroscopy we have shown that both Cu3L1 and Cu3L2 are stable over prolonged time in a 0.1 M pH 7 phosphate buffer. Moreover, the UV-Vis measurement results before and after ORR experiments remained unchanged. However, at high H2O2 concentration, the trinuclear complex Cu3L2 suffers from intrinsic stability problems. It seems that in particular the ethylene functionalities that force all three copper sites towards the same plane of the aromatic node of L2 are susceptible towards intramolecular oxidation reactions in the presence of millimolar concentrations of hydrogen peroxide.82,83 However, this structural change for Cu3L2 was only observed upon addition of large quantities of H2O2 and was not observed during ORR catalysis, where high concentrations of peroxide were avoided. Therefore, this structural change upon H2O2 addition is not expected to play a role in ORR catalysis.Conclusions
We have studied the effect of cooperativity between two or three copper sites on the catalytic activity and selectivity of the ORR. Although the catalytic currents are lower than those for freely rotating and diffusing single site complexes, our results show that the selectivity of the copper mediated ORR was significantly enhanced towards the overall 4-electron process due to a cooperative effect between three copper sites that have been positioned in close proximity.Conflicts of interest
There are no conflicts to declare.Acknowledgements
The authors gratefully acknowledge the Magnetism Competence Center at the Jean Lamour Institute in Nancy, France for the support during SQUID measurements.Financial support was provided by the European Research Council (ERC starting grant 637556 Cu4Energy to D. G. H. H.).
References
- D. G. Nocera, ChemSusChem, 2009, 2, 387–390 CrossRef CAS PubMed.
- A. Kirubakaran, S. Jain and R. K. Nema, Renewable Sustainable Energy Rev., 2009, 13, 2430–2440 CrossRef CAS.
- S. Shiva Kumar and V. Himabindu, Mater. Sci. Energy Technol., 2019, 2, 442–454 Search PubMed.
- C. Song and J. Zhang, in PEM Fuel Cell Electrocatalysts and Catalyst Layers, ed. J. Zhang, Springer, London, UK, 2008, pp. 89–134 Search PubMed.
- Z. W. Seh, J. Kibsgaard, C. F. Dickens, I. Chorkendorff, J. K. Nørskov and T. F. Jaramillo, Science, 2017, 355, eaad4998 CrossRef PubMed.
- K. L. Hsueh, D. T. Chin and S. Srinivasan, J. Electroanal. Chem. Interfacial Electrochem., 1983, 153, 79–95 CrossRef CAS.
- Y. Wang, D. F. Ruiz Diaz, K. S. Chen, Z. Wang and X. C. Adroher, Mater. Today, 2020, 32, 178–203 CrossRef CAS.
- P. Giardina, V. Faraco, C. Pezzella, A. Piscitelli, S. Vanhulle and G. Sannia, Cell. Mol. Life Sci., 2010, 67, 369–385 CrossRef CAS PubMed.
- H. Komori and Y. Higuchi, J. Biochem., 2015, 158, 293–298 CrossRef CAS PubMed.
- E. I. Solomon, A. J. Augustine and J. Yoon, Dalton Trans., 2008, 1, 3921–3932 RSC.
- S. M. Jones and E. I. Solomon, Cell. Mol. Life Sci., 2015, 72, 869–883 CrossRef CAS PubMed.
- M. R. Tarasevich, A. I. Yaropolov, V. A. Bogdanovskaya and S. D. Varfolomeev, J. Electroanal. Chem. Interfacial Electrochem., 1979, 104, 393–403 CrossRef.
- V. Soukharev, N. Mano and A. Heller, J. Am. Chem. Soc., 2004, 126, 8368–8369 CrossRef CAS PubMed.
- M. S. Thorum, C. A. Anderson, J. J. Hatch, A. S. Campbell, N. M. Marshall, S. C. Zimmerman, Y. Lu and A. A. Gewirth, J. Phys. Chem. Lett., 2010, 1, 2251–2254 CrossRef CAS PubMed.
- M. J. Moehlenbrock and S. D. Minteer, Chem. Soc. Rev., 2008, 37, 1188–1196 RSC.
- C. J. Cramer and W. B. Tolman, Acc. Chem. Res., 2007, 40, 601–608 CrossRef CAS PubMed.
- S. Kakuda, R. L. Peterson, K. Ohkubo, K. D. Karlin and S. Fukuzumi, J. Am. Chem. Soc., 2013, 135, 6513–6522 CrossRef CAS PubMed.
- S. Itoh, Acc. Chem. Res., 2015, 48, 2066–2074 CrossRef CAS PubMed.
- M. Langerman and D. G. H. Hetterscheid, Angew. Chem., Int. Ed., 2019, 58, 12974–12978 CrossRef CAS PubMed.
- N. W. G. Smits, B. van Dijk, I. de Bruin, S. L. T. Groeneveld, M. A. Siegler and D. G. H. Hetterscheid, Inorg. Chem., 2020, 59, 16398–16409 CrossRef CAS PubMed.
- H. Oh, S. Choi, J. Y. Kim, H. S. Ahn and S. Hong, Chem. Commun., 2019, 55, 12659–12662 RSC.
- P. Vasudevan, Santosh, N. Mann and S. Tyagi, Transition Met. Chem., 1990, 15, 81–90 CrossRef CAS.
- S. Fukuzumi, H. Kotani, H. R. Lucas, K. Doi, T. Suenobu, R. L. Peterson and K. D. Karlin, J. Am. Chem. Soc., 2010, 132, 6874–6875 CrossRef CAS PubMed.
- M. S. Thorum, J. Yadav and A. A. Gewirth, Angew. Chem., Int. Ed., 2009, 48, 165–167 CrossRef CAS PubMed.
- G. A. Goenaga, A. Belapure, C. Zhang, A. Papandrew, S. Foister and T. Zawodzinski, ECS Trans., 2011, 41, 1193–1205 CrossRef CAS.
- M. Kato, N. Oyaizu, K. Shimazu and I. Yagi, J. Phys. Chem. C, 2016, 120, 15814–15822 CrossRef CAS.
- R. Venegas, K. Munoz-Becerra, L. Lemus, A. Toro-Labbe, J. H. Zagal and F. J. Recio, J. Phys. Chem. C, 2019, 123, 19468–19478 CrossRef CAS.
- J. Zhang and F. C. Anson, Electrochim. Acta, 1993, 38, 2423–2429 CrossRef CAS.
- C. C. L. McCrory, X. Ottenwaelder, T. D. P. Stack and C. E. D. Chidsey, J. Phys. Chem. A, 2007, 111, 12641–12650 CrossRef CAS PubMed.
- L. M. Mirica, X. Ottenwaelder and T. D. P. Stack, Chem. Rev., 2004, 104, 1013–1046 CrossRef CAS PubMed.
- E. A. Lewis and W. B. Tolman, Chem. Rev., 2004, 104, 1047–1076 CrossRef CAS PubMed.
- S. Hong, Y.-M. Lee, K. Ray and W. Nam, Coord. Chem. Rev., 2017, 334, 25–42 CrossRef CAS.
- C. E. Elwell, N. L. Gagnon, B. D. Neisen, D. Dhar, A. D. Spaeth, G. M. Yee and W. B. Tolman, Chem. Rev., 2017, 117, 2059–2107 CrossRef CAS PubMed.
- M. A. Thorseth, C. E. Tornow, E. C. M. Tse and A. A. Gewirth, Coord. Chem. Rev., 2013, 257, 130–139 CrossRef CAS.
- J. A. Halfen, S. Mahapatra, E. C. Wilkinson, S. Kaderli, V. G. Young, L. Que, A. D. Zuberbühler and W. B. Tolman, Science, 1996, 271, 1397 CrossRef CAS PubMed.
- B. van Dijk, J. P. Hofmann and D. G. H. Hetterscheid, Phys. Chem. Chem. Phys., 2018, 20, 19625–19634 RSC.
- J. Serrano-Plana, I. Garcia-Bosch, A. Company and M. Costas, Acc. Chem. Res., 2015, 48, 2397–2406 CrossRef CAS PubMed.
- L. Tahsini, H. Kotani, Y.-M. Lee, J. Cho, W. Nam, K. D. Karlin and S. Fukuzumi, Chem. – Eur. J., 2012, 18, 1084–1093 CrossRef CAS PubMed.
- M. Langerman and D. G. H. Hetterscheid, ChemElectroChem, 2021, 8, 2783–2791 CrossRef CAS PubMed.
- S. Fukuzumi, Y.-M. Lee and W. Nam, ChemCatChem, 2018, 10, 9–28 CrossRef CAS.
- K. D. Karlin, Q. F. Gan, A. Farooq, S. Liu and J. Zubieta, Inorg. Chem., 1990, 29, 2549–2551 CrossRef CAS.
- K. D. Karlin, Q.-F. Gan and Z. Tyeklár, Chem. Commun., 1999, 1, 2295–2296 RSC.
- E. Y. Tsui, M. W. Day and T. Agapie, Angew. Chem., Int. Ed., 2011, 50, 1668–1672 CrossRef CAS PubMed.
- D. Maiti, J. S. Woertink, R. A. Ghiladi, E. I. Solomon and K. D. Karlin, Inorg. Chem., 2009, 48, 8342–8356 CrossRef CAS PubMed.
- D. Lionetti, M. W. Day and T. Agapie, Chem, 2013, 4, 785–790 CAS.
- E. C. M. Tse, D. Schilter, D. L. Gray, T. B. Rauchfuss and A. A. Gewirth, Inorg. Chem., 2014, 53, 8505–8516 CrossRef CAS PubMed.
- X. Engelmann, E. R. Farquhar, J. England and K. Ray, Inorg. Chim. Acta, 2018, 481, 159–165 CrossRef CAS.
- N. Thiyagarajan, D. Janmanchi, Y. F. Tsai, W. H. Wanna, R. Ramu, S. I. Chan, J. M. Zen and S. S. F. Yu, Angew. Chem., Int. Ed., 2018, 57, 3612–3616 CrossRef CAS PubMed.
- E. Salvadeo, L. Dubois and J.-M. Latour, Coord. Chem. Rev., 2018, 374, 345–375 CrossRef CAS.
- H. Ohi, Y. Tachi and S. Itoh, Inorg. Chem., 2006, 45, 10825–10835 CrossRef CAS PubMed.
- E. C. Brown, B. Johnson, S. Palavicini, B. E. Kucera, L. Casella and W. B. Tolman, Dalton Trans., 2007, 1, 3035–3042 RSC.
- A. M. Geer, C. Musgrave Iii, C. Webber, R. J. Nielsen, B. A. McKeown, C. Liu, P. P. M. Schleker, P. Jakes, X. Jia, D. A. Dickie, J. Granwehr, S. Zhang, C. W. Machan, W. A. Goddard and T. B. Gunnoe, ACS Catal., 2021, 11, 7223–7240 CrossRef CAS.
- K. D. Karlin, Q. F. Gan, A. Farooq, S. Liu and J. Zubieta, Inorg. Chem., 1990, 29, 2549–2551 CrossRef CAS.
- C. Walsdorff, S. Park, J. Kim, J. Heo, K.-M. Park, J. Oh and K. Kim, Dalton Trans., 1999, 1, 923–930 RSC.
- M. Komiyama, S. Kina, K. Matsumura, J. Sumaoka, S. Tobey, V. M. Lynch and E. Anslyn, J. Am. Chem. Soc., 2002, 124, 13731–13736 CrossRef CAS PubMed.
- Y. Zhao, J. Zhu, W. He, Z. Yang, Y. Zhu, Y. Li, J. Zhang and Z. Guo, Chem. – Eur. J., 2006, 12, 6621–6629 CrossRef CAS PubMed.
- N. F. Chilton, R. P. Anderson, L. D. Turner, A. Soncini and K. S. Murray, J. Comput. Chem., 2013, 34, 1164–1175 CrossRef CAS PubMed.
- Z. Boulsourani, V. Tangoulis, C. P. Raptopoulou, V. Psycharis and C. Dendrinou-Samara, Dalton Trans., 2011, 40, 7946–7956 RSC.
- D. J. Iverson, G. Hunter, J. F. Blount, J. R. Damewood and K. Mislow, J. Am. Chem. Soc., 1981, 103, 6073–6083 CrossRef CAS.
- J. C. Barnes, J. A. Chudek, G. Hunter, A. J. Blake, P. J. Dyson, B. F. G. Johnson and W. Weissensteiner, J. Chem. Soc., Faraday Trans., 1995, 91, 2149–2153 RSC.
- V. Marks, H. E. Gottlieb, A. Melman, G. Byk, S. Cohen and S. E. Biali, J. Org. Chem., 2001, 66, 6711–6718 CrossRef CAS PubMed.
- W. Weissensteiner, A. Gutierrez, M. D. Radcliffe, J. Siegel, M. D. Singh, P. J. Tuohey and K. Mislow, J. Org. Chem., 1985, 50, 5822–5827 CrossRef CAS.
- S. Choksakulporn, A. Punkvang and Y. Sritana-Anant, J. Mol. Struct., 2015, 1082, 97–102 CrossRef CAS.
- N. Elgrishi, K. J. Rountree, B. D. McCarthy, E. S. Rountree, T. T. Eisenhart and J. L. Dempsey, J. Chem. Educ., 2018, 95, 197–206 CrossRef CAS.
- M. J. Powers and T. J. Meyer, J. Am. Chem. Soc., 1978, 100, 4393–4398 CrossRef CAS.
- J. E. Sheats, R. S. Czernuszewicz, G. C. Dismukes, A. L. Rheingold, V. Petrouleas, J. Stubbe, W. H. Armstrong, R. H. Beer and S. J. Lippard, J. Am. Chem. Soc., 1987, 109, 1435–1444 CrossRef CAS.
- M. M. Morrison and D. T. Sawyer, J. Am. Chem. Soc., 1977, 99, 257–258 CrossRef CAS.
- R. Lomoth, P. Huang, J. Zheng, L. Sun, L. Hammarström, B. Åkermark and S. Styring, Eur. J. Inorg. Chem., 2002, 2002, 2965–2974 CrossRef.
- R. Zhou, Y. Zheng, M. Jaroniec and S.-Z. Qiao, ACS Catal., 2016, 6, 4720–4728 CrossRef CAS.
- A. Schumpe, I. Adler and W.-D. Deckwer, Biotechnol. Bioeng., 1978, 20, 145–150 CrossRef CAS.
- D. Tromans, Ind. Eng. Chem. Res., 2000, 39, 805–812 CrossRef CAS.
- W. Xing, M. Yin, Q. Lv, Y. Hu, C. Liu and J. Zhang, Rotating Electrode Methods and Oxygen Reduction Electrocatalysts, Elsevier, Amsterdam, 2014, pp. 1–31 Search PubMed.
- M. M. Rahman, M. G. Ara, M. S. Rahman, M. S. Uddin, M. N. Bin-Jumah and M. M. Abdel-Daim, J. Nanomater., 2020, 2020, 1–20 CrossRef.
- C. Costentin, S. Drouet, M. Robert and J. M. Saveant, J. Am. Chem. Soc., 2012, 134, 19949–19950 CrossRef CAS.
- E. S. Rountree, B. D. McCarthy, T. T. Eisenhart and J. L. Dempsey, Inorg. Chem., 2014, 53, 9983–10002 CrossRef CAS PubMed.
- C. Costentin and J. M. Saveant, ChemElectroChem, 2014, 1, 1226–1236 CrossRef CAS.
- D. J. Wasylenko, C. Rodriguez, M. L. Pegis and J. M. Mayer, J. Am. Chem. Soc., 2014, 136, 12544–12547 CrossRef CAS PubMed.
- A. M. Appel and M. L. Helm, ACS Catal., 2014, 4, 630–633 CrossRef CAS.
- E. Garribba and G. Micera, J. Chem. Educ., 2006, 83, 1229–1232 CrossRef CAS.
- E. W. Dahl and N. K. Szymczak, Angew. Chem., Int. Ed., 2016, 55, 3101–3105 CrossRef CAS PubMed.
- R. A. Marcus, Rev. Mod. Phys., 1993, 65, 599–610 CrossRef CAS.
- S. Mahapatra, V. G. Young, S. Kaderli, A. D. Zuberbuhler and W. B. Tolman, Angew. Chem., Int. Ed. Engl., 1997, 36, 130–133 CrossRef CAS.
- S. Mahapatra, J. A. Halfen and W. B. Tolman, J. Am. Chem. Soc., 1996, 118, 11575–11586 CrossRef CAS.
Footnote |
| † Electronic supplementary information (ESI) available. CCDC 2099322 for Cu3L1. For ESI and crystallographic data in CIF or other electronic format see DOI: 10.1039/d1dt03296h |
| This journal is © The Royal Society of Chemistry 2022 |

