 Open Access Article
Creative Commons Attribution 3.0 Unported Licence
Synthesis and size-dependent spin crossover of coordination polymer [Fe(Htrz)2(trz)](BF4)†
Shiraz Ahmed
Siddiqui
 a,
Oleg
Domanov
 a,
Erhard
Schafler
a,
Jana
Vejpravova
a,
Erhard
Schafler
a,
Jana
Vejpravova
 b and
Hidetsugu
Shiozawa
 *ac
*ac
aFaculty of Physics, University of Vienna, Boltzmanngasse 5, Vienna, Austria. E-mail: hidetsugu.shiozawa@univie.ac.at; Fax: +43-1-4277-9726; Tel: +43-1-4277-72601
bDepartment of Condensed Matter Physics, Charles University, Ke Karlovu 5, Prague, Czech Republic
cJ. Heyrovsky Institute of Physical Chemistry, Czech Academy of Sciences, Dolejskova 3, Prague, Czech Republic
First published on 8th December 2020
Abstract
The synthesis of quality single crystals is central to materials chemistry for optical, magnetic, and electronic device applications. The present work reports on the synthesis of single crystals of iron-triazole coordination polymer [Fe(Htrz)2(trz)](BF4) where (Htrz) = 1H-1,2,4-triazole. Crystals of size as long as 80 μm can be achived by controlling the temperature, precursor concentration, and solvent type. It is found that its thermal spin crossover depends largely on the crystal size. Fine crystals are ideal for depositing a thin film that exhibits redox activity. The largest crystals allow reliable electrical conductance measurements that reveal two different activation energies at the low spin state and the high spin state, which are one order of magnitude smaller than the electronic gaps calculated based on density functional theory. The synthetic route sought in the present study can be applied to other coordination polymers and related materials and provides the basis for their applications.
1 Introduction
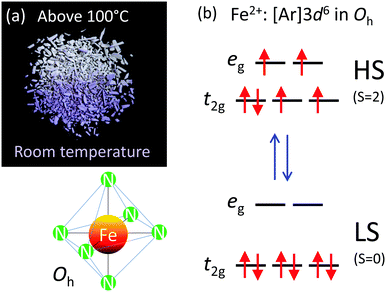
Spin crossover or spin transition is a phenomenon wherein a molecular complex changes its form from a low-spin (LS) state to a high-spin (HS) state under the influence of external factors such as temperature, pressure or external stimuli.1 This very attractive phenomenon occurs in octahedral complexes of 3d4–3d7 first row transition metal ions; Cr(II), Mn(III), Fe(III), Mn(II), Fe(II), Co(III) and Co(II). They are stable in both LS and HS states and thus, the two states co-exist at equilibrium. This gives rise to molecular bistability accompanied by thermal hysteresis and chromism, which provides the impetus for technological applications such as data storage and memory devices2 and display devices.3 The spin crossover can also be brought about by light irradiation i.e. light-induced excited spin state trapping (LIESST) and reverse LIESST. This was successfully implemented in optical data storage and processing devices.4–6 Spin-crossover materials are central to some of the neat technologies such as pressure-controlled conductivity (piezoelectric effect)7 photoconduction, molecular switches, memory devices, etc.8–10 The development in the field of supramolecular structures, covalent organic frameworks, molecular organic frameworks, and their tendency to exhibit spin crossover11–15 have revived the research in this field.The present work aims to understand the synthesis and size-dependent spin crossover of a Fe(II) coordination polymer, [Fe(Htrz)2(trz)](BF4) (see Fig. 1). In [Fe(Htrz)2(trz)](BF4), Fe(II) having six electrons in the 3d shell is coordinated to three pairs of nitrogen atoms of 1,2,4-triazole in an octahedral geometry. The 3d orbitals are split to the t2g and eg levels (see Fig. 2). In the LS state, the ligand field stabilizing energy is greater than the pairing energy, hence the electrons pair-up to fully occupy the t2g level, whereas in the HS state the ligand splitting is smaller as compared to the pairing energy, hence the electrons occupy the d orbitals according to Hund*s rule of maximum multiplicity. Upon a LS-to-HS transition, two electrons are transferred from the t2g subshell to the eg subshell as the Fe–N bond length increases.8,10,13
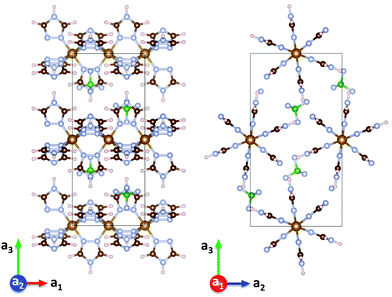 | ||
| Fig. 1 Crystal structure of [Fe(Htrz)2(trz)](BF4) viewed along the a2 axis (left) and along the a1 axis (right), reproduced from structure files.16 | ||
A series of systematic synthesis is presented to realise the dependence of the crystal size on the precursor concentration, temperature, and the type of solvent. It is found that much larger crystals are synthesised in water than in methanol. The length of crystalline needles can become as long as 80 μm by introducing a temperature gradient.
The phenomenon of spin crossover is accompanied by a change in color on heating, referred to as thermochromism. The color of [Fe(Htrz)2(trz)](BF4) changes from purple in the LS state to white in the HS state (see Fig. 2a and Video S1, ESI†), which is attributed to spectral changes in UV-vis absorption.
Raman spectroscopy shows vibrational modes characteristic for the reported structure and their changes upon spin crossover as the temperature is increased from room temperature to 375 K. It is demonstrated that both spin transition temperature and hysteresis increase monotonically as the crystal size increases.
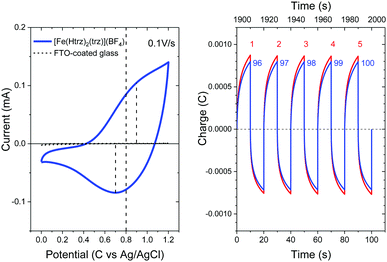
Drop-casting nanocrystalline powder in methanol can form homogeneous thin films with excellent adhesion to FTO-coated glass. The electrochemical analysis elucidates their redox activity which signifies its potential in a range of electronic and energy applications.
Finally, recent studies reported decent electrical conductance of nano- and micro-crystalline [Fe(Htrz)2(trz)](BF4) that exhibited thermal hysteresis coinciding with their magnetic hysteresis. Our homogeneously long crystals are large enough to bridge standard source–drain electrodes that allow reliable measurements. We demonstrate that the temperature dependence of the electrical conductance follows the Arrhenius equation with an activation energy of 0.12 eV (0.24 eV) below (above) 384 K with no thermal hysteresis. The activation energies are one order of magnitude smaller than the energy gaps calculated based on the density functional theory taking the derivative discontinuity of the exchange–correlation energy into account, indicating a conduction mechanism defined by the carrier injection barrier or defect levels.
2 Results and discussion
2.1 Synthesis
A systematic series of synthesis in water has been carried out in order to realise crystals of different dimensions and dependencies on the precursor concentration (C) and the temperature (T). A molar ratio of [Fe(BF4)2·6H2O]![[thin space (1/6-em)]](https://www.rsc.org/images/entities/char_2009.gif) :
:![[thin space (1/6-em)]](https://www.rsc.org/images/entities/char_2009.gif) [triazole] = 1
[triazole] = 1![[thin space (1/6-em)]](https://www.rsc.org/images/entities/char_2009.gif) :
:![[thin space (1/6-em)]](https://www.rsc.org/images/entities/char_2009.gif) 3 was maintained in the entire synthesis. Fig. 3 shows the optical micrographs of crystals prepared at T = 45 °C with different precursor concentrations in the range C = 0.2–0.4 M of Fe(BF4)2·6H2O. No large crystals are grown at concentrations out of the range presented. It is observed that the crystalline needles become thicker as the concentration is increased. At 45 °C, the length extends as the concentration is increased from C = 0.2 to 0.25 M, and then it gets shorter as the concentration is increased further to 0.4 M. With C = 0.5 M or higher no large crystals are grown. The size homogeneity tends to degrade by increasing the concentration.
3 was maintained in the entire synthesis. Fig. 3 shows the optical micrographs of crystals prepared at T = 45 °C with different precursor concentrations in the range C = 0.2–0.4 M of Fe(BF4)2·6H2O. No large crystals are grown at concentrations out of the range presented. It is observed that the crystalline needles become thicker as the concentration is increased. At 45 °C, the length extends as the concentration is increased from C = 0.2 to 0.25 M, and then it gets shorter as the concentration is increased further to 0.4 M. With C = 0.5 M or higher no large crystals are grown. The size homogeneity tends to degrade by increasing the concentration.
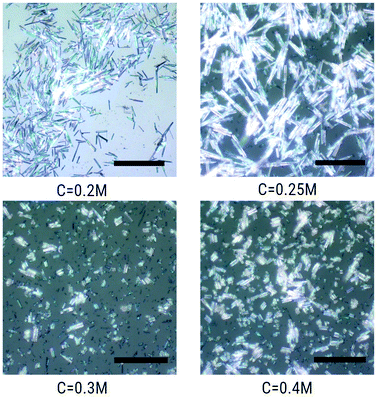 | ||
| Fig. 3 Optical micrographs of [Fe(Htrz)2(trz)](BF4) crystals synthesized in water at 45 °C with Fe(BF4)2·6H2O concentrations of 0.2, 0.25, 0.3 and 0.4 M in water. Scale bars correspond to 50 μm. | ||
Fig. 4 shows the crystals synthesised with the concentration fixed at C = 0.3 M in the temperature range of 50–70 °C. The crystalline needles became longer and thicker with the increasing temperature up to 60 °C. At higher temperatures (T = 70 °C) the crystals become much smaller. Furthermore, the crystals grow as large as 80 μm (see Fig. 5) with a temperature gradient around 45 °C (for more details, see the Methods section). To the best of our knowledge, no such large crystals of [Fe(Htrz)2(trz)](BF4) were previously synthesized. To summarise, the average crystal size depends largely on the reaction temperature and precursor concentration. It is found that the largest crystals are grown homogeneously at C = 0.3 M and 60 °C. By introducing a temperature gradient, the crystals can grow as long as 80 μm.
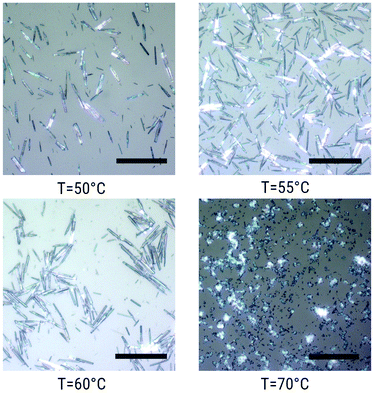 | ||
| Fig. 4 Optical micrographs of [Fe(Htrz)2(trz)](BF4) crystals synthesized in water at 50, 55, 60 and 70 °C with a Fe(BF4)2·6H2O concentration of 0.3 M. Scale bars correspond to 50 μm. | ||
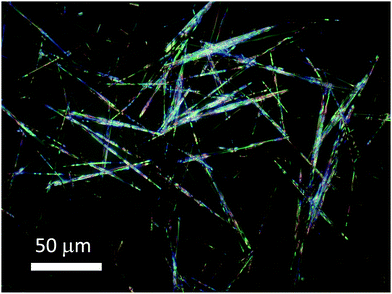 | ||
| Fig. 5 Optical micrograph of [Fe(Htrz)2(trz)](BF4) crystals synthesized in water with a temperature gradient around 45 °C with a Fe(BF4)2·6H2O concentration of 0.3 M. | ||
2.2 X-ray diffraction
The powder X-ray diffraction profiles of the well-crystalline sample (crystal) prepared at C = 0.3 M and 45 °C and the least-crystalline sample (powder) synthesized in methanol are plotted in Fig. 6. Both diffraction profiles exhibit all peaks characteristic of the LS state of [Fe(Htrz)2(trz)](BF4) reported previously,16–22 but not of [Fe(Htrz)3](BF4) which was often reported as an impurity.18,20 The lattice parameters obtained after Rietveld refinement match well with previously reported data.16,18 See ESI† for further details. The diffraction peaks of the powder are broader than those of the crystal, which can be attributed to much smaller crystallites. For detailed analysis, see ESI.†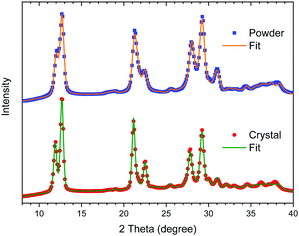 | ||
| Fig. 6 Powder X-ray diffraction profiles of the well-crystalline (crystal) and least-crystalline (powder) [Fe(Htrz)2(trz)](BF4) and the best-fits after Rietveld refinement. | ||
2.3 UV-vis spectroscopy
The UV-vis absorption spectra of the powder sample in the LS and HS states are compared in Fig. 7. The absorption peak centred at 2.3 eV2,23 disappears upon the transition from the LS state to the HS state. This changes the sample colour from purple to white (see Fig. 2a) and leads to a larger optical gap.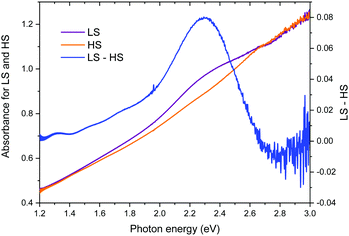 | ||
| Fig. 7 UV-vis absorption spectra of the powder [Fe(Htrz)2(trz)](BF4) in the LS and HS states. The difference spectrum (LS–HS) elucidates the absorption band centred at 2.3 eV in the LS state. | ||
2.4 Raman spectroscopy
Changes in the structure upon spin crossover can be probed by Raman spectroscopy. Fig. 8 shows the Raman spectra of the powder sample prepared in methanol measured at 298 and 375 K. Upon heating, the peaks at 136, 212 and 287 cm−1 indicated by the blue dashed vertical lines redshift to 106, 140 and 184 cm−1, respectively, similar to those previously reported in the literature.18 The band at 287 cm−1 corresponds to a well-defined Fe–N stretching vibrational mode.24 In the high-frequency region beyond 800 cm−1, the peak shifts are minor, but noticeable as represented by the red short dot lines. [Fe(Htrz)2(trz)](BF4) possess Htrz = 1H-1,2,4-triazole and trz = the deprotonated triazolato(−) ligands. The bands at 1058 and 1309 cm−1 of the LS state (1042 and 1296 cm−1 of the HS state) can be attributed to the Htrz and the bands at 1084 and 1283 cm−1 of the LS state (1065 and 1271 cm−1 of the HS state) to the trz.18 This excludes the presence of [Fe(Htrz)3](BF4) that was often reported as an impurity.18,20 All these changes are consistent with previous results18,24–32 and can be associated with the spin crossover. Upon a transition from the LS state to the HS state, the metal–ligand bond distance is extended as the ligand field is lowered and two electrons are transferred from the t2g orbitals to the eg orbitals. This leads to a lowering of metal–ligand stretching mode frequencies.18,24,26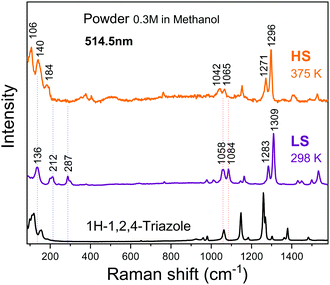 | ||
| Fig. 8 Raman spectra of the powder sample at 298 K (LS state) and 375 K (HS state), measured at a laser wavelength of λ = 514.5 nm. | ||
2.5 Magnetisation
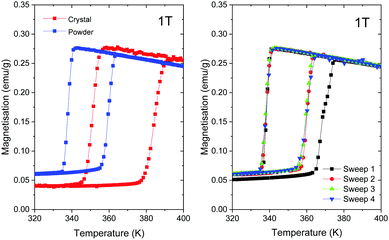
In the present work, we compare the magnetic properties of the best-crystalline sample synthesised in water at C = 0.3 M and T = 60 °C and the powder sample synthesised in methanol at C = 0.3 M and room temperature. The corresponding magnetisation data in the temperature range of 320–400 K measured at 1 T are plotted in Fig. 9. The LS-to-HS transition occurs around T1/2↓ = 384 K (360 K) upon heating while the reverse (HS-to-LS) transition occurs around T1/2↑ = 351 K (338 K) upon cooling for the best-crystalline sample (the powder sample), where T1/2 is the temperature at which 50% of molecules are in the LS state and 50% of molecules are in the HS state. Note that T1/2↑ is higher upon the first heating due to remanent solvent or moisture,33,34 as shown in the right panel of Fig. 9, so the third sweeps are compared in the left panel.Both transition temperatures are higher for the best-crystalline sample. The corresponding width of the hysteresis loop is ΔT1/2 = 33 K for the best-crystalline sample that is reduced to ΔT1/2 = 22 K for the powder sample. The remanent magnetisation in the LS state, which can be attributed to high spin Fe(II) impurities, is about 15% of the maximum magnetization in the HS state for the best-crystalline sample and 22% for the powder sample. The fraction increases as the size of the nanoparticle decreases.
T 1/2↓ for [Fe(Htrz)2(trz)](BF4) synthesized under different conditions reported previously is in the range of 335–365 K, whereas T1/2↑ is in the range of 360–395 K.19,22,33–43 According to the previous studies on nanoparticles of different sizes.34,35,40,41T1/2↑ is reduced as the volume of particles becomes smaller whereas T1/2↓ is less affected. Consequently, the hysteresis width is reduced for small particles. The transition temperatures of our powdery sample are even lower than those reported for [Fe(Htrz)2(trz)](BF4). It is more comparable to those reported for [Fe(Htrz)3](BF4)2(H2O).33
To the best of our knowledge, our 40 μm-long crystals are of the largest size ever synthesized. Hence, the transition temperatures obtained in the present study, i.e., T1/2↑ = 338 K, T1/2↓ = 360 K and ΔT1/2 = 22 K, should serve as state-of-the-art bulk references.
Fig. 10 (right) shows the electric charge accumulated in or released from the [Fe(Htrz)2(trz)](BF4) thin film upon alternating the bias voltage between 0 and 1.2 V at ten second interval for the first five cycles (the red curves labelled as 1st to 5th) and the last five cycles (the blue curves labelled as 96th to 100th). Charging and discharging occurs by alternating the bias voltage between 1.2 V and 0 V at ten second interval. The maximum charge accumulated is reduced only by ∼8% after 100 cycles, demonstrating an excellent durability of the thin film against the oxidation–reduction reaction. Raman spectroscopy upon electrochemical doping, or spectroelectrochemistry, was also performed, but no change was observed in the Raman modes (for more details, see Fig. S2, ESI†).
2.6 Electrical conductance
Our crystals synthesised at C = 0.3 M and T = 55 °C are of 40 μm long, which is large enough to bridge a bulky electrode gap of 30 μm (see the inset in Fig. 11) so that reliable electrical conductance measurements can be carried out. Fig. 11 shows the electrical conductance plotted in the logarithmic scale as a function of temperature. The plot exhibits two linear regions with a kink at about 0.0026 K−1 (∼384 K) at which the LS-to-HS transition takes place, but no discontinuity is observed upon the HS-to-LS transition at 0.00285 K−1 (∼351 K). This is in contrast to previously reported DC electrical conductance data for nano- and micro-particles of [Fe(Htrz)2(trz)](BF4),19,36–39,43,45 AC conductance46 and DC conductance of the related complexes,47 which exhibited thermal hystereses that coincide with respective spin thermal hysteresis. In ref. 37 and 38, sub-micrometer long rectanglar crystals were aligned on interdigitated electrodes by dielectrophoresis, which allowed reliable measurements of the intrinsic electrical conductance with minimized contributions of grain boundaries. Our samples are at least 5–6 times larger than those synthesised previously so that some of the crystals directly bridge a more bulky electrode gap of 30 μm. This minimises the effect of contact resistance between crystals that can be readily altered upon lattice expansion/contraction associated with spin transitions. Furthermore, if the electrical conduction is through the bulk, a much larger volume of conduction is expected in our case, which may impact on the electrical conduction mechanism.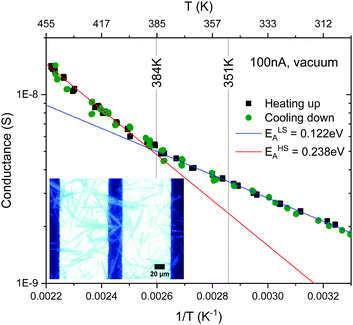 | ||
| Fig. 11 Arrhenius plot of conductivity of the [Fe(Htrz)2(trz)](BF4) crystalline sample plotted on a logarithmic scale as a function of temperature. | ||
Above and below the kink at about 0.0026 K−1 (∼384 K) the data can be fit to the Arrhenius equation. The activation energies estimated for the low and high temperature domains are ca. ELSA = 0.12 and EHSA = 0.24 eV, respectively. This increase by 100% in activation energy upon LS-to-HS transition is in line with the 50–70% increase reported previously on smaller crystals.19
2.7 Density functional theory
Finally, the electronic structure has been calculated based on density functional theory. Fig. 12 shows the electronic band structures of [Fe(Htrz)2(trz)](BF4) in the LS state (left) and the HS state (right), respectively, along the high symmetry path Γ–Y–T–R in the Brillouin zone. In the LS state, the top of the valence bands is located at the Γ point and the bottom of the conduction bands is at the T point. The HS state has a direct band gap at the T point. The direct Kohn Sham band gap of the LS (HS) state at the T point is 2.10 eV (2.12 eV). Taking the derivative discontinuity of the exchange–correlation energy at integer-electron numbers into account, the gap energy is 2.83 eV (2.88 eV) which is greater by more than one-order of magnitude than the estimated activation energies (ELSA = 0.12 and EHSA = 0.24 eV). The carrier injection barrier or defect levels seem to be responsible for the measured electrical conduction.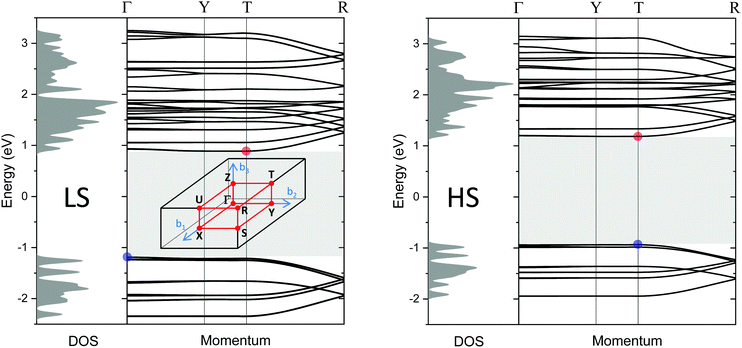 | ||
| Fig. 12 Density of states and band structures for the LS (left) and HS (right) state in the momentum directions along high symmetry path Γ–Y–T–R in the Brillouin zone, calculated by using the GLLB-SC functional.48,49 The blue (red) solid circles are the top (bottom) of the valence (conduction) band. The shaded area represents an Kohn Sham band gap of 2.10 eV (LS)/2.12 eV (HS). Inset in the left panel: The Brillouin zone of a simple orthorhombic lattice. | ||
Finally, the optical band gap observed in the LS state is in line with the theoretical electronic band gap, provided that the exciton binding energy should be taken into account for a quantitative comparison (see Fig. 7). The disappearance of the absorption peak at 2.3 eV upon the LS–HS transition leads to a larger optical band gap, that is qualitatively consistent with the theoretical gap opening.
3 Conclusion
The thorough systematic study on the synthesis of spin-crossover coordination polymer [Fe(Htrz)2(trz)](BF4) has revealed clear dependencies of the crystal size on the solvent type, precursor concentration and the reaction temperature. The well-crystalline needles can grow as long as 80 μm by introducing a temperature gradient. It has been shown that the spin transition temperature and thermal hysteresis increase monotonically as the crystal size extends.The in situ UV-vis and Raman spectroscopy measurements elucidate changes in the optical gap and vibrational modes accompanying the spin transition.
The electrochemical analysis suggests that this one-dimensional system is redox-active and stable over repeated oxidation and reduction processes. The electrical conduction across the crystals is thermally excited with activation energies of ca. 0.12 and 0.24 eV for the temperature range below and above 384 K, respectively. The absence of hysteresis in electrical conductance will shed light on the conduction mechanism in spin crossover systems.
The electronic band structure and the electronic gap of the [Fe(Htrz)2(trz)](BF4) in the LS and HS states have been calculated based on density functional theory. The calculated electronic band gap is 2.83 eV in the LS state and 2.88 eV in the HS state. The difference between the two states is rather small as compared with the change observed in the UV-vis spectrum. Further theoretical studies with more accurate approximations are required in order to obtain good agreement between theoretical and experimental results.
The methodology for the synthesis of large crystals demonstrated in the present work provides a foundation for material sciences centred around new and existing spin crossover materials and coordination polymers including metal–organic frameworks.
4 Methods
4.1 Synthesis
Iron(II) tetrafluoroborate hexahydrate, Fe(BF4)2·6H2O, purchased from Sigma-Aldrich and 1,2,4-triazole from Alfa Aesar were used as received. All solvents used were of laboratory reagent grade. The synthesis of the [Fe(Htrz)2(trz)](BF4) complex was performed in two different solvents i.e. deionised water and methanol. The molar ratio taken for the reagents was [Fe(BF4)2·6H2O]![[thin space (1/6-em)]](https://www.rsc.org/images/entities/char_2009.gif) :
:![[thin space (1/6-em)]](https://www.rsc.org/images/entities/char_2009.gif) [triazole] = 1
[triazole] = 1![[thin space (1/6-em)]](https://www.rsc.org/images/entities/char_2009.gif) :
:![[thin space (1/6-em)]](https://www.rsc.org/images/entities/char_2009.gif) 3. Typically, the synthesis in methanol was performed as follows. Fe(BF4)2·6H2O (0.2029 g, 0.3 M) in 2 ml of methanol was added to 1,2,4-triazole (0.1241 g, 0.9 M) in 2 ml of methanol at room temperature in a 15 ml centrifuge tube made of polypropylene. The resulting solution was maintained at room temperature for 18 hours. Then, the precipitate was separated and washed several times by decantation with fresh methanol. The same procedure was used for the synthesis in water with different precursor concentrations and temperatures. A small portion of the precipitate taken on a microscope glass slide was observed under an optical microscope. The rest was filtered off, dried and stored for further investigation. A temperature gradient was realized within a 15 ml centrifuge tube plugged in a block heater set at 45 °C. The surface of the solution in the tube was set 10 mm below the surface of the block heater. Extra-long crystals were formed right above the surface of the solution after 48 hours.
3. Typically, the synthesis in methanol was performed as follows. Fe(BF4)2·6H2O (0.2029 g, 0.3 M) in 2 ml of methanol was added to 1,2,4-triazole (0.1241 g, 0.9 M) in 2 ml of methanol at room temperature in a 15 ml centrifuge tube made of polypropylene. The resulting solution was maintained at room temperature for 18 hours. Then, the precipitate was separated and washed several times by decantation with fresh methanol. The same procedure was used for the synthesis in water with different precursor concentrations and temperatures. A small portion of the precipitate taken on a microscope glass slide was observed under an optical microscope. The rest was filtered off, dried and stored for further investigation. A temperature gradient was realized within a 15 ml centrifuge tube plugged in a block heater set at 45 °C. The surface of the solution in the tube was set 10 mm below the surface of the block heater. Extra-long crystals were formed right above the surface of the solution after 48 hours.
4.2 Powder X-ray diffraction
Powder X-ray diffraction measurements were carried out using a Bruker D8 Discover diffractometer with Co-Kα radiation. The crystalline sample was ground before measurements. Rietveld refinement was performed using the Full Prof Suite program.4.3 UV-vis spectroscopy
UV-vis absorption spectra were recorded on thin films of [Fe(Htrz)2(trz)](BF4) powder deposited on glass slides with a Bruker VERTEX 80v Fourier transform spectrometer.4.4 Raman spectroscopy
Raman spectroscopy measurements were carried out on a sample placed on a hot plate with a Horiba Jobin Yvon, LabRAM HR800 with an excitation wavelength of 514.5 nm.4.5 Magnetometry
Magnetisation measurements were carried out using a superconducting quantum interference device (SQUID) from Quantum Design. The sample after heating at 127 °C in air for 3.5 hours was placed in a gelatin capsule with the top section of the capsule being reversed to press the powder sample. The mass of the crystalline sample synthesised in water at C = 0.3 M and T = 60 °C was 15.8 mg, and that of the powder sample synthesised in methanol at C = 0.3 M and room temperature was 14.7 mg.4.6 Electrochemical analysis
In our setup, silver–silver chloride (Ag/AgCl) and platinum (Pt) wires were used as the reference electrode (RE) and counter electrode (CE), respectively. The powder sample that was prepared in methanol was used to make a fine layer on a FTO-coated glass as the working electrode (WE). The electrolyte used was 0.2 M acetonitrile solution of lithium perchlorate, LiClO4. Cyclic voltammetry and chronoamperometry were performed using a PGSTAT 204 with Nova 2.1 software by Metrohm autolab.4.7 Electrical conductance
Five pairs of 30 μm wide gap gold electrodes (channel width = 1 mm) were deposited on a glass plate (dimensions 25 × 18 mm × 1 mm) in a vacuum (∼1 × 10⁻⁶ mbar) by using a deposition mask (E321) purchased from Ossila. Crystals synthesised at C = 0.3 M and T = 55 °C diluted in methanol were drop cast onto the five gold electrodes. The voltage across the electrodes was measured using a Keithley 6514 system electrometer, with a constant current of 100 nA supplied by a Keithley 6221 DC and AC current source. The sample temperature was controlled by using a Lake Shore model 330 autotuning temperature controller.4.8 Density functional theory
Structure optimisations were carried out using a Quantum ESPRESSO, an open-source plane-wave periodic density functional theory code. Norm-conserving pseudoponentials with Perdew–Burke–Ernzerhof (PBE) exchange–correlation functional were used. Crystallographic information files, 900726 and 900727, were used to generate input files for LS and HS state calculations, respectively.16 Density functional theory calculations of the band structures were carried out by using the GPAW code which is based on the projector-augmented wave (PAW) method and the atomic simulation environment (ASE). LCAO mode with a Monkhorst–Pack grid of (4,4,4) was used and the GLLB-SC functional was chosen in order to take the derivative discontinuity of the exchange–correlation energy at integer electron numbers into account.48,49 The density of states (DOS) was multiplied by normalized gaussians of 0.05 eV width.Conflicts of interest
There are no conflicts to declare.Acknowledgements
The authors acknowledge support from the Austrian Science Fund (FWF) P30431-N36 and the Czech Science Foundation (GACR) project 19-15217S. This work was supported in part by the Austrian Federal Ministry of Education, Science and Research (BMBWF), OeAD-GmbH and the Ministry of Education, Youth and Sports (MEYS) of the Czech Republic, through Scientific & Technological Cooperation (WTZ) program, No. CZ 18/2019 and 8J19AT026. Magnetic measurements were performed in MGML (mgml.eu), which is supported within the program of Czech Research Infrastructures (project no. LM2018096).Notes and references
- L. S. L. Cambi, Ber. Dtsch. Chem. Ges. A, 1931, 64, 2591–2598 CrossRef.
- O. Kahn, J. Krober and C. Jay, Adv. Mater., 1992, 4, 718–728 CrossRef CAS.
- P. G. H. Goodwin, Spin Crossover in Transition Metal Compounds III, Springer, 2004 Search PubMed.
- S. Decurtins, P. Gutlich, C. Kohler, H. Spiering and A. Hauser, Chem. Phys. Lett., 1984, 105, 1–4 CrossRef CAS.
- S. Bonhommeau, G. Molnar, A. Galet, A. Zwick, J. Real, J. McGarvey and A. Bousseksou, Angew. Chem., Int. Ed., 2005, 44, 4069–4073 CrossRef CAS.
- M. A. Halcrow, Chem. Soc. Rev., 2008, 37, 278–289 RSC.
- G. Molnar, V. Niel, J.-A. Real, L. Dubrovinsky, A. Bousseksou and J. J. McGarvey, J. Phys. Chem. B, 2003, 107, 3149–3155 CrossRef CAS.
- B. Weber, W. Bauer and J. Obel, Angew. Chem., Int. Ed., 2008, 47, 10098–10101 CrossRef CAS.
- D.-Y. Wu, O. Sato, Y. Einaga and C.-Y. Duan, Angew. Chem., Int. Ed., 2009, 48, 1475–1478 CrossRef CAS.
- A. Verat, N. Ould-Moussa, E. Jeanneau, B. Le Guennic, A. Bousseksou, S. Borshch and G. Matouzenko, Chemistry, 2009, 15, 10070–10082 CrossRef CAS.
- M. Quesada, V. A. de la Pena-O’Shea, G. Aromi, S. Geremia, C. Massera, O. Roubeau, P. Gamez and J. Reedijk, Adv. Mater., 2007, 19, 1397–1402 CrossRef CAS.
- M. Quesada, H. Kooijman, P. Gamez, J. S. Costa, P. J. van Koningsbruggen, P. Weinberger, M. Reissner, A. L. Spek, J. G. Haasnoot and J. Reedijk, Dalton Trans., 2007, 5434–5440 RSC.
- S. M. Neville, G. J. Halder, K. W. Chapman, M. B. Duriska, P. D. Southon, J. D. Cashion, J.-F. Letard, B. Moubaraki, K. S. Murray and C. J. Kepert, J. Am. Chem. Soc., 2008, 130, 2869–2876 CrossRef CAS.
- M. Quesada, F. Prins, E. Bill, H. Kooijman, P. Gamez, O. Roubeau, A. L. Spek, J. G. Haasnoot and J. Reedijk, Chem. – Eur. J., 2008, 14, 8486–8499 CrossRef CAS.
- V. Martinez, A. Belen Gaspar, M. Carmen Munoz, R. Ballesteros, N. Ortega-Villar, V. M. Ugalde-Saldivar, R. Moreno-Esparza and J. Antonio-Real, Eur. J. Inorg. Chem., 2009, 303–310 CrossRef CAS.
- A. Grosjean, P. Négrier, P. Bordet, C. Etrillard, D. Mondieig, S. Pechev, E. Lebraud, J.-F. Létard and P. Guionneau, Eur. J. Inorg. Chem., 2013, 796–802 CrossRef CAS.
- A. Michalowicz, J. Moscovici, B. Ducourant, D. Cracco and O. Kahn, Chem. Mater., 1995, 7, 1833–1842 CrossRef CAS.
- A. Urakawa, W. Van Beek, M. Monrabal-Capilla, J. Ramon Galan-Mascaros, L. Palin and M. Milanesio, J. Phys. Chem. C, 2011, 115, 1323–1329 CrossRef CAS.
- A. Rotaru, G. Molnár, L. Salmon, P. Demont and A. Bousseksou, Chem. Commun., 2012, 48, 4163–4165 RSC.
- H. Peng, G. Molnar, L. Salmon and A. Bousseksou, Eur. J. Inorg. Chem., 2015, 3336–3342 CrossRef CAS.
- T. Zhao, L. Cuignet, M. M. Dirtu, M. Wolff, V. Spasojevic, I. Boldog, A. Rotaru, Y. Garcia and C. Janiak, J. Mater. Chem. C, 2015, 3, 7802–7812 RSC.
- L. Moulet, N. Daro, C. Etrillard, J.-F. Letard, A. Grosjean and P. Guionneau, Magnetochemsitry, 2016, 2, 1 CAS.
- A. Abrishamkar, S. Suárez-García, S. Sevim, A. Sorrenti, R. Pons, S.-X. Liu, S. Decurtins, G. Aromí, D. Aguilà, S. Pané, A. J. deMello, A. Rotaru, D. Ruiz-Molina and J. Puigmartí-Luis, Appl. Mater. Today, 2020, 20, 100632 CrossRef.
- E. Smit, B. Manoun and D. de Waal, J. Raman Spectrosc., 2001, 32, 339–344 CrossRef CAS.
- F. Billes, H. Endredi and G. Keresztury, THEOCHEM, 2000, 530, 183–200 CrossRef CAS.
- J. Tuchagues, A. Bousseksou, G. Molnar, J. McGarvey and F. Varret, in Spin Crossover in Transition Metal Compounds III, ed. P. Gutlich and H. A. Goodwin, Topics in Current Chemistry-Series, Springer-Verlag Berlin, Heidelberger Platz 3, D-14197 Berlin, Germany, 2004, vol. 235, pp. 85–103 Search PubMed.
- N. O. Moussa, D. Ostrovskii, V. Martinez Garcia, G. Molnar, K. Tanaka, A. B. Gaspar, J. Antonio Real and A. Bousseksou, Chem. Phys. Lett., 2009, 477, 156–159 CrossRef.
- D. Mader, S. Pillet, C. Carteret, M.-J. Stebe and J.-L. Blin, J. Dispersion Sci. Technol., 2011, 32, 1771–1779 CrossRef CAS.
- C. Faulmann, J. Chahine, I. Malfant, D. de Caro, B. Cormary and L. Valade, Dalton Trans., 2011, 40, 2480–2485 RSC.
- Y. A. Tobon, C. Etrillard, O. Nguyen, J.-F. Létard, V. Faramarzi, J.-F. Dayen, B. Doudin, D. M. Bassani and F. Guillaume, Eur. J. Inorg. Chem., 2012, 5837–5842 CrossRef CAS.
- G. Galle, C. Etrillard, J. Degert, F. Guillaume, J. F. Letard and E. Freysz, Appl. Phys. Lett., 2013, 102, 063302 CrossRef.
- F. Guillaume, Y. A. Tobon, S. Bonhommeau, J.-F. Letard, L. Moulet and E. Freysz, Chem. Phys. Lett., 2014, 604, 105–109 CrossRef CAS.
- J. Krober, J. Audiere, R. Claude, E. Codjovi, O. Kahn, J. Haasnoot, F. Groliere, C. Jay, A. Bousseksou, J. Limares, F. Varret and A. Gonthiervassal, Chem. Mater., 1994, 6, 1404–1412 CrossRef.
- J. Ramon Galan-Mascaros, E. Coronado, A. Forment-Aliaga, M. Monrabal-Capilla, E. Pinilla-Cienfuegos and M. Ceolin, Inorg. Chem., 2010, 49, 5706–5714 CrossRef.
- E. Coronado, J. R. Galan-Mascaros, M. Monrabal-Capilla, J. Garcia-Martinez and P. Pardo-Ibanez, Adv. Mater., 2007, 19, 1359–1361 CrossRef CAS.
- C. Etrillard, V. Faramarzi, J.-F. Dayen, J.-F. Letard and B. Doudin, Chem. Commun., 2011, 47, 9663–9665 RSC.
- A. Rotaru, J. Dugay, R. P. Tan, I. A. Guralskiy, L. Salmon, P. Demont, J. Carrey, G. Molnár, M. Respaud and A. Bousseksou, Adv. Mater., 2013, 25, 1745–1749 CrossRef CAS.
- J. Dugay, M. Giménez-Marqués, T. Kozlova, H. W. Zandbergen, E. Coronado and H. S. van der Zant, Adv. Mater., 2015, 27, 1288–1293 CrossRef CAS.
- C. Lefter, R. Tan, J. Dugay, S. Tricard, G. Molnár, L. Salmon, J. Carrey, A. Rotaru and A. Bousseksou, Phys. Chem. Chem. Phys., 2015, 17, 5151–5154 RSC.
- J. Manuel Herrera, S. Titos-Padilla, S. J. A. Pope, I. Berlanga, F. Zamora, J. Jose Delgado, K. V. Kamenev, X. Wang, A. Prescimone, E. K. Brechin and E. Colacio, J. Mater. Chem. C, 2015, 3, 7819–7829 RSC.
- M. Giménez-Marqués, M. L. García-Sanz de Larrea and E. Coronado, J. Mater. Chem. C, 2015, 3, 7946–7953 RSC.
- C. Bartual-Murgui, E. Natividad and O. Roubeau, J. Mater. Chem. C, 2015, 3, 7916–7924 RSC.
- C. Lefter, R. Tan, S. Tricard, J. Dugay, G. Molnár, L. Salmon, J. Carrey, A. Rotaru and A. Bousseksou, Polyhedron, 2015, 102, 434–440 CrossRef CAS.
- S. Lokesh, A. Satpati and B. Sherigara, Open Electrochem. J., 2010, 2, 15–21 CrossRef CAS.
- F. Prins, M. Monrabal-Capilla, E. A. Osorio, E. Coronado and H. S. van der Zant, Adv. Mater., 2011, 23, 1545–1549 CrossRef CAS.
- C. Lefter, I. A. Gural'skiy, H. Peng, G. Molnár, L. Salmon, A. Rotaru, A. Bousseksou and P. Demont, Phys. Status Solidi RRL, 2014, 8, 191–193 CrossRef CAS.
- C. Lefter, V. Davesne, L. Salmon, G. Molnár, P. Demont, A. Rotaru and A. Bousseksou, Magnetochemistry, 2016, 2, 18 CrossRef.
- O. Gritsenko, R. van Leeuwen, E. van Lenthe and E. J. Baerends, Phys. Rev. A: At., Mol., Opt. Phys., 1995, 51, 1944–1954 CrossRef CAS.
- M. Kuisma, J. Ojanen, J. Enkovaara and T. T. Rantala, Phys. Rev. B: Condens. Matter Mater. Phys., 2010, 82, 115106 CrossRef.
Footnote |
| † Electronic supplementary information (ESI) available. See DOI: 10.1039/d0tc03878d |
| This journal is © The Royal Society of Chemistry 2021 |

